
📺 Watch the Full Video Analysis
This article was automatically generated by the NFC Market Live AI analysis system. (Updated: 2026-07-24 23:14 JST)
📄 Primary Source
U.S. Census Bureau
https://www.census.gov/construction/nrs/pdf/newressales.pdf
📊 Deep dive into June’s US New Residential Sales report.
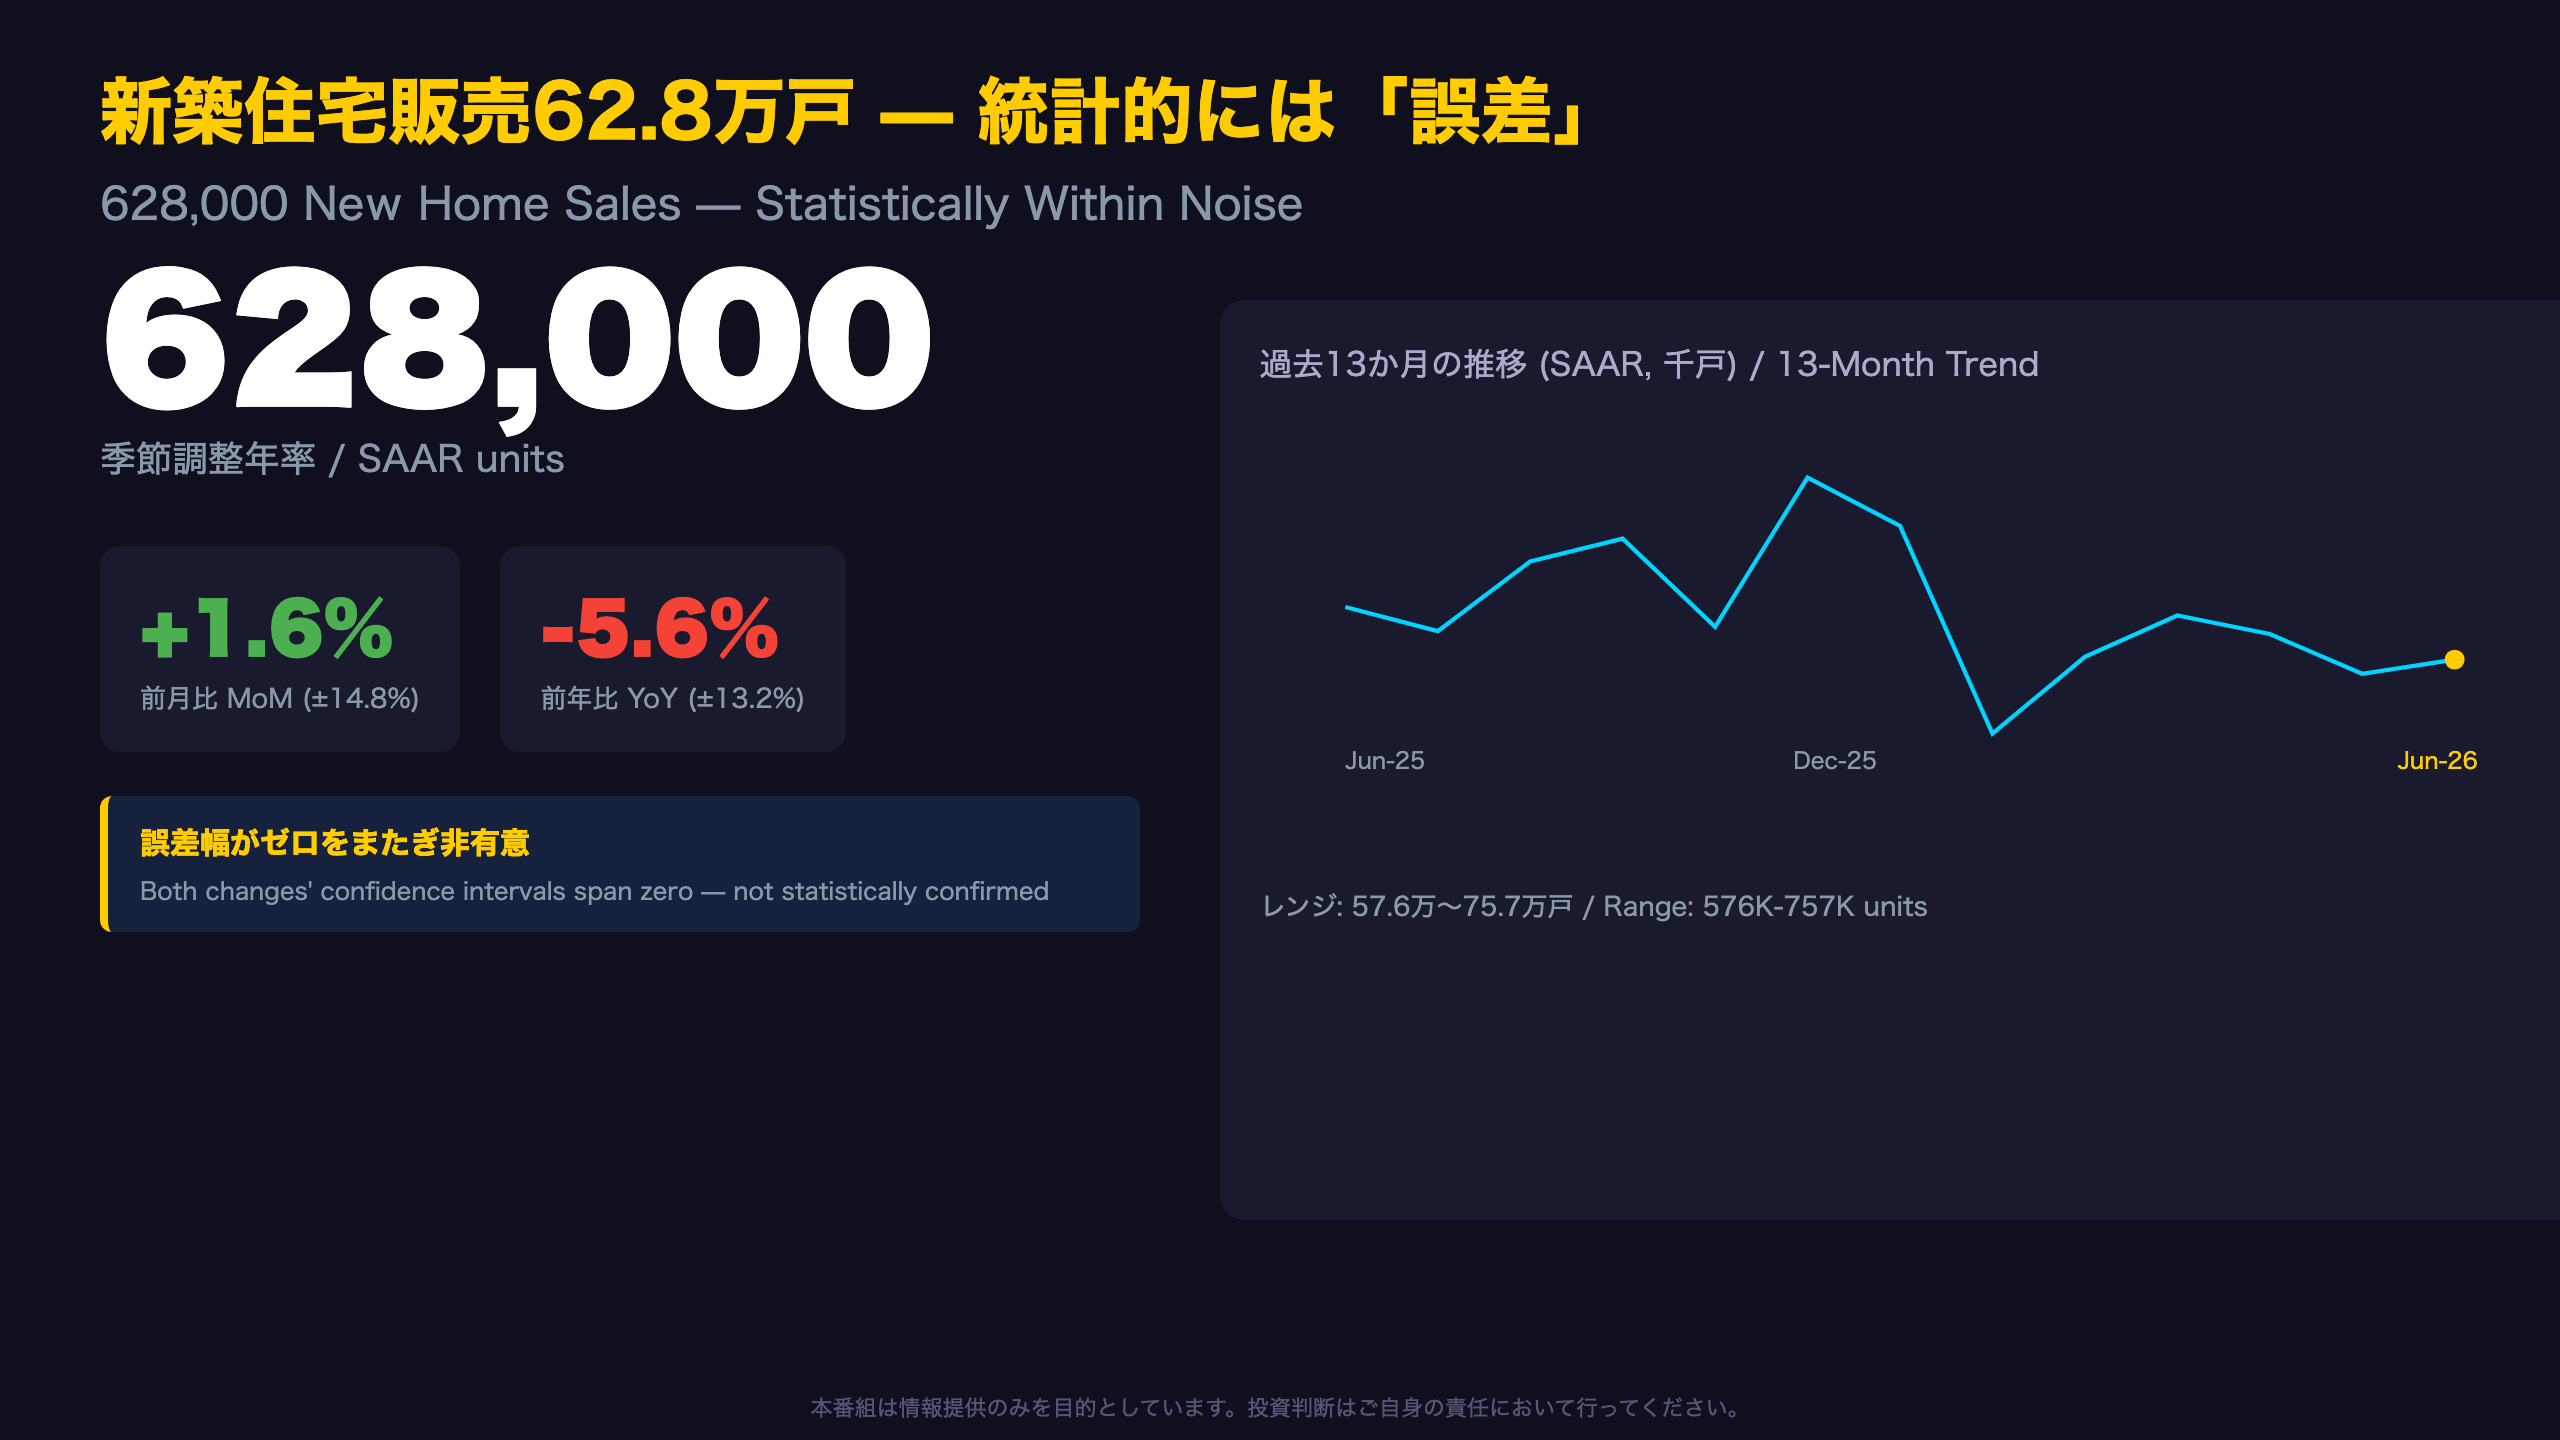
Headline: 628,000 SAAR, +1.6% MoM — but the ±14.8% margin of error means this isn’t statistically confirmed.
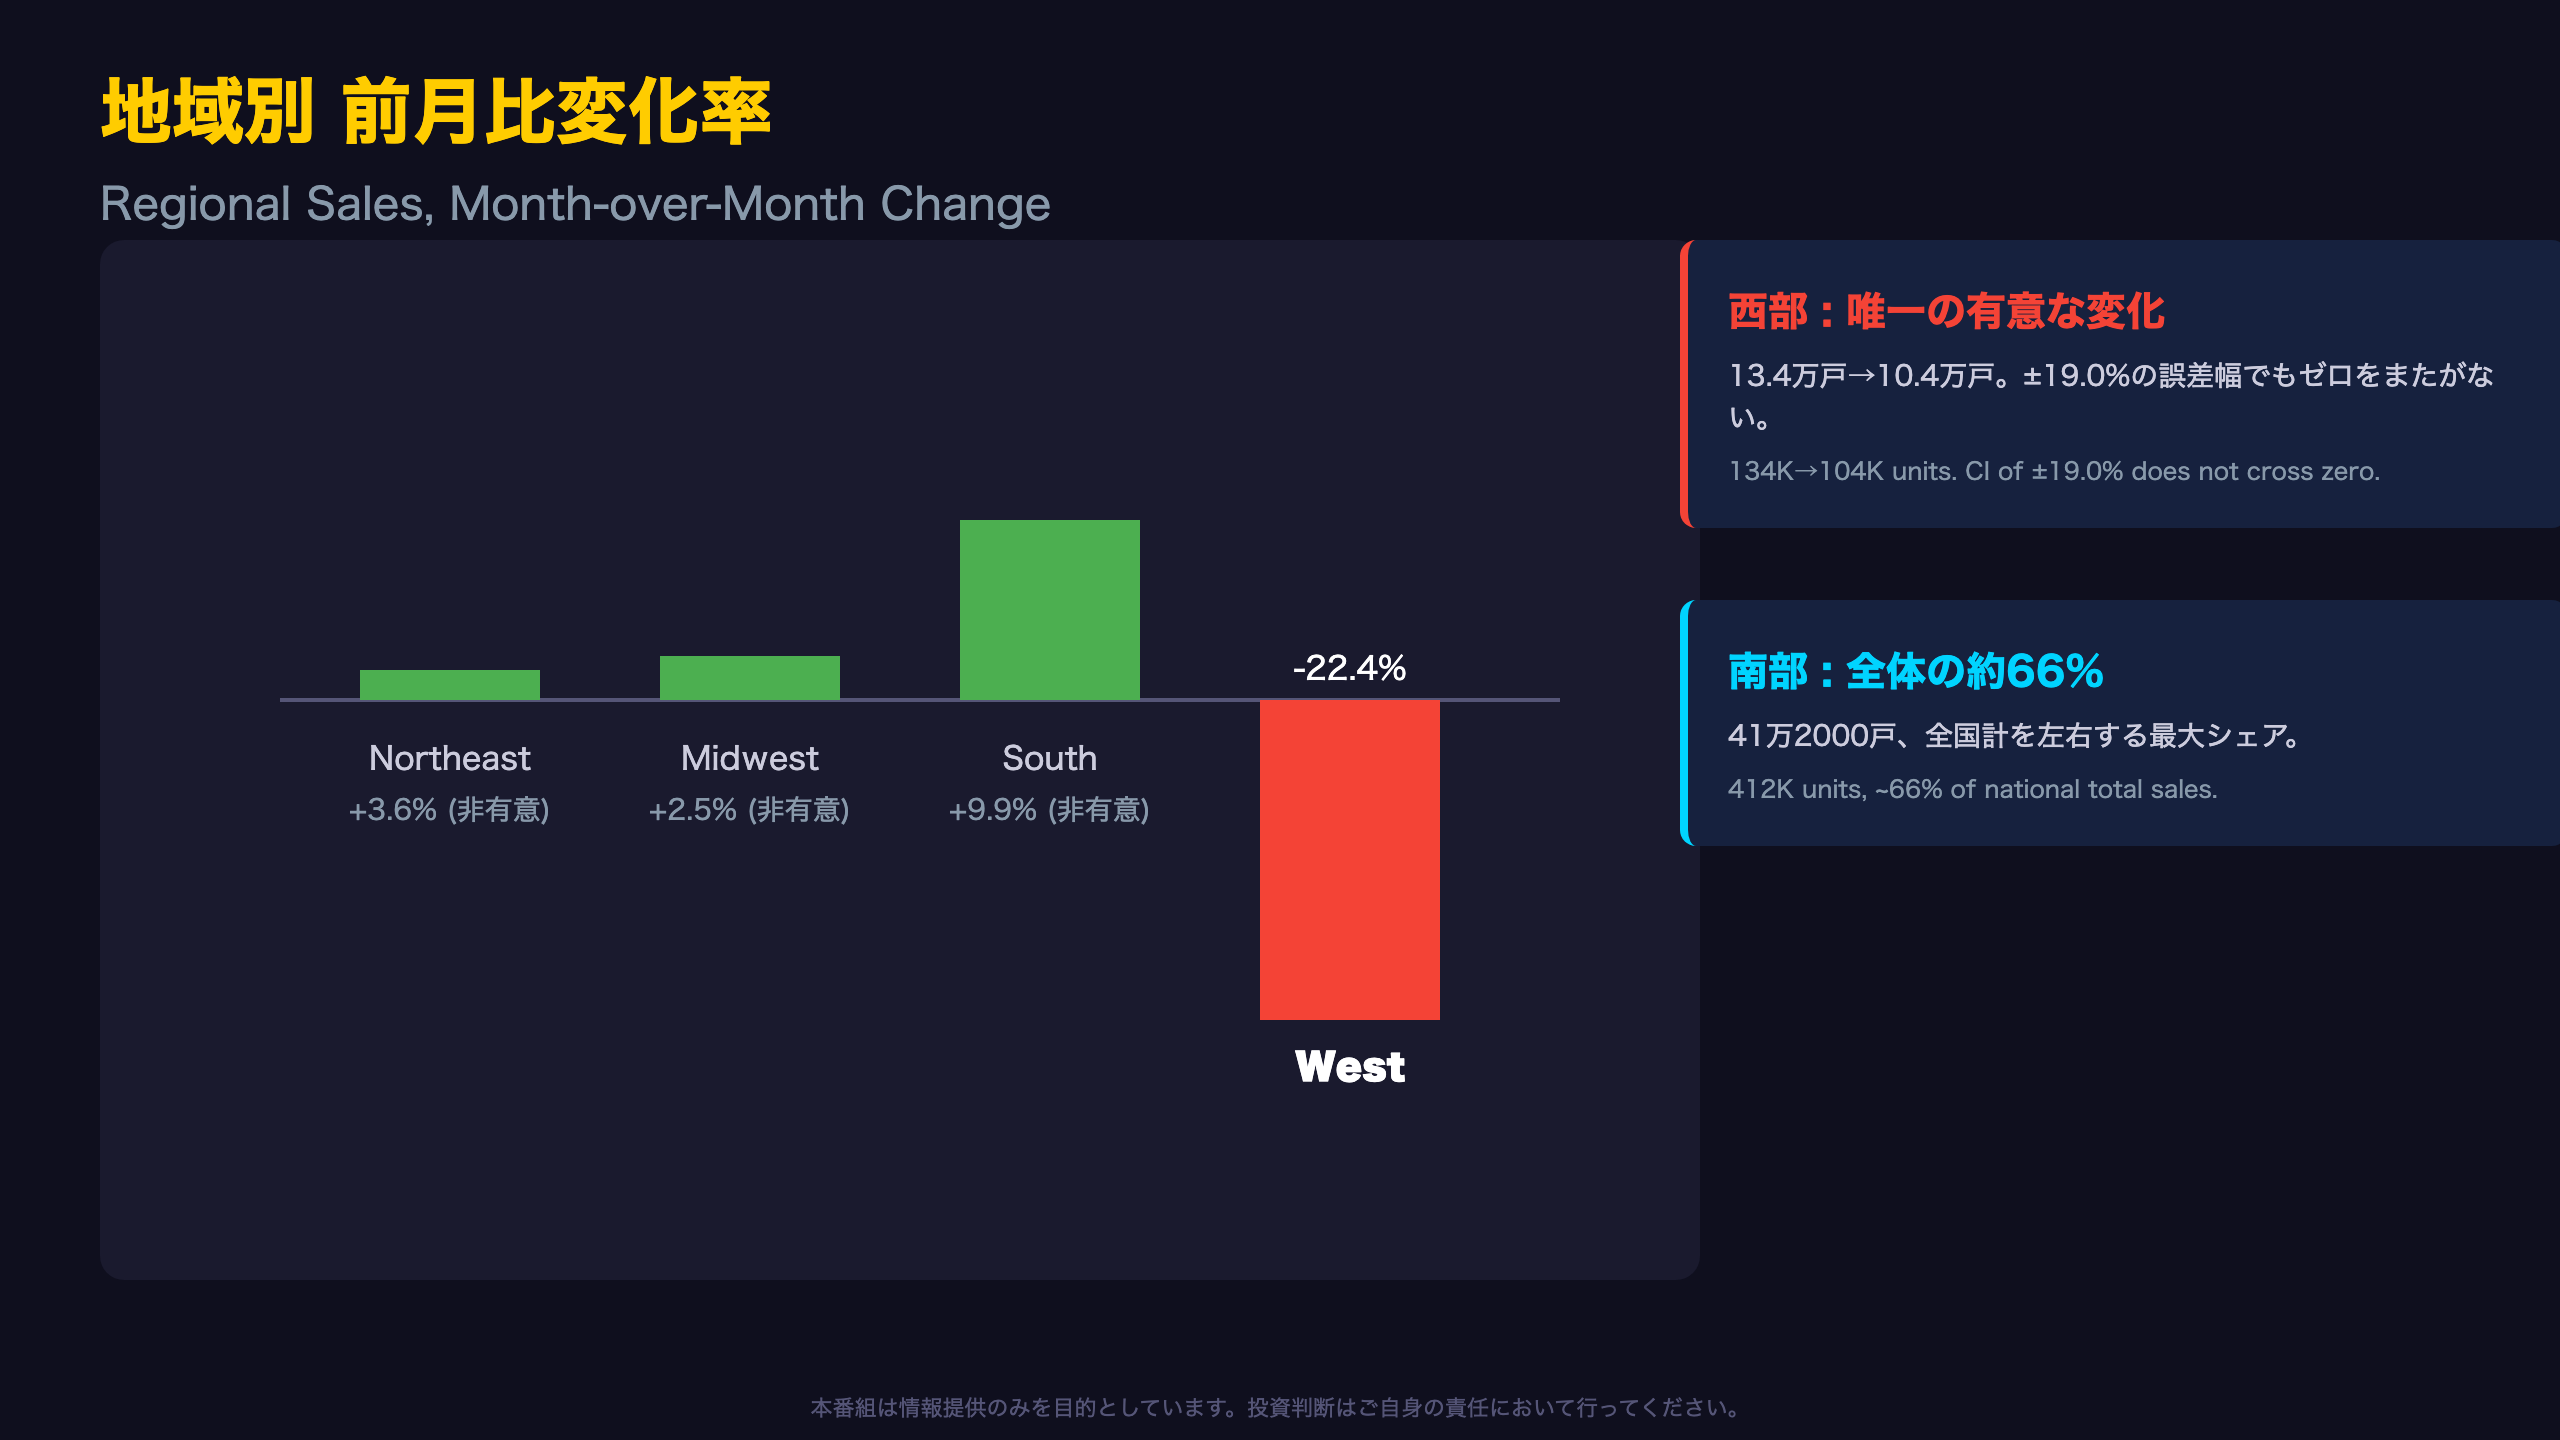
📉 The West region fell 22.4% MoM, the only regionally confirmed statistically significant move this month.
💰 Average price dropped 9.5% while median barely moved — likely a composition shift, not broad deflation.
🏗️ Inventory held near 9.3 months’ supply; under-construction sales rose.
💡 We unpack the structural signals hiding beneath a noisy headline number.
62.8万戸は「回復」か「誤差」か
Context: What This Report Measures
The Census Bureau and HUD jointly publish New Residential Sales monthly, covering only newly built single-family homes—a much smaller market (~628,000 SAAR) than existing home sales (~4 million SAAR, tracked separately by the National Association of Realtors). Because the new-home sample is smaller, margins of error are wide, a feature international investors often overlook.
June’s headline of 628,000 units sits mid-to-low within the past year’s range of 576,000 to 757,000. The Census Bureau explicitly flags both the +1.6% MoM and -5.6% YoY moves as statistically insignificant (confidence intervals of ±14.8% and ±13.2% respectively span zero).
Bull case: Three straight months near 620,000-660,000 suggests stabilization after 2025’s volatility.
Bear case: This is still within the broader downtrend from November 2025’s peak of 757,000.
New home sales are among the most rate-sensitive indicators FOMC staff track, given builders’ direct exposure to mortgage-driven affordability. Next release: August 25, 2026.
『速報値』が持つ統計的不確実性
Why Wide Confidence Intervals Matter
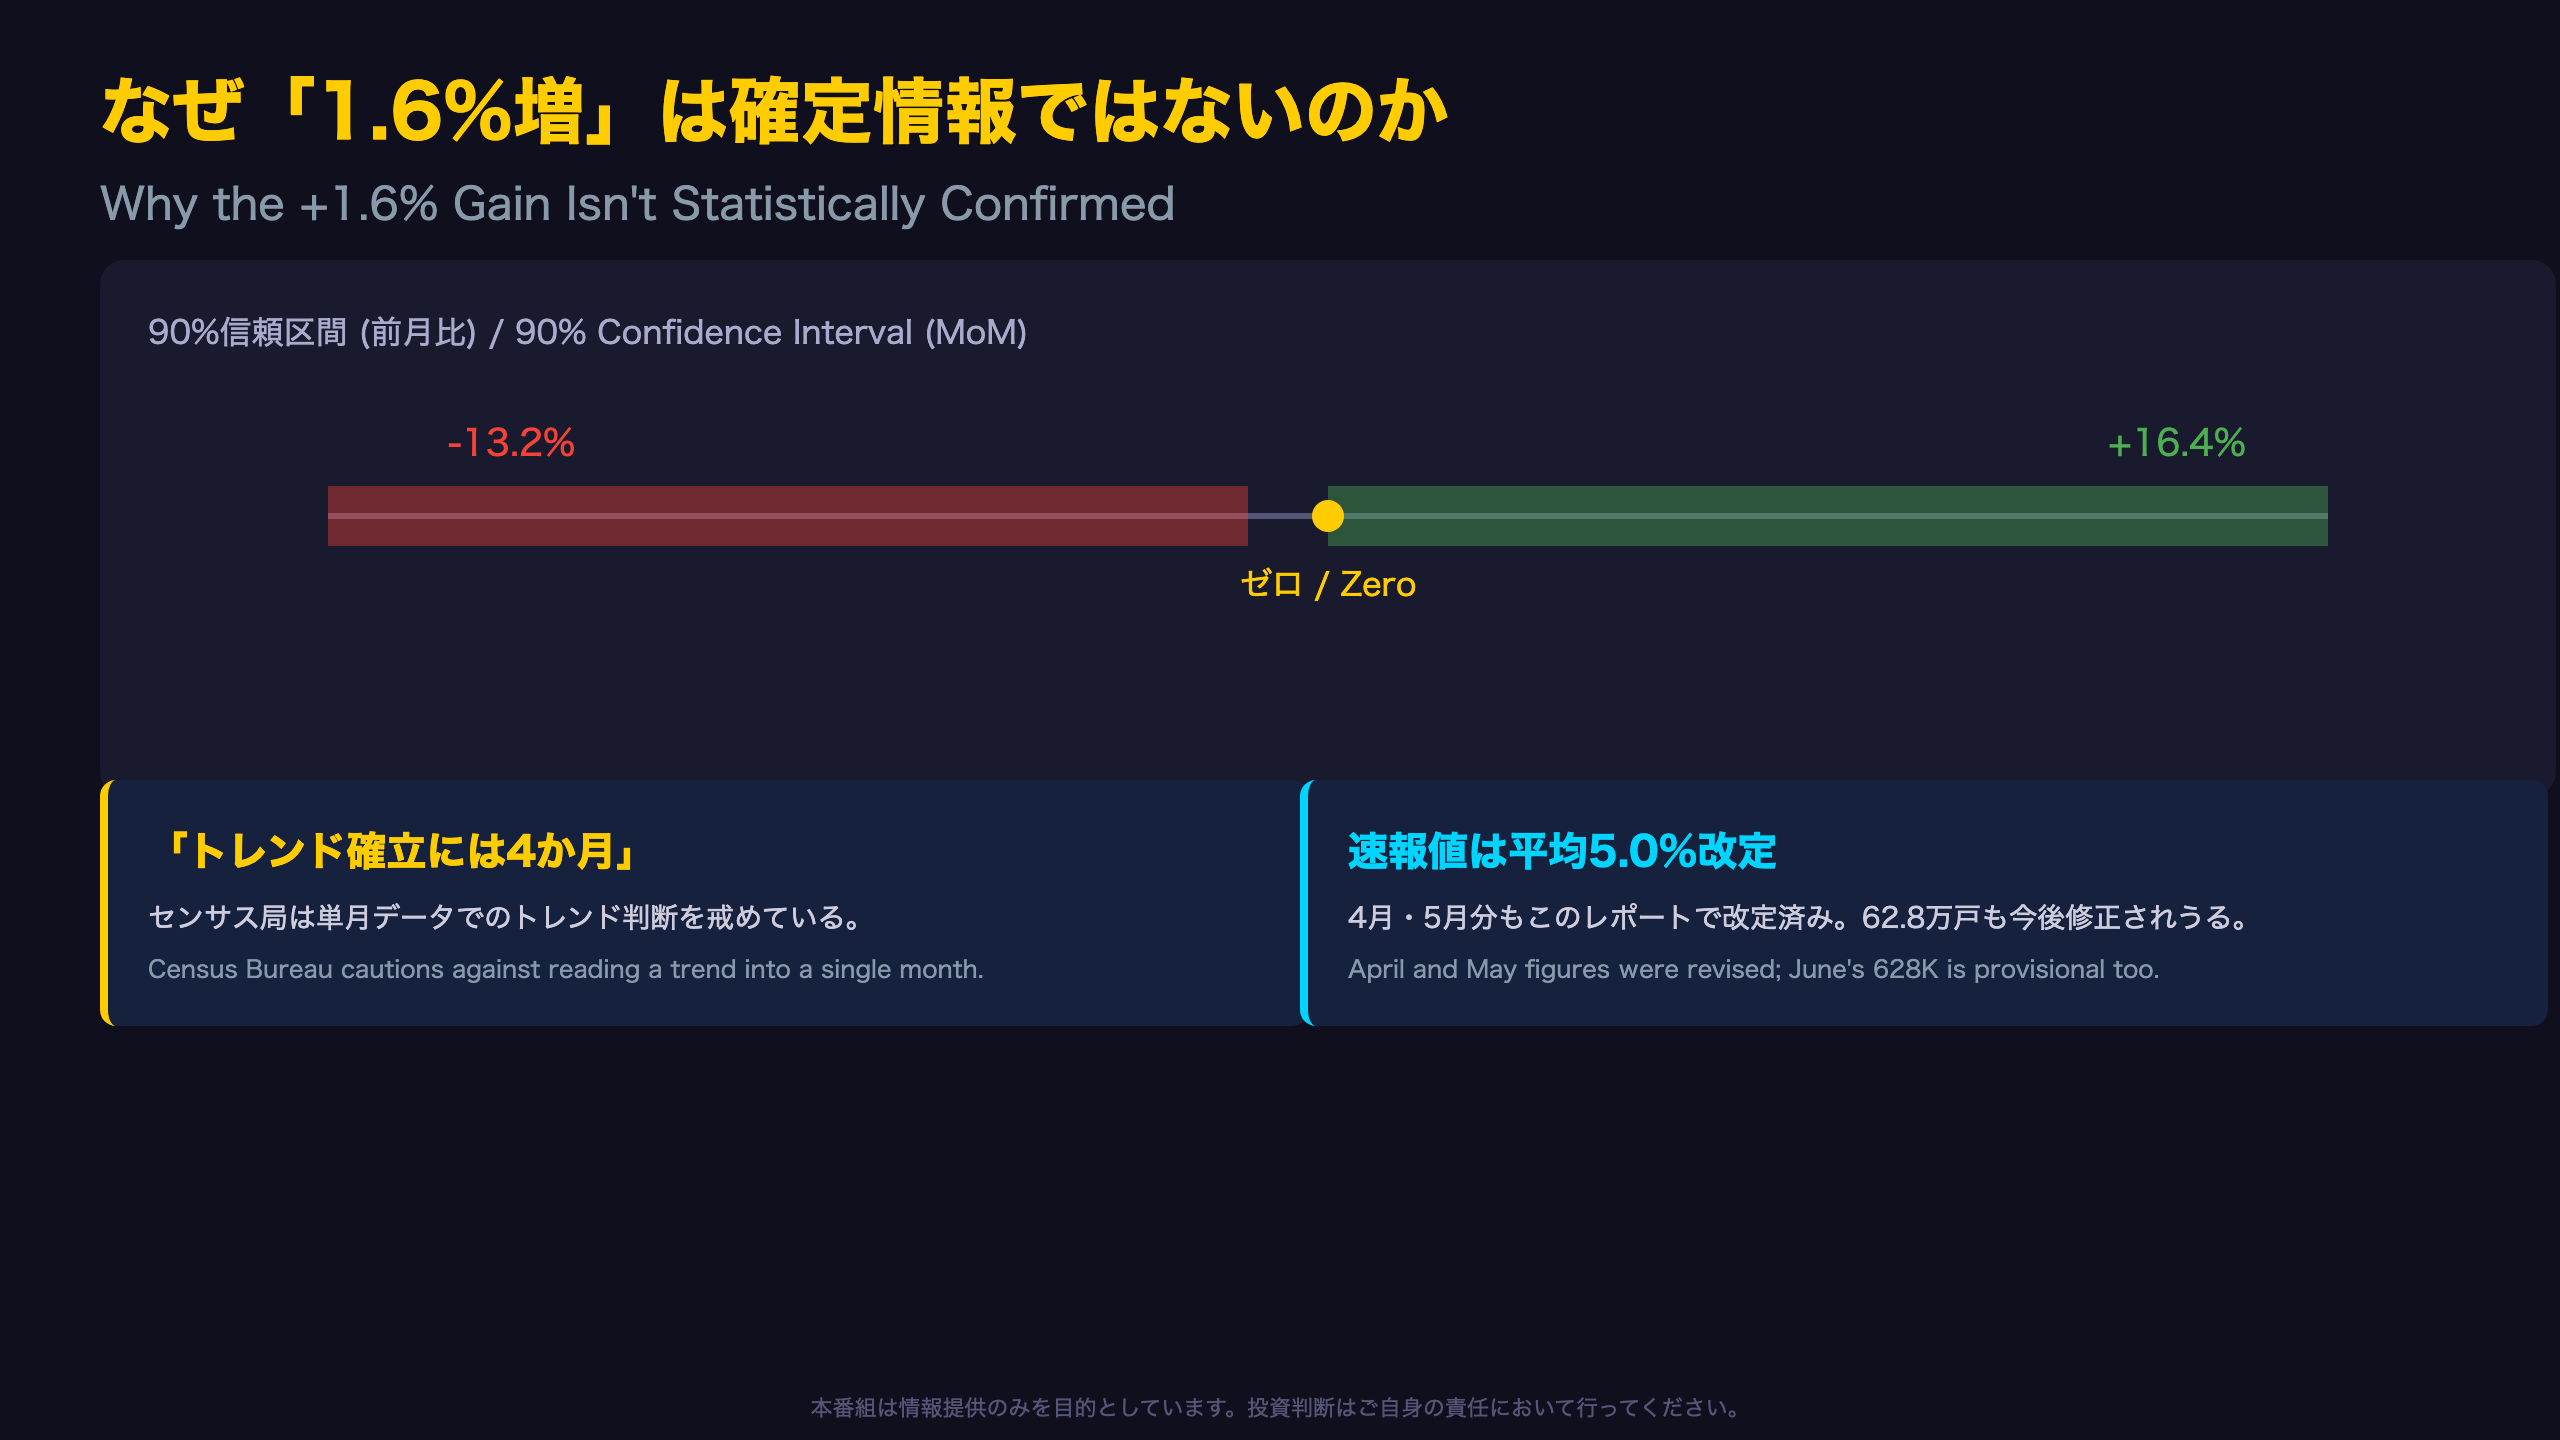
Unlike many economic releases, New Residential Sales is a sample survey drawn from building permits, not a census of all transactions. The Census Bureau states preliminary estimates are revised by an average of 5.0%, and explicitly recommends four months of data to establish a trend.
This contrasts with data series like the ISM Manufacturing Index, where single-month moves are often treated as meaningful. For new home sales, the ±14.8% interval around June’s 1.6% MoM gain means the ‘true’ change could range from -13.2% to +16.4%, wide enough to include both a modest decline and a solid rebound.
International comparison: this uncertainty band is notably wider than UK ONS retail sales or Eurozone industrial production releases, which typically carry single-digit confidence intervals. U.S. new home sales data requires extra caution before drawing directional conclusions.
Investors pricing in a housing-recovery narrative from one print should note this structural noise, the same caution central banks apply when reading a single CPI print.
地域格差 — 西部の急減が唯一の『確かな変化』
Regional Divergence: The Real Story Beneath the Headline
The national SAAR figure masks a sharp regional split. West region sales fell to 104,000 SAAR from 134,000, a statistically significant 22.4% MoM drop (confidence interval ±19.0% does not cross zero). This is the only regional or national change in this release confirmed as genuine rather than noise.
Meanwhile, the South, which accounts for roughly two-thirds of total new home sales at 412,000 units, rose 9.9% MoM, though this move falls within its ±21.2% margin of error and is not statistically confirmed.
The Northeast posted a striking +16.0% YoY gain, but with a margin of error of ±87.1%, this figure is essentially unreliable given the region’s small sample size, a common pitfall when U.S. regional housing data gets cited without context.
Takeaway: the West’s high-cost, rate-sensitive markets appear to be absorbing more housing-affordability stress than the South, where lower price points continue to support volume.
平均価格-9.5%の正体 — 構成シフトか、価格下落か
Average vs. Median Price: A Composition Story
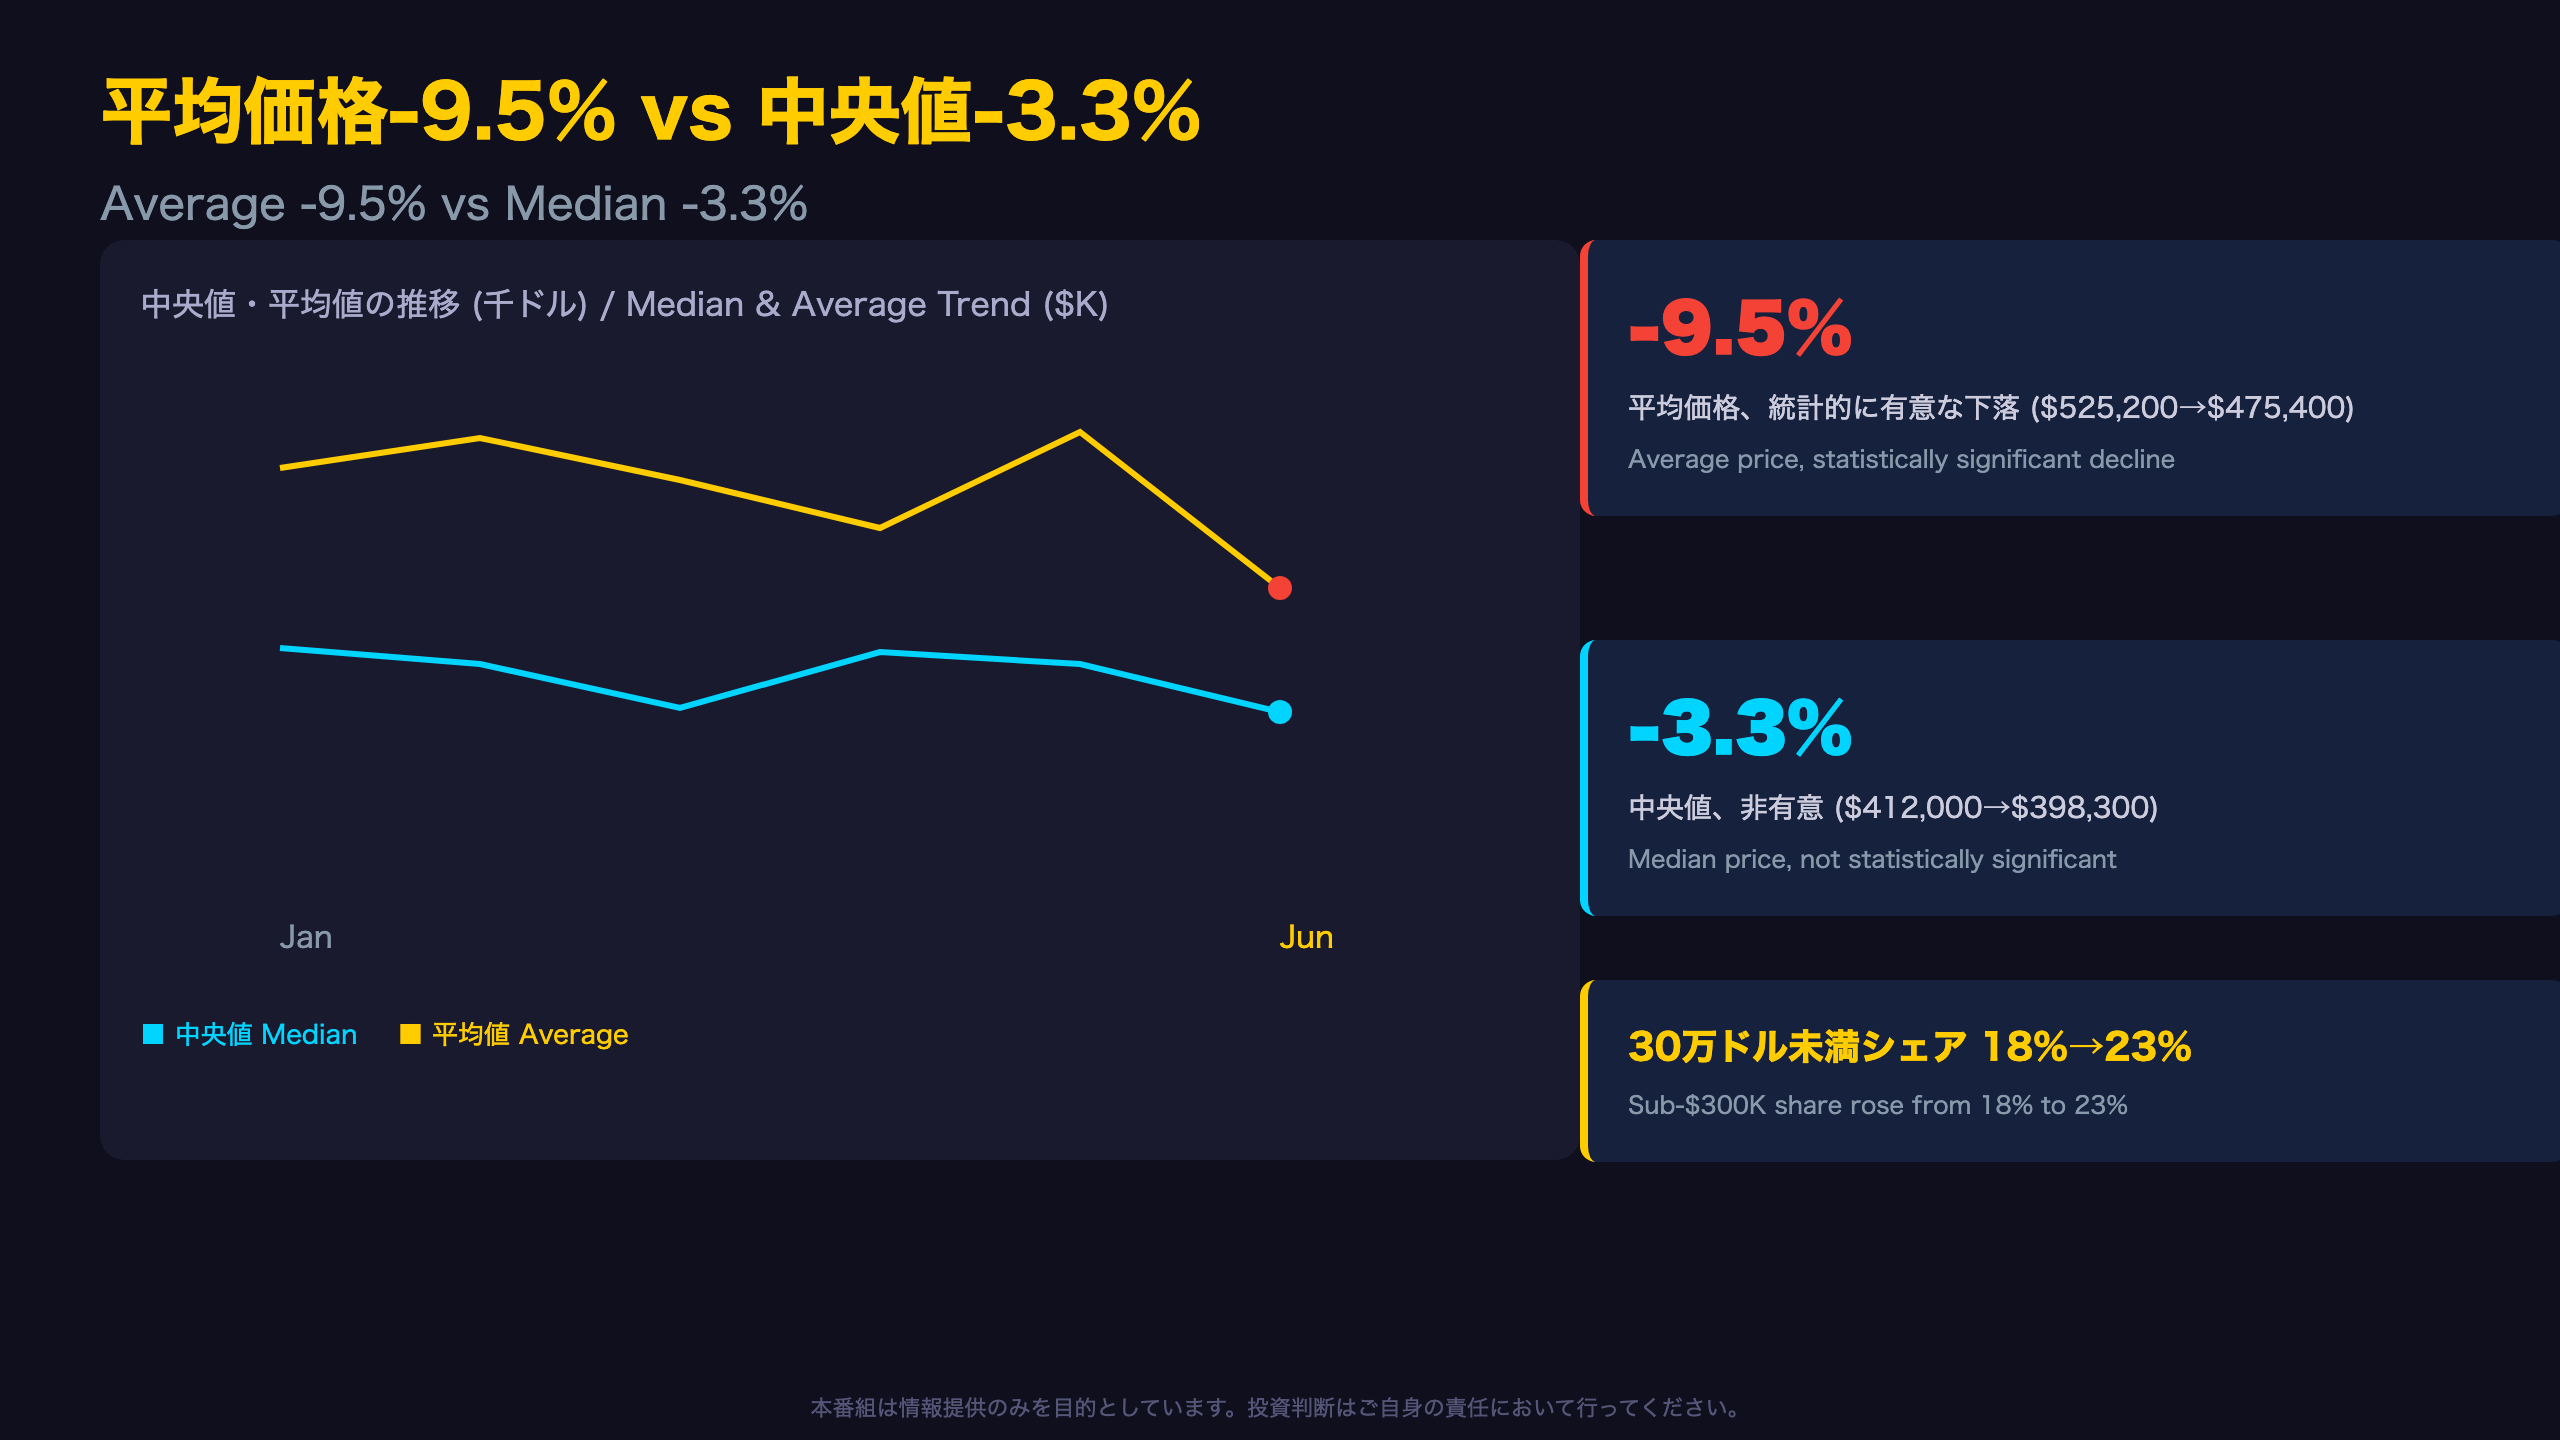
June’s median new home price fell 3.3% MoM to $398,300, not statistically significant (±8.8% CI). But the average price plunged 9.5% MoM to $475,400, a change the Census Bureau does NOT flag with an asterisk, meaning it IS statistically significant.
Why the divergence? Census Table 2b shows the share of homes sold under $300,000 jumped from 18% in May to 23% in June, while higher tiers held roughly steady. Combined with the West region’s collapse (historically a higher-priced market), this points toward a compositional shift rather than genuine price deflation across comparable homes.
For readers unfamiliar with US housing data: unlike repeat-sales indices (Case-Shiller, FHFA HPI) which control for the same house over time, Census new-home price data reflects whatever mix of homes sold that month, so region and size shifts move the average even if list prices for comparable homes haven’t changed.
Market implication: builders appear to lean into entry-level product to defend volume amid affordability pressure from elevated mortgage rates, rather than broadly cutting prices.
在庫の『質』 — 建設段階別に見る需給
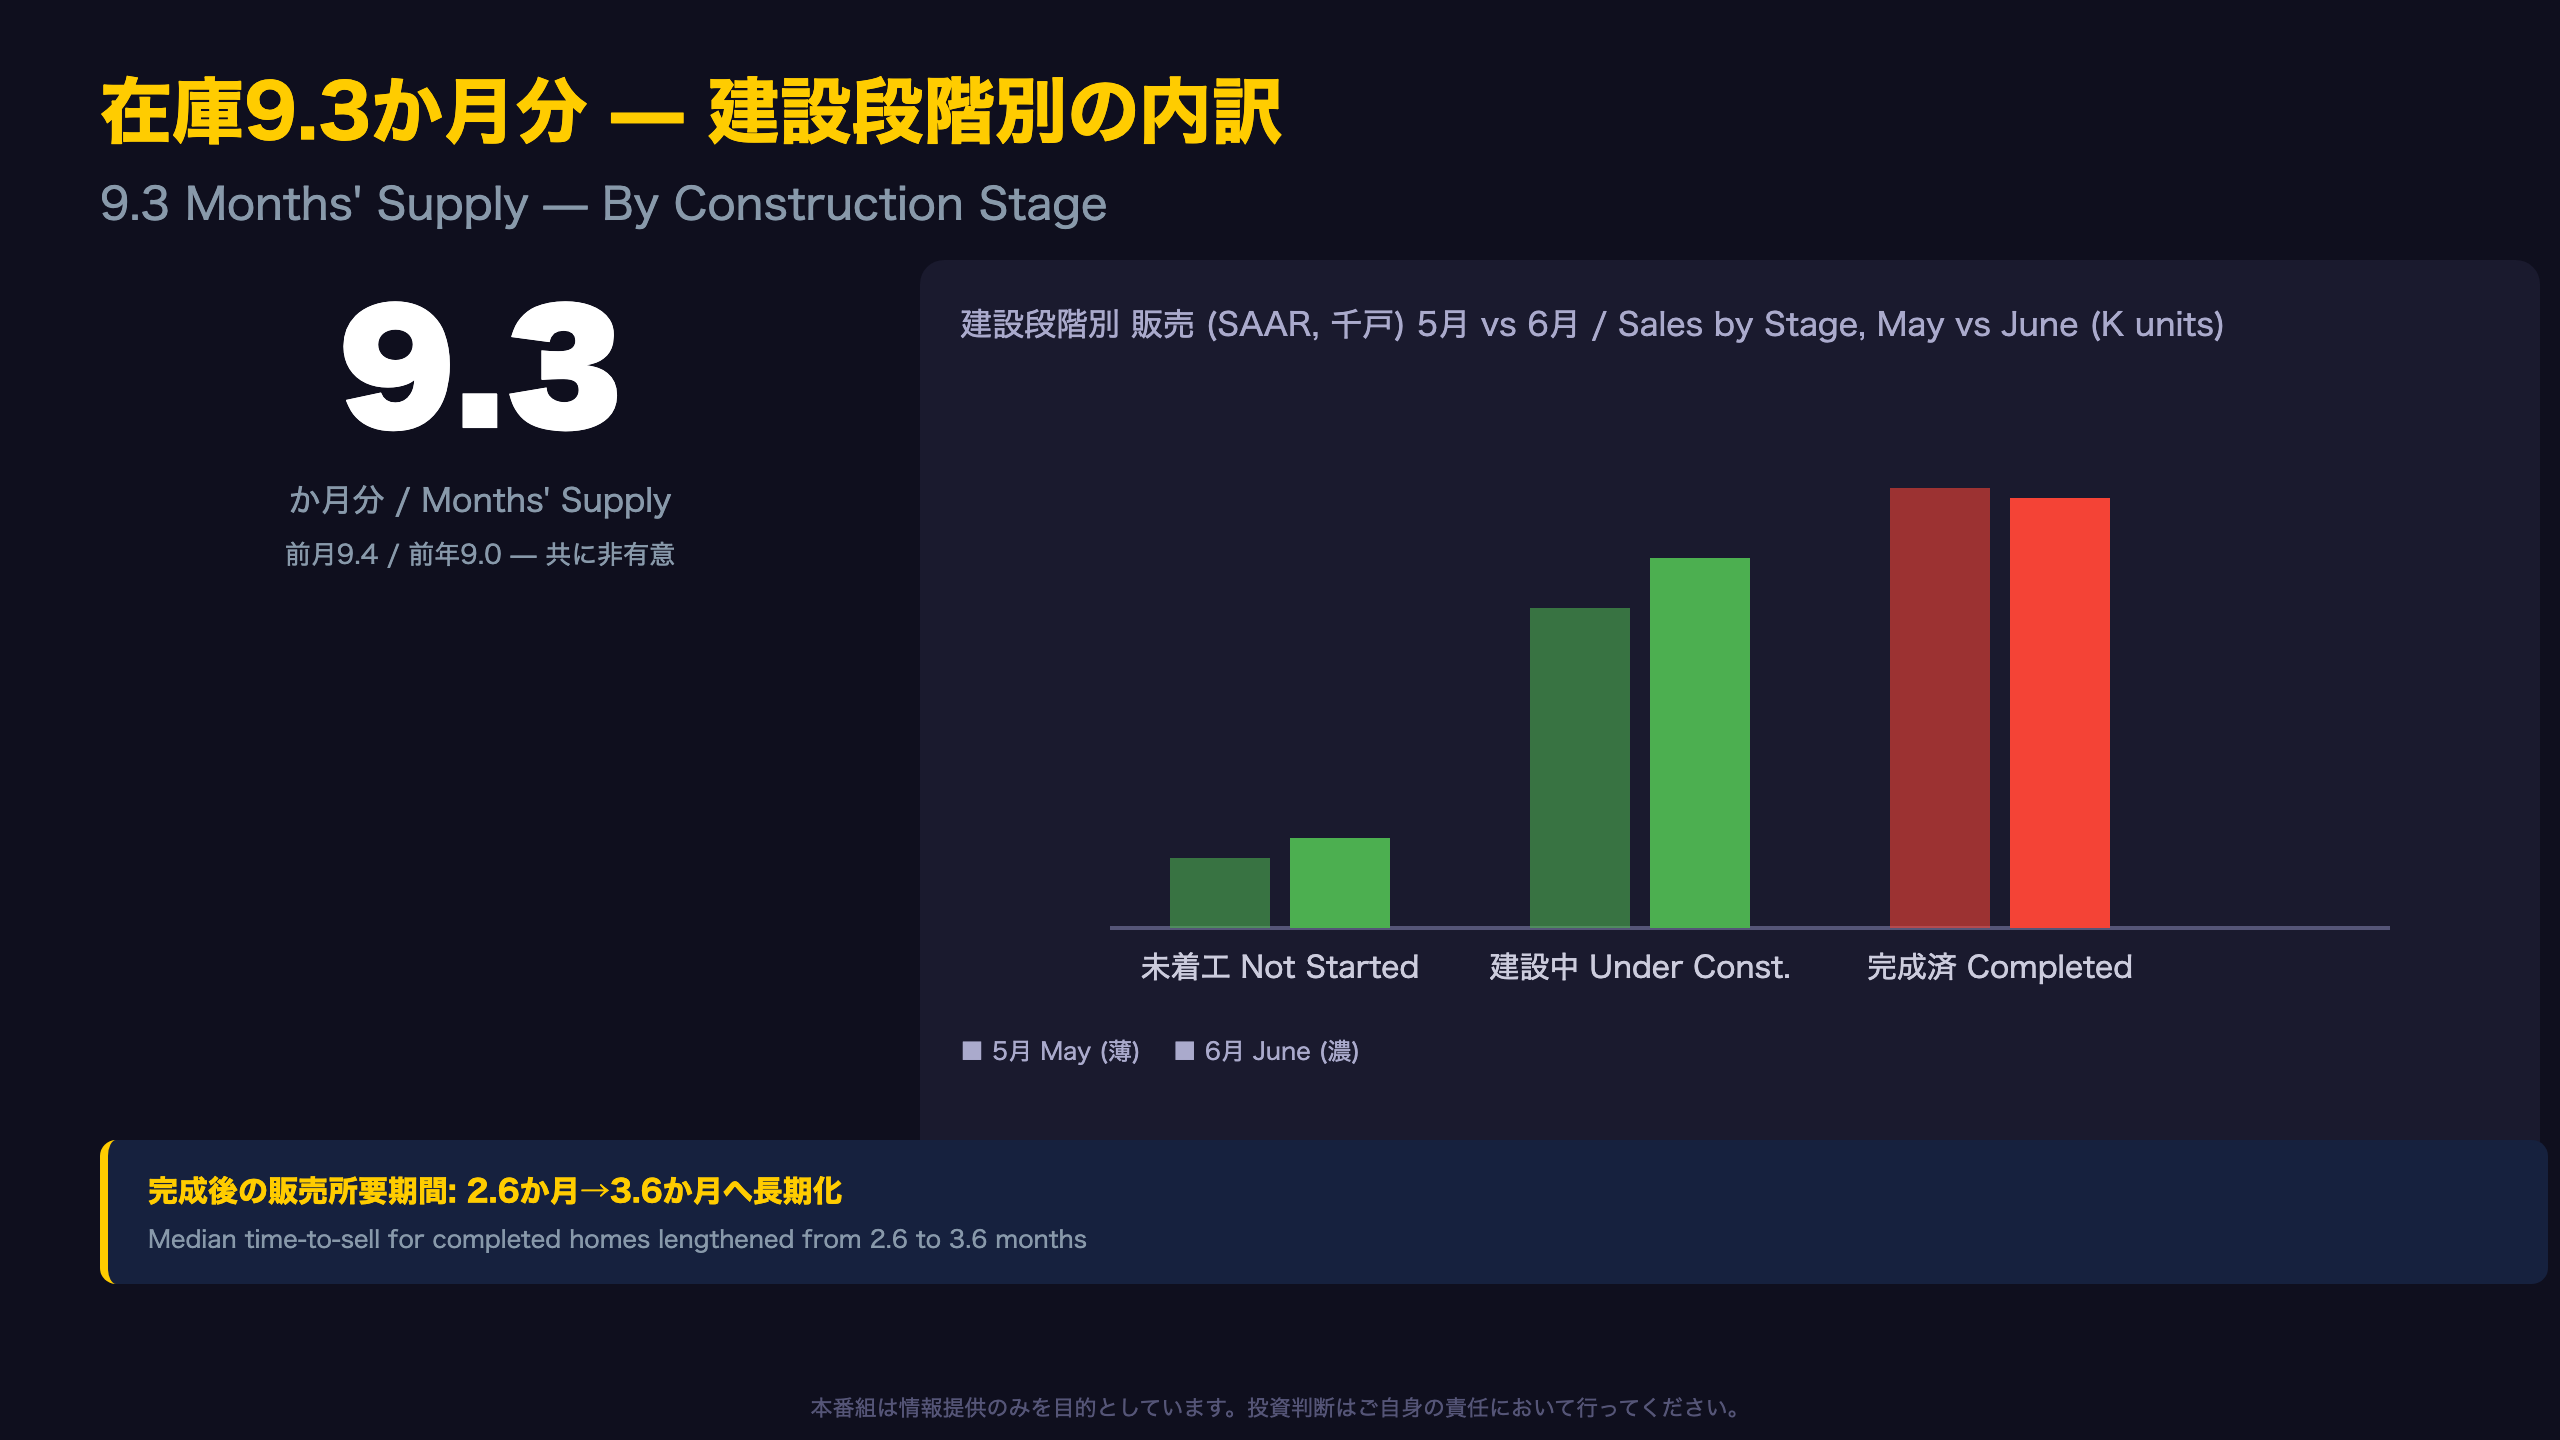
Inventory Quality: Spec Building Continues Despite Flat Supply
Months’ supply held at 9.3, statistically unchanged from May’s 9.4 and June 2025’s 9.0 (both confidence intervals span zero). For readers unfamiliar with the metric: months’ supply is the ratio of homes for sale to the current sales pace, and this report’s own data show it has ranged between 7.5 and 10.3 for the past year without a clear inflection.
More telling is the by-construction-stage breakdown: not-started and under-construction inventory both grew (74,000 and 203,000 SAAR sold respectively, up from May), while completed-home sales slipped slightly to 351,000. The median months-on-market for completed homes has steadily lengthened from 2.6 months (June 2025) to 3.6 months (June 2026).
Bull read: builders continue breaking ground on spec homes, signaling confidence in medium-term demand.
Bear read: completed homes are sitting longer, suggesting builders may need further price or incentive concessions to clear finished stock.
Both dynamics can coexist without contradiction, builders often shift incentives on completed units while maintaining new starts.
インプリケーション — ノイズと構造変化を見極める

Scenario Thresholds Ahead of the August 25 Release
The Census Bureau’s own guidance, that four months of data are needed to establish a trend, means June’s report alone cannot confirm whether new home demand is stabilizing or merely pausing within a downtrend.
Key thresholds to watch in the July release (due August 25, 2026):
– West region: a rebound above 120,000 SAAR would suggest June’s drop was transitory; a continued sub-110,000 reading would confirm regional weakness.
– Months’ supply: a move toward 10+ would signal softer demand; a drop toward 8 would suggest inventory absorption.
– Average price: stabilization near $475,000-$490,000 versus a further slide toward $450,000 would clarify whether the compositional shift is complete.
For macro context: new home sales are among the most mortgage-rate-sensitive indicators the Fed monitors, given builders’ direct pass-through of financing costs to buyers. However, this single report cannot isolate the causal effect of mortgage rates versus regional and demographic shifts, readers should pair this data with existing home sales (NAR), pending home sales, and 30-year mortgage rate trends for a fuller picture before drawing policy conclusions.
Disclaimer: This article is for informational purposes only. All investment decisions are made solely at your own risk.