📺 Watch the Full Video Analysis
This article was automatically generated by the NFC Market Live AI analysis system. (Updated: 2026-07-19 08:41 JST)
📊 A full recap of this week’s (Jul 12-19) global macro data.
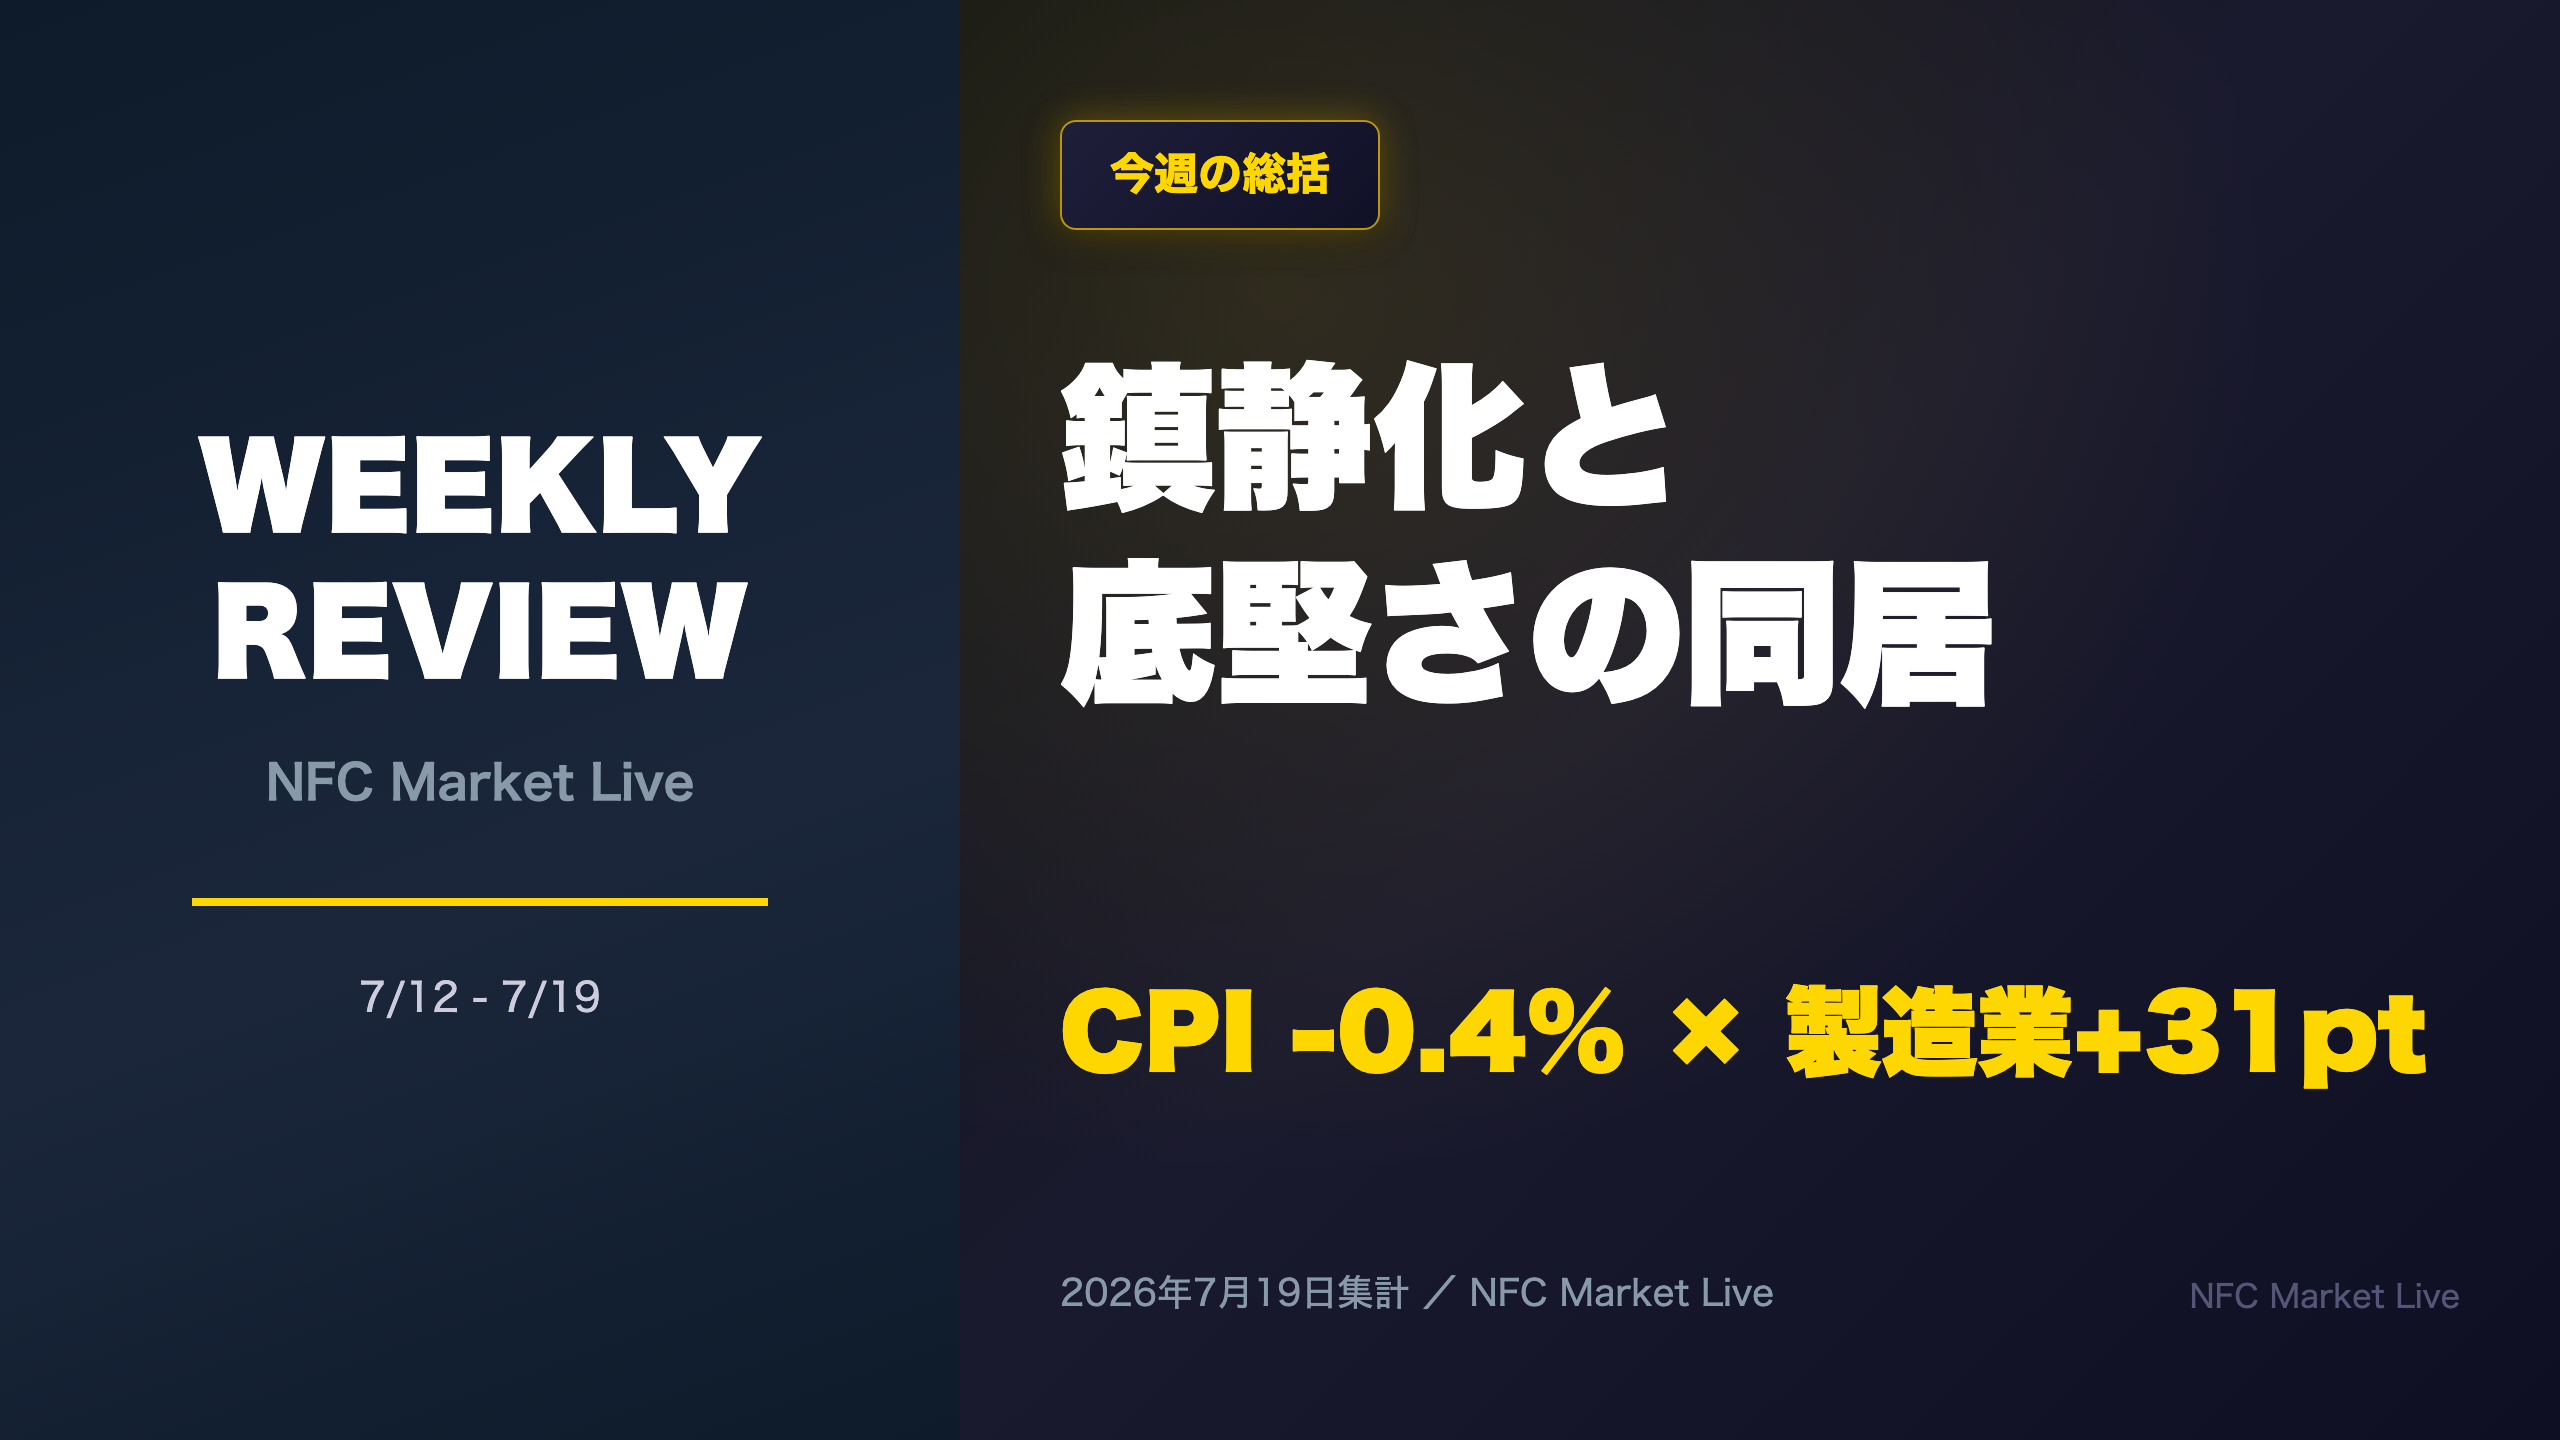
US June CPI plunged -0.4% MoM, the sharpest drop since April 2020, while Philly Fed and Empire State manufacturing indices surged to multi-year highs.
Eurozone HICP reversed from 3.2% to 2.8%. Earnings from JPMorgan, Netflix, and ASML revealed a mixed corporate picture.
💡 Next week’s (Jul 20-24) key events previewed.
📉 For informational purposes only.
オープニング:今週の集計期間
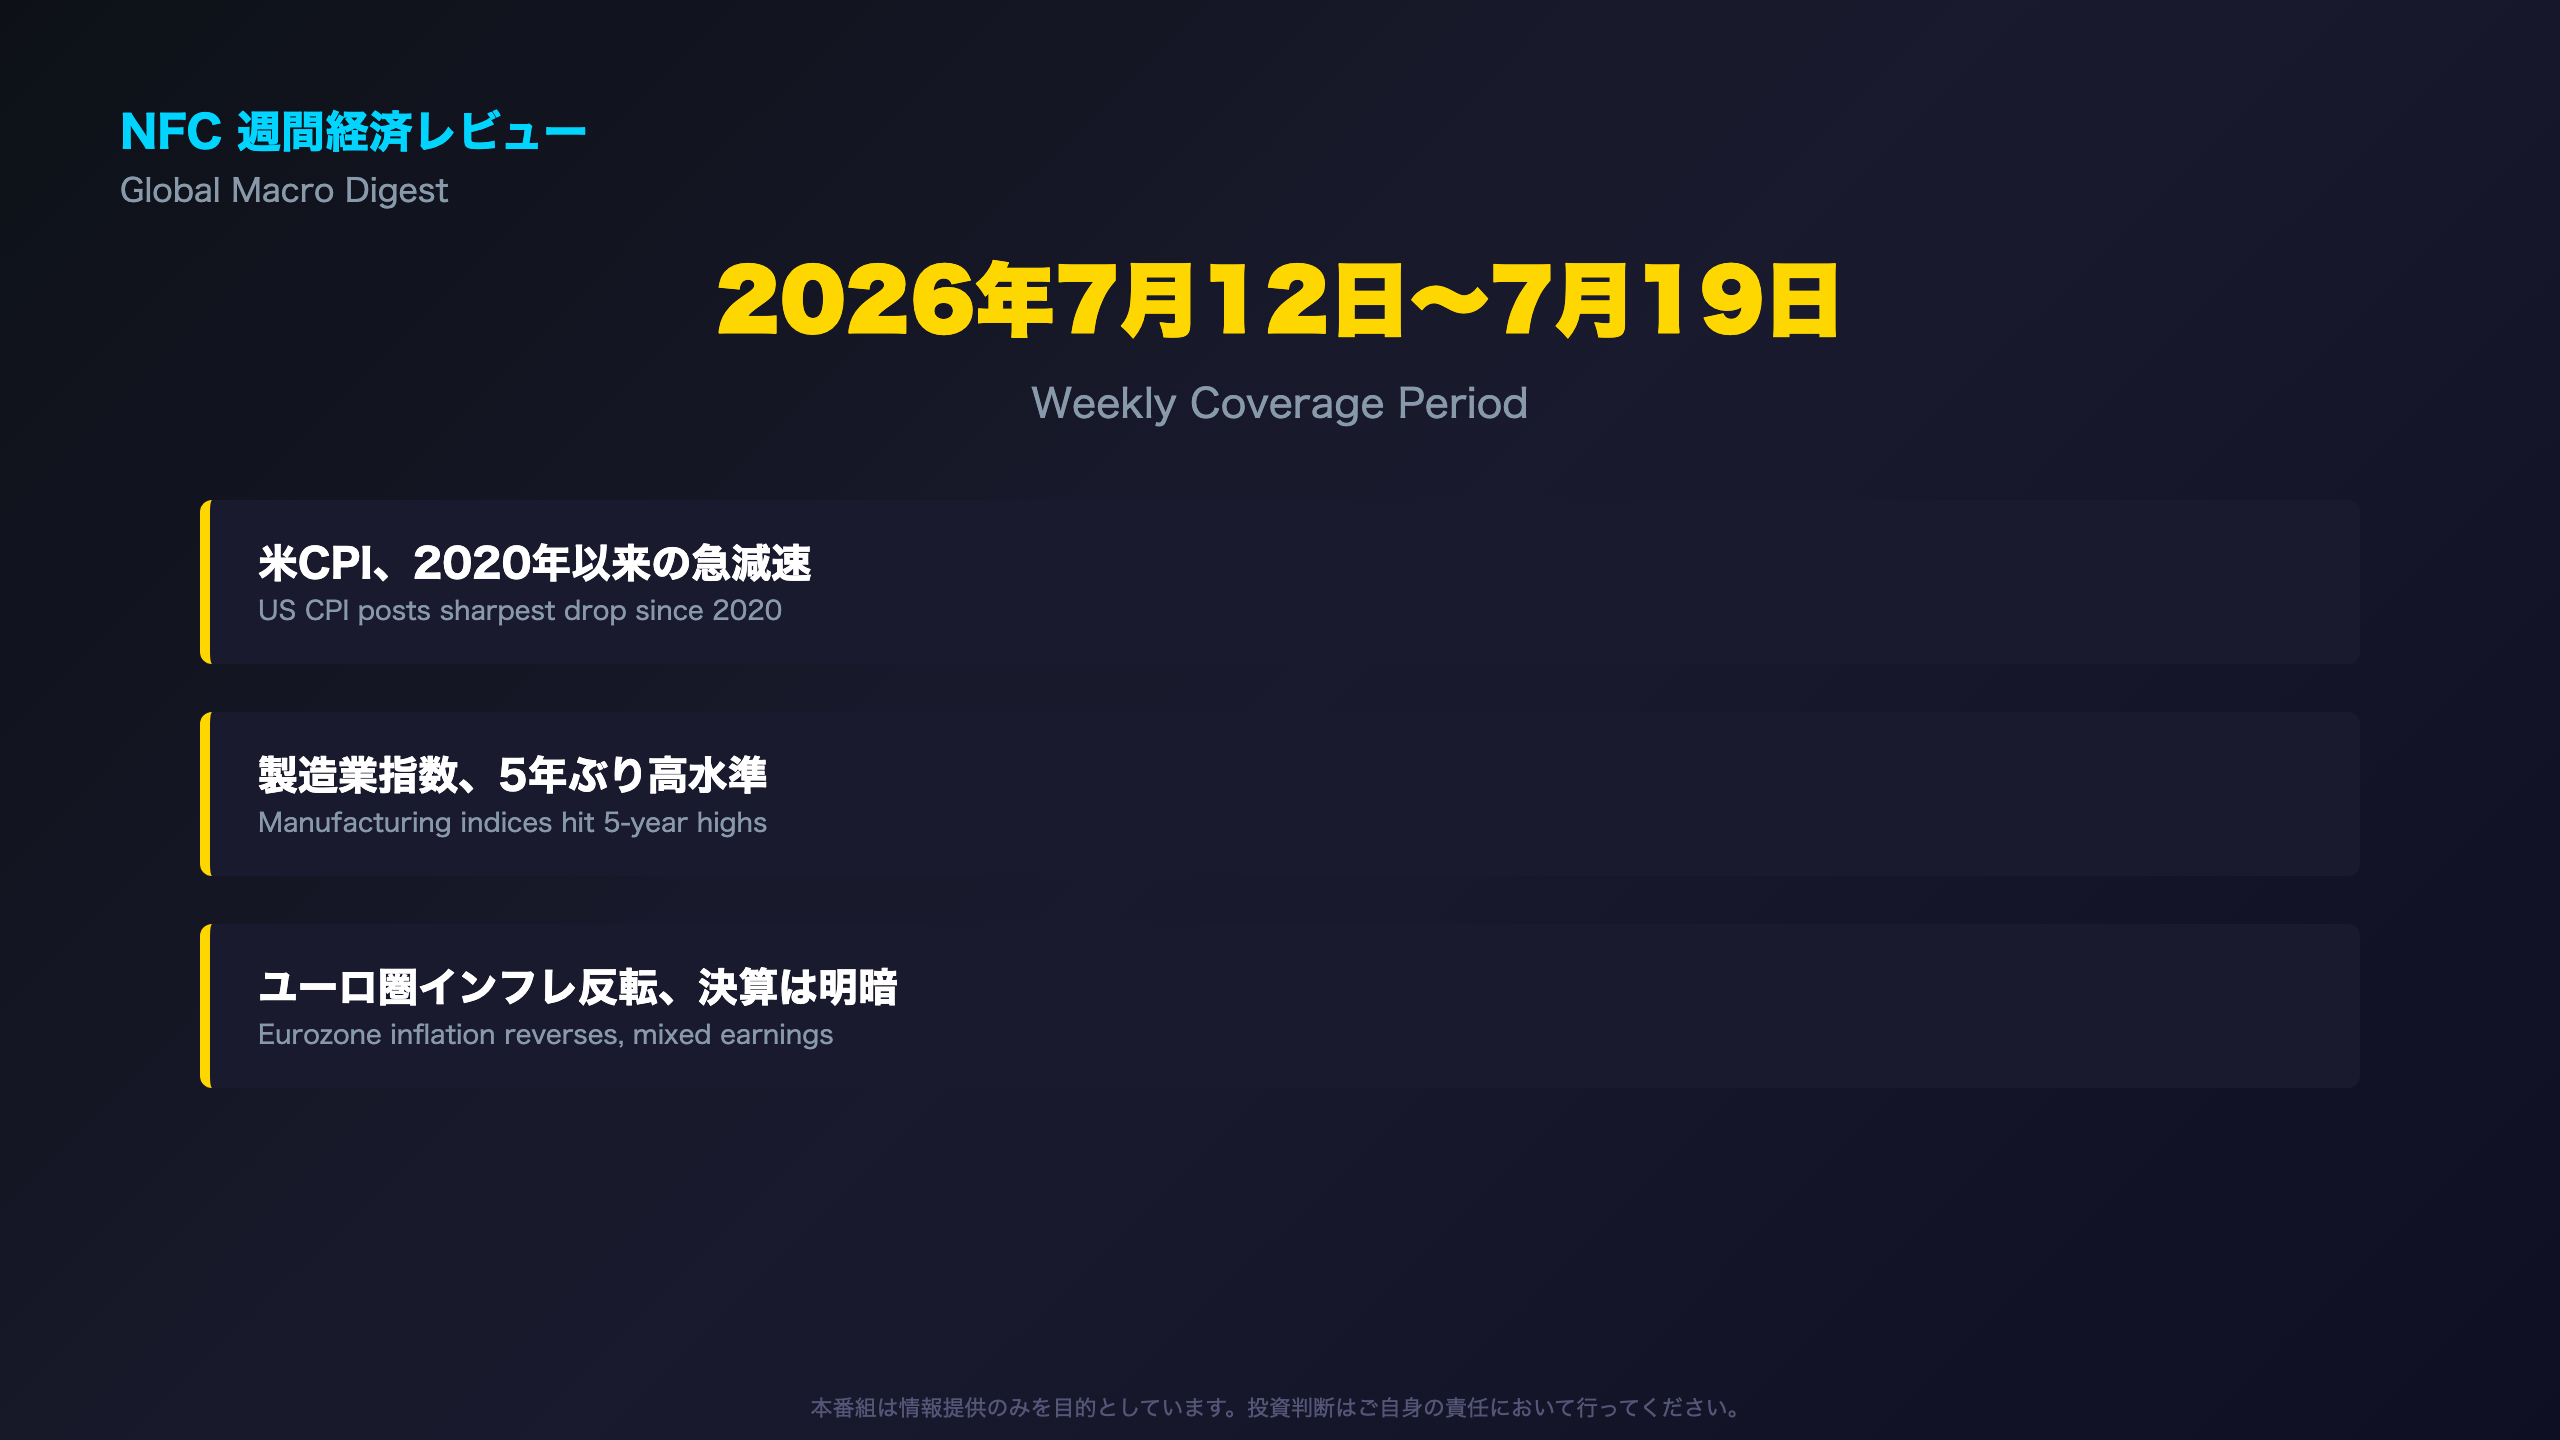
Overview of the Week
Between July 12 and July 19, 2026, global macro data presented a week of crosscurrents. In the US, June CPI posted a historic -0.4% month-over-month decline, while the Philadelphia Fed and Empire State manufacturing indices both surged sharply.
This Week’s Headlines
- US June CPI: -0.4% MoM, the sharpest drop since April 2020
- Philly Fed Manufacturing Index: 41.4 (+31pts, highest in five years)
- Eurozone HICP: 3.2% (May) → 2.8% (June)
- JPMorgan Chase net income: +41% YoY (including one-time items)
- Netflix: Revenue and earnings up, but free cash flow sharply lower
Framing the Week
Rather than a single coherent narrative, this week delivered a genuinely mixed picture. Disinflation signals and improving manufacturing/consumer sentiment offered encouraging news, while leading housing indicators and the quality of certain corporate earnings warrant caution. For US-based readers unfamiliar with some releases: the Philadelphia Fed and Empire State (New York Fed) indices are regional manufacturing surveys similar in spirit to the ISM Manufacturing PMI, and Eurozone HICP is the EU’s equivalent of CPI, tracked closely by the European Central Bank against its 2% target. The following slides unpack both the encouraging and cautionary threads in detail.
今週の総括:鎮静化と底堅さの同居
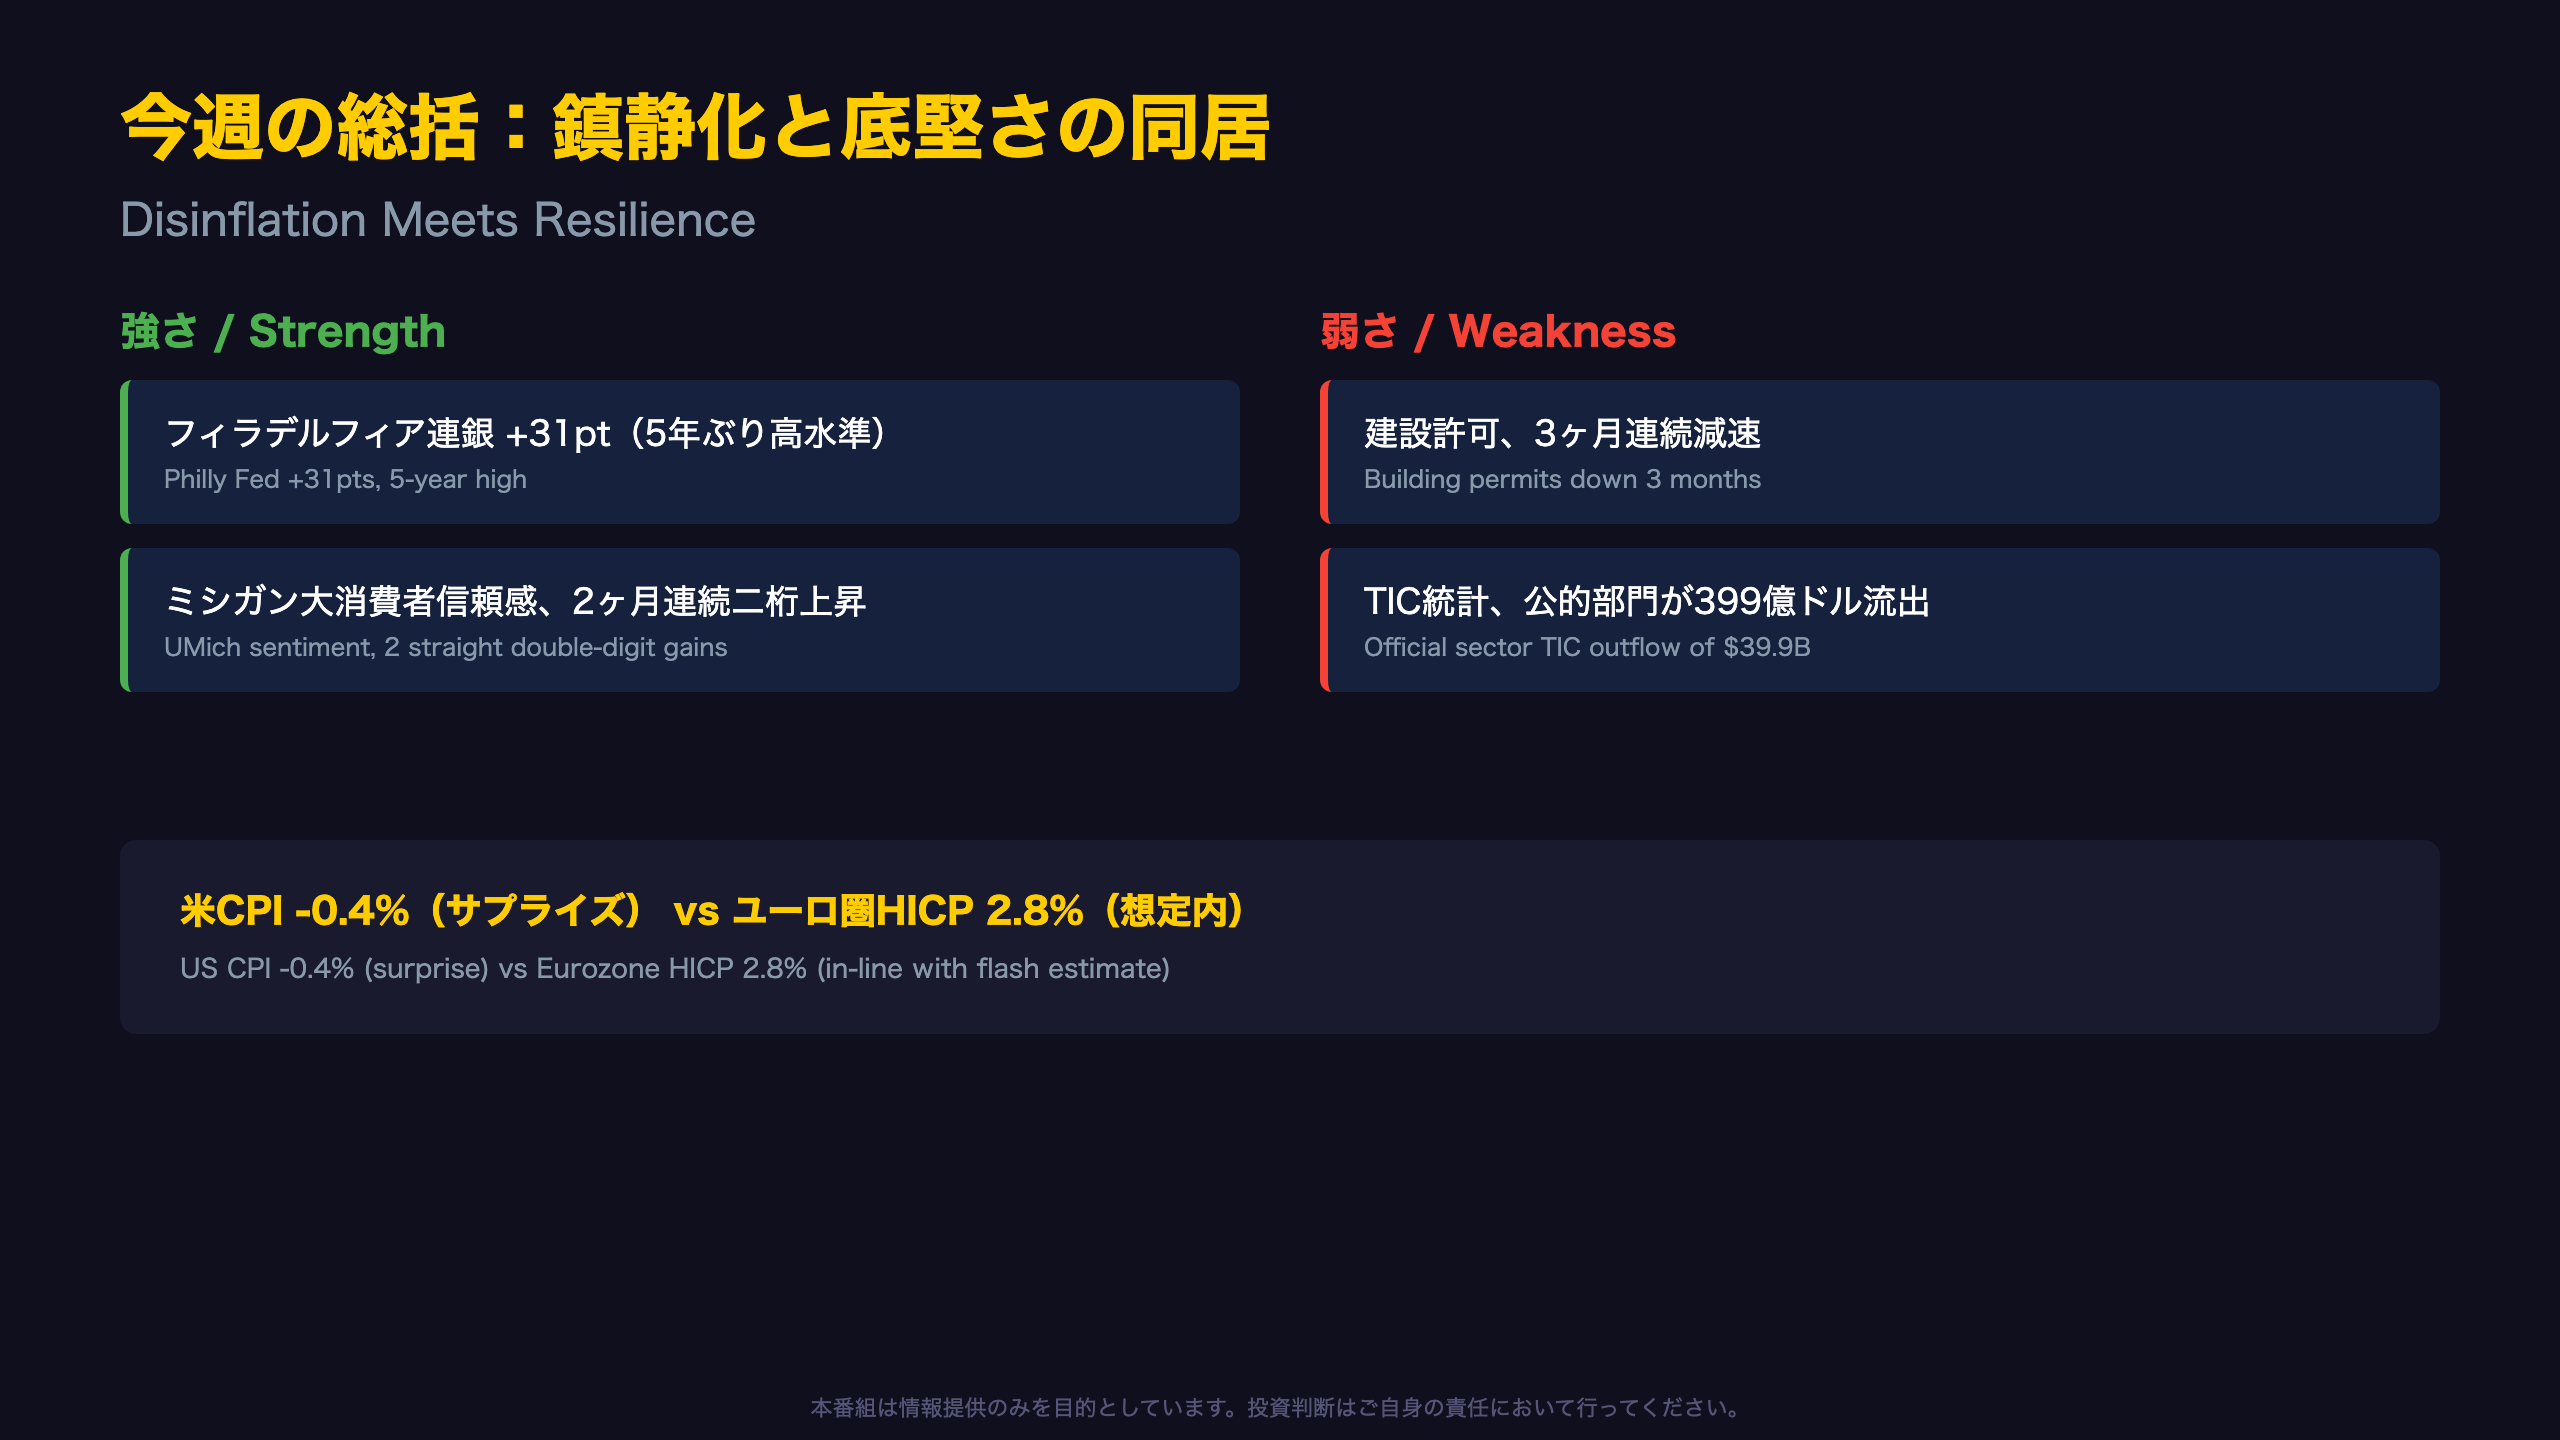
Sorting Surprises from Consensus
This week’s biggest surprise was the -0.4% US CPI print. The BLS itself called it “the largest 1-month decrease since April 2020,” suggesting the move likely exceeded typical market expectations. By contrast, the Eurozone HICP’s drop from 3.2% to 2.8% matched the flash estimate exactly—an in-line, non-surprising result.
Weekly Scorecard
| Category | Indicator | Read |
|---|---|---|
| Positive surprise | Philly Fed +31pts | Highest in 5 years |
| Positive surprise | UMich Sentiment | 2nd straight double-digit rise |
| In-line | Eurozone HICP | Matched flash estimate exactly |
| Cautionary | Building permits | 3rd straight monthly decline |
| Cautionary | TIC data | Sharp outflow from official sector |
Why the Data Won’t Fit a Single Narrative
Having multiple indicators simultaneously flash both bullish and bearish signals is a pattern often associated with inflection points in the economic cycle—though this single week of data cannot confirm where exactly the cycle stands. The next US CPI and retail sales releases, due in mid-August, will be critical for determining which of this week’s competing signals ultimately prevails. For context, U.S. investors should note that the Philly Fed and Empire State surveys are regional manufacturing gauges, not as broad as the national ISM PMI, so their swings can be more volatile month to month.
米国指標ハイライト:現況の強さと先行き懸念
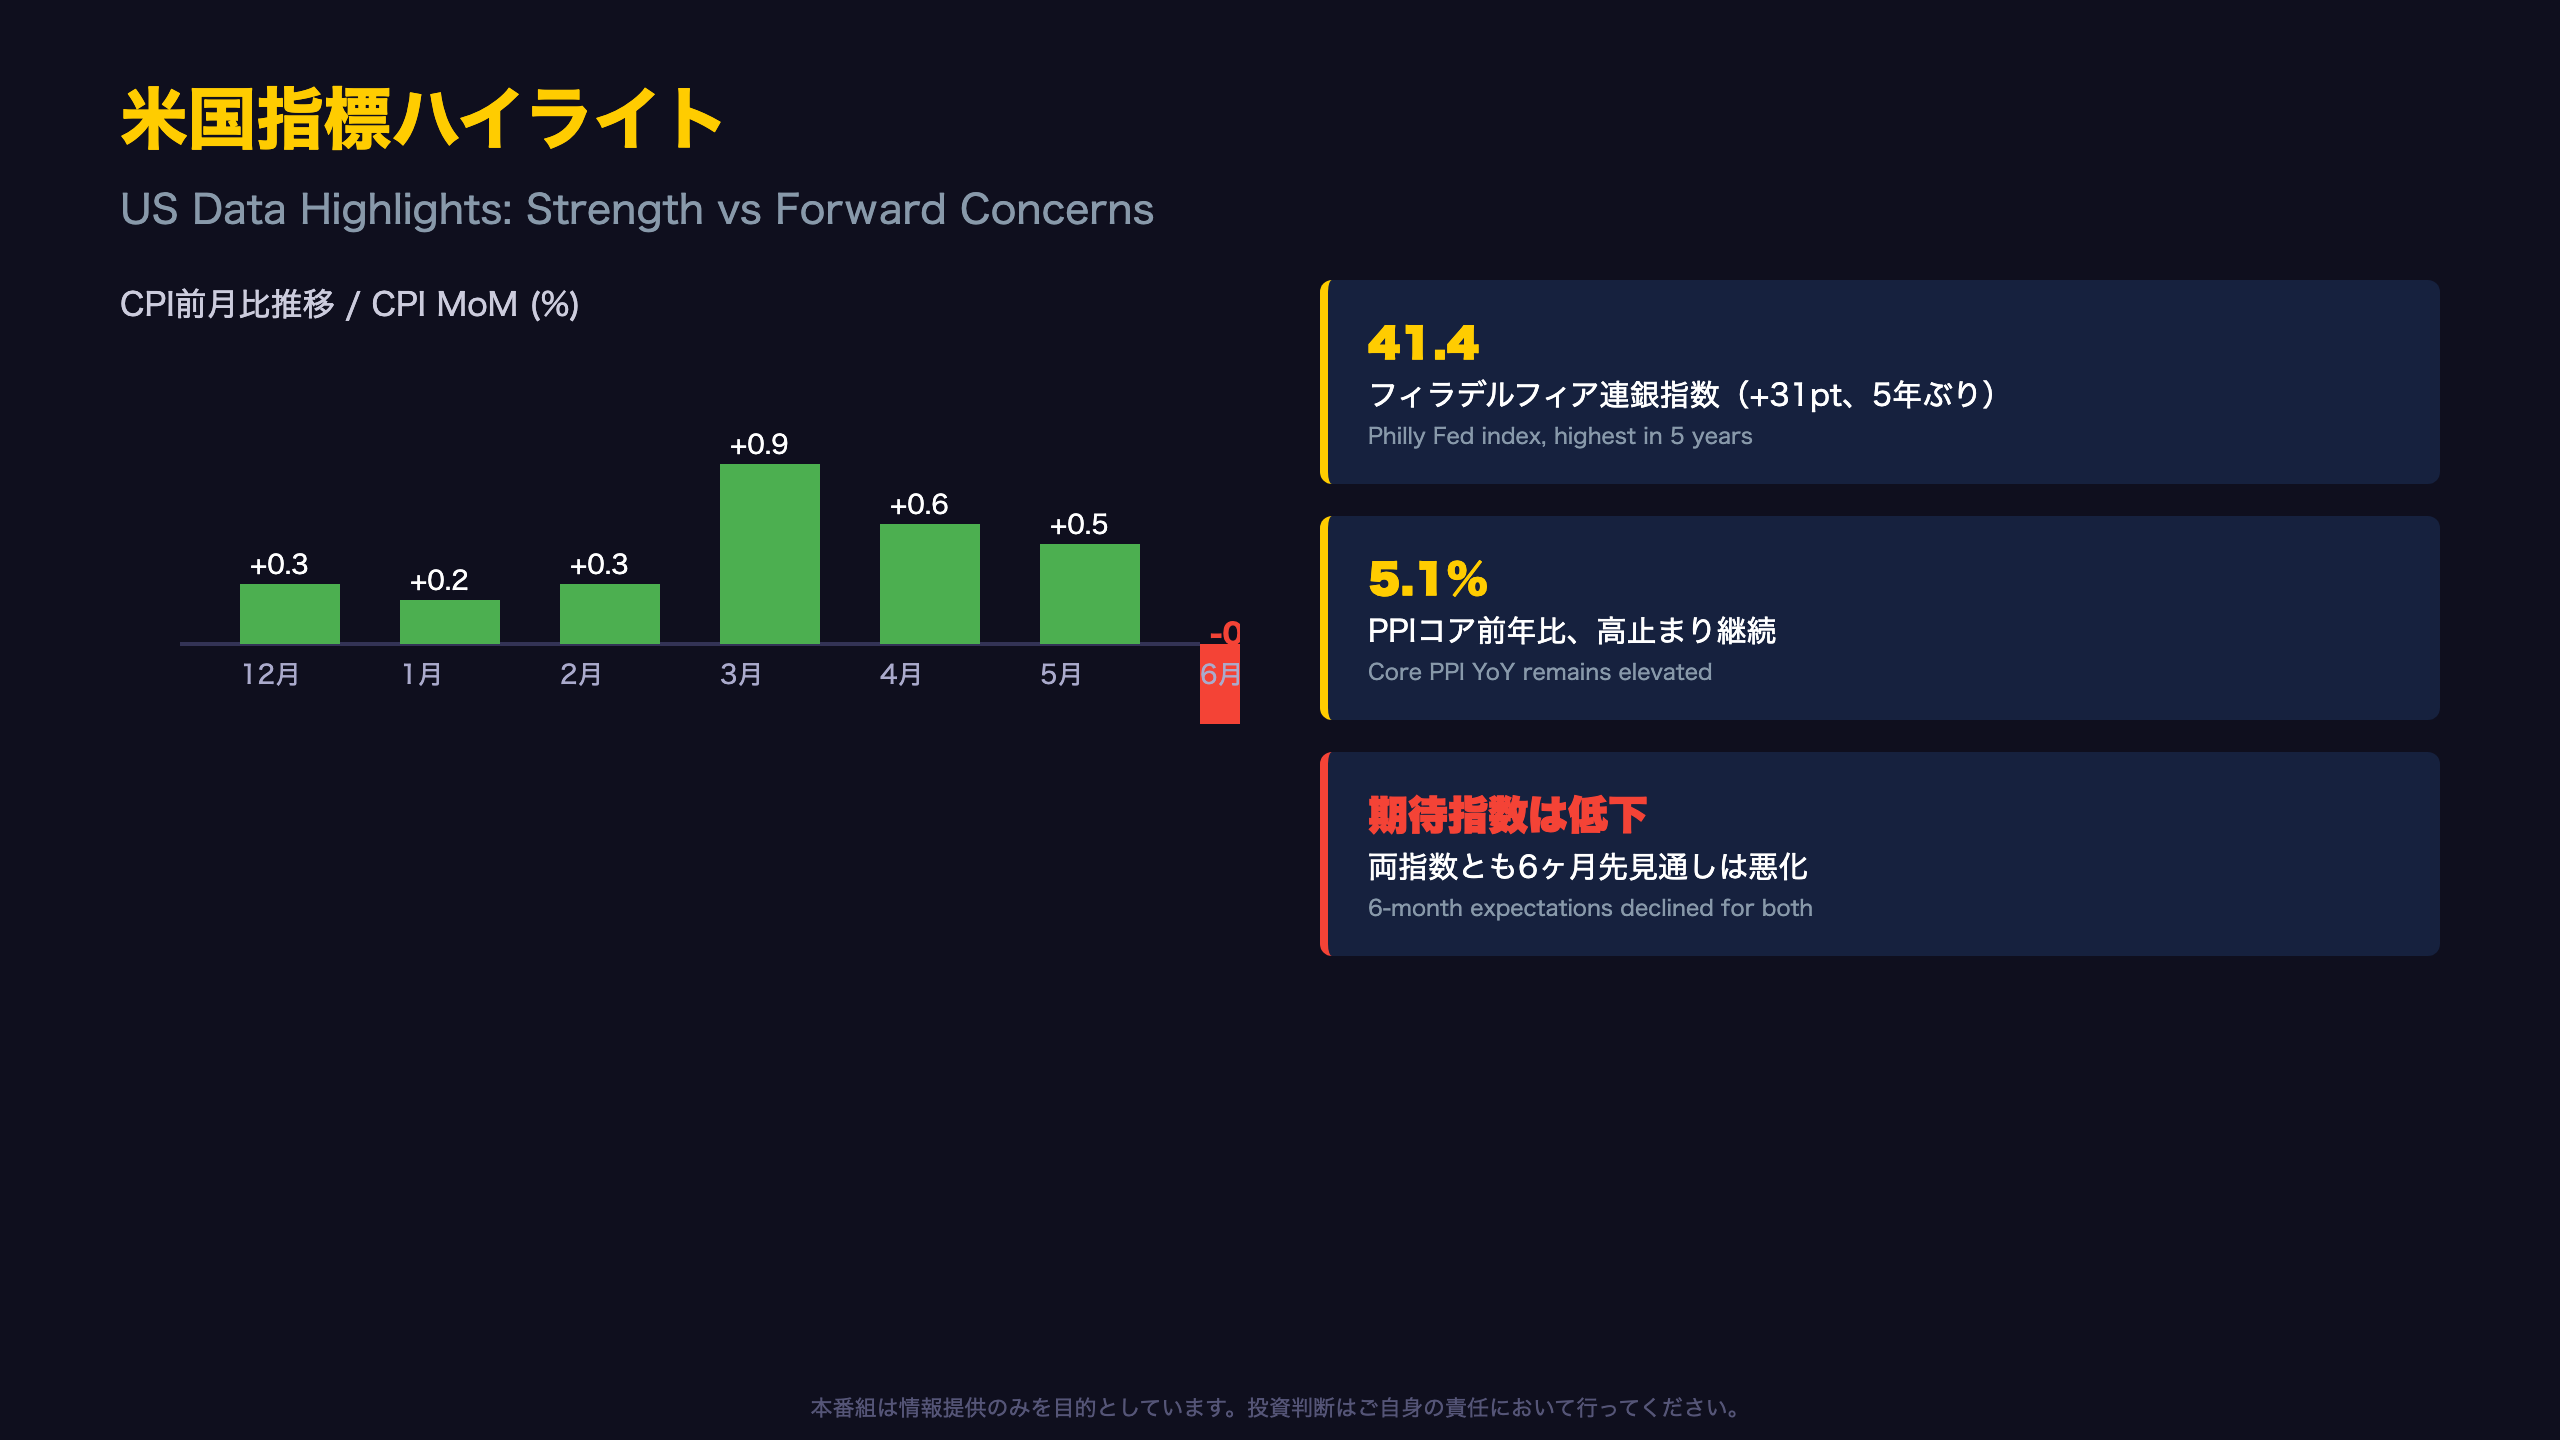
The Structure Behind the Numbers
This month’s CPI plunge is almost entirely explained by a single factor: the reversal in energy prices. The BLS release states plainly that “the index for energy fell 5.7 percent in June…more than offsetting increases in other indexes including those for shelter and food”—shelter and food costs were, in fact, still rising.
Energy’s Rollercoaster Ride
| Month | Energy MoM |
|---|---|
| March | +10.9% |
| April | +3.8% |
| May | +3.9% |
| June | -5.7% |
From March’s spike to June’s collapse, energy prices whipsawed within just four months. Without this reversal, the 0.0% core CPI reading—signaling a loss of “stickiness”—might have drawn even more attention.
A Hidden PPI Signal: Margin Expansion
Notably, while wholesale gasoline prices fell a sharp -12.0%, retail fuel margins rose +13.0%. This suggests downward price stickiness at the retail level, meaning pump prices for consumers may not fall as much as wholesale costs did—a nuance directly relevant to forecasting the next CPI gasoline reading.
Two Competing Readings
Dovish view: Core CPI at 0.0% and decelerating core PPI suggest genuine disinflation is finally reaching previously sticky categories like shelter and services.
Hawkish view: This is a one-month energy-driven anomaly, and core PPI’s 5.1% year-over-year rate—still near its highest since October 2022—shouldn’t be dismissed.
The next CPI report (August 12) will be the key test of whether core inflation re-accelerates. For non-US readers: the BLS (Bureau of Labor Statistics) is the US equivalent of Japan’s Statistics Bureau, and the CPI print is the single most-watched inflation gauge for Fed policy decisions, directly comparable in importance to Japan’s core CPI for BOJ policy.
グローバル・企業決算:明暗分かれる世界経済
The Common Thread: Services Stickiness
Eurozone HICP’s decline is welcome news, but Eurostat data shows services inflation still accounts for more than half of the headline rate (1.51pp of 2.8%). This mirrors a theme also seen in US CPI—cooling goods prices alongside sticky services inflation—suggesting a shared global pattern rather than a US-specific phenomenon.
Decomposing Earnings “Quality”
| Company | Headline Number | Underlying Reality |
|---|---|---|
| JPMorgan | Net income +41% | ~13% excluding one-time items |
| Netflix | Revenue/earnings up | FCF sharply lower on higher tax payments (one-off) |
| ASML | Raised FY guidance | China sales -22.3%, Korea +60.5% |
JPMorgan’s own disclosure states: “Excluding these items…net income decreased $4.2 billion (after tax) from $21.2 billion to $16.9 billion”—a reminder that headline growth rates can obscure underlying trends. For readers unfamiliar with US bank reporting conventions, this kind of “adjusted vs. reported” breakdown is standard practice and worth checking every earnings season.
Japan’s Capital Flow Reversal
Ministry of Finance data shows foreign flows into Japanese equities swung from a record ¥1.8175 trillion sell-off (week of 6/27) to a ¥745.6 billion buy-back (week of 7/11)—a dramatic two-week reversal that may reflect short-term position adjustments rather than a durable shift in investor sentiment.
What to Watch Next
The next Eurozone HICP flash estimate (July 31) will show whether services inflation returns toward 3%, while ASML’s next earnings (October 14) will reveal whether its ambitious guidance holds up.
Analysis
中央銀行・政策スタンスの現在地
Where Major Central Banks Stand
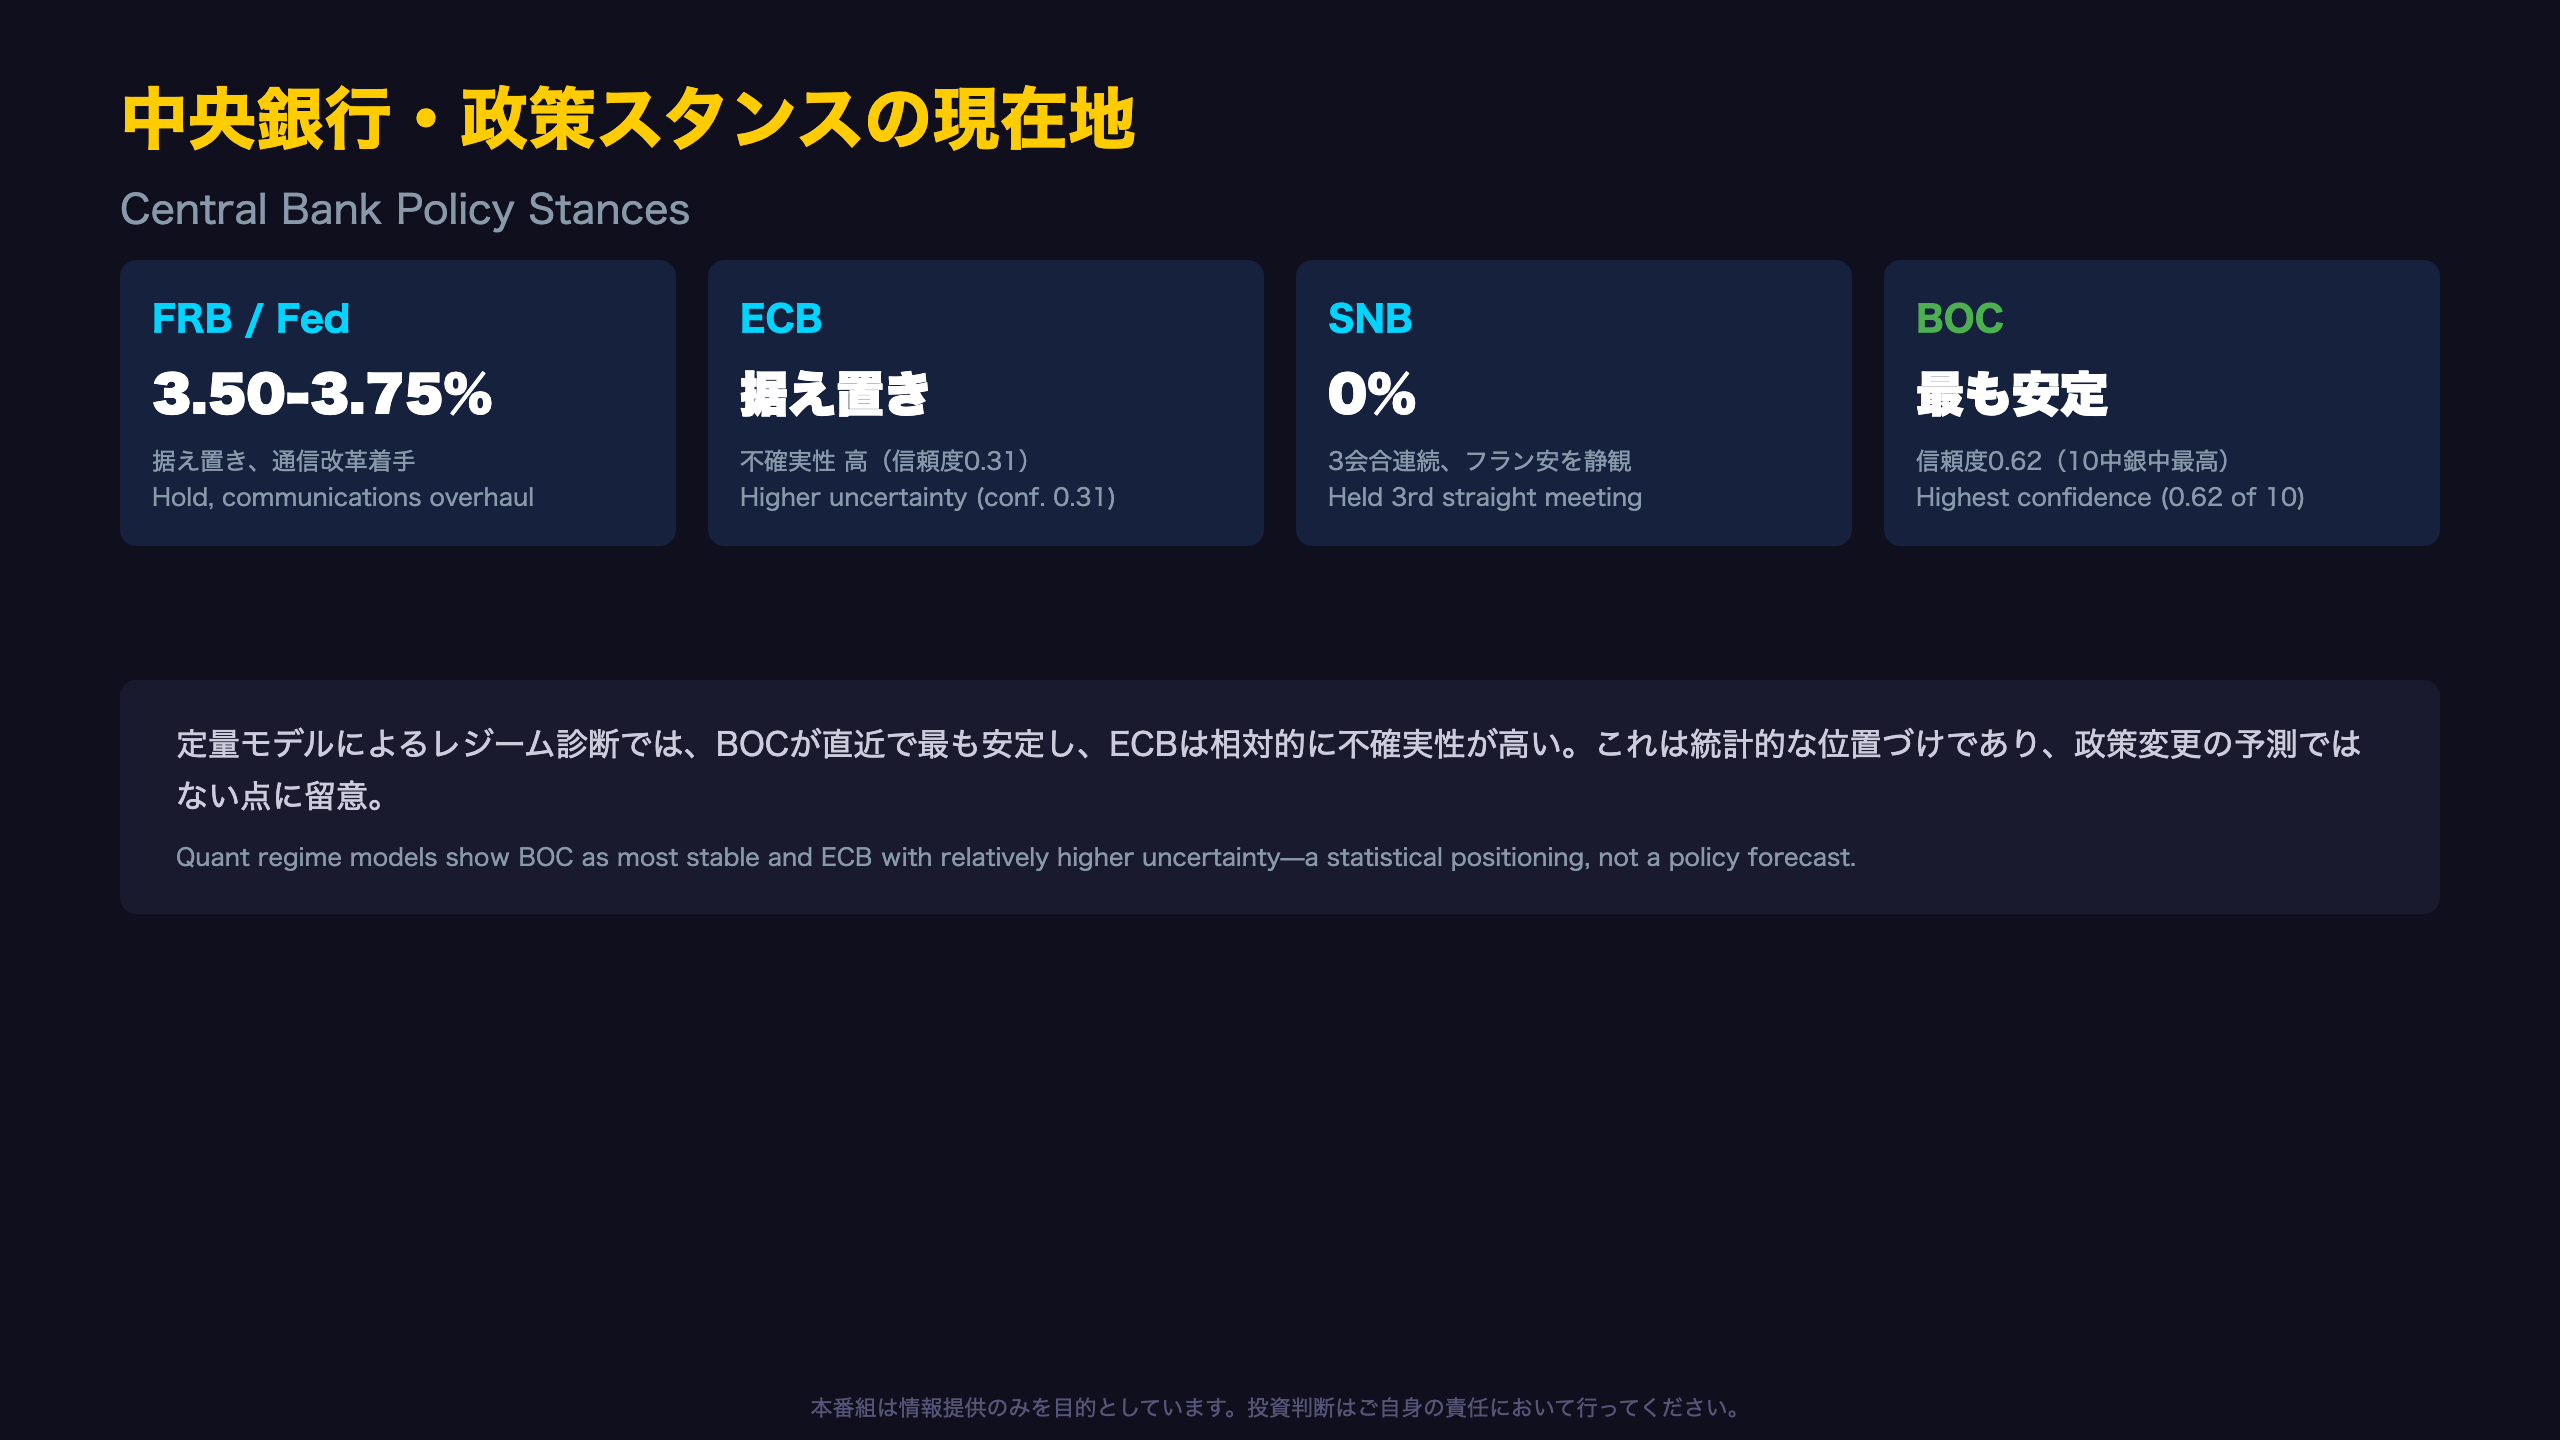
This week’s data didn’t significantly shake the policy trajectories of major central banks. If anything, it was a week that reinforced each institution’s existing stance.
Snapshot by Bank
- Federal Reserve: Held its policy rate range at 3.50%-3.75%. New Chair Kevin Warsh testified that “underlying inflation is largely determined by monetary policy over longer horizons,” calling 63 consecutive months above the 2% target an “unprecedented tax.” A working group reviewing communication practices, including the possible retirement of forward guidance, is expected to report by year-end.
- ECB: HICP’s decline to 2.8% is dovish on its face, but persistent services inflation (contributing 1.51pp) gives hawks ammunition to argue for patience.
- SNB: Held rates at 0% for a third straight meeting. The franc’s depreciation—reversing prior safe-haven demand—stems from eased US-Iran tensions and widening US-Swiss rate differentials.
- BOC: Quantitative regime models show the highest confidence score (0.62) among the ten central banks tracked, suggesting relative policy stability.
A Note on Regime Diagnostics
Our quantitative regime model (a statistical framework, not a forecasting tool) found the BOC closest to its historical center (Mahalanobis distance 8.4, improving sharply from prior), while the ECB showed greater statistical distance (54.2), indicating elevated uncertainty. This reflects a positioning within historical data patterns, not a prediction of policy change. For US/European readers: this framework is roughly analogous to how VIX or MOVE indices gauge market uncertainty, applied instead to policy regime classification.
What’s Next
The FOMC’s next meeting is expected in a few weeks, with the SNB’s typically in September. Both will need to weigh this week’s disinflation signals against underlying economic resilience.
今週の番組制作費コーナー
Behind the Scenes of Production
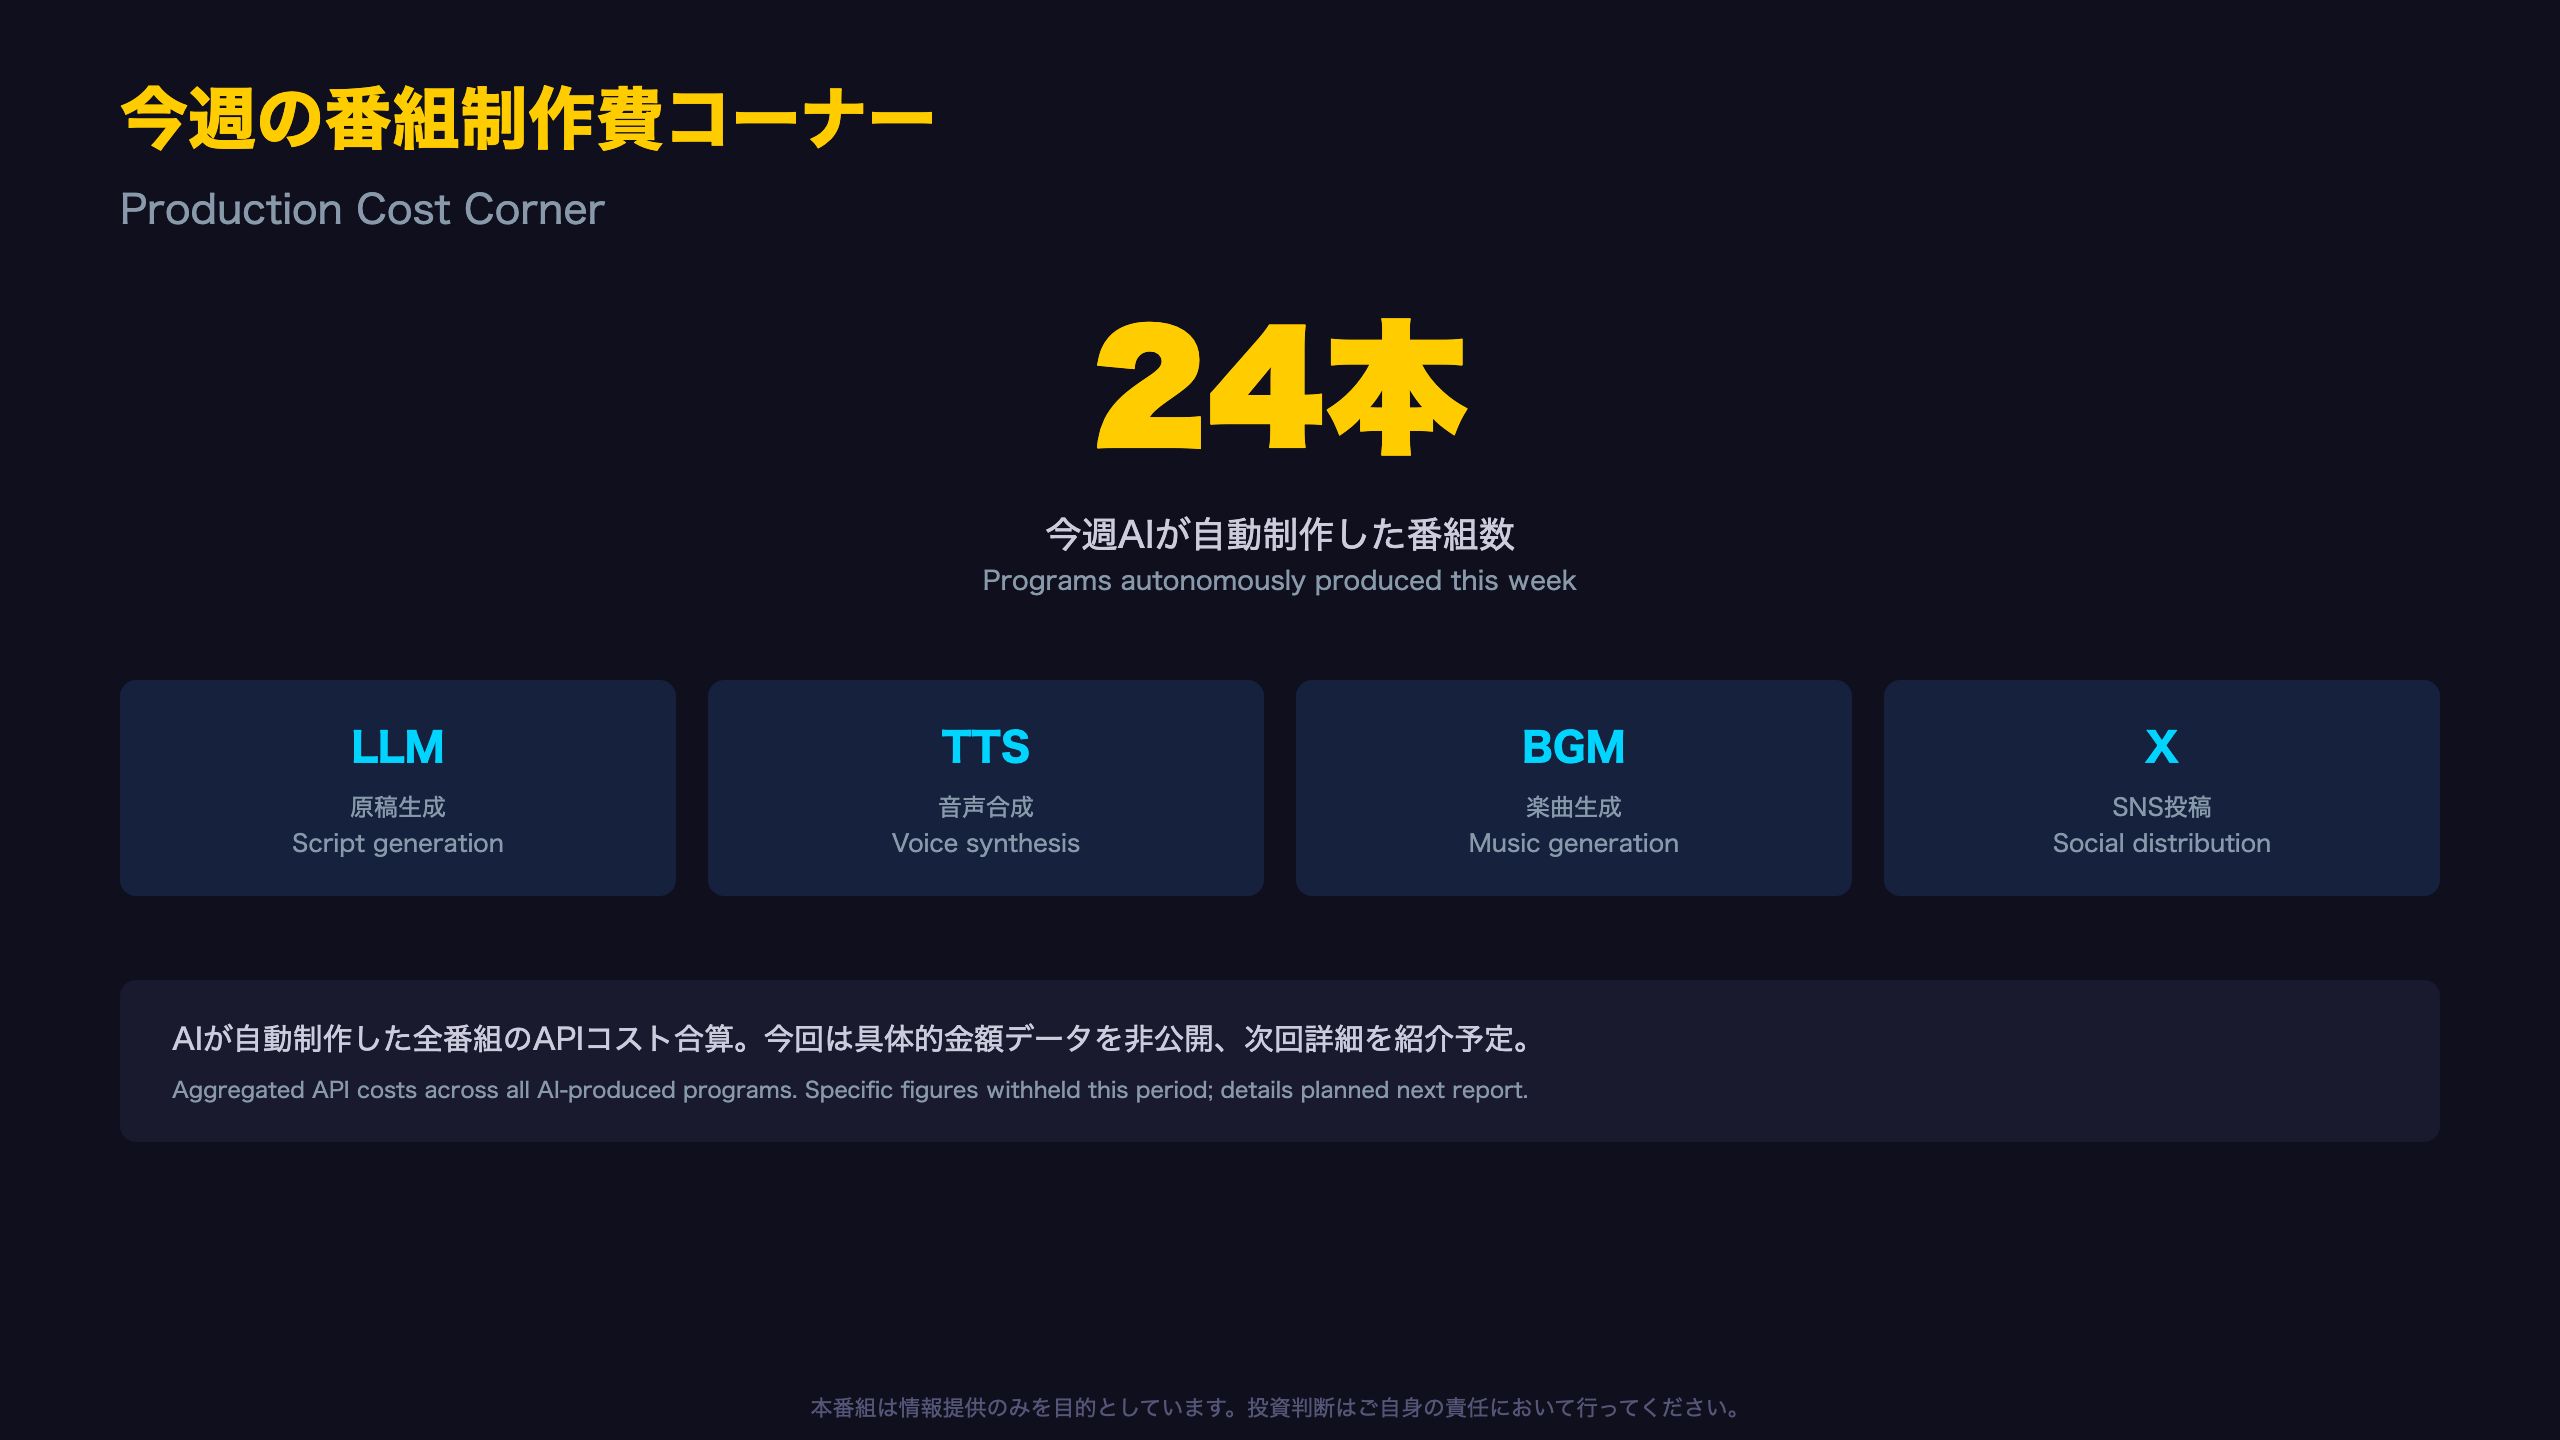
This week (Jul 12-19), NFC Market Live published 24 programs covering major US data releases (CPI, PPI, retail sales, housing starts, industrial production, two manufacturing surveys, and consumer sentiment), corporate earnings (JPMorgan, Netflix, ASML), central bank documents (Fed semi-annual testimony, Beige Book, SNB minutes), international releases (two Eurozone HICP reports, Norway CPI, Brazil’s Focus Report, Canadian wholesale trade, Japan securities flows, and US TIC data), plus two weekly macro briefings.
The Four Pillars of Production Cost
- LLM: Parses source data and generates scripts grounded in a traceable “chain of evidence”
- TTS: Converts generated scripts into natural-sounding narration
- BGM: AI-generated music tailored to each episode’s content and tone
- Social (X): Automated summary posts for social distribution
Benefits and Limits of Automated Production
This pipeline enables near-simultaneous coverage across multiple countries and indicators—a scale difficult to match with traditional production teams. That said, our strict policy against fabricating figures not present in source material means some data points (including this period’s detailed cost breakdown) may be omitted rather than estimated. For context, US media outlets covering this many international releases in a single week would typically require a much larger editorial staff; this segment aims to be transparent about both the capability and the current limitations of a fully AI-driven newsroom.
Looking Ahead
Future reports will include more granular cost breakdowns by category and average cost per episode.
来週の注目イベントカレンダー(7/20-7/24)
Next Week’s Checklist
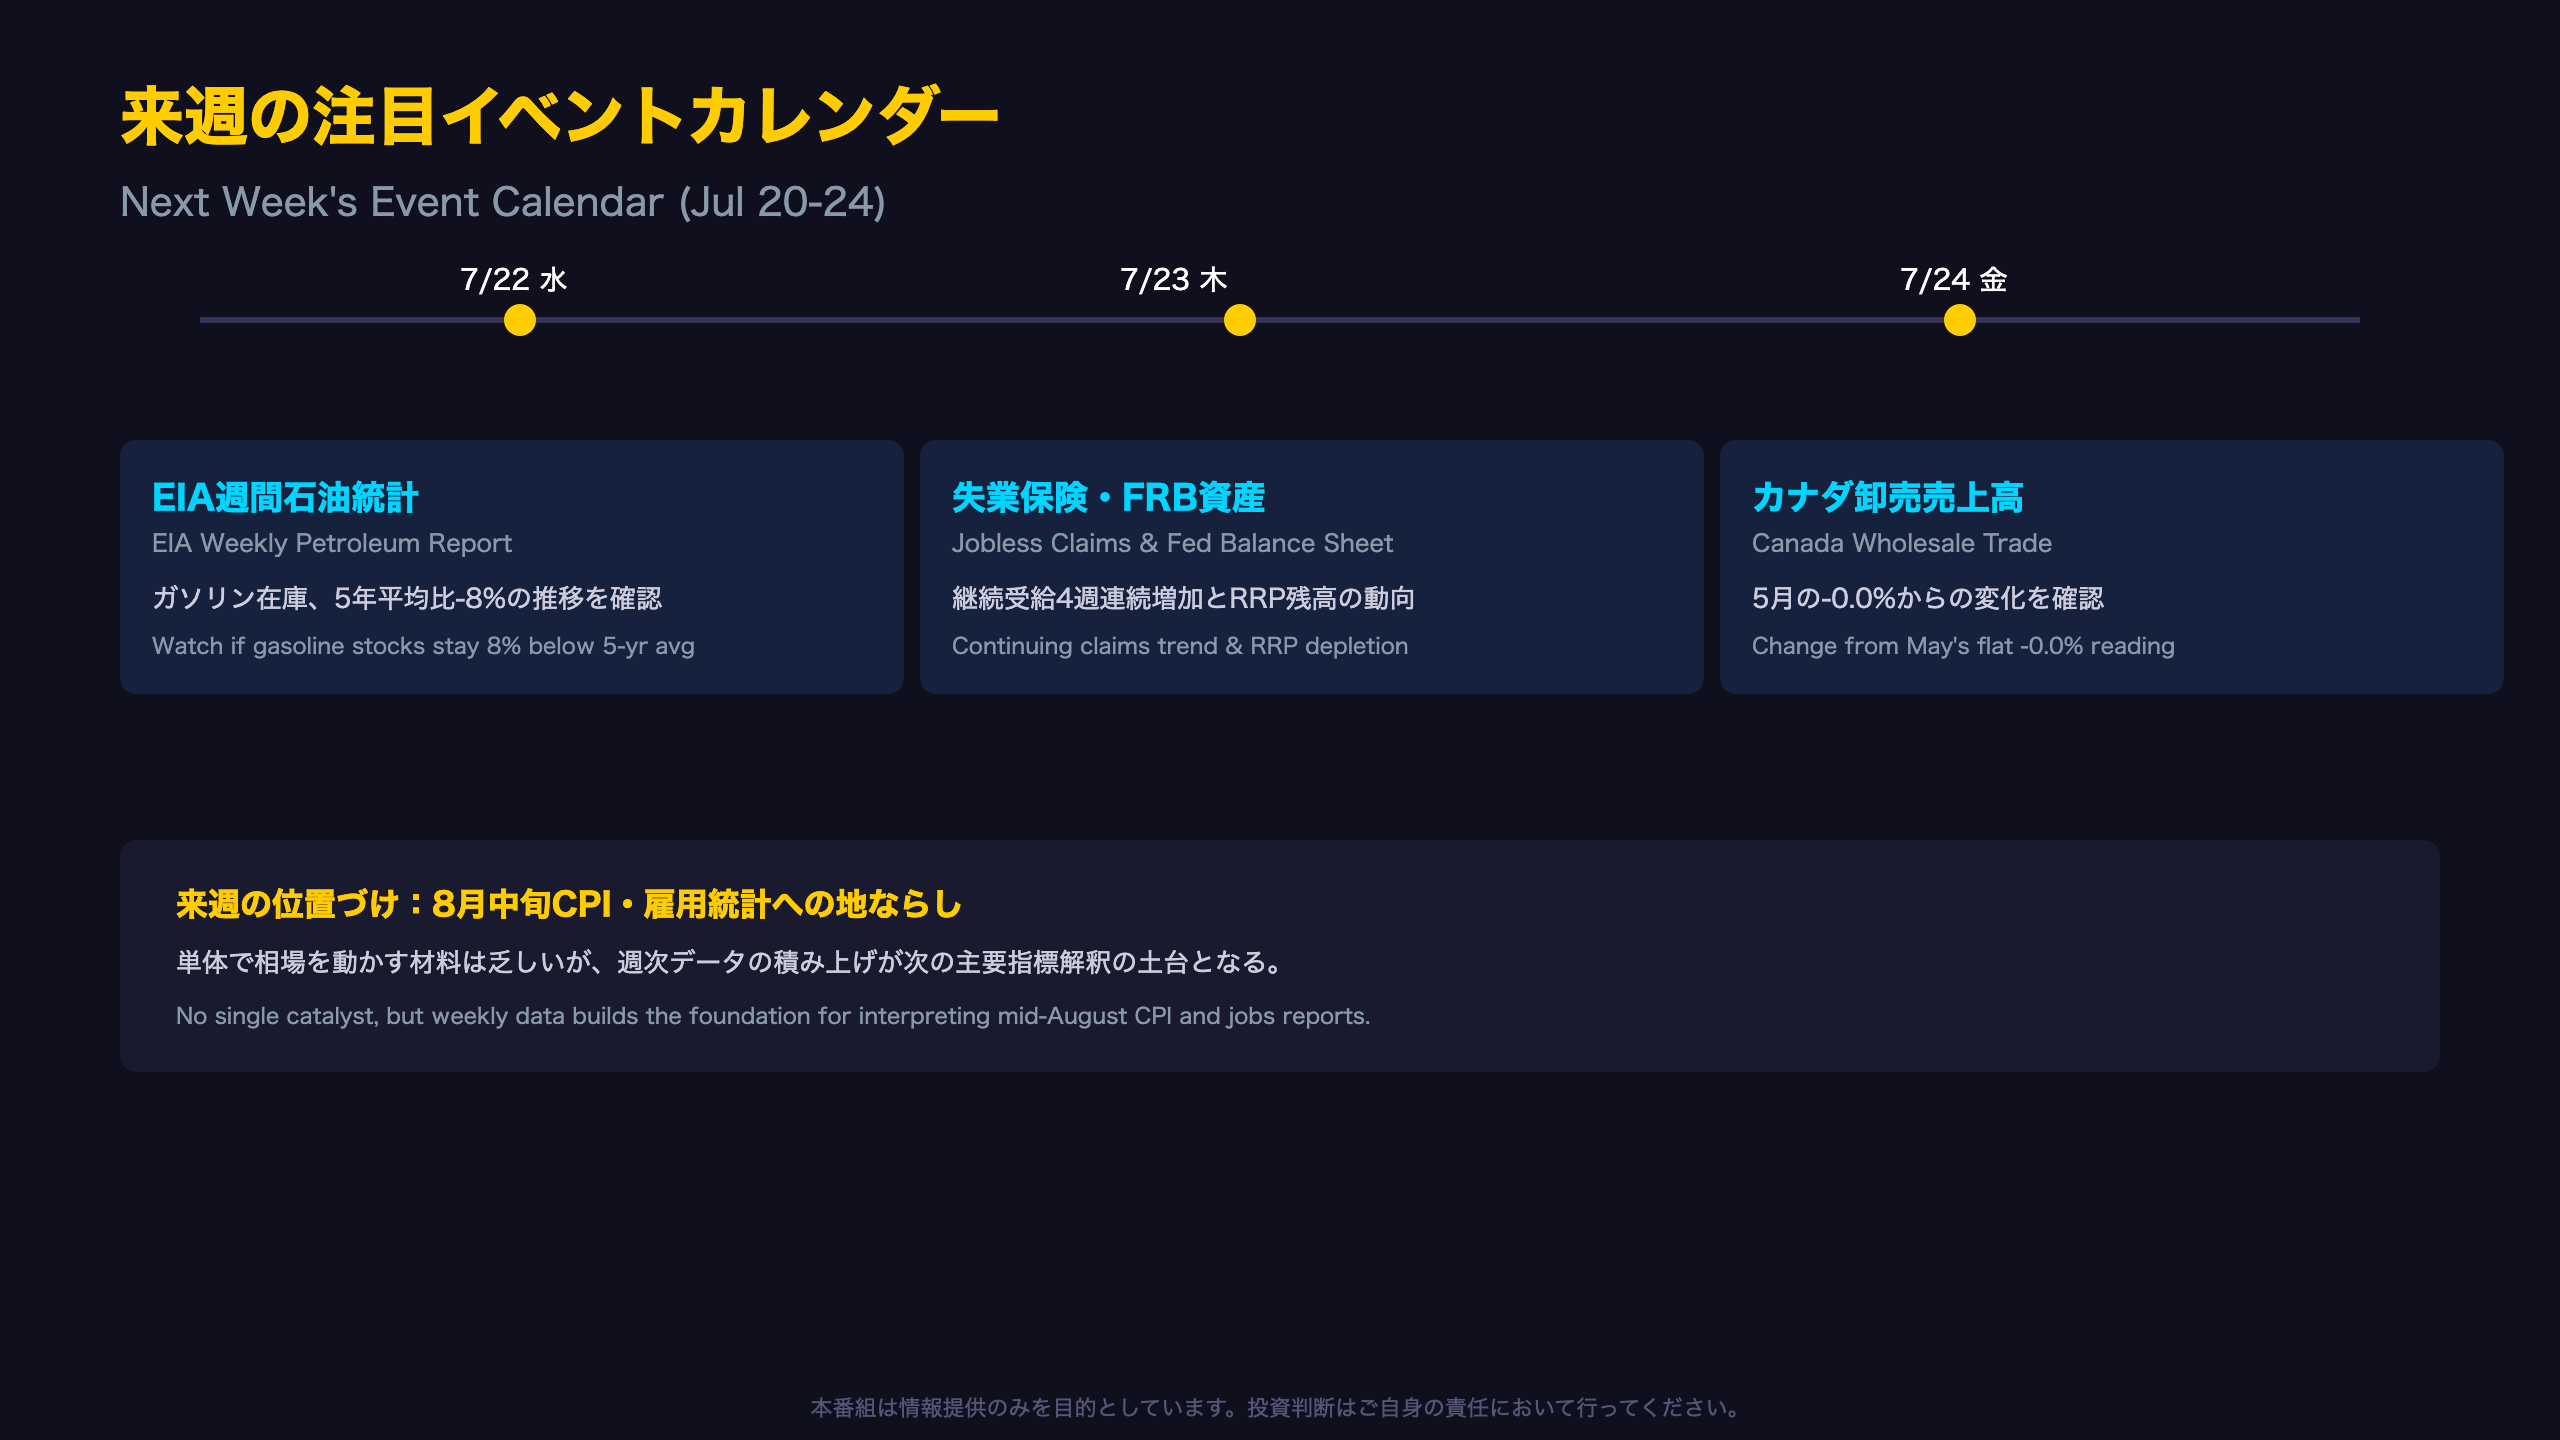
While next week (Jul 20-24) lacks major central bank meetings or headline data releases, the accumulation of weekly statistics carries meaningful signal value for the weeks ahead.
Event Calendar
| Date | Event | What to Watch |
|---|---|---|
| Jul 22 (Wed) | EIA Weekly Petroleum Report | Whether gasoline stocks, 8% below 5-yr avg, tighten further |
| Jul 23 (Thu) | DOL Initial/Continuing Claims | Whether the 4-week rise in continuing claims persists |
| Jul 23 (Thu) | Fed H.4.1 Balance Sheet | Whether the $34.8B RRP balance stabilizes or keeps shrinking |
| ~Jul 23 (Thu) | MOF Securities Flow Data | Whether foreign buying of Japanese equities continues |
| Jul 24 (Fri) | Canada Wholesale Trade (flash, June) | Change from May’s near-flat -0.0% reading |
Chains of Reasoning to Watch
EIA data: If gasoline inventories stay ~8% below the five-year average → tighter supply-demand balance could pressure summer gas prices higher → this would be a watch item for the energy component in the next CPI report.
Fed H.4.1: As the reverse repo (RRP) facility nears depletion → the short-term liquidity “shock absorber” weakens → reserve balance fluctuations could transmit more directly to short-term rates like SOFR, raising the risk of transient repo market stress (a dynamic reminiscent of September 2019).
Continuing claims: If the four-week uptrend persists → generally understood to signal slower re-employment, though this single data point cannot confirm a broader labor market turning point → confirmation from the next payrolls report would be needed.
Bottom Line
No single event next week is likely to move markets dramatically on its own, but together these releases lay the groundwork for interpreting the CPI and employment reports due in mid-August. For international readers: the Fed’s H.4.1 report and reverse repo facility are technical plumbing indicators similar in spirit to the ECB’s TLTRO reporting, worth monitoring for early signs of money market stress.
Disclaimer: This article is for informational purposes only. All investment decisions are made solely at your own risk.