
This article was automatically generated by the NFC Market Live AI analysis system. (Updated: 2026-07-18 16:34 JST)
📄 Primary Source
米国労働省(DOL)— 新規失業保険申請件数
https://www.dol.gov/newsroom/releases/eta/eta20260716
米国エネルギー情報局(EIA)— 週間石油状況レポート
https://www.eia.gov/petroleum/supply/weekly/pdf/highlights.pdf
連邦準備制度理事会(FRB)— H.4.1 バランスシート
https://www.federalreserve.gov/releases/h41/current/h41.htm
📊 Deep dive into this week’s 3 major US macro data releases
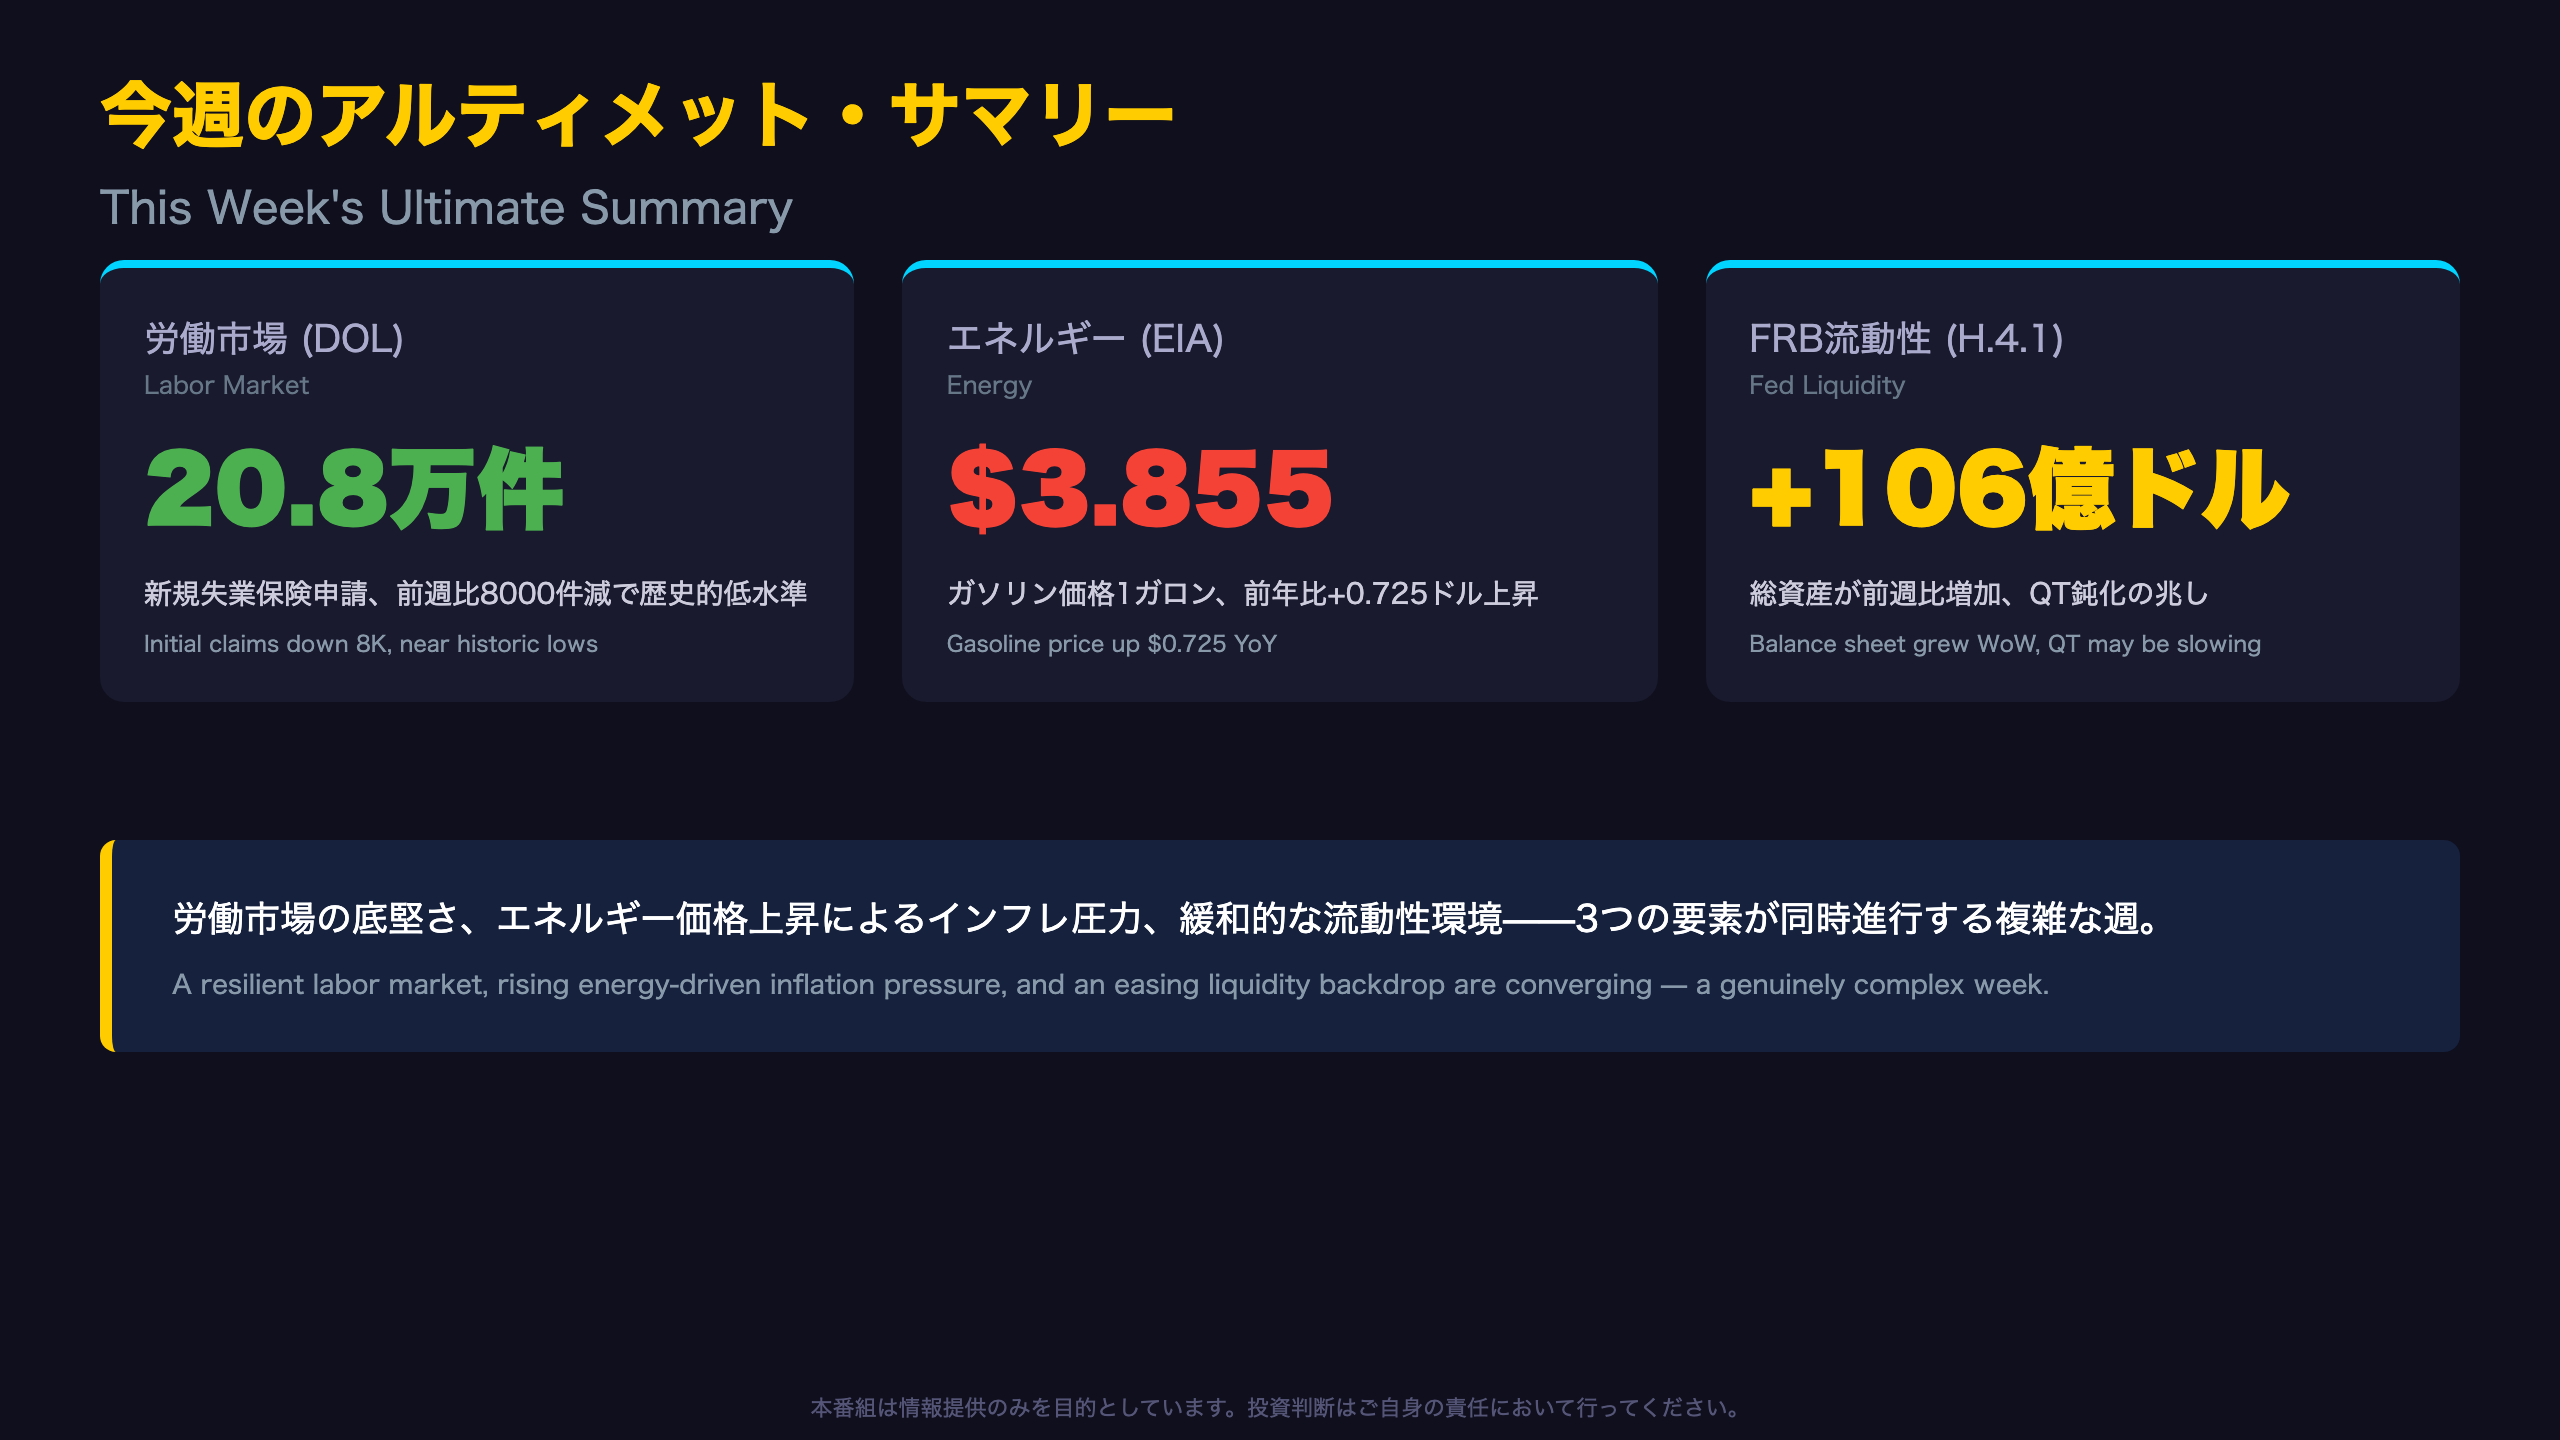
DOL initial jobless claims fell to 208,000, down 8,000 from last week and near historic lows.
But EIA data shows gasoline prices jumped to $3.855/gallon, up $0.725 YoY.
The Fed’s H.4.1 balance sheet grew $10.6B week-over-week, hinting at a possible pause in QT.
💡 Resilient labor market + rising energy-driven inflation pressure + easing liquidity conditions — three forces moving in different directions.
⚠️ Next week’s CPI and jobs data could clarify the picture.
This video cross-analyzes all three indicators and outlines key scenarios to watch.
今週のアルティメット・サマリー
Cross-Checking with the Weekly HMM Regime Model
According to the underlying regime-detection model referenced in this report, the US macro environment has remained in Regime “R2” with 100% probability for five consecutive weeks, and the within-regime centroid distance is flat at 1.6145 — suggesting no structural break has been detected yet.
“Transition probability for next week: R2 → R2 at 99.7%”
However, one anomaly stands out: the EIA weekly total petroleum products supplied metric registered a Z-score of 3.47 (flagged red), a significant deviation from this regime’s typical pattern. CPI subcomponents tied to gasoline (+26.7% YoY) and energy (+15.7% YoY) also show elevated Z-scores, suggesting an energy-price-driven inflation channel that the regime model may not yet be fully capturing.
Three Indicators, Three Different Temperatures
| Indicator | Signal | Direction |
|---|---|---|
| Labor Market | Claims near historic lows | Resilient |
| Energy | Prices up >20% YoY | Inflation watch |
| Fed Liquidity | Balance sheet growing YoY | Easing |
The fact that these three signals are not converging into a single simple narrative — either “boom” or “bust” — is arguably the most important structural feature of this week’s data. Whether the energy-driven price pressure feeds into core CPI next month will be a key thing to watch.
労働市場の現在地(DOL詳細)
The Widening Gap in Continued Claims
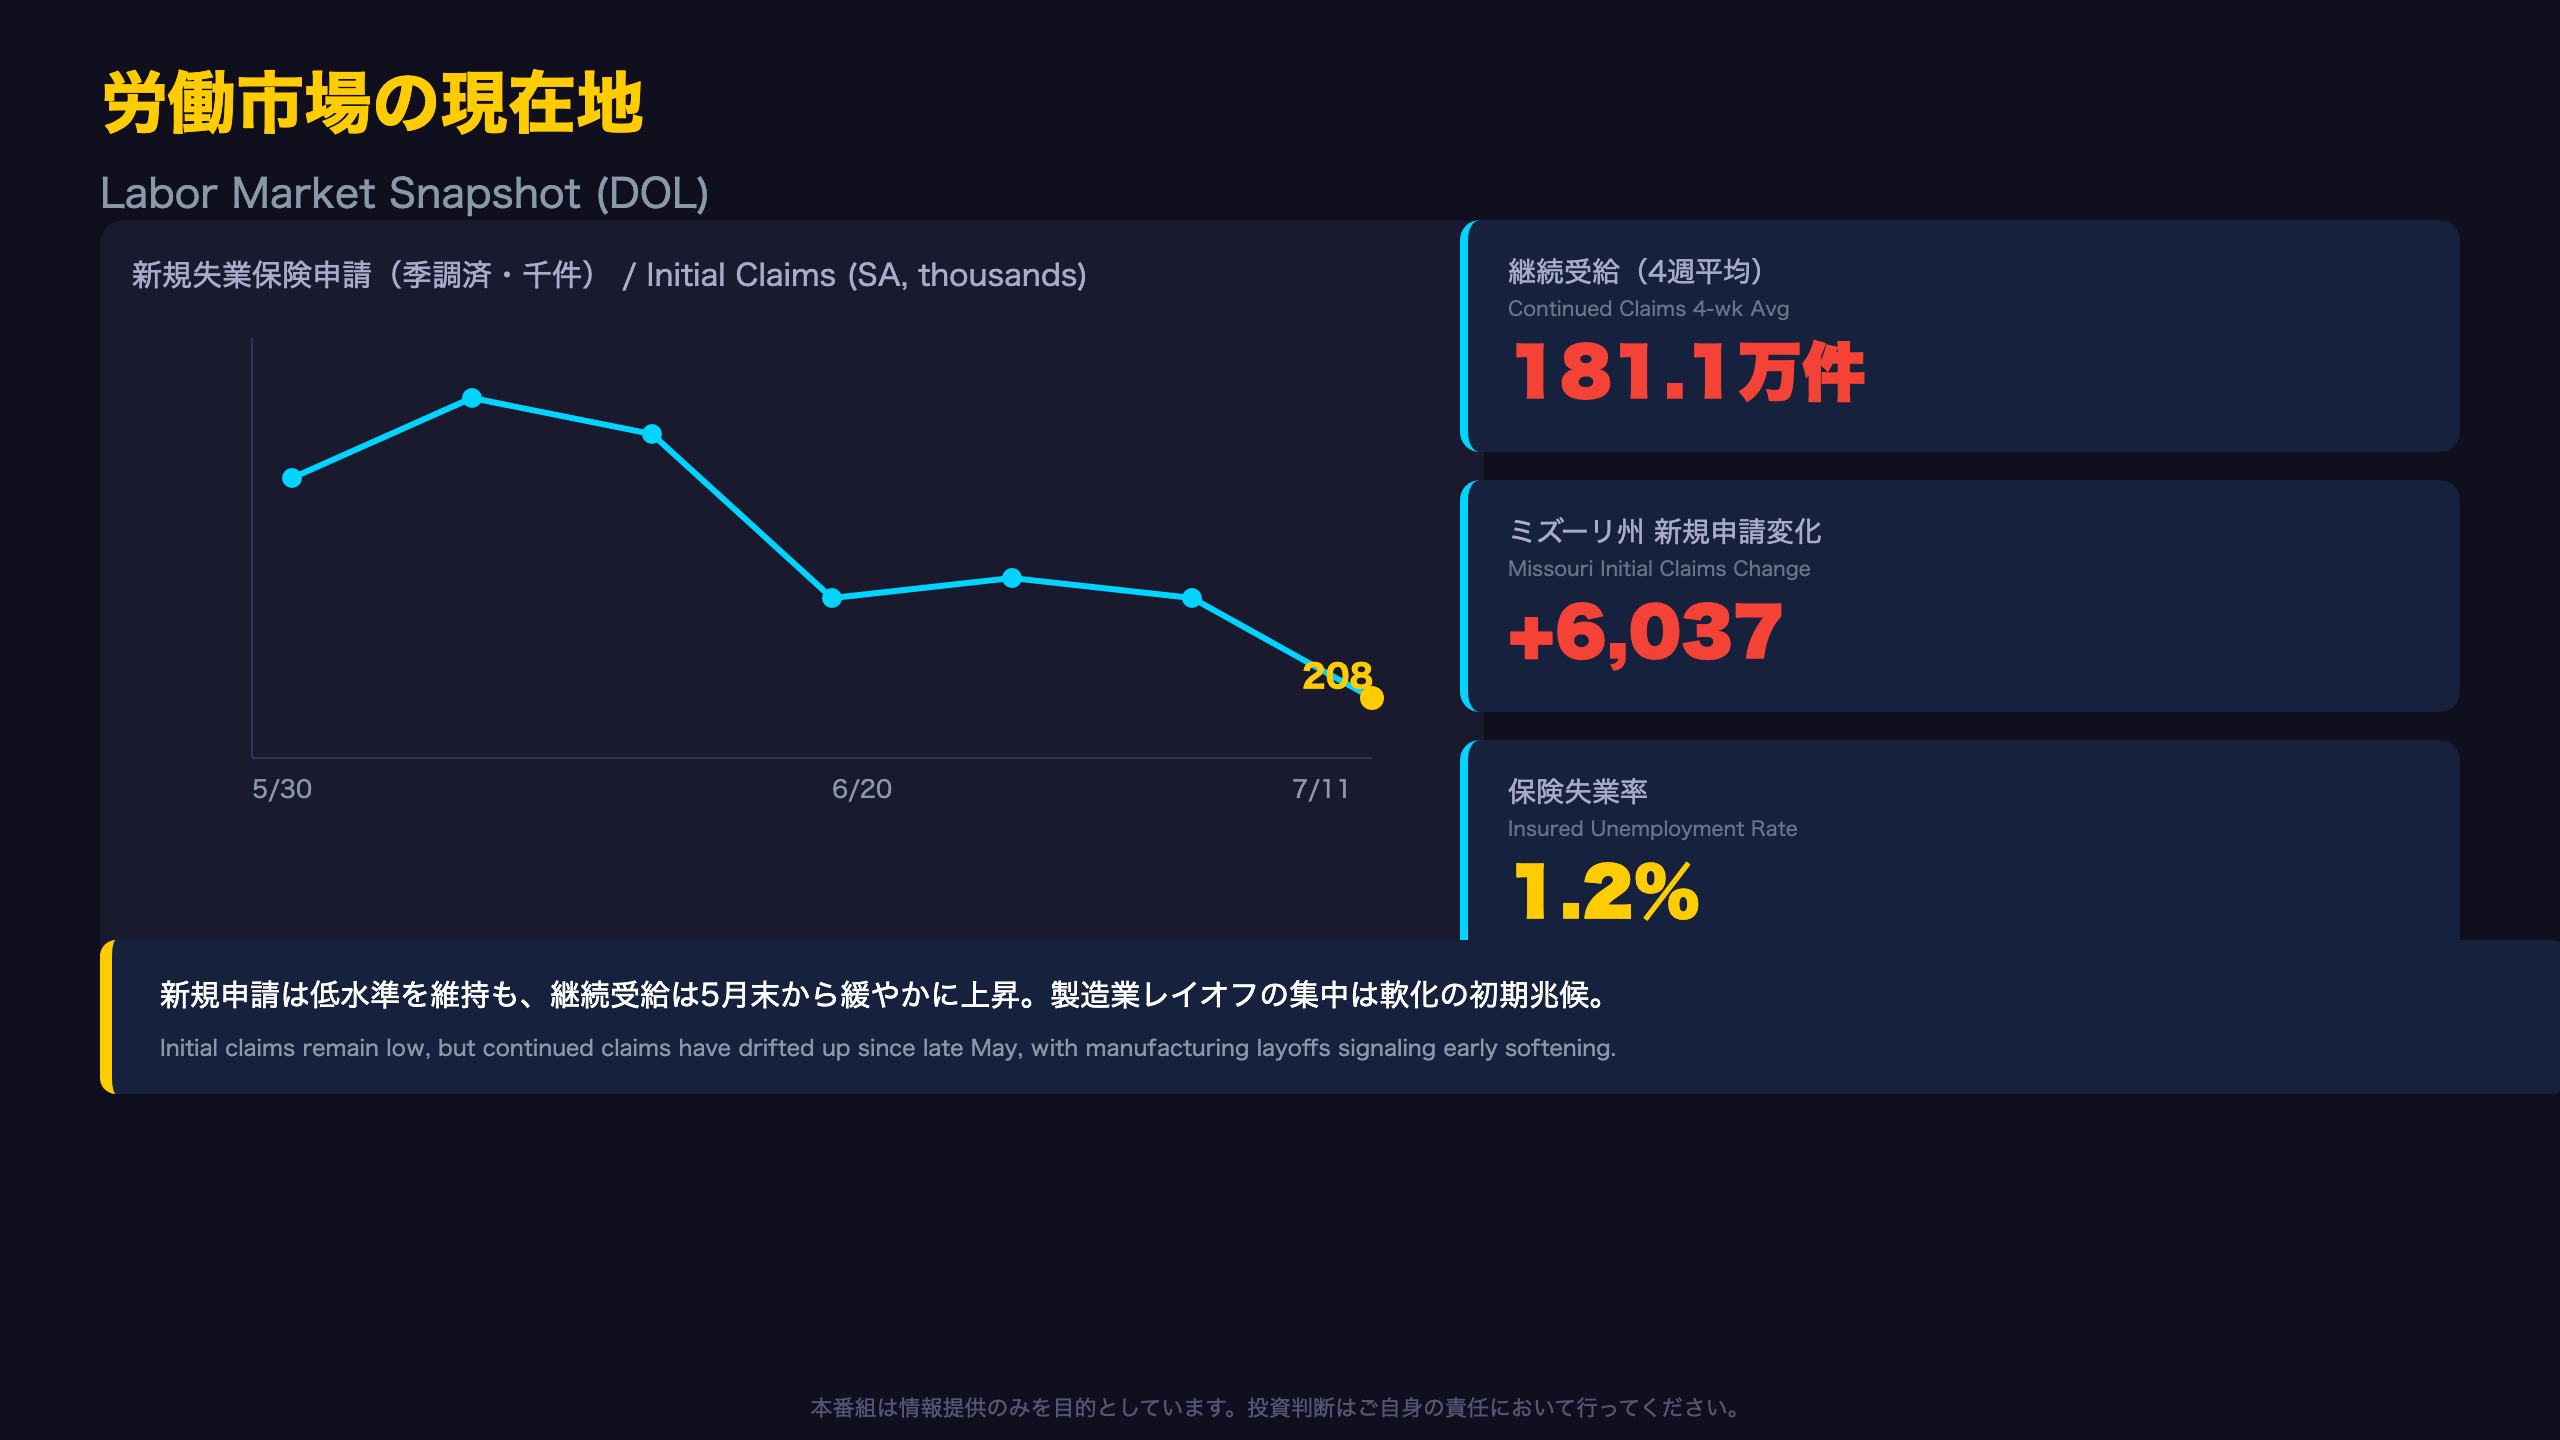
Seasonally adjusted continued claims came in at 1,805,000, nearly 7% below the year-ago figure of 1,941,000. On the surface, this reads as “the labor market is tighter than a year ago.” But the recent trend tells a slightly different story.
| Week | Continued Claims 4-wk Avg (thousands) |
|---|---|
| Apr 25 | 1,787.75 (YTD low) |
| Jun 6 | 1,785.50 |
| Jun 27 | 1,809.75 |
| Jul 4 | 1,811.00 |
Since bottoming in late April, the 4-week average has crept up roughly 23,000 over seven consecutive weeks. Even though the absolute year-over-year level remains low, the directional trend is worth watching.
A Mixed State-Level Picture
The DOL’s state-supplied comments cite “layoffs in manufacturing industry” explicitly for Missouri and Michigan, while Florida and Pennsylvania report “fewer layoffs” in construction and other sectors — a genuinely mixed regional and sectoral picture, not a uniform trend.
For context, US initial claims are compared against a base of roughly 153.7 million covered workers (per BLS), making the insured unemployment rate a useful cross-check: it remains flat at 1.2%, unchanged for months — a sign of underlying labor market stability even as continued claims drift higher. The next release is due next Thursday at the same time.
エネルギー需給の現在地(EIA詳細)
The Overlooked Propane Build
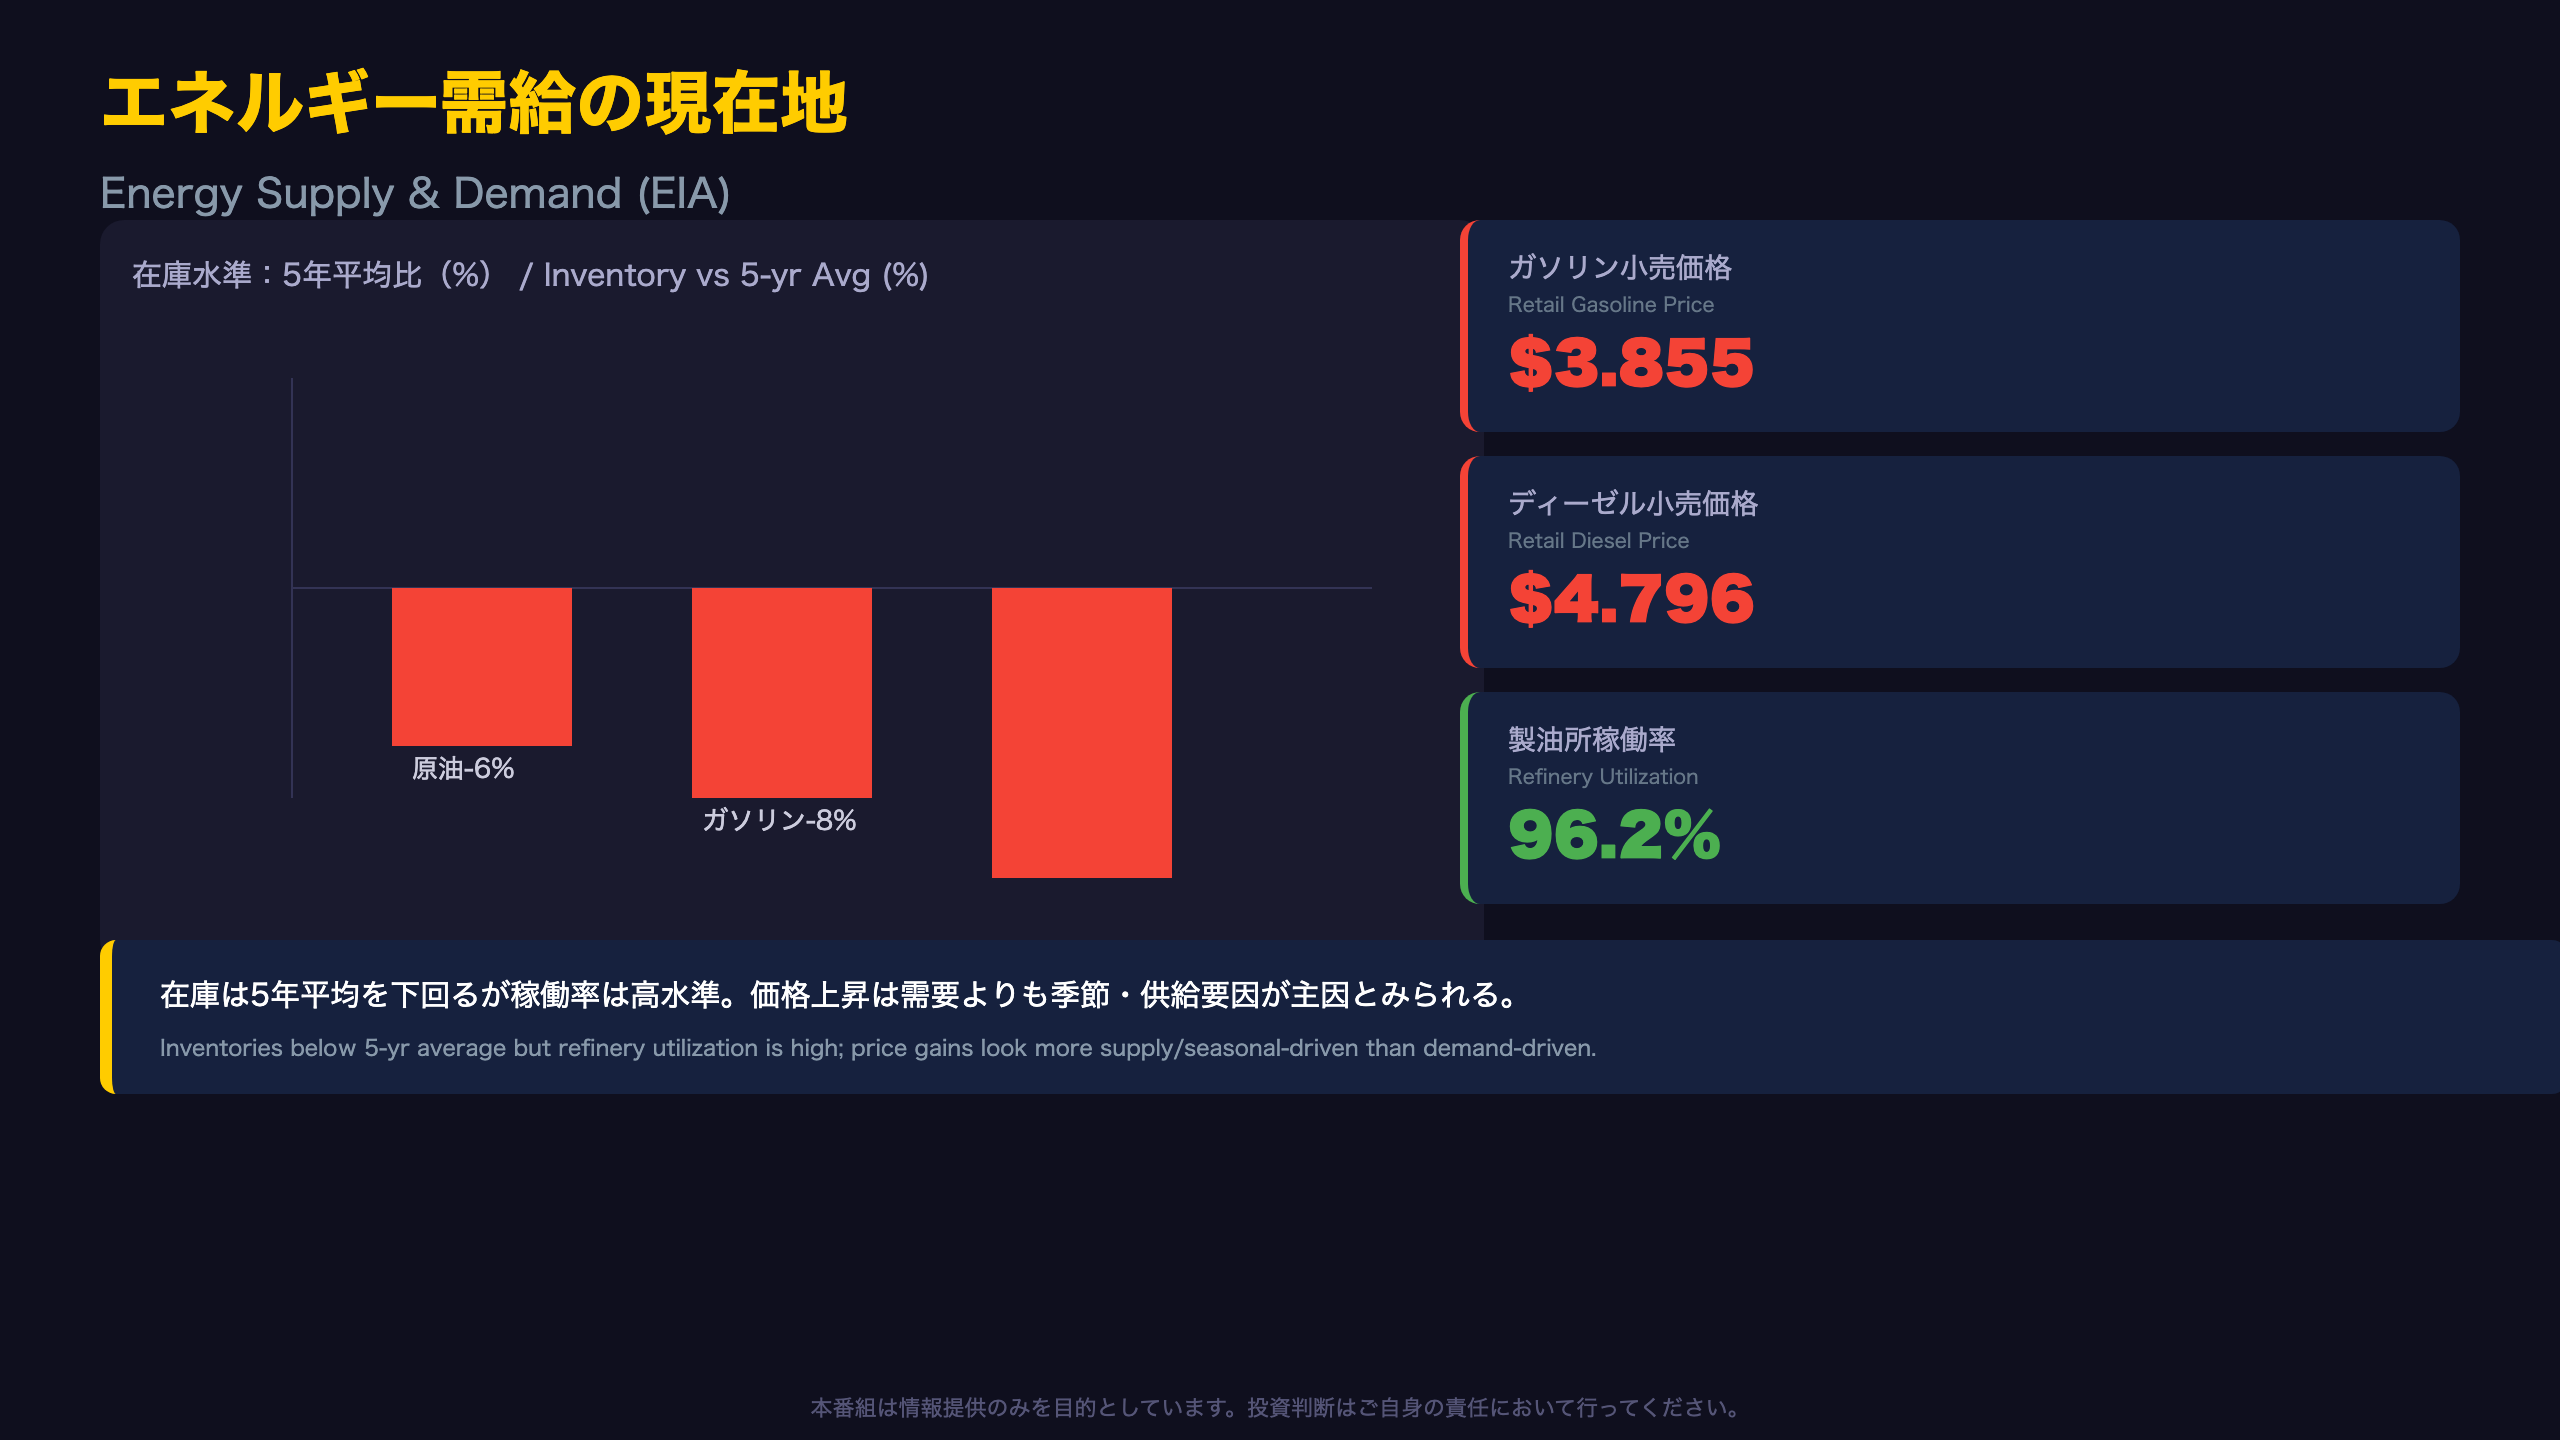
Often overshadowed by gasoline and diesel headlines, propane/propylene inventories jumped 3.0 million barrels week-over-week and now sit 28% above the five-year average — a signal that overall petroleum product supply is not universally tight.
“Total commercial petroleum inventories increased by 13.3 million barrels last week.”
This propane surge is a major contributor to that 13.3-million-barrel headline build in total commercial inventories.
Spot vs. Retail: A Meaningful Gap
Spot conventional regular gasoline at NY Harbor traded at $2.966/gallon (vs. $2.208 a year ago), while the national retail average sits at $3.855. That roughly $0.89 gap reflects taxes, distribution margins, and regional variation — a reminder that a spot-price rally doesn’t translate one-for-one into consumer inflation. For context, US retail gasoline prices are a key input into the CPI’s energy component, unlike in many European economies where fuel taxes dominate pricing and dampen the pass-through of crude moves.
The Import and SPR Angle
Crude oil imports averaged roughly 5.5 million barrels per day over the past four weeks, down 12.2% year-over-year, while Strategic Petroleum Reserve stocks continued drawing down to 316.5 million barrels. Domestic supply is being balanced through a combination of reduced imports and continued SPR drawdowns rather than purely organic production growth.
The next EIA weekly report is due next Wednesday — watch whether refinery utilization pushes above 97%, a key gauge of how much peak summer demand is still driving the system.
FRB流動性の現在地(H.4.1詳細)
What a Shrinking RRP Facility Signals
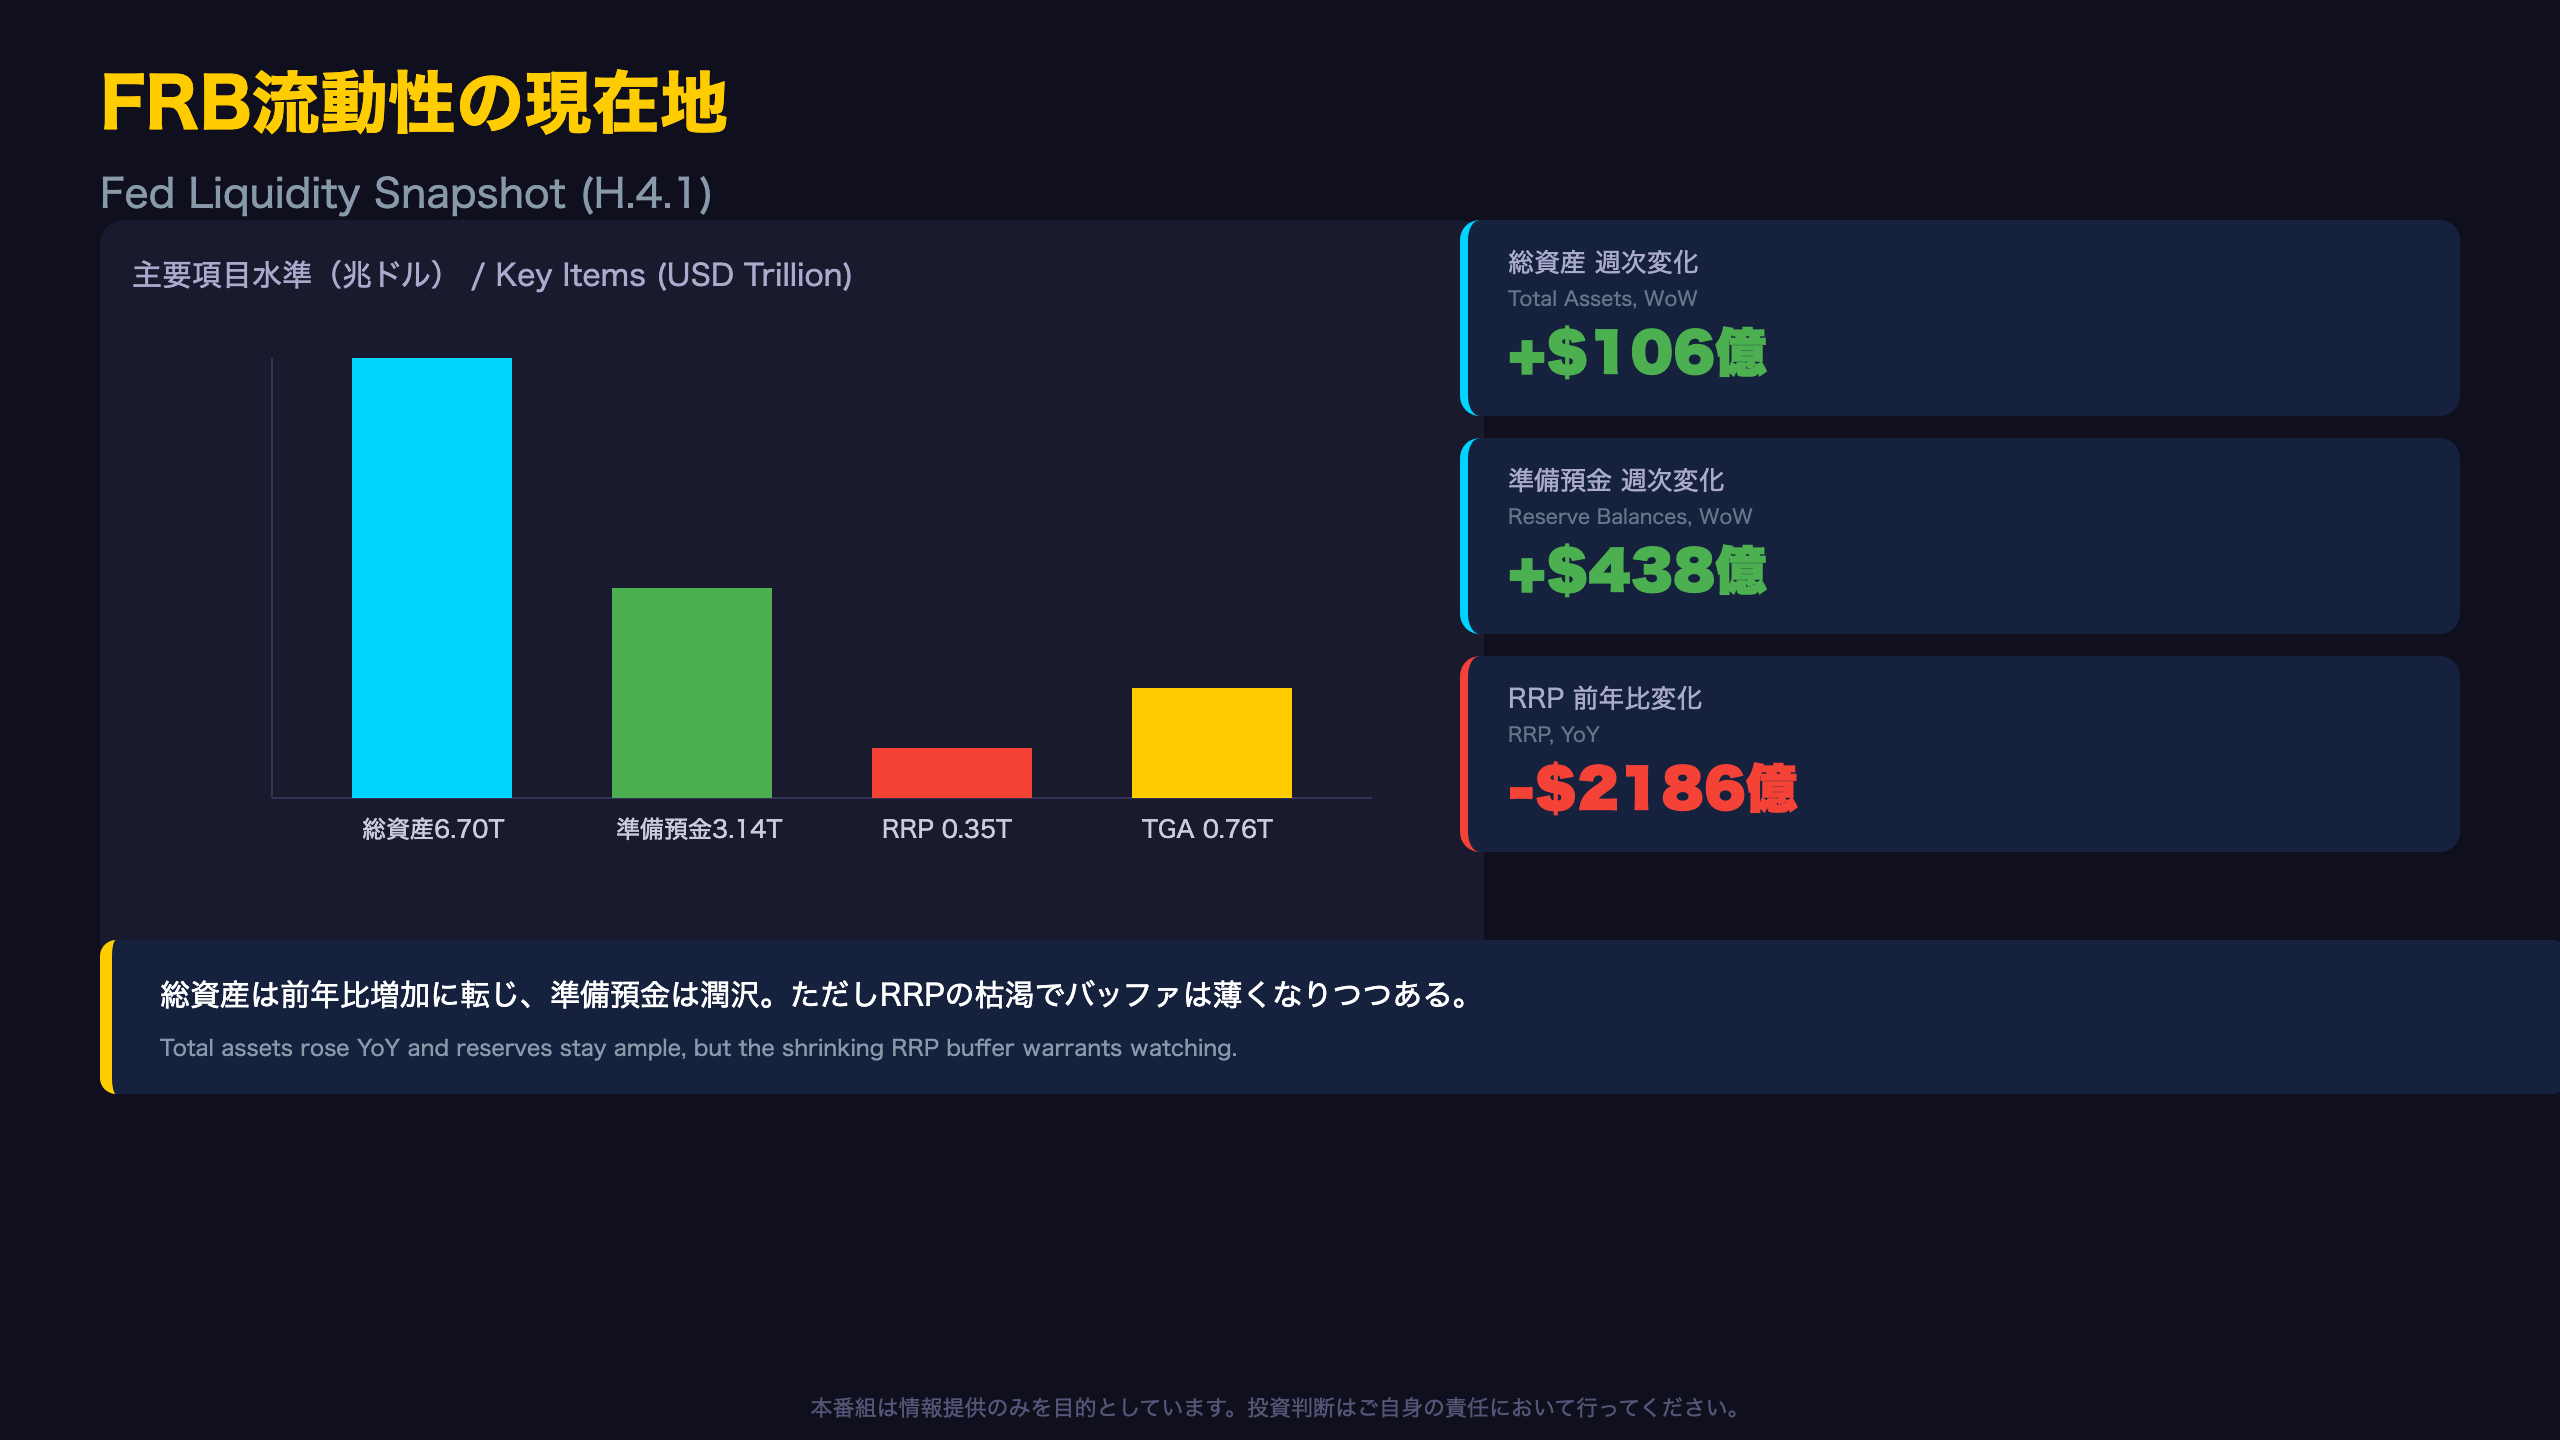
The Fed’s reverse repo (RRP) facility has long served as a safety valve, absorbing excess cash from money market funds. Having once exceeded $2 trillion at its peak, the RRP balance has now shrunk to $348.3 billion (with the “Others” component collapsing to just $1.233 billion).
“Reverse repurchase agreements: $348,302 million (Others: $1,233 million).”
As the RRP facility approaches exhaustion, the short-term funding market loses a key buffer, meaning swings in reserve balances can transmit more directly into short-term rates like SOFR — a structural shift reminiscent of the vulnerabilities seen during the 2019 repo market stress episode. For US-market-focused investors, this is analogous to watching the ECB’s deposit facility usage as a gauge of eurozone liquidity slack.
The TGA-Reserves Seesaw
The Treasury General Account (TGA) fell $17.8 billion week-over-week, which likely contributed to the $43.8 billion rise in reserve balances. A TGA drawdown temporarily boosts reserves, but if the Treasury resumes building cash via new bond issuance, reserves would face renewed downward pressure — a dynamic closely watched by rates desks globally.
A Shift in Maturity Composition
By remaining maturity, Treasury holdings maturing “within 15 days” fell $9.9 billion this week while holdings in the “16 days to 90 days” bucket rose $7.7 billion, suggesting an ongoing roll from short-dated to intermediate maturities within the Fed’s portfolio.
The next H.4.1 release is due next Thursday — watch whether the TGA continues to fall and whether the RRP facility’s decline is finally stabilizing.
ストラテジスト総括:3指標の連関と来週の注目シナリオ

Chain of Evidence: Market Implications from This Week’s Data
[Fed total assets rose $10.6B WoW and $81.6B YoY] → [It is generally believed that a slower pace of quantitative tightening tends to ease overall financial conditions] → [However, this single data point alone cannot confirm QT has ended or reversed; confirmation requires tracking total assets over the coming weeks].
[RRP balances fell $218.6B YoY to $348.3B] → [A shrinking RRP facility is generally understood to mean swings in reserve balances transmit more directly into short-term rates] → [If the Treasury resumes rebuilding its General Account, temporary repo market tightness or upward pressure on short-term rates could follow].
[Gasoline prices rose $0.725, or roughly 23%, YoY] → [Rising energy prices are generally understood to push up headline CPI through the energy component] → [Whether this energy-driven pressure spills into core CPI will be the key thing to watch in next week’s inflation data].
Scenario Thresholds to Watch
| Scenario | Trigger | Implication |
|---|---|---|
| Soft landing continues | Continued claims plateau | Reaffirms labor market resilience |
| Cost-push concerns build | Gas prices rise + layoffs increase together | Inflation and demand softening simultaneously |
| Liquidity tightness risk | TGA rebuild resumes + RRP keeps shrinking | Upward pressure on short-term rates |
Next week’s CPI and employment reports should help clarify which of these scenarios is gaining the upper hand. As always, none of this constitutes investment advice — readers should consult their own financial advisors before making decisions.
Disclaimer: This article is for informational purposes only. All investment decisions are made solely at your own risk.