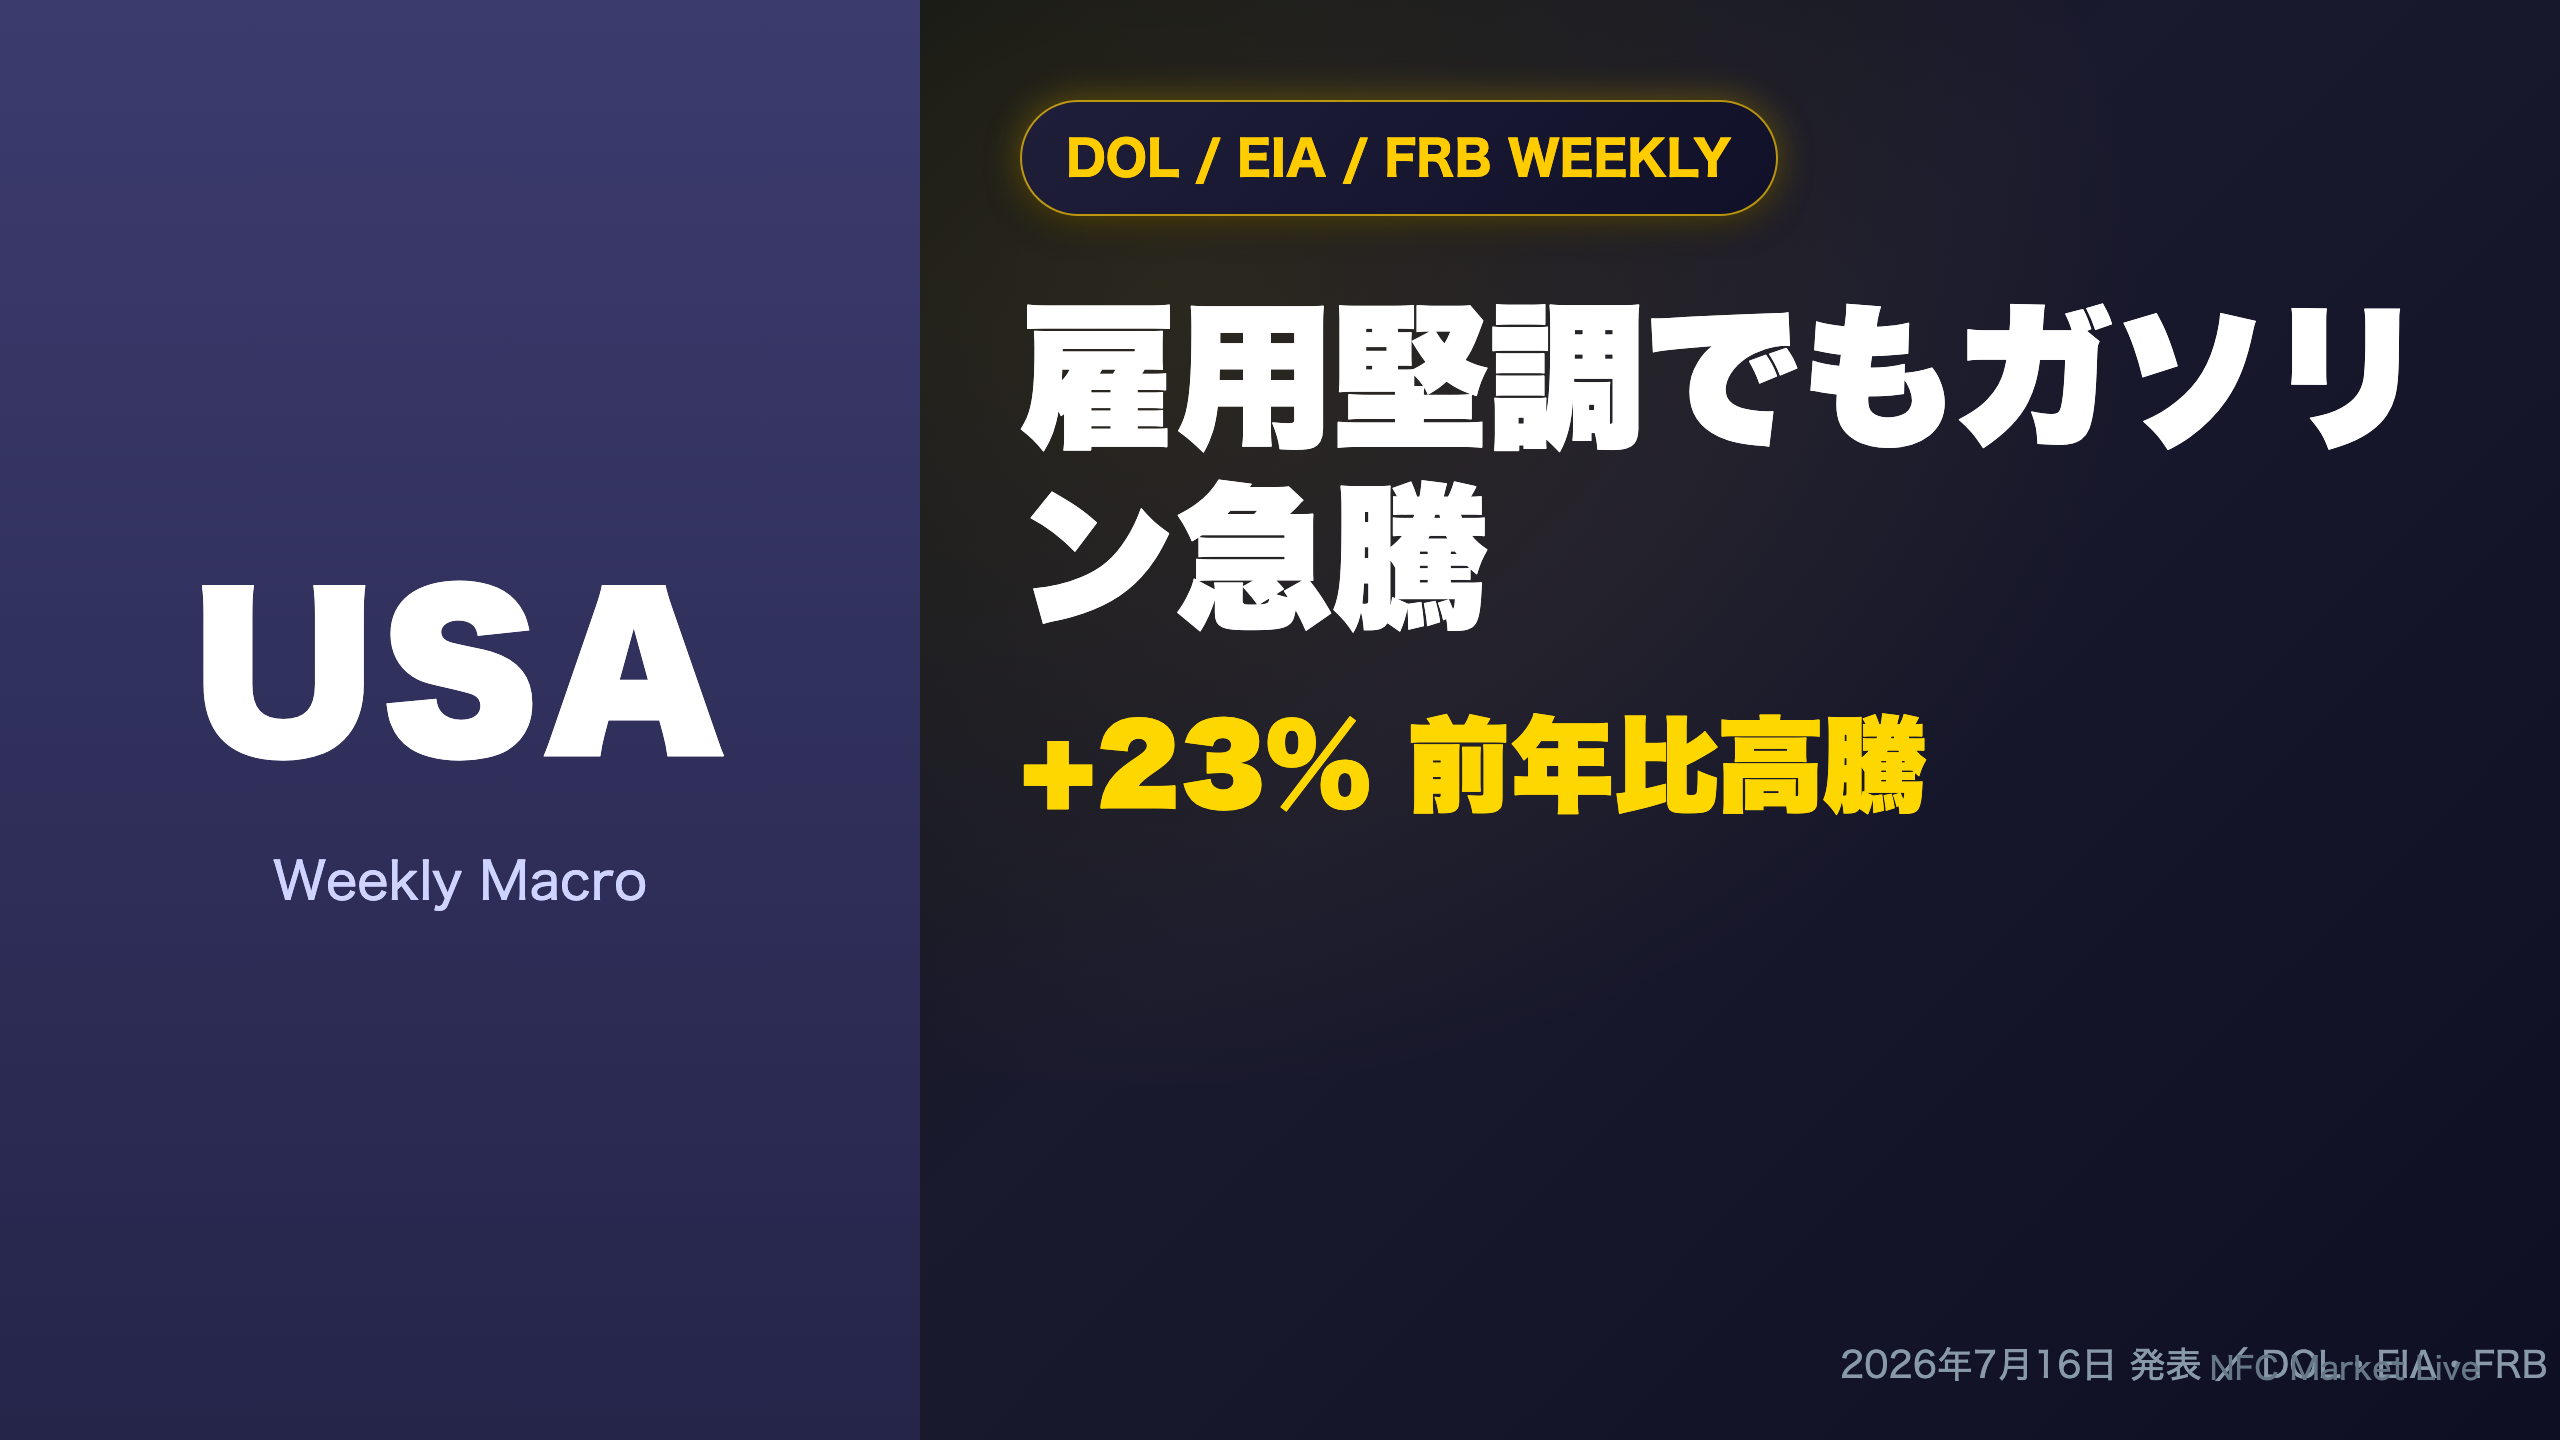
📺 Watch the Full Video Analysis
This article was automatically generated by the NFC Market Live AI analysis system. (Updated: 2026-07-18 07:10 JST)
📄 Primary Source
米国労働省(DOL)— 新規失業保険申請件数
https://www.dol.gov/newsroom/releases/eta/eta20260716
米国エネルギー情報局(EIA)— 週間石油状況レポート
https://www.eia.gov/petroleum/supply/weekly/pdf/highlights.pdf
連邦準備制度理事会(FRB)— H.4.1 バランスシート
https://www.federalreserve.gov/releases/h41/current/h41.htm
Breaking down this week’s 3 major US macro releases📊
Initial jobless claims fell 8,000 to 208,000, showing no broad layoff wave📉
Retail gasoline prices climbed 23% YoY to $3.855/gallon⛽
The Fed’s total balance sheet assets rose $83.8B YoY, suggesting QT’s real pace is milder than assumed💰
We unpack labor, energy, and liquidity signals from a strategist’s view and preview next week’s key risks⚠️
今週のアルティメット・サマリー
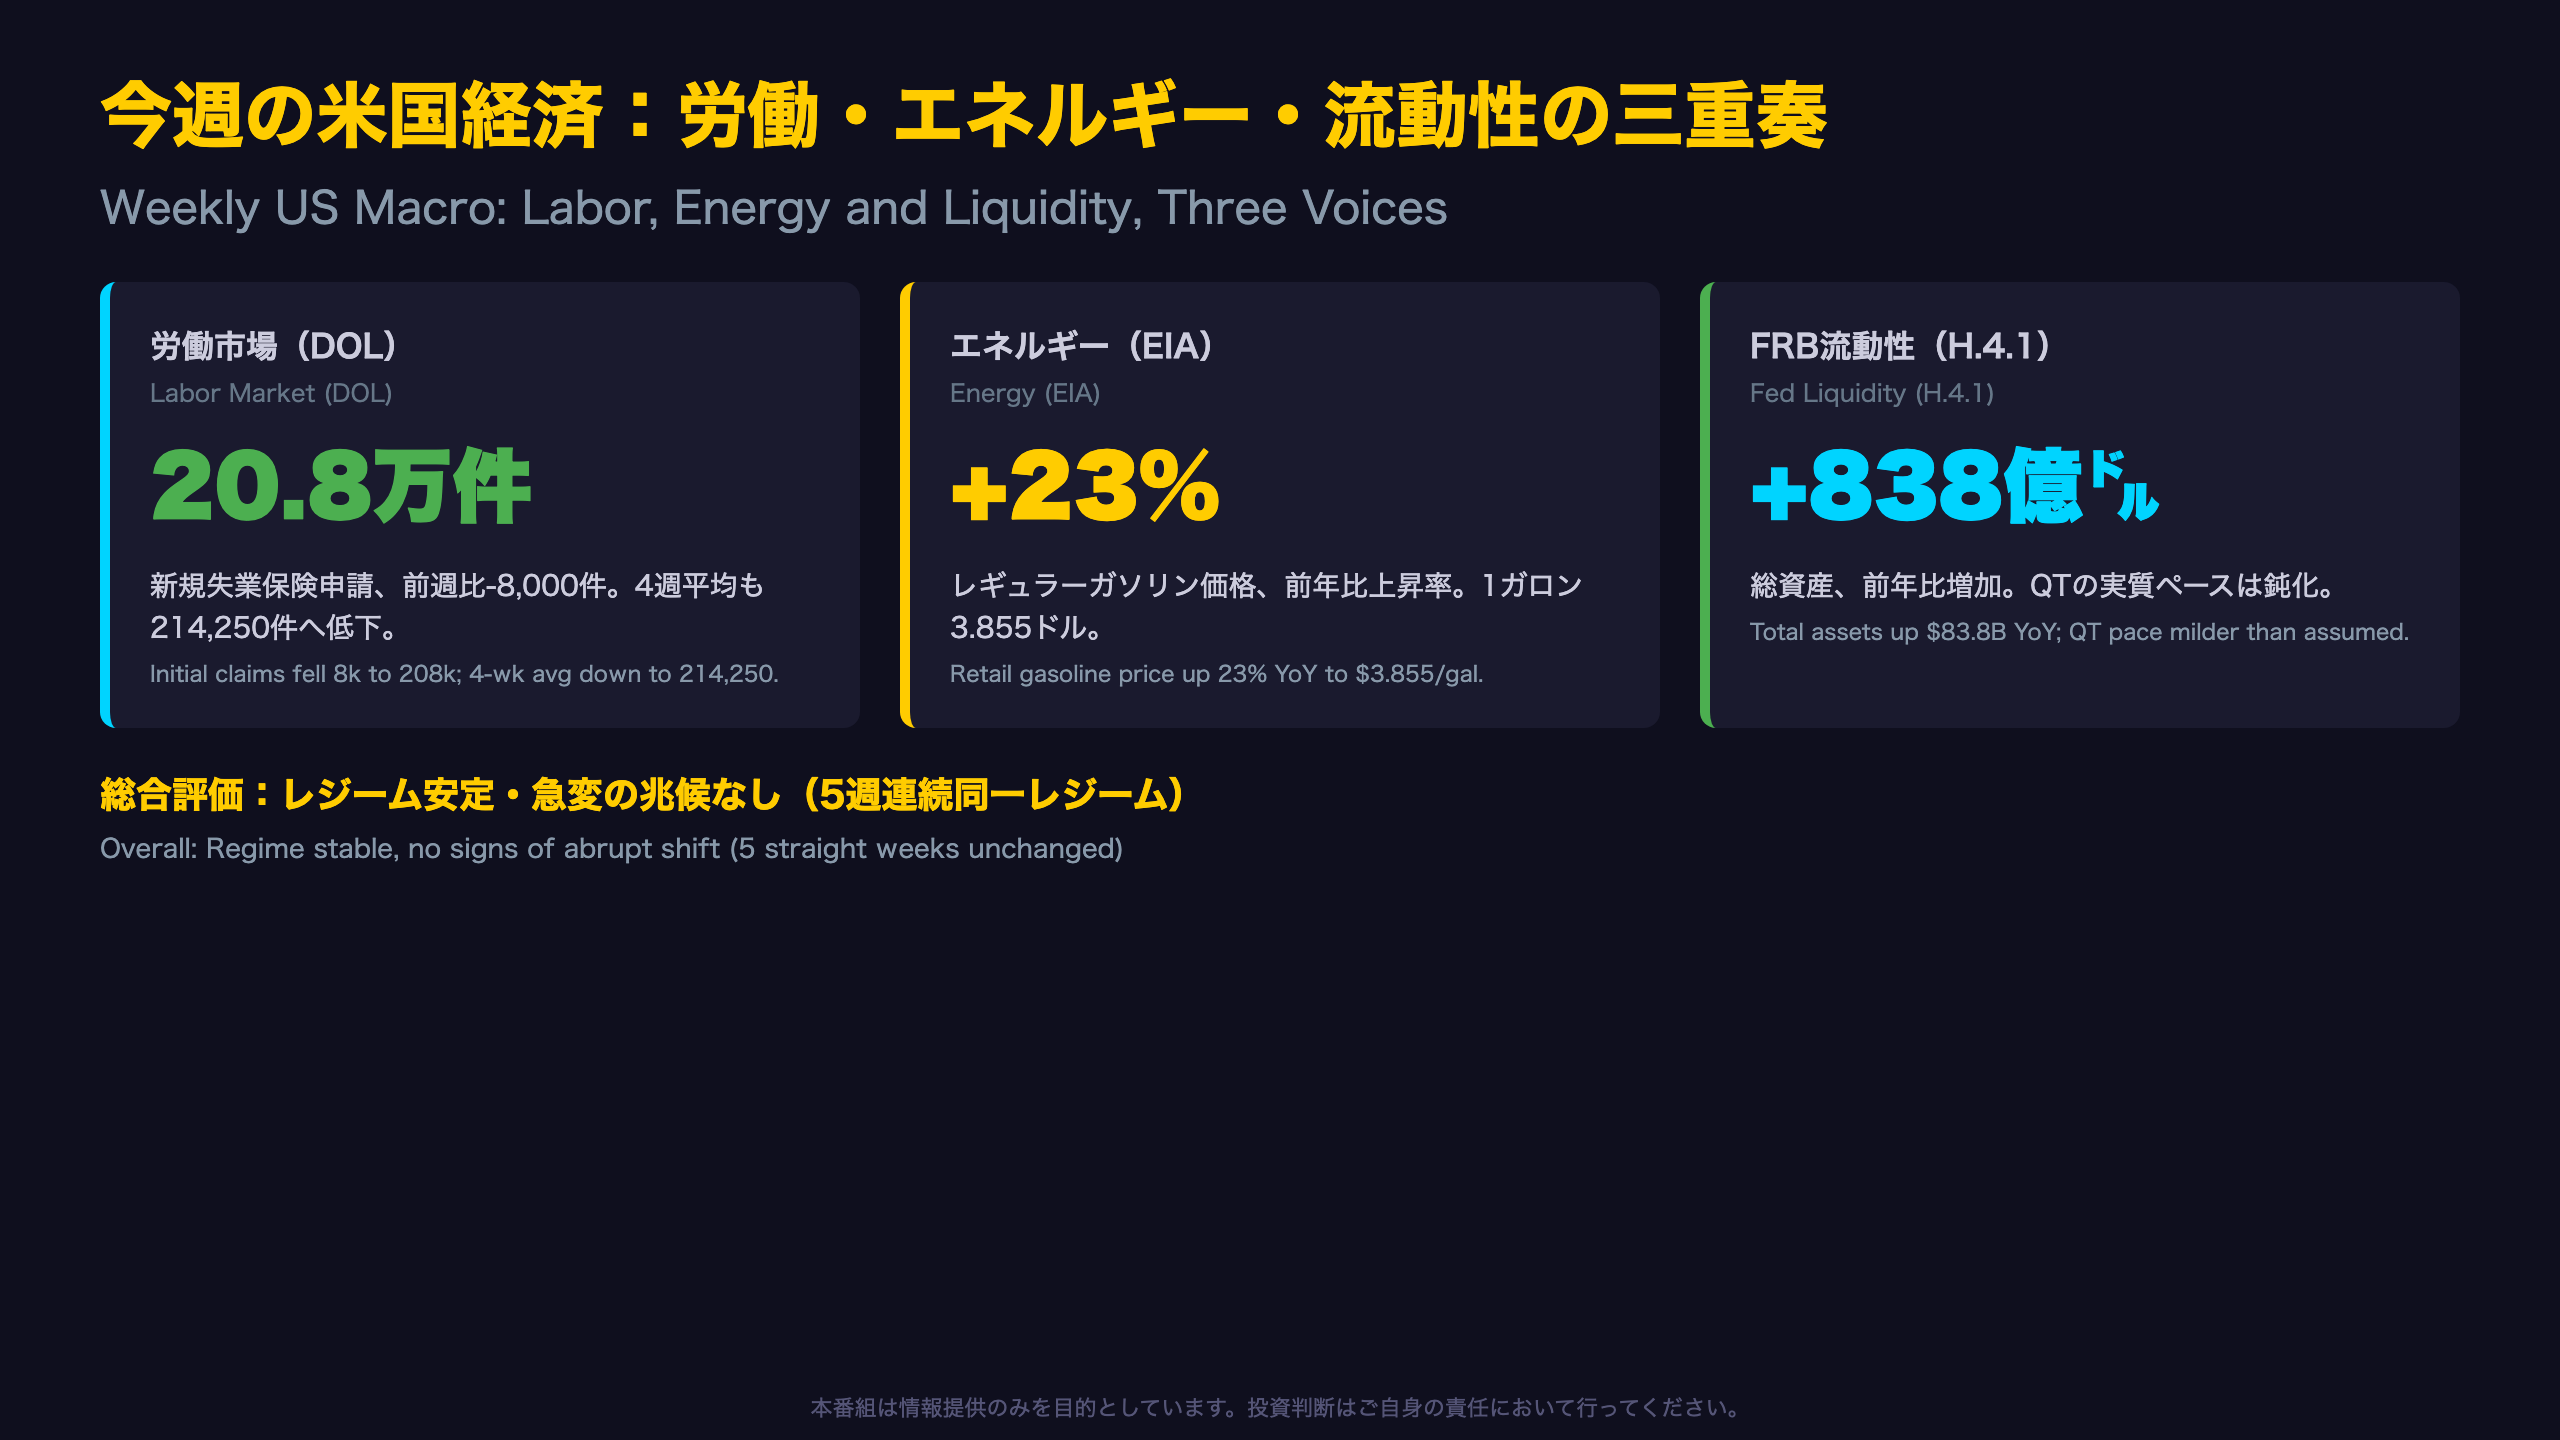
Three Signals, One Mixed Picture
This week’s U.S. data compilation spans three separate government releases — the Department of Labor’s weekly jobless claims, the Energy Information Administration’s Weekly Petroleum Status Report, and the Federal Reserve’s H.4.1 balance sheet statement — each published on a different weekly cadence but together forming a real-time pulse check on the U.S. economy.
Initial jobless claims of 208,000 sit near the low end of the past year’s roughly 190,000–236,000 range, and unadjusted claims rose only 8.3% versus a seasonally expected 12.6% increase — a sign the labor market is not deteriorating as fast as seasonal patterns would suggest.
On energy, retail gasoline reached $3.855/gallon, up 23.2% from $3.130 a year ago — a scale of increase that international readers should note is significantly larger than typical core inflation moves, underscoring how energy remains a distinct, volatile input into U.S. headline CPI (unlike, say, the EU’s harmonized index, where energy weighting and taxation differ).
Meanwhile, the Fed’s balance sheet — often assumed to be steadily shrinking under quantitative tightening — actually grew $83.8 billion year-over-year to $6.743 trillion, as Treasury bill purchases more than offset mortgage-backed security runoff.
For markets, this combination — resilient jobs, sticky energy inflation, and unexpectedly ample Fed liquidity — is not a simple bullish or bearish signal, but a set of crosscurrents worth tracking into next week’s employment and inflation data.
労働市場の現在地(DOL詳細)
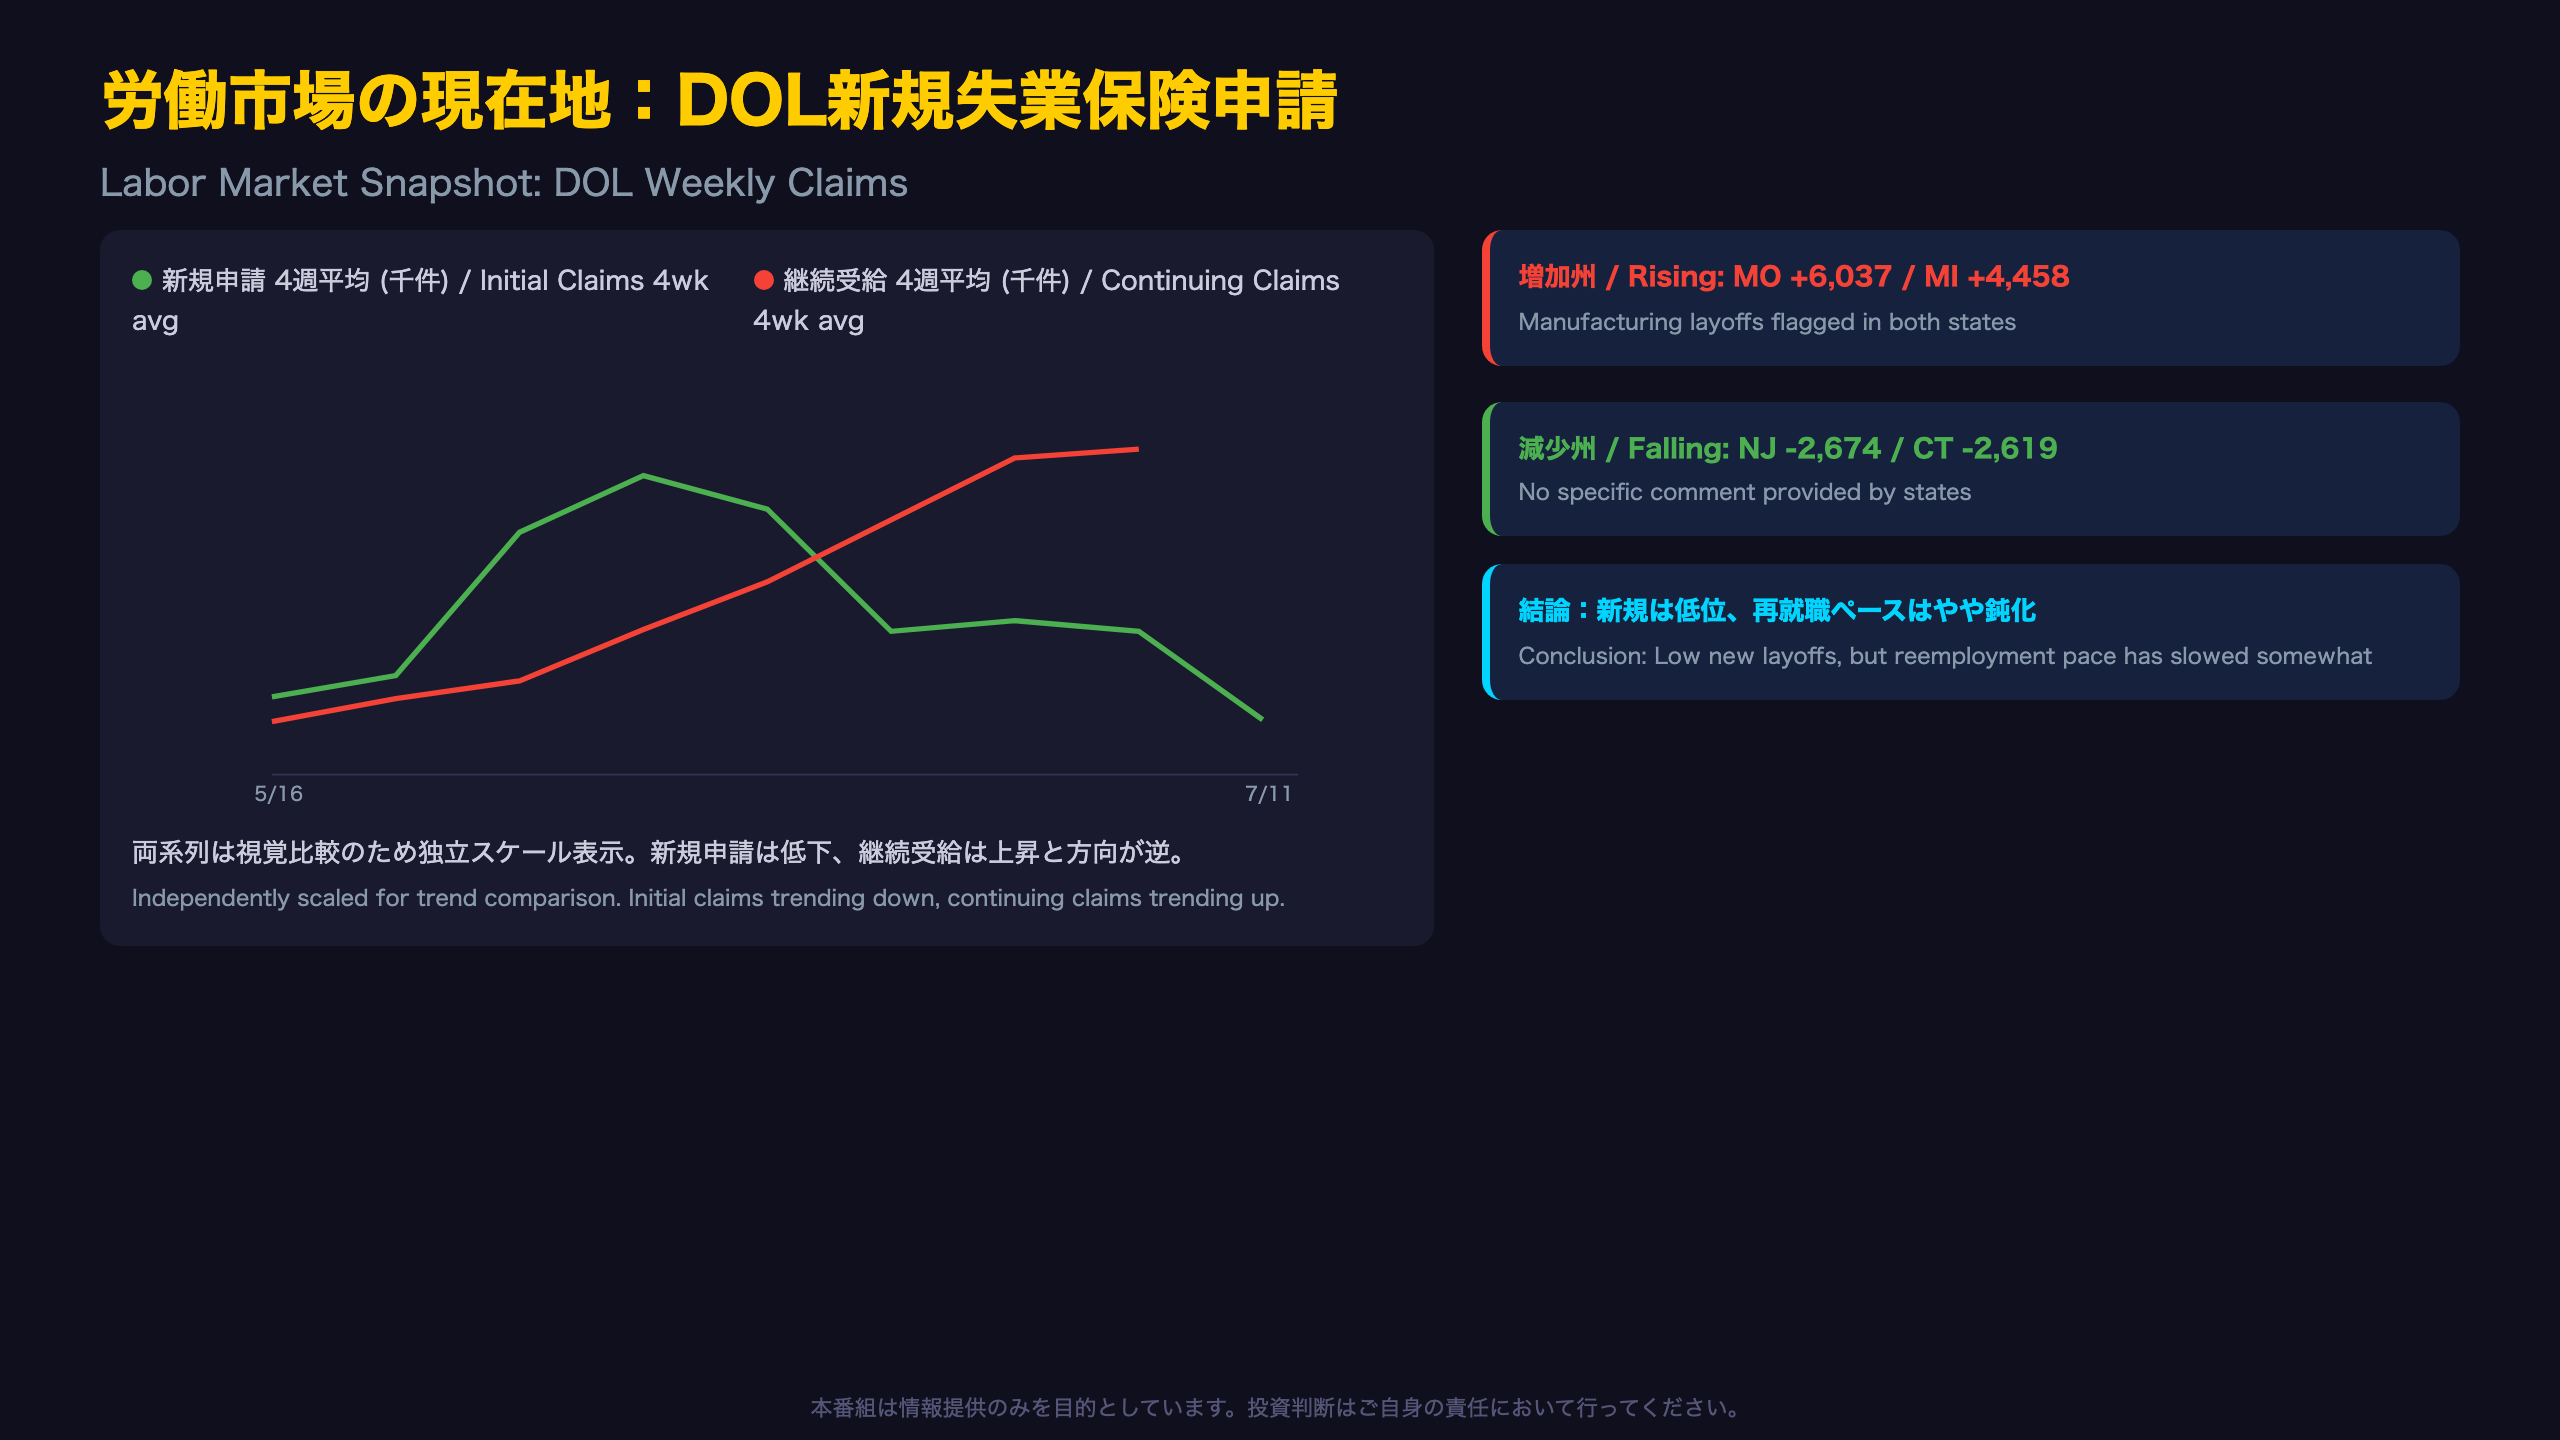
Beneath the Headline: A Quiet Crack in the U.S. Labor Market
The DOL’s weekly claims report is one of the most closely watched high-frequency labor indicators globally, similar in function to the UK’s Claimant Count, but published with just a one-week lag for initial claims. This week’s 208,000 seasonally adjusted initial claims sits within the past year’s range of roughly 190,000 to 236,000, and the four-week average of 214,250 is near the lower end — consistent with a labor market not shedding jobs at an alarming pace.
The more telling story lies in continuing claims (insured unemployment), which the DOL itself describes as a lagging-to-coincident indicator that “provides confirming evidence of the direction of the economy.” The four-week average has risen for four consecutive weeks, from 1,792,250 to 1,811,000 — a sign laid-off workers are taking longer to find new jobs, even as new layoffs remain contained.
State-level detail reinforces a bifurcated picture: manufacturing-heavy Missouri and Michigan saw notable claims increases, while New Jersey and Connecticut posted declines. Auxiliary regime-anomaly data also flag elevated long-term unemployment and a below-trend employment-to-population ratio (59.2% versus a 59.98% regime average), though as single-month readings these should be read as tentative, not confirmed trends.
For markets, this “low-fire, slow-hire” pattern is one reason the Fed may see little urgency to cut rates aggressively based on labor data alone — but it bears watching ahead of the next Employment Situation report.
エネルギー需給の現在地(EIA詳細)
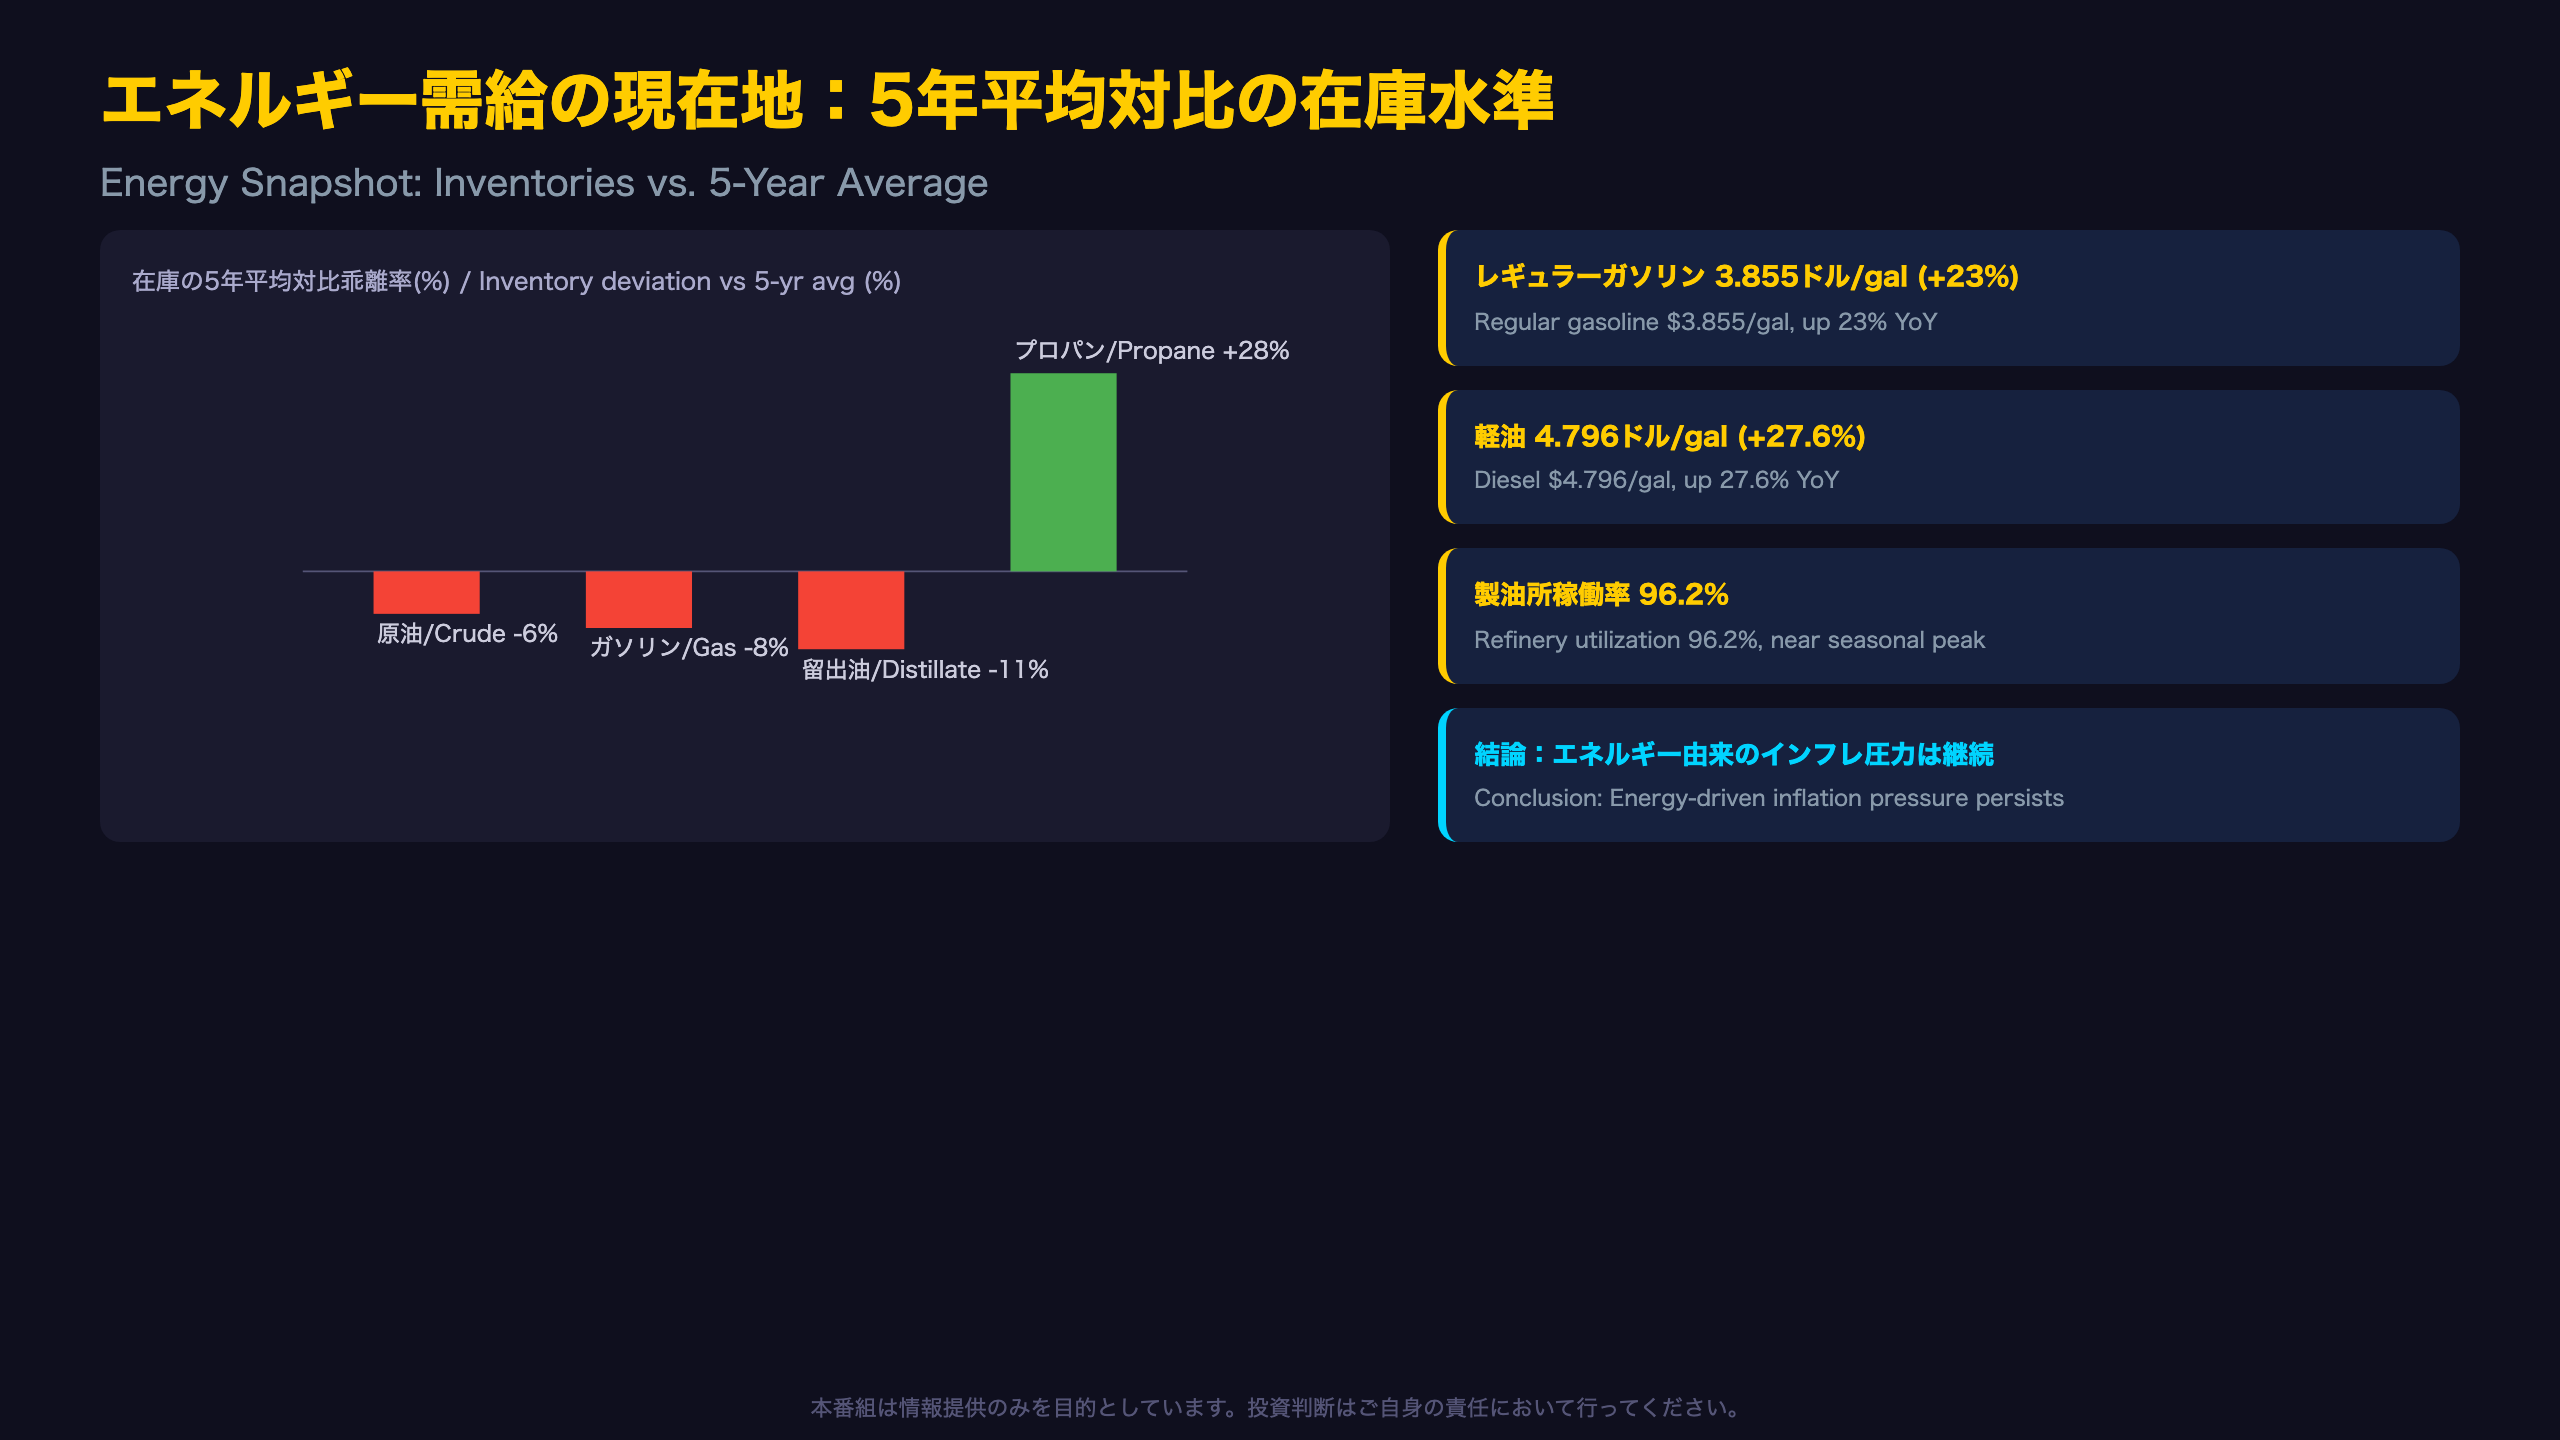
Energy Markets: Tight Inventories Despite Near-Record Refinery Runs
U.S. refineries processed 17.1 million barrels per day last week, up 99,000 b/d, pushing capacity utilization to 96.2% — above the 94.6% seen a year earlier, comparable to seasonal peak levels typically hit during the summer driving season. Yet even with refineries running near full tilt, commercial crude stocks (excluding the Strategic Petroleum Reserve) stand at 409.7 million barrels, about 6% below the five-year seasonal average, while gasoline inventories are 8% below that benchmark.
Crude imports rose slightly to 5.7 million b/d for the week, but the four-week average of 5.5 million b/d is down 12.2% year-over-year, adding another layer of tightness. Propane/propylene inventories are a notable outlier, up 3.0 million barrels and running 28% above the five-year average — a reminder that not all products in the barrel are equally tight.
On price, WTI crude closed at $72.45/barrel versus $69.63 a year ago, while retail gasoline hit $3.855/gallon (up 23.2% YoY) and diesel reached $4.796/gallon (up 27.6% YoY). For readers unfamiliar with EIA methodology: these weekly figures come from the Weekly Petroleum Status Report and serve as a real-time gauge of energy-driven inflation pressure ahead of the official CPI energy component. Given the scale of the YoY gasoline and diesel increases, this data argues for continued vigilance on headline inflation readings, even if core measures remain more contained.
FRB流動性の現在地(H.4.1詳細)
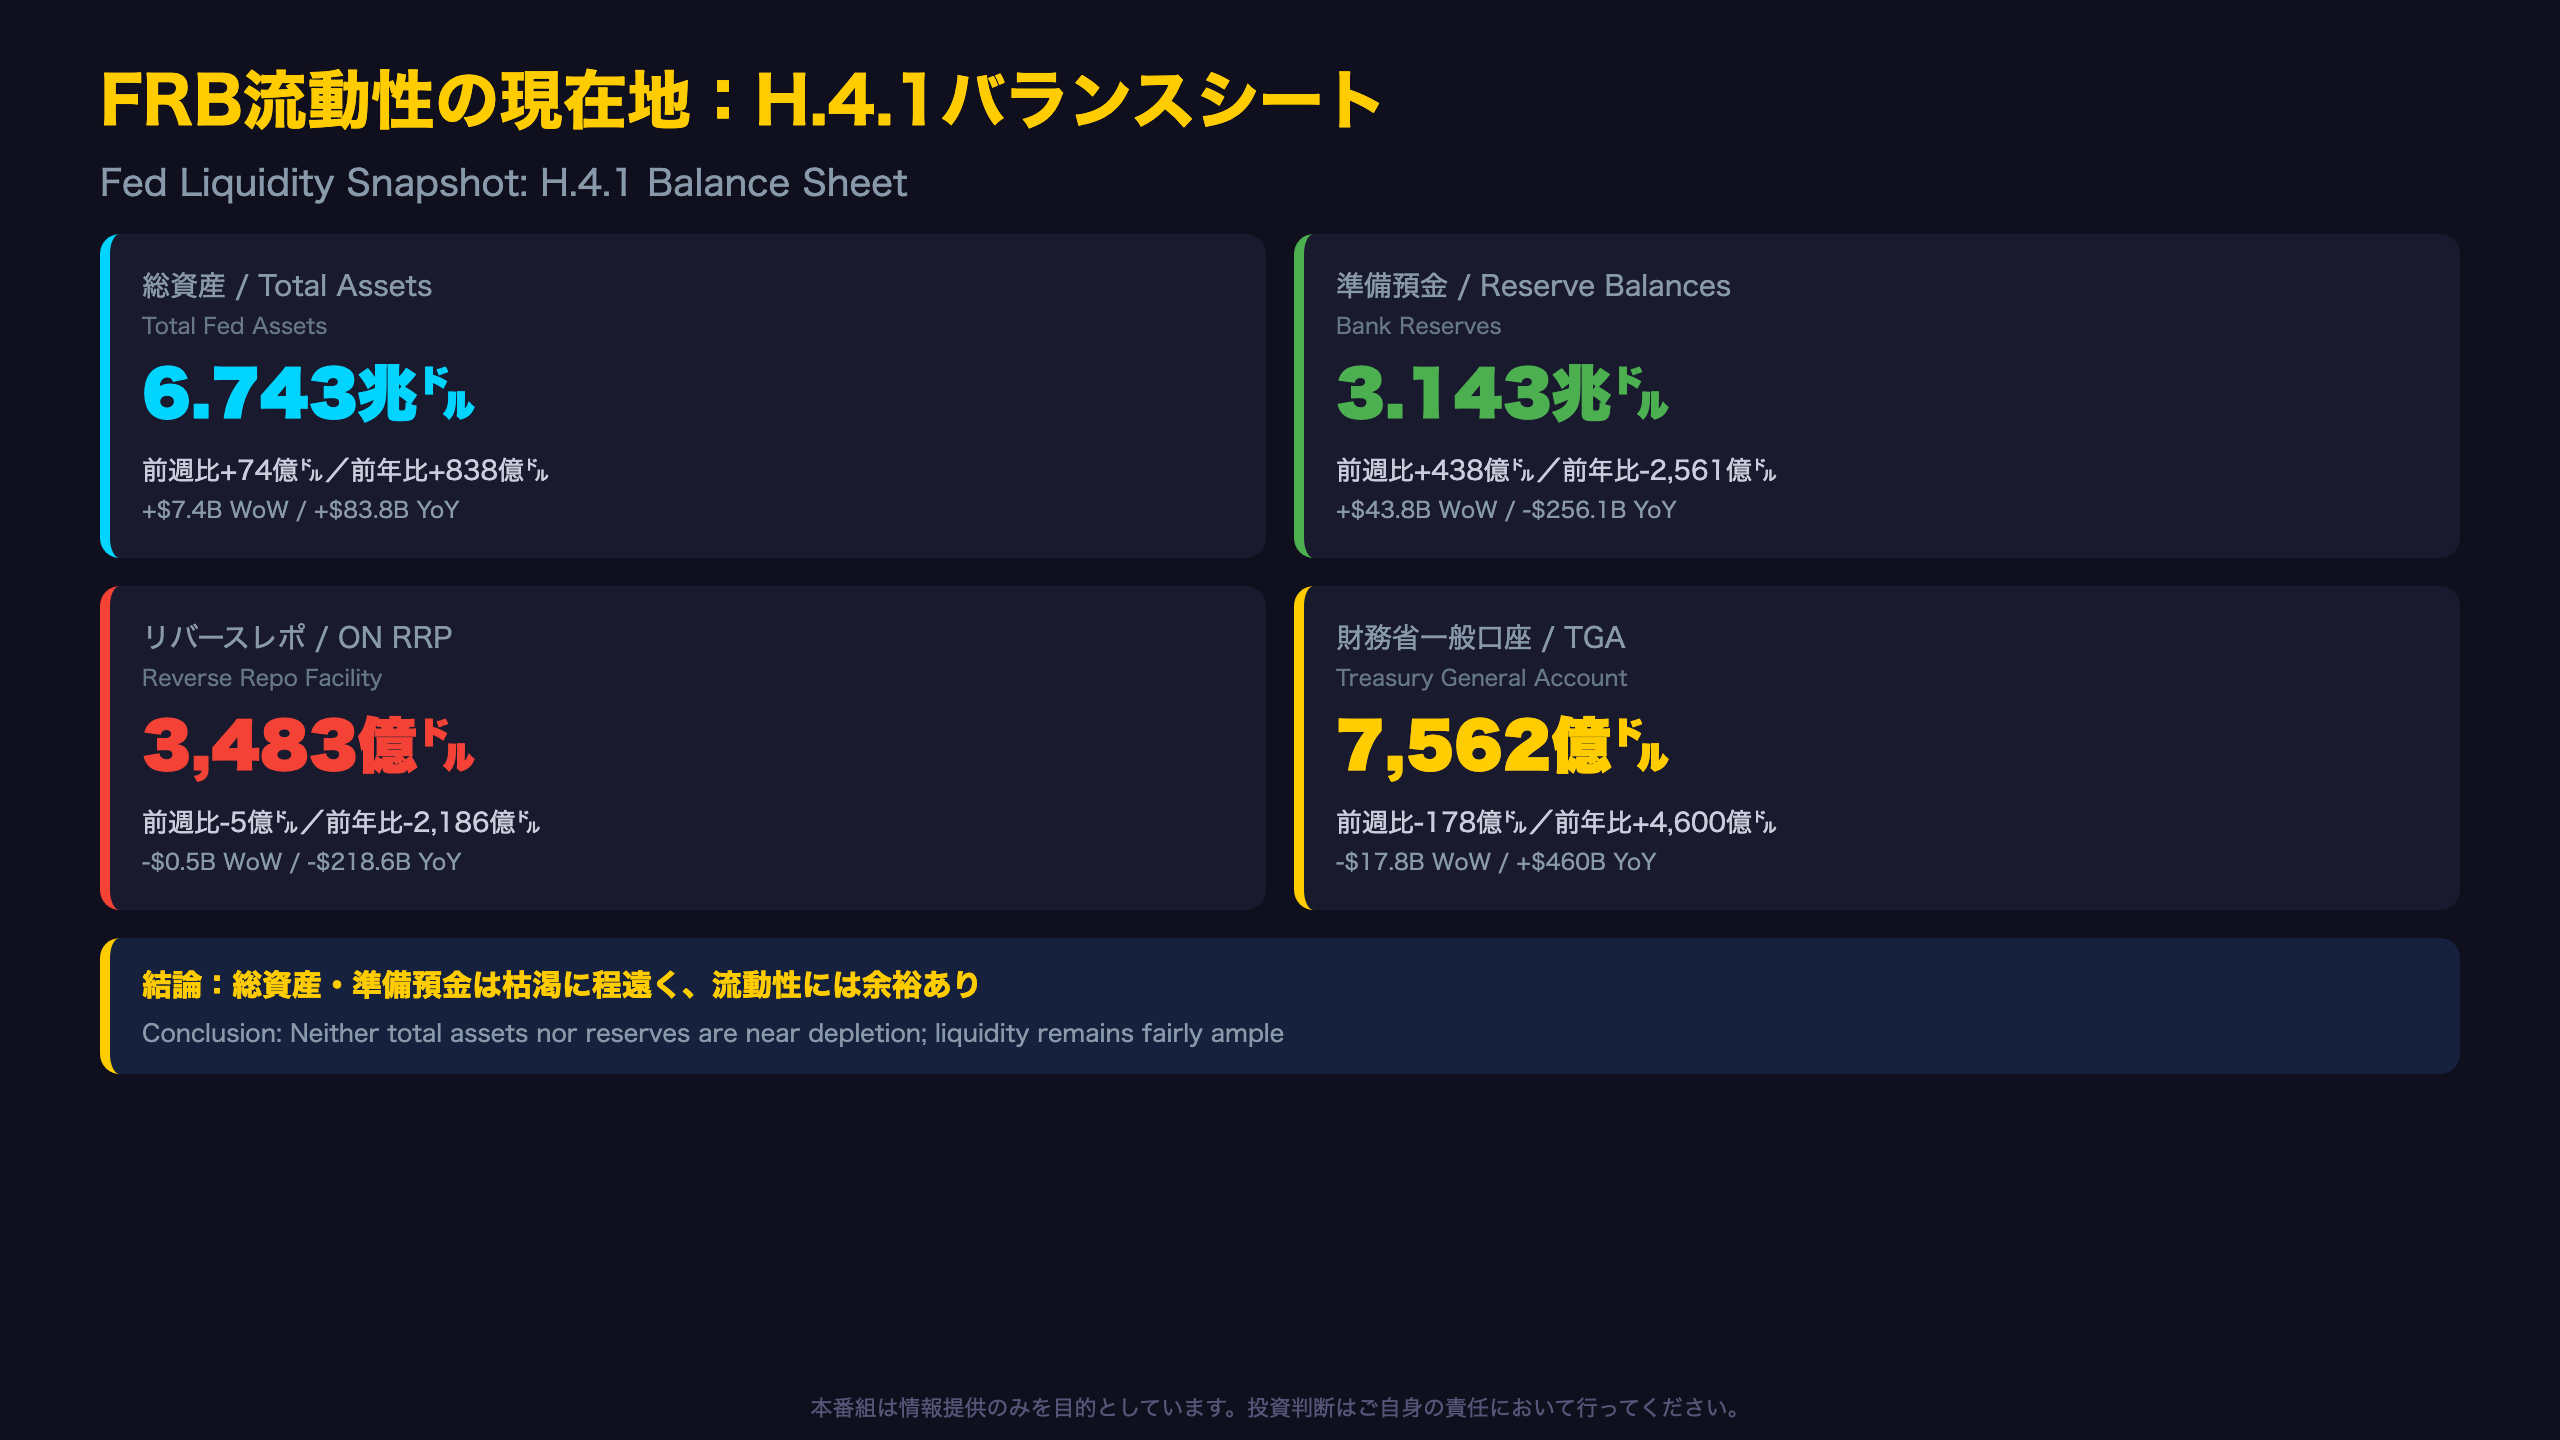
The Fed’s Balance Sheet: Is QT Quietly Ending?
The most overlooked detail in this week’s H.4.1 release is that the Fed’s total assets actually grew year-over-year, by $83.8 billion, to $6.743 trillion. Since 2022, quantitative tightening (QT) has meant a shrinking balance sheet as securities roll off without reinvestment. But Treasury bill holdings alone rose $309.4 billion YoY, more than offsetting a $190.1 billion decline in mortgage-backed securities (MBS) — meaning total securities held outright expanded $110.6 billion YoY. For readers new to Fed mechanics: MBS runoff is slow and structural, while bill purchases are more flexible, so this pattern suggests the Fed is allowing its portfolio composition to shift even as headline “QT” continues.
Reserve balances — the most direct gauge of banking-system liquidity — stood at $3.143 trillion, up $43.8 billion on the week though down $256.1 billion year-over-year. This remains far above the roughly $1.5 trillion level associated with the September 2019 repo market stress, a key reference point for U.S. rates traders.
Meanwhile, the overnight reverse repo (ON RRP) facility, used by money-market funds to park excess cash with the Fed, fell to $348.3 billion, down a sharp $218.6 billion YoY. A declining RRP balance generally means cash is flowing back into the broader financial system rather than sitting idle — a liquidity-supportive dynamic. The Treasury General Account (TGA) rose to $756.2 billion, up $460 billion YoY, consistent with the Treasury rebuilding cash after past debt-ceiling episodes. Collectively, these dynamics suggest financial-system liquidity may be more ample than the standard “QT is draining liquidity” narrative implies.
ストラテジスト総括:3指標の連関と来週の注目シナリオ
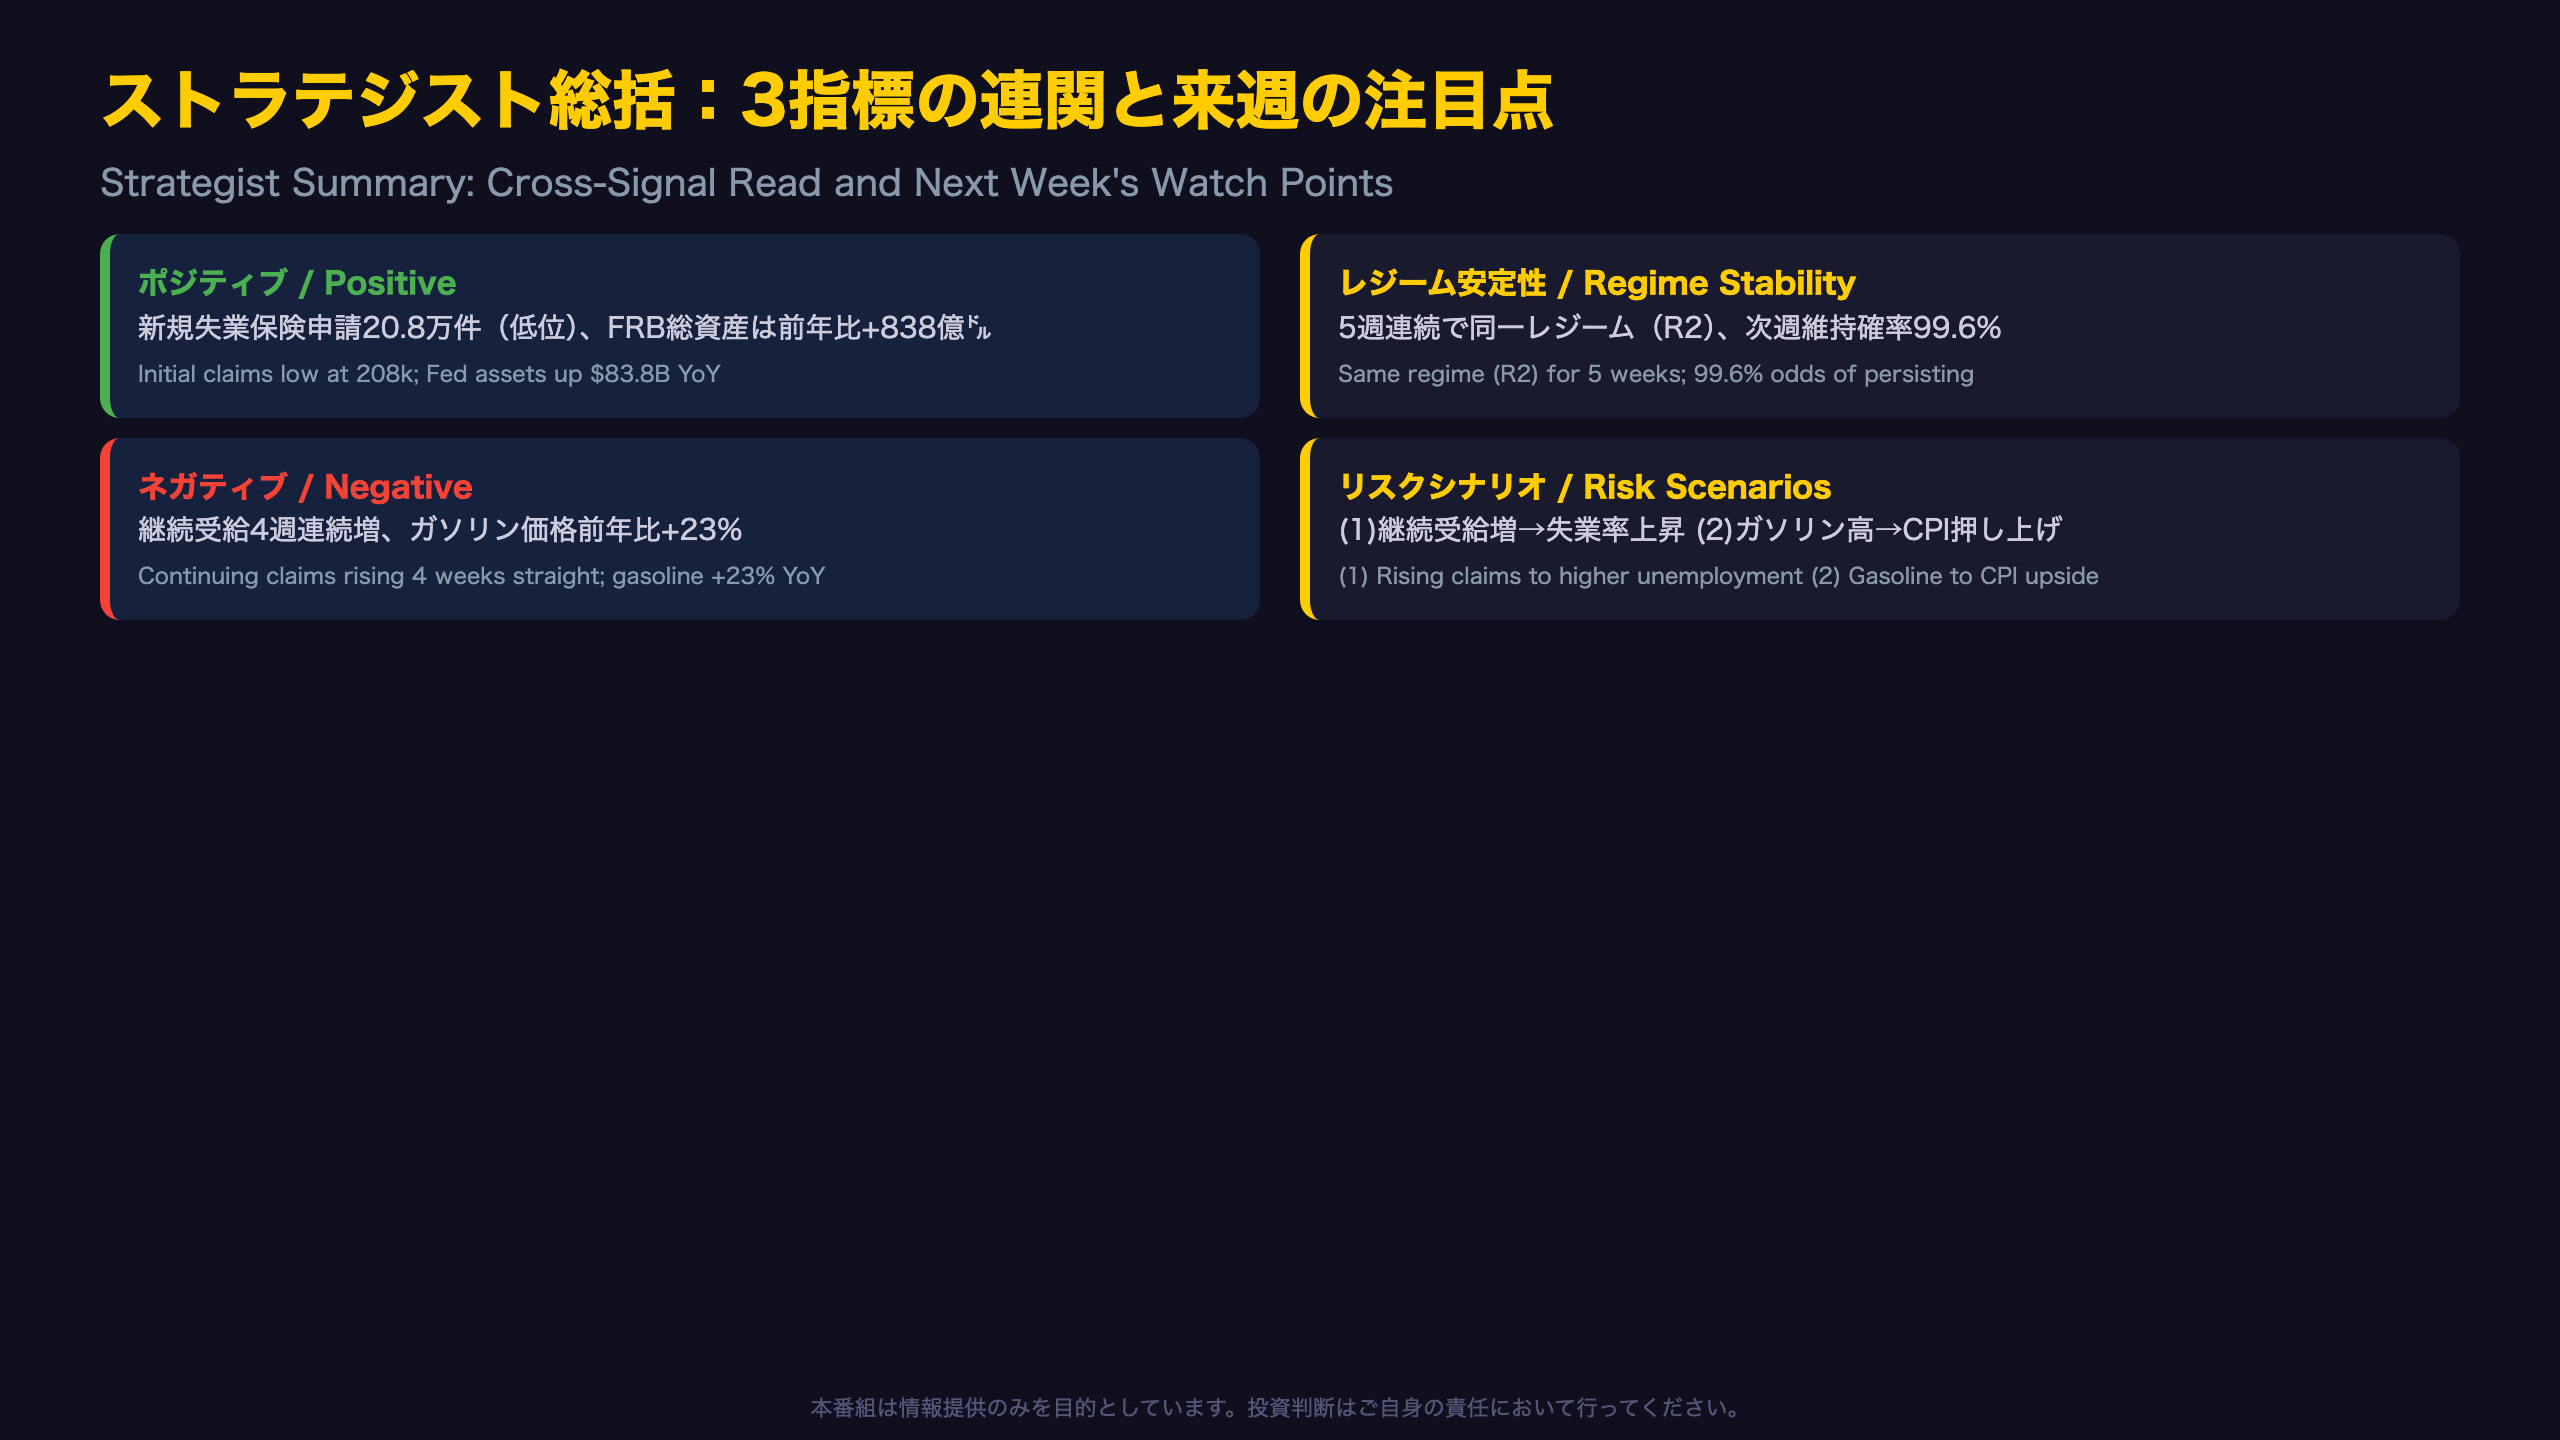
Strategist’s Take: Three Indicators, Not Quite in Sync
This week’s three data sets don’t point in a single direction. Falling initial jobless claims and the Fed’s year-over-year balance sheet expansion both support a “no acute stress” read on the economy and financial system. But four straight weeks of rising continuing claims and a 23% jump in gasoline prices tell a different story — one of softer labor-market churn and persistent energy-driven inflation.
The underlying HMM regime-detection model (a statistical framework tracking which macro “regime” the economy is in) has held the same classification, R2, for five consecutive weeks, with a 99.6% probability of staying in that regime next week — meaning no abrupt-transition signal is currently flashing in the quantitative model. That said, anomaly detection on auxiliary indicators shows CPI energy and gasoline year-over-year readings deviating notably from the regime’s historical center (roughly 2.4–2.5 standard deviations), a build-up worth monitoring even if it hasn’t yet triggered a regime change.
Looking ahead, the key test will be whether next week’s Employment Situation report (nonfarm payrolls, unemployment rate) and CPI energy component confirm or contradict this week’s signals. Two risk scenarios investors should watch: (1) the continuing-claims uptrend spilling over into a higher unemployment rate, and (2) elevated gasoline prices feeding through into the CPI energy component in a way that pushes back market expectations for disinflation. Neither scenario is confirmed by this week’s data alone, but both are plausible extensions worth tracking.
Disclaimer: This article is for informational purposes only. All investment decisions are made solely at your own risk.