📺 Watch the Full Video Analysis
This article was automatically generated by the NFC Market Live AI analysis system. (Updated: 2026-07-17 23:10 JST)
📄 Primary Source
University of Michigan
http://www.sca.isr.umich.edu/
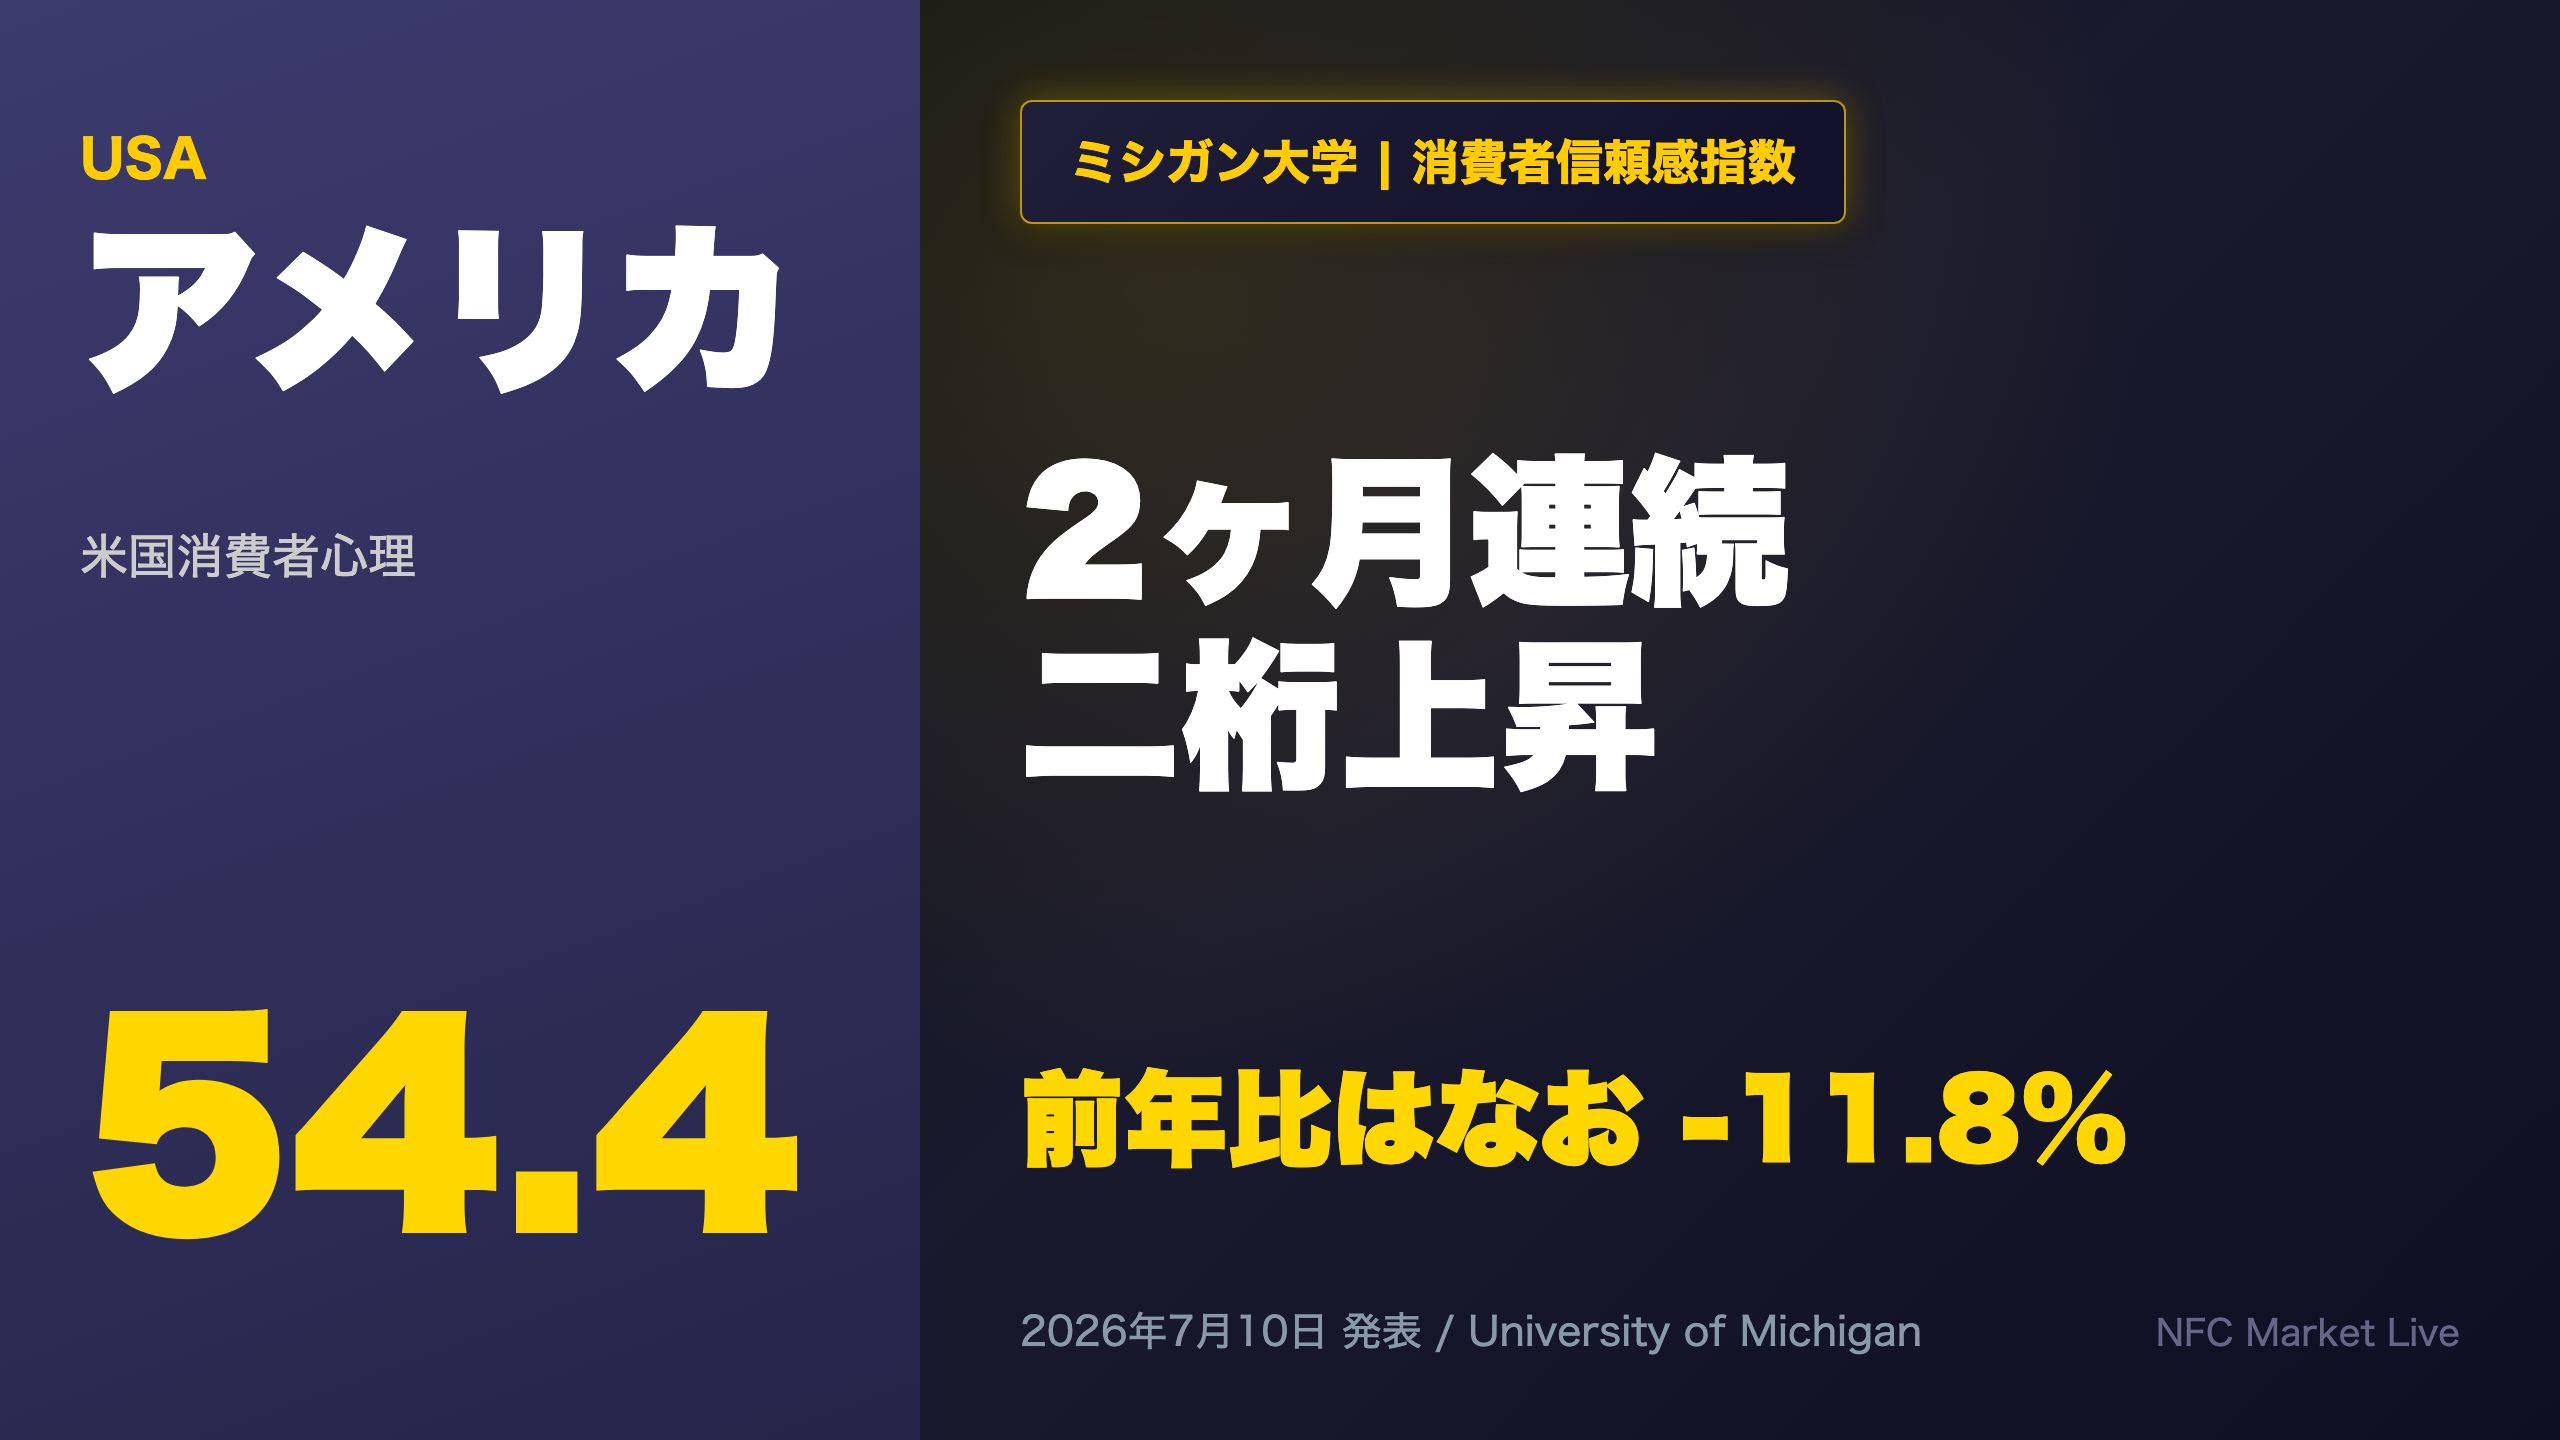
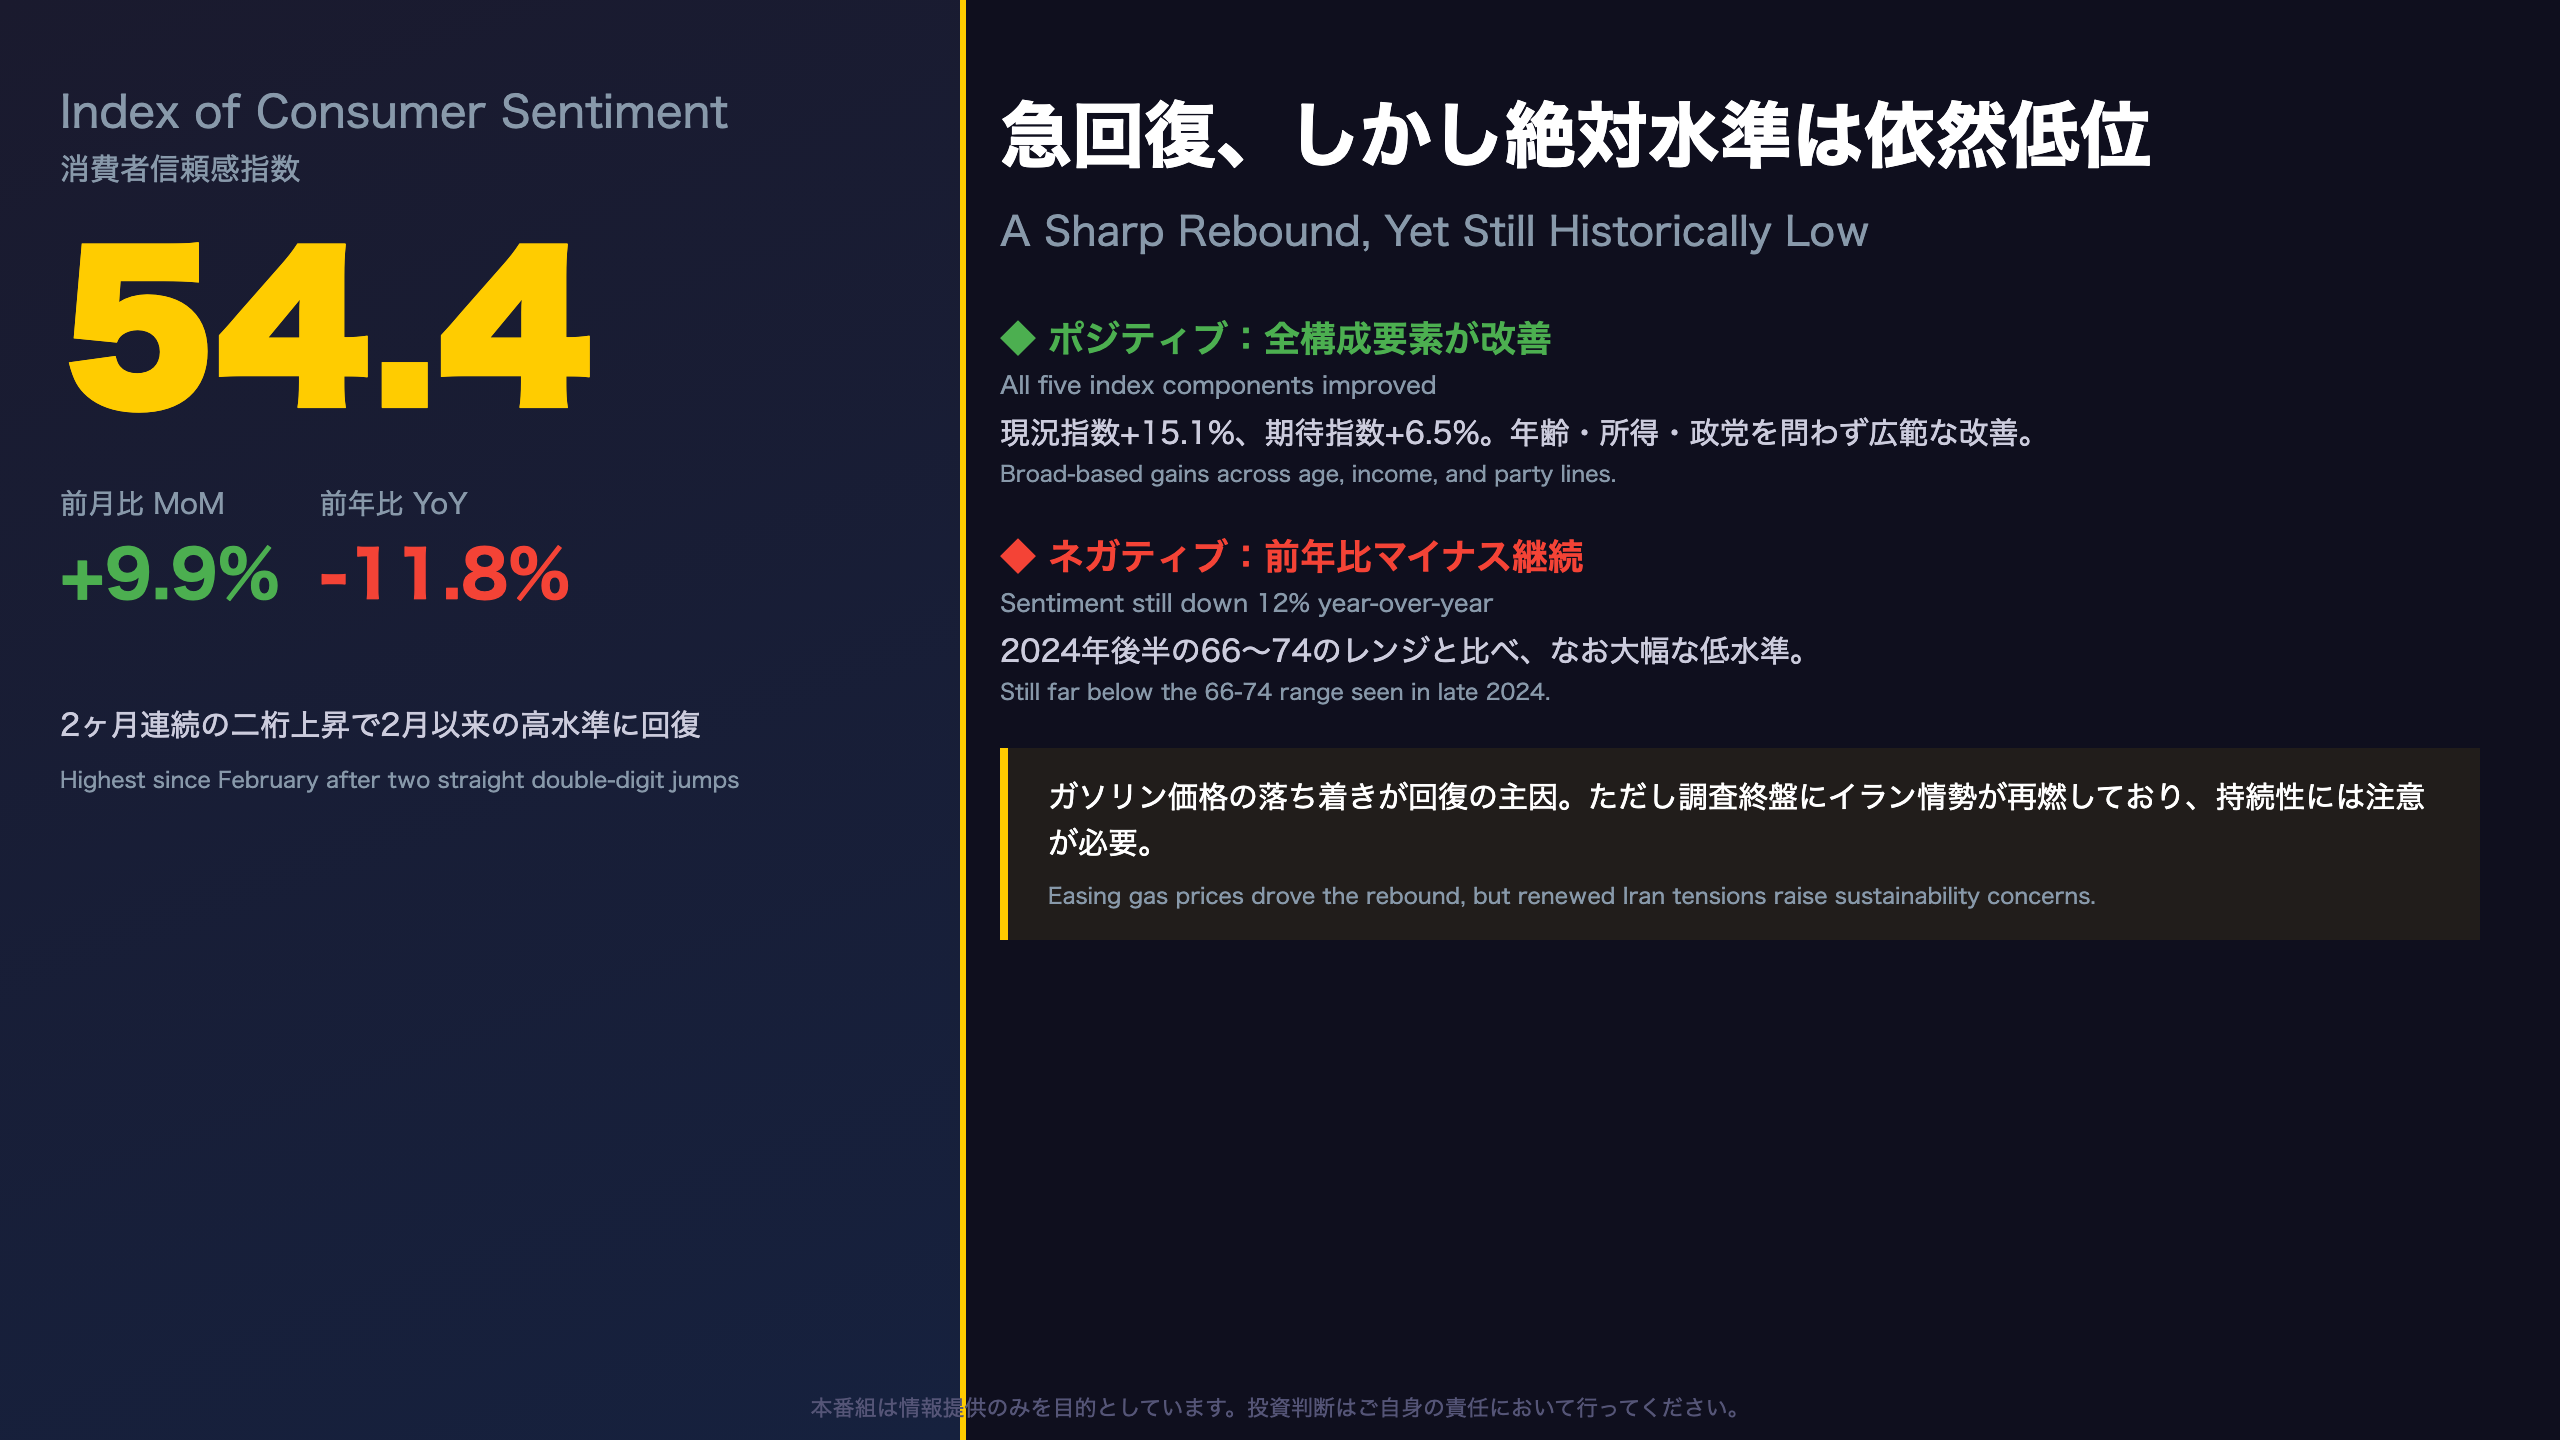
The University of Michigan’s preliminary July 2026 Consumer Sentiment Index jumped to 54.4, up +9.9% MoM — the second straight month of double-digit gains. 📊
Current conditions surged +15.1%, expectations rose +6.5%, with all five components improving.
Yet sentiment remains down -11.8% YoY, still far below 2024 levels. 📉
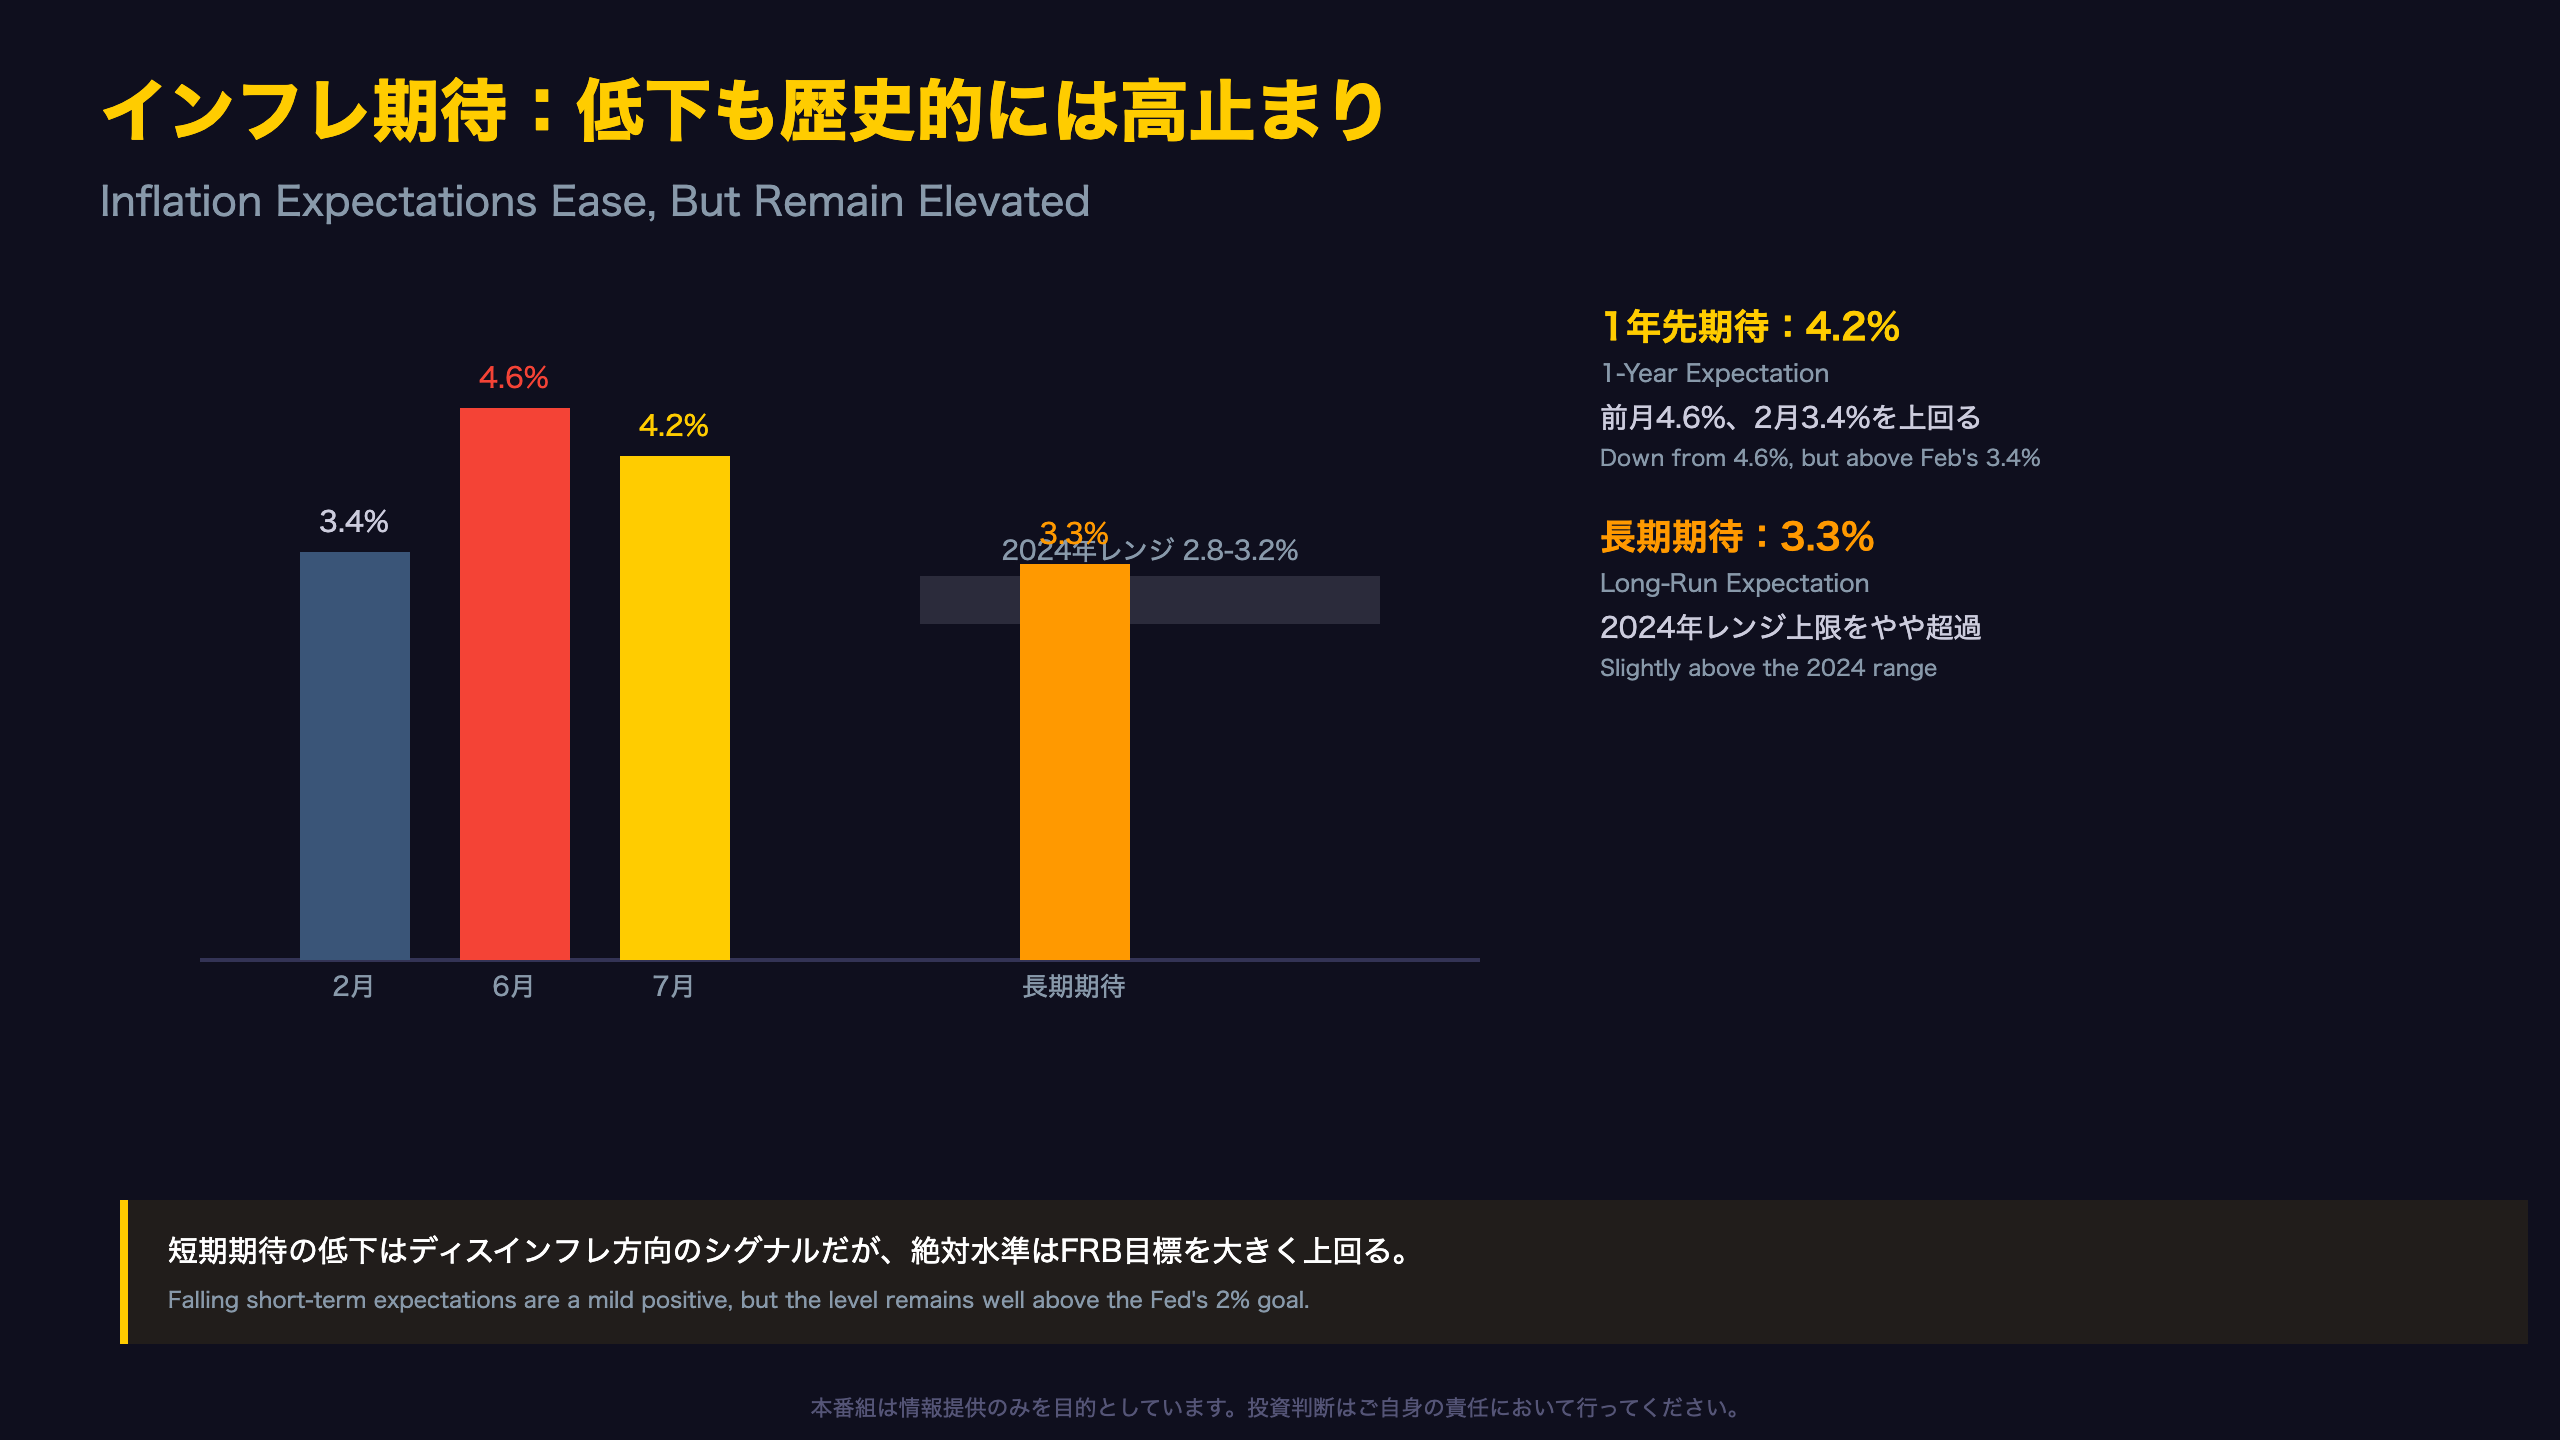
Year-ahead inflation expectations eased to 4.2% from 4.6%, but remain above every 2024 reading. ⚠️
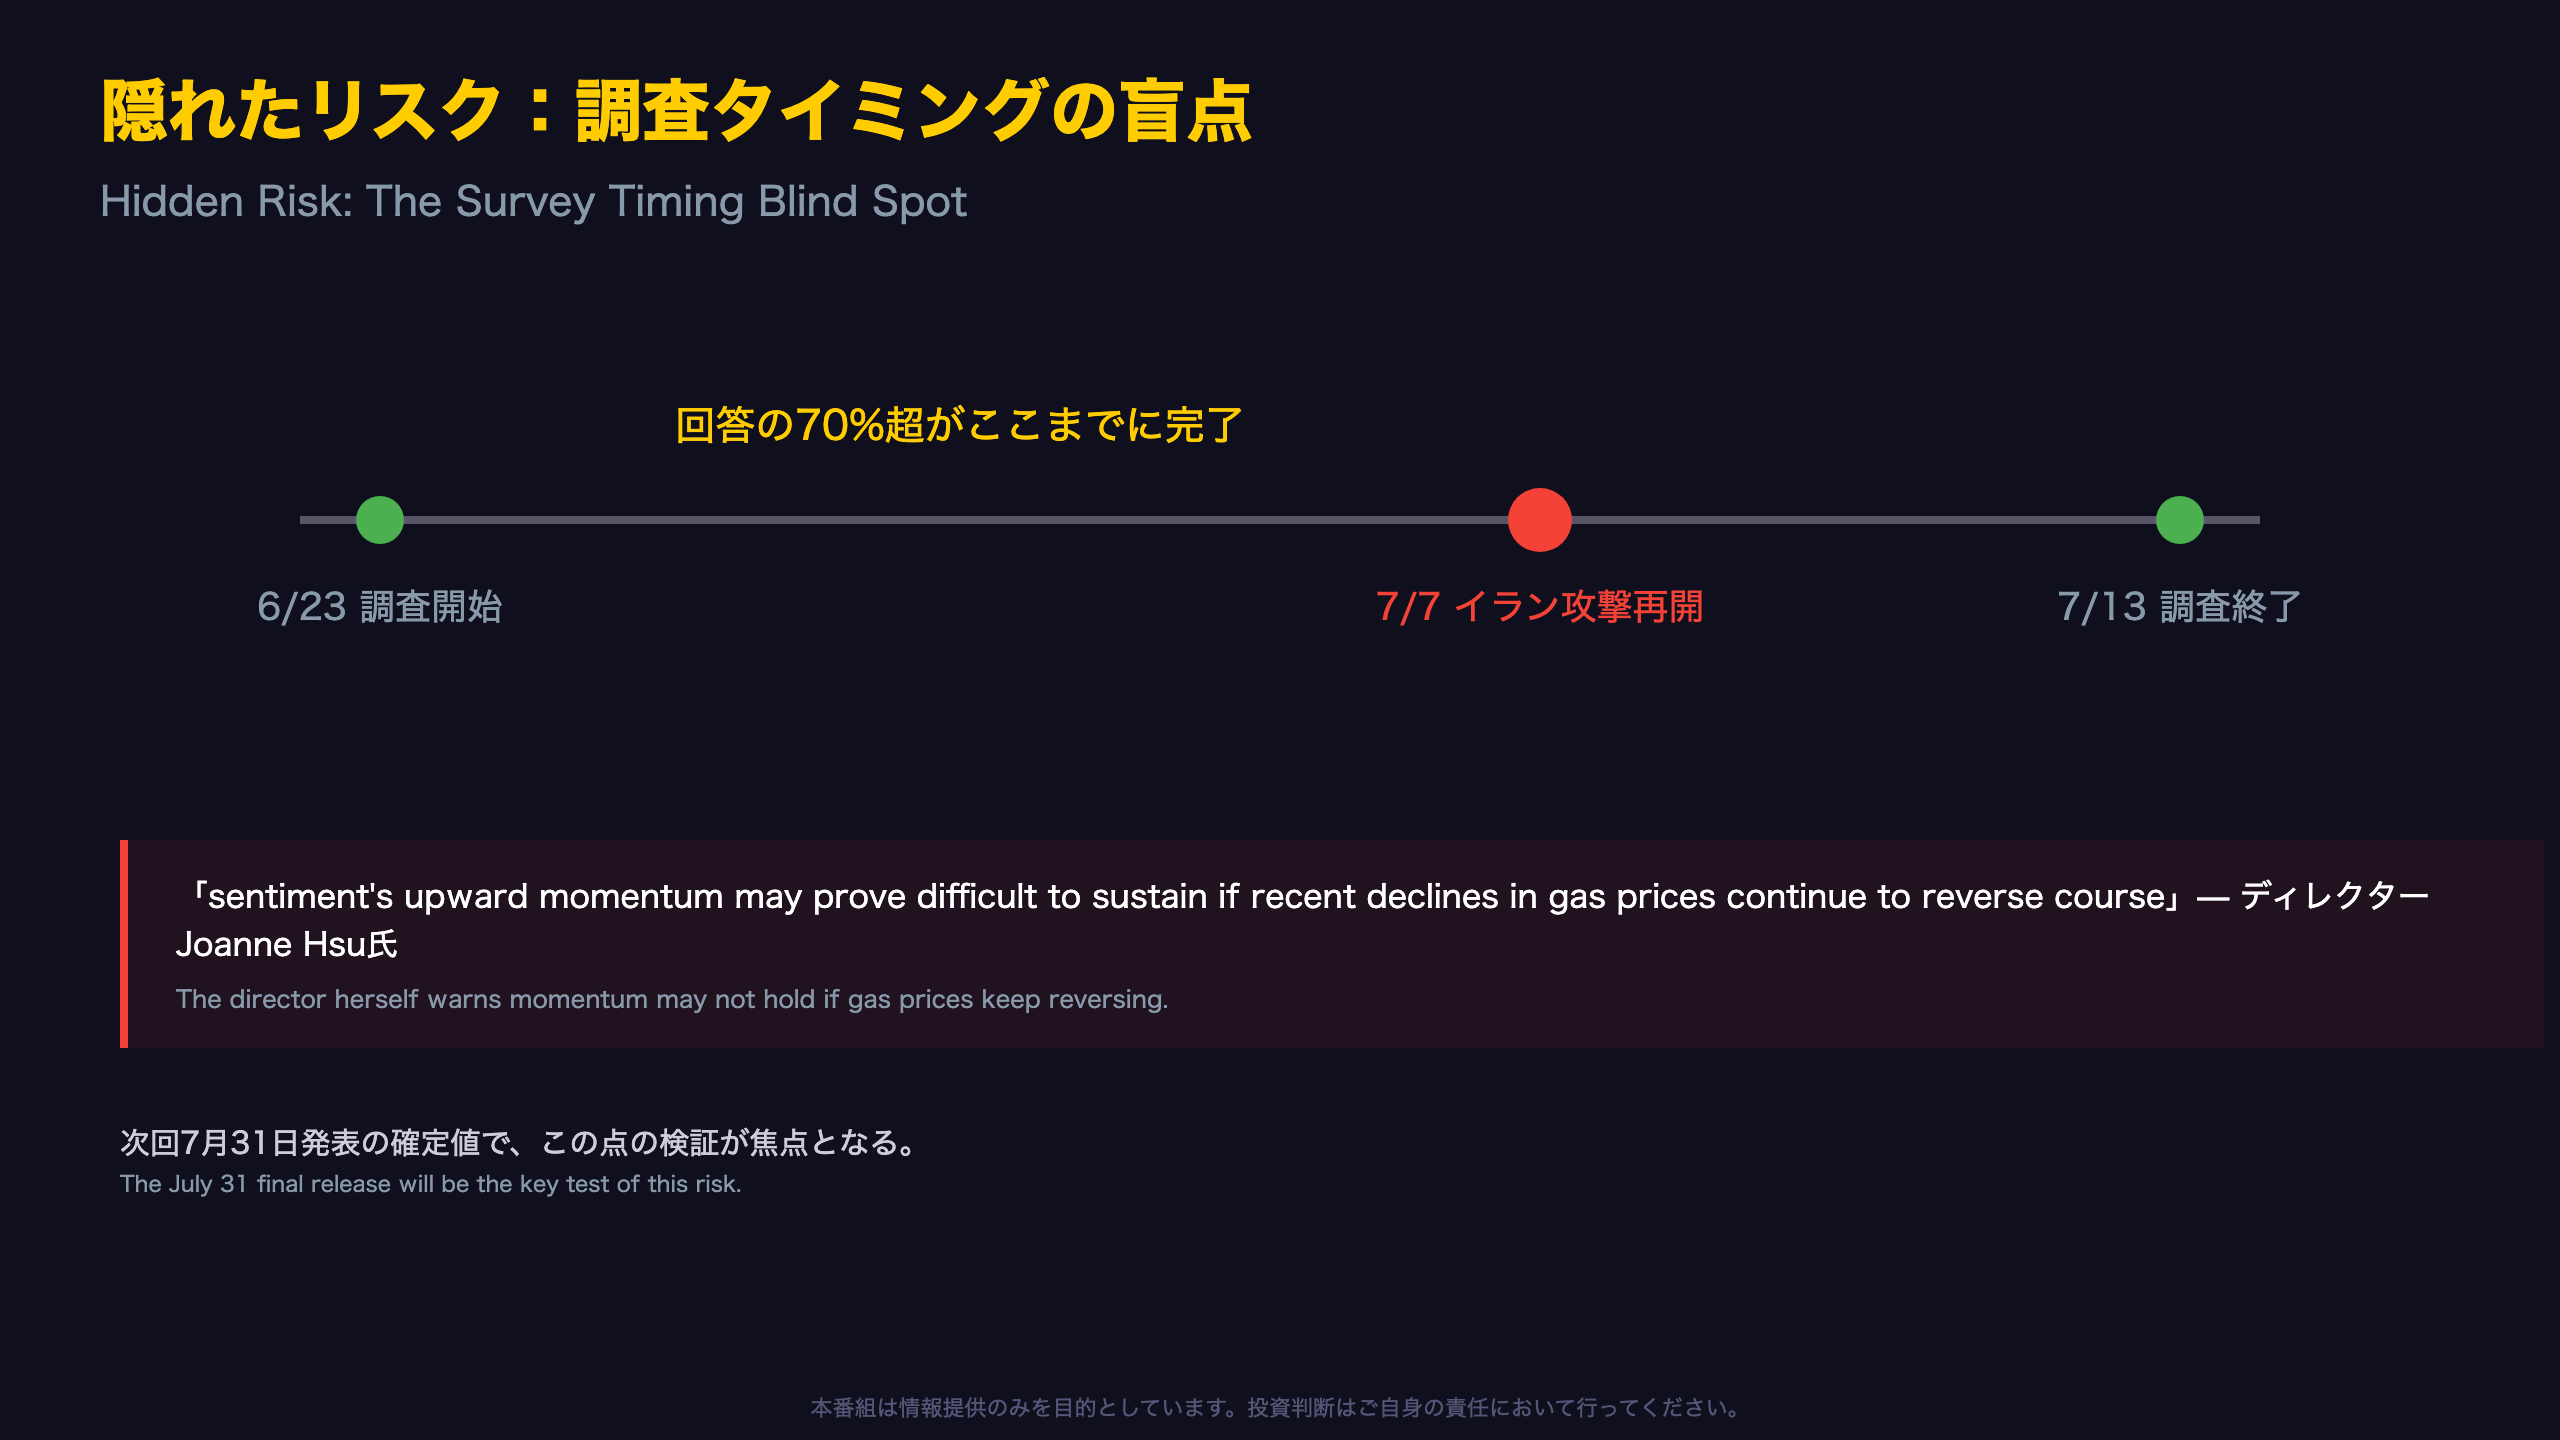
Over 70% of interviews were completed before the July 7 resumption of US strikes against Iran, raising the risk of reversal as gas prices climb again. 💡
We break down the drivers, the risks, and what this means for the Fed and markets.
急回復の実態:54.4への到達
A Rare Back-to-Back Double-Digit Surge
The University of Michigan’s Surveys of Consumers, directed by Joanne Hsu, is one of the most closely watched gauges of US household psychology, alongside The Conference Board’s Consumer Confidence Index. Michigan’s index places heavier weight on inflation expectations and personal finance perceptions, making it a key input for Federal Reserve policymakers.
July’s preliminary reading of 54.4, up 9.9% month-over-month, marks the second consecutive month of double-digit gains — a pattern rarely seen even during this survey’s volatile post-pandemic history.
Bull case
All five sub-components improved, and gains were broad-based across age, income, wealth, and political affiliation, with especially strong improvement among consumers without a bachelor’s degree.
Bear case
The report itself states sentiment remains \”down 12% from a year ago,\” and the current level is still roughly 20 points below the 66-74 range seen in late 2024. The Fed tends to weight the absolute level and inflation expectations more heavily than short-term momentum.
The next release — the final July figure on July 31 — will show whether this rebound has legs or fades as geopolitical risk resurfaces.
構成要素の内訳:何が牽引したか
Under the Hood: What Actually Drove the Bounce
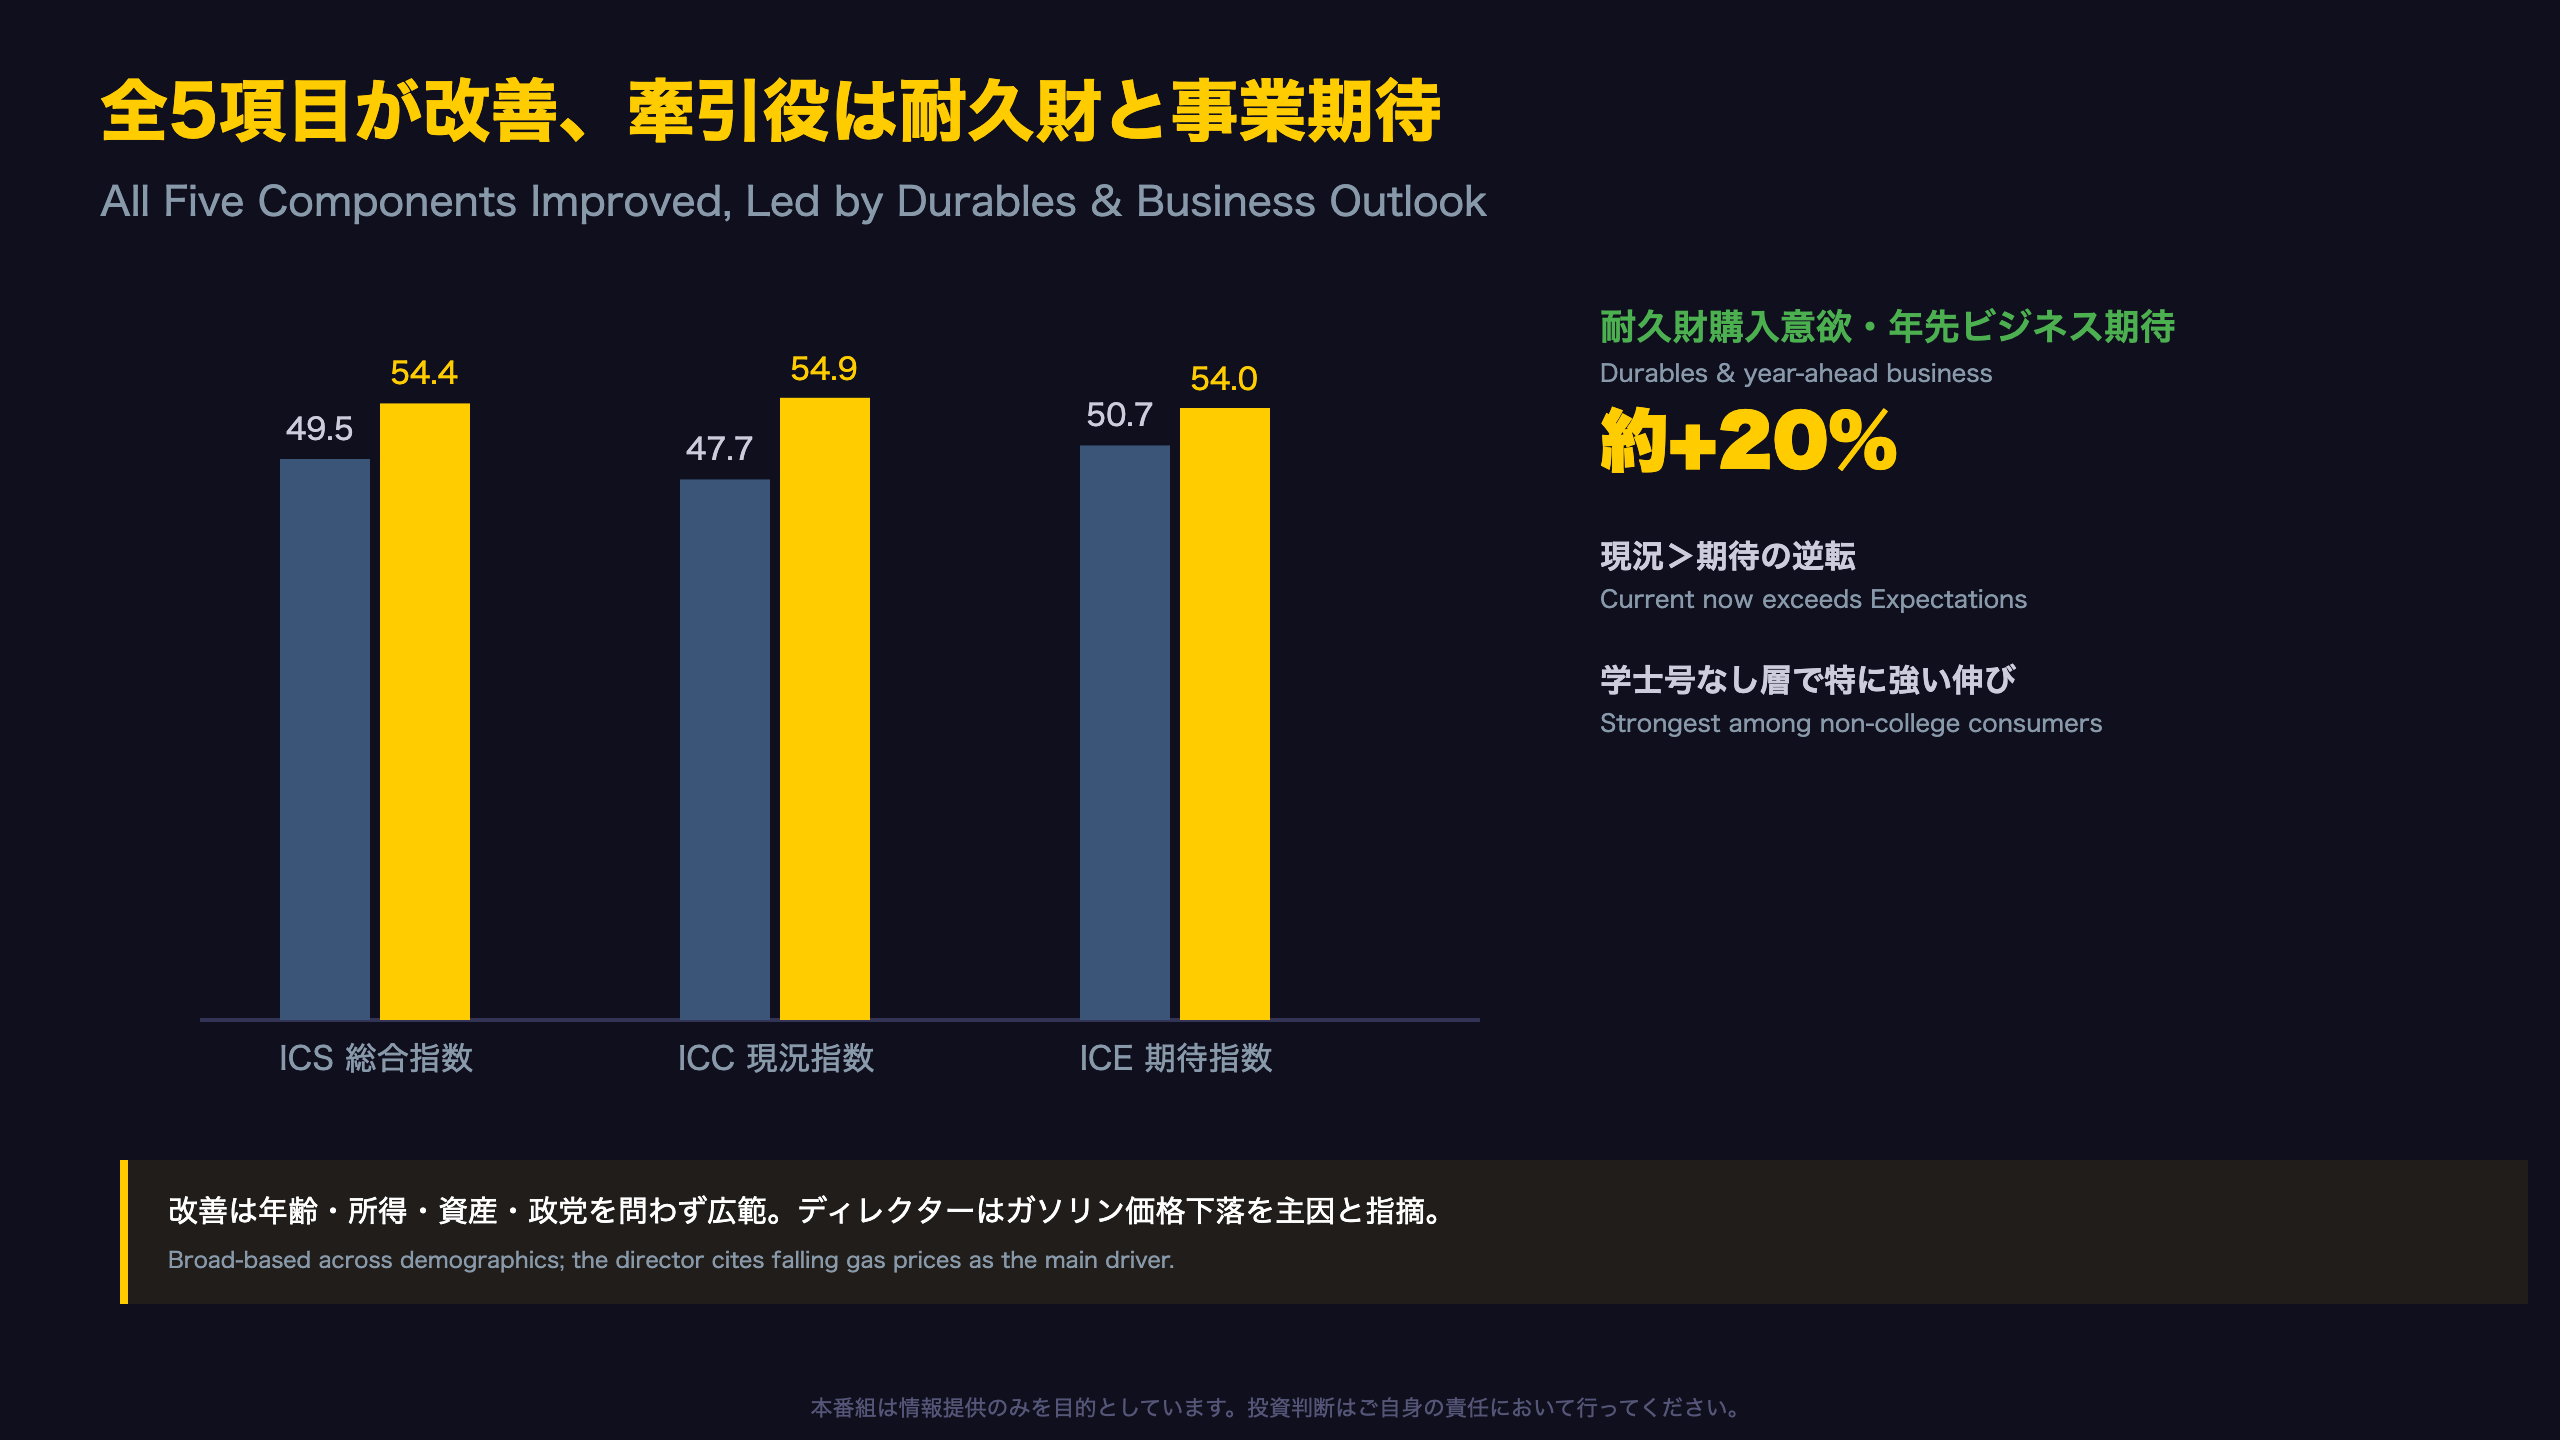
The report explicitly states: \”All five index components improved, led by significant 20% increases in buying conditions for durables as well as year-ahead business conditions.\” This matters because durable goods buying intentions and year-ahead business outlook are forward-looking components often correlated with consumer spending on big-ticket items.
Current vs. Expectations: A Notable Flip
In June, Current Economic Conditions (47.7) trailed Expectations (50.7). In July, Current Conditions (54.9) overtook Expectations (54.0) — a reversal from typical early-recovery cycles where expectations usually lead.
Demographic Breadth
The report highlights particularly strong gains among consumers without a bachelor’s degree, a group generally more sensitive to gasoline and grocery prices — supporting, though not proving, the report’s explanation that falling gas prices were the primary driver.
No detailed numeric breakdown by education or income was provided in the preliminary release, so these observations remain directional rather than precisely quantified.
24ヶ月の文脈:どこから反発したのか
Two Years of Data: A Long Slide, Then a Sharp Bounce
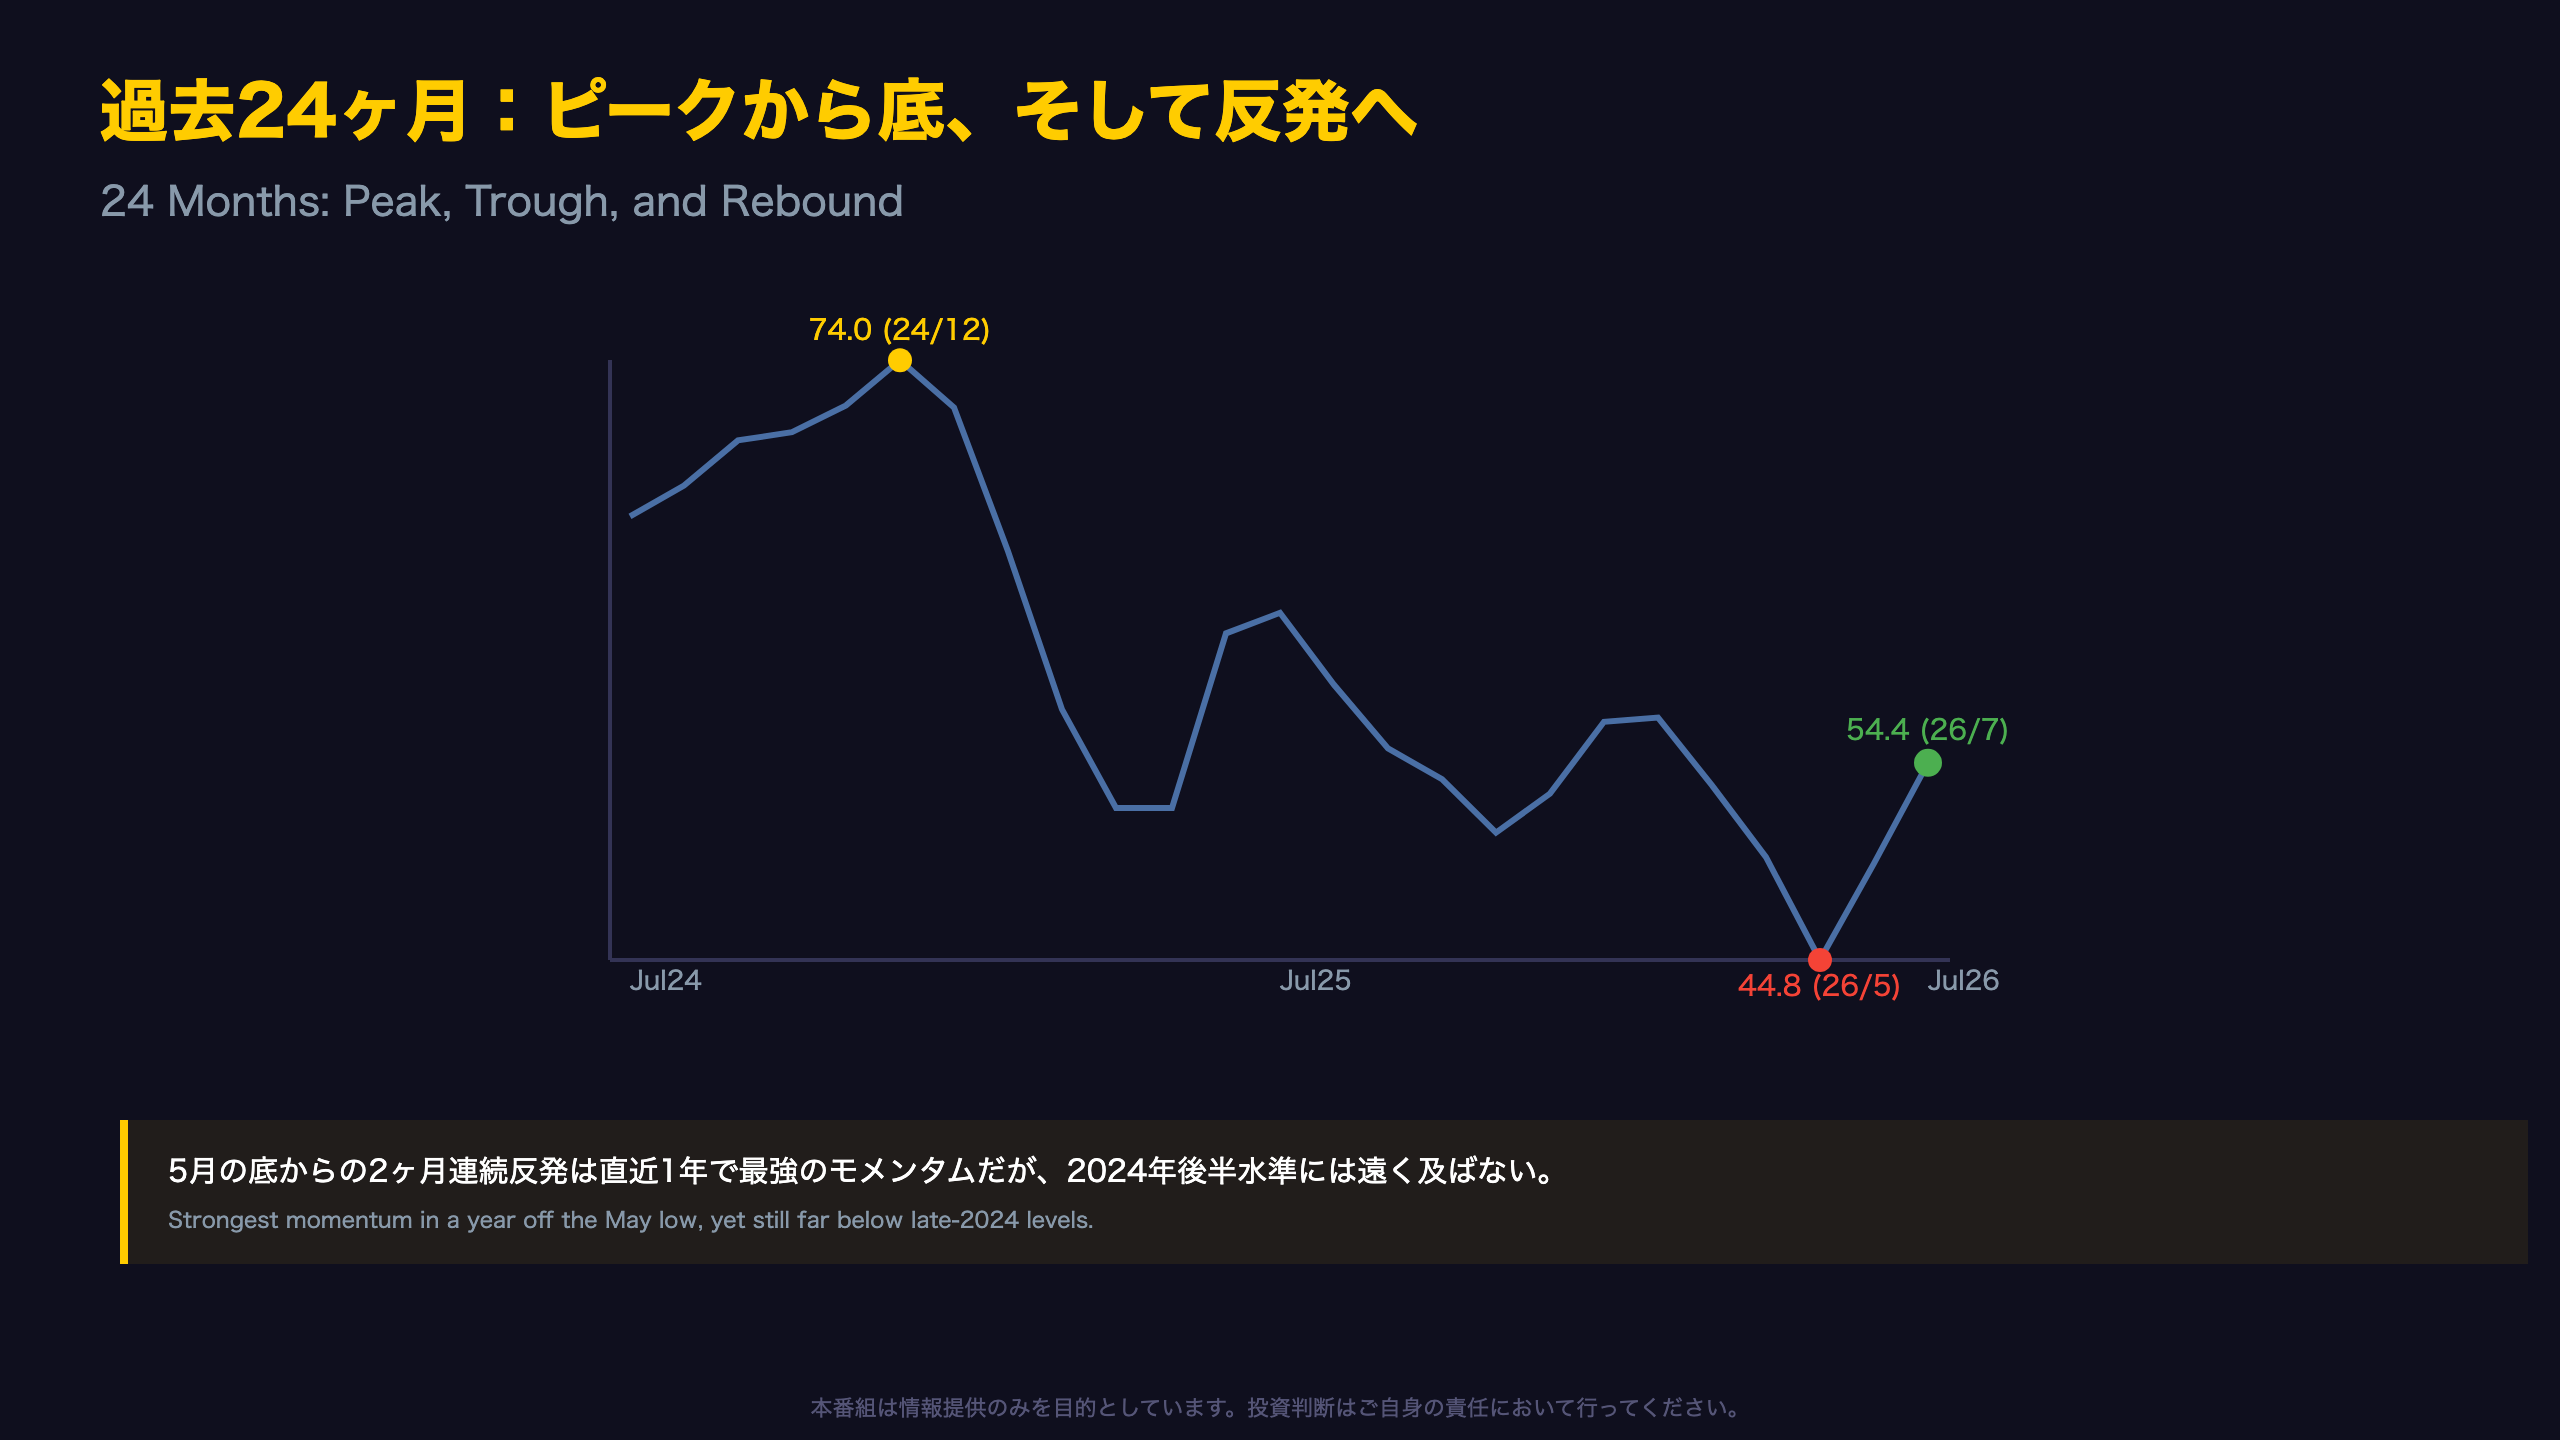
Plotting the past 24 months reveals a clear structural story. The index peaked at 74.0 in December 2024, then fell in two distinct waves: first from 71.7 (Jan 2025) to 52.2 (Apr-May 2025), and again from 60.7 (Jun 2025) down to a 24-month low of 44.8 in May 2026.
Historical Context for US Readers
For comparison, Michigan sentiment averaged around 85-95 in the pre-pandemic 2015-2019 period. The current reading of 54.4, even after two months of recovery, remains well below both pre-pandemic norms and the late-2024 peak.
Is This a Trend Reversal?
Two consecutive monthly gains is the strongest short-term momentum seen in over a year. However, a similar pattern of a temporary rebound followed by renewed decline occurred in mid-2025, when sentiment rose from 52.2 to 60.7 before resuming its downtrend. Analysts should treat this July bounce as a data point requiring confirmation, not a confirmed reversal.
The August and final-July releases will be critical in determining whether this is a genuine inflection point or another false start.
インフレ期待:低下も高止まり
Inflation Expectations: Easing, But Still Elevated by Historical Standards
The University of Michigan survey’s inflation expectations are among the most closely monitored inputs for Fed policymakers, frequently cited in FOMC minutes and speeches.
Year-ahead inflation expectations fell to 4.2% from 4.6% in June. However, the report notes this \”substantially exceeds the 3.4% seen in February before the Iran conflict began, along with all 2024 readings.\” For readers benchmarking against the Fed’s 2% target, a 4.2% one-year expectation remains more than double that target.
Long-Run Expectations: The Fed’s Preferred Signal
The 5-year inflation expectation held steady at 3.3%, versus a 2.8%-3.2% range throughout 2024. Long-run expectations are generally considered stickier and more policy-relevant than short-term readings.
Market Implication
Falling short-term expectations could be read as a mild dovish signal, but the still-elevated long-run reading gives the Fed reason for caution before accelerating any rate-cut path.
隠れたリスク:調査タイミング問題
The Survey Timing Problem: A Critical Caveat US Investors Often Miss
One easily overlooked but crucial detail: interviews for this release spanned June 23 to July 13, with the report stating \”more than 70% completed before the resumption of US strikes against Iran on July 7 and the subsequent increase in gas prices.\”
Why This Matters for Data Interpretation
Unlike hard data collected via consistent methodology throughout a reference month, survey-based sentiment indices like Michigan’s are sensitive to exactly when respondents are interviewed. A geopolitical shock occurring mid-survey means the headline figure may not fully reflect sentiment as of month-end.
The Director’s Own Caveat
Director Joanne Hsu explicitly warns: \”sentiment’s upward momentum may prove difficult to sustain if recent declines in gas prices continue to reverse course.\” This is a rare instance of a survey’s own author flagging forward-looking uncertainty directly in the release commentary.
What to Watch Next
The final July figure, due July 31, will incorporate a fuller sample and may show whether the gas-price reversal already began denting sentiment before month-end.
インプリケーション:FRBと市場への示唆
Connecting the Dots: What This Means for the Fed and Markets
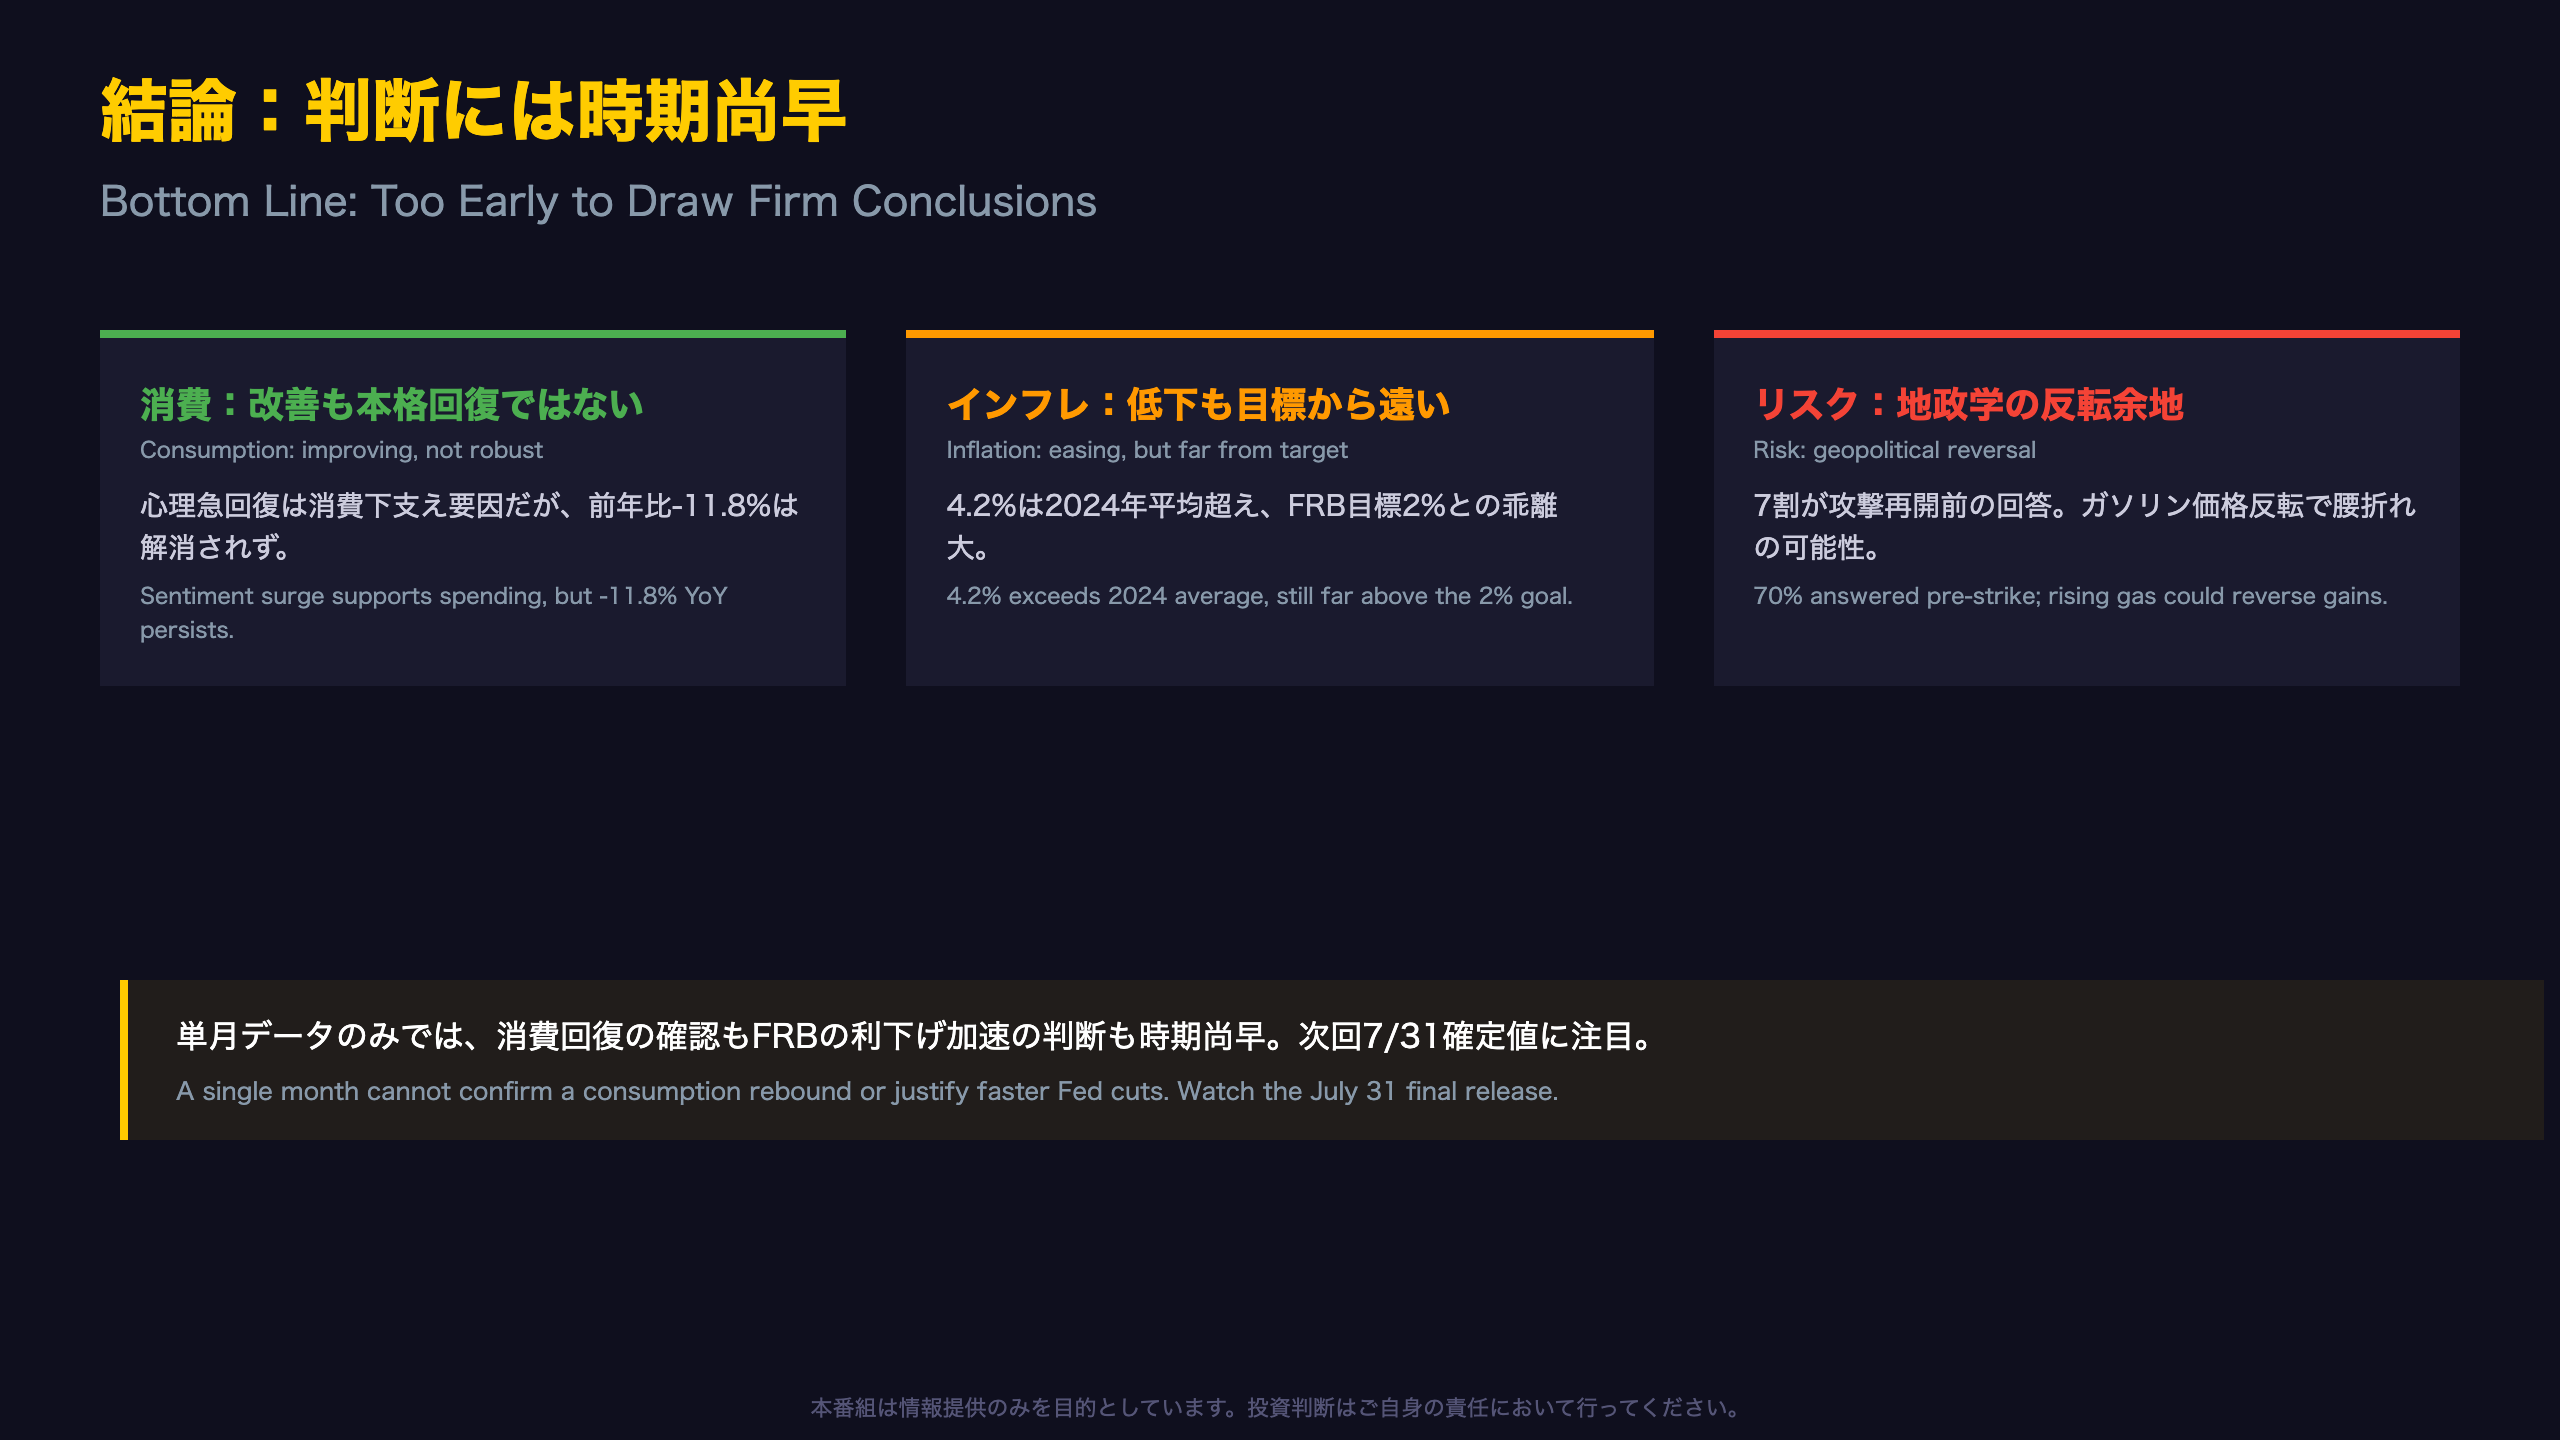
The Federal Reserve’s dual mandate requires weighing both labor market conditions and price stability. Michigan’s sentiment and inflation expectations data feed into this calculus, but this single report cannot on its own justify a shift in the FOMC’s rate path.
For Rates and the Dollar
A general principle holds that declining short-term inflation expectations can be read as a mild dovish input for policymakers. However, because year-ahead expectations at 4.2% remain above all 2024 readings, and long-run expectations at 3.3% exceed the 2024 range, this single data point cannot be used to argue for accelerated rate cuts.
For Equities
US equity markets often react favorably to improving consumer sentiment. Yet the report’s own acknowledgment that sentiment remains \”down 12% from a year ago\” tempers any straightforward bullish reading for consumer discretionary sectors.
Bottom Line
As the report states, \”with prices remaining frustratingly high, consumers are hardly ebullient about the economy.\” The July 31 final release and August preliminary data will be the next tests of durability.
Disclaimer: This article is for informational purposes only. All investment decisions are made solely at your own risk.