📺 Watch the Full Video Analysis
This article was automatically generated by the NFC Market Live AI analysis system. (Updated: 2026-07-17 22:26 JST)
📄 Primary Source
Federal Reserve
https://www.federalreserve.gov/releases/g17/current/g17.pdf
📊 Deep dive into the Fed’s G.17 Industrial Production release (June 2026 data).
Headline June IP rose just 0.1% MoM with manufacturing flat—looks soft on the surface.
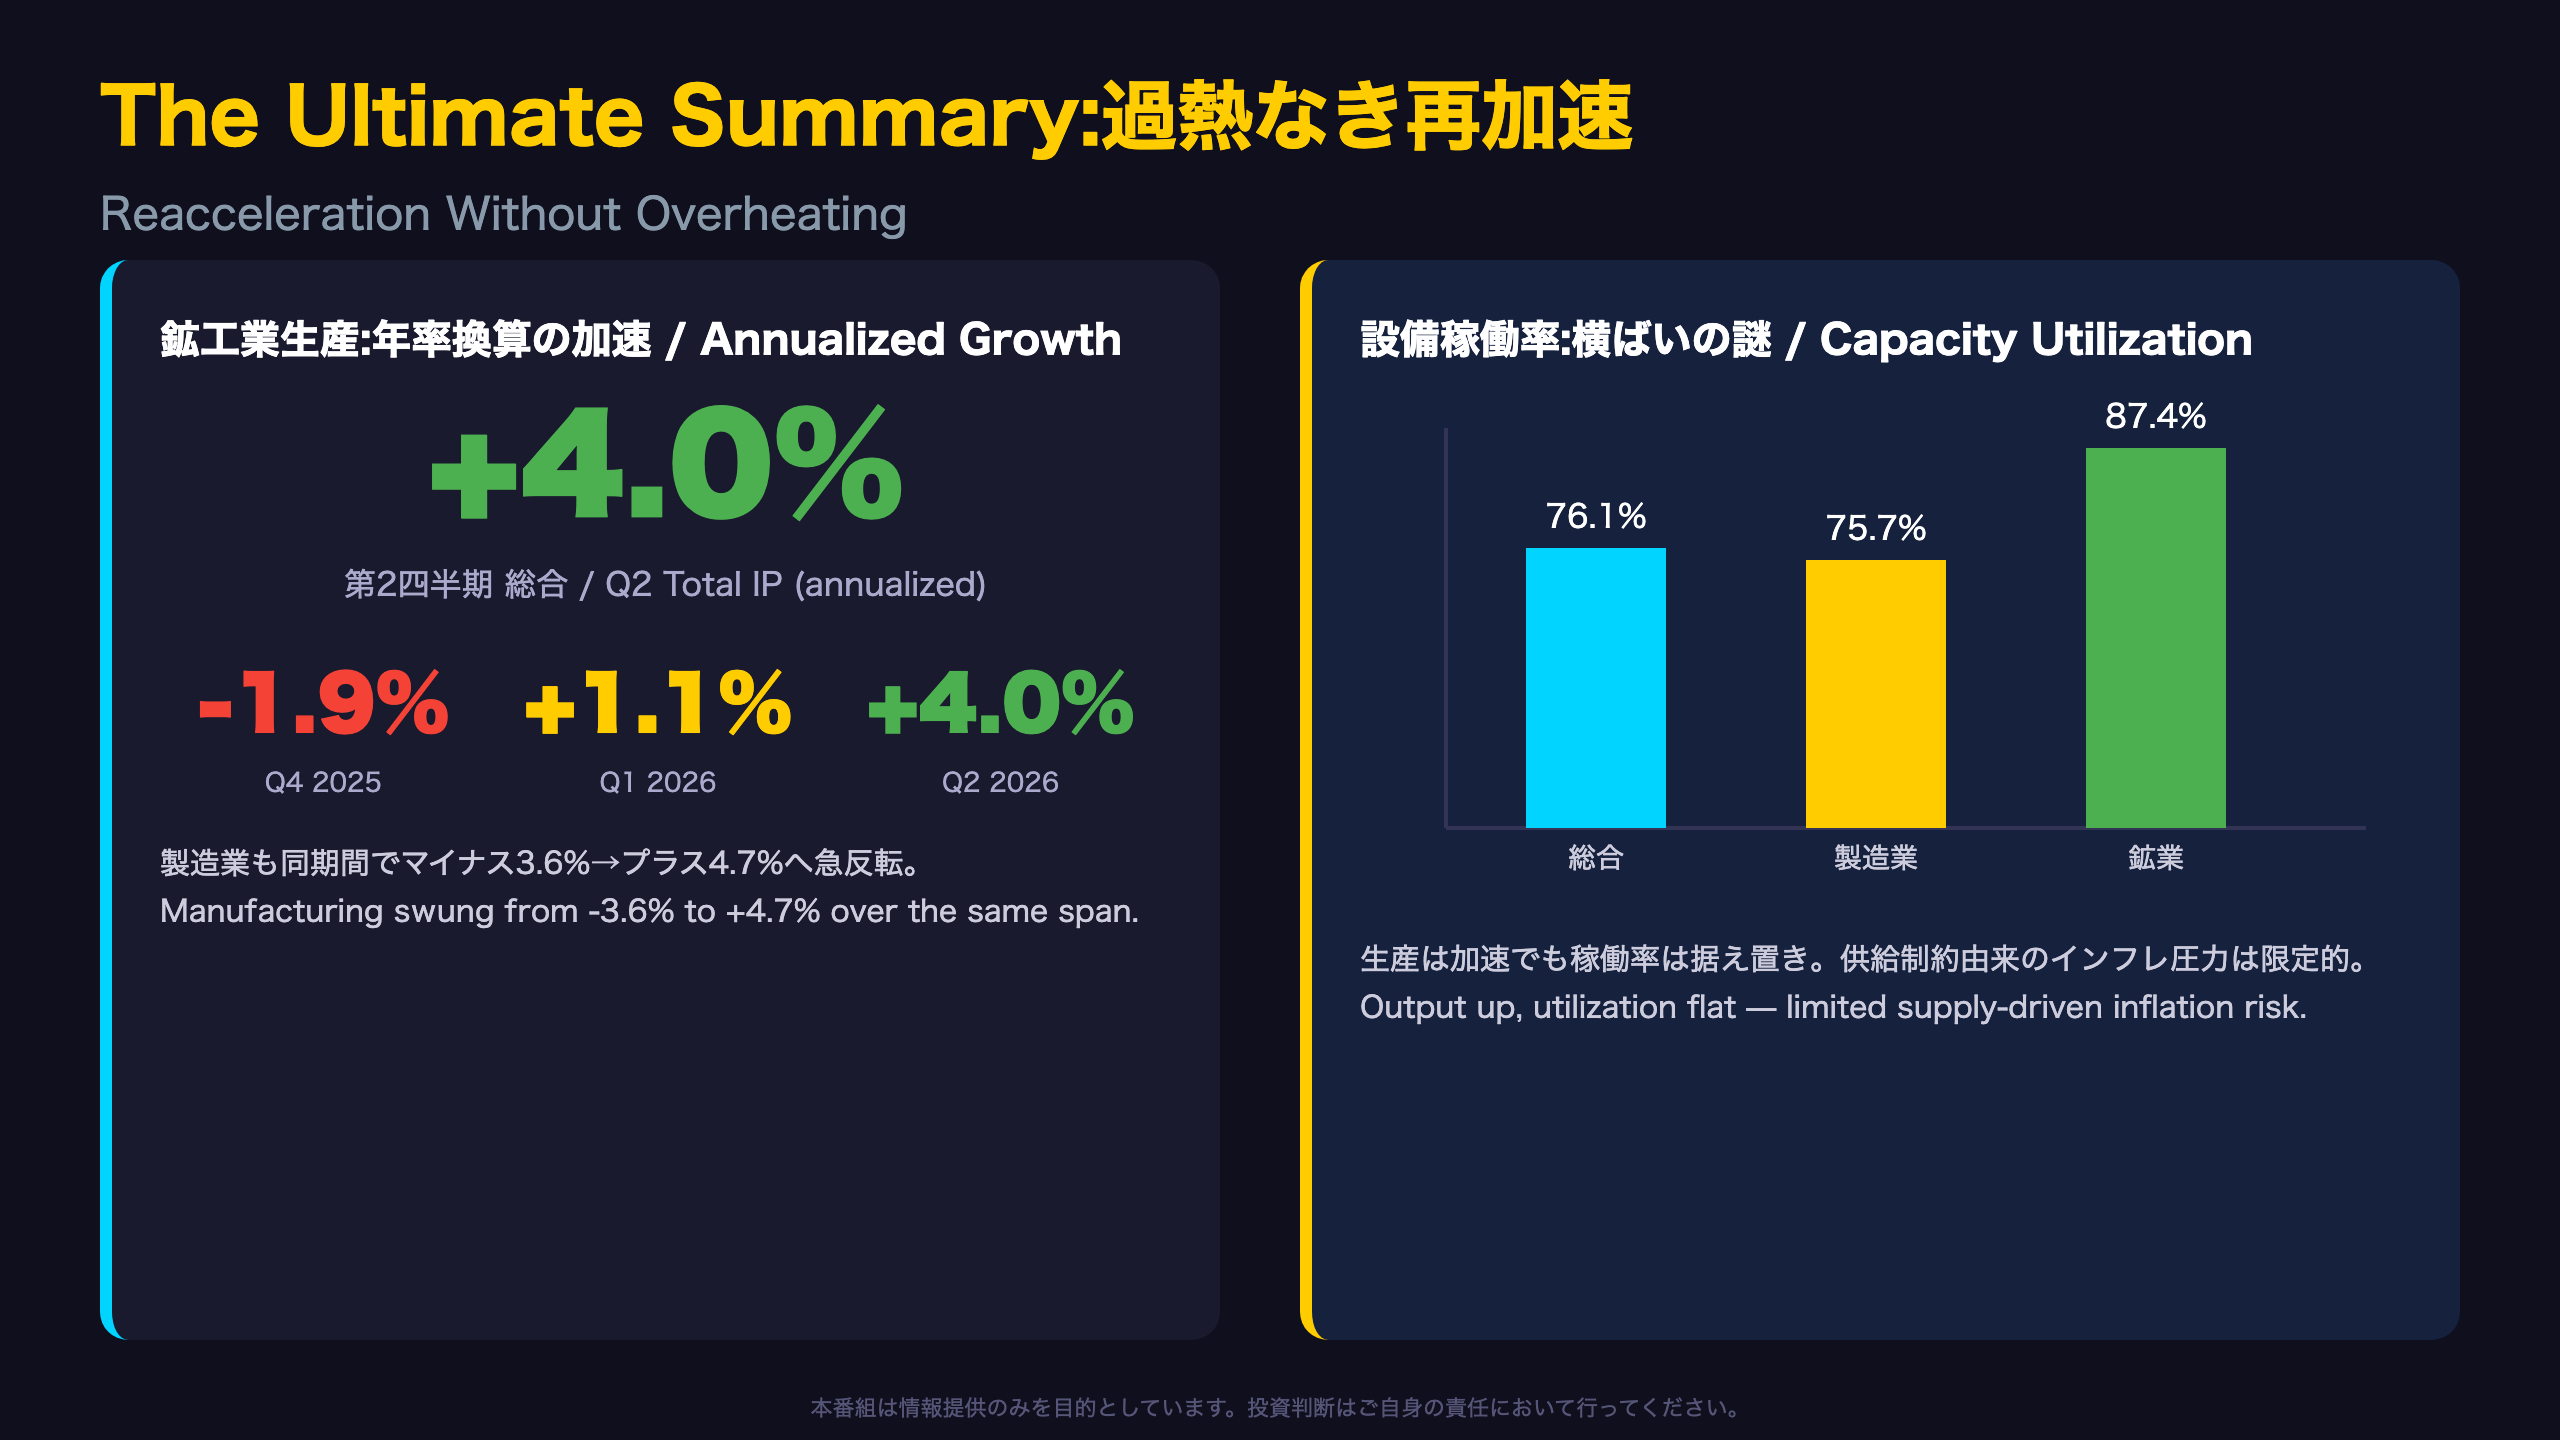
📈 But Q2 annualized growth hit 4.0% for total IP and 4.7% for manufacturing, a sharp reversal from Q4’s contraction.
Mining utilization climbed to 87.4%, above its long-run average, while durable manufacturing broadly softened.
⚠️ Capacity utilization held flat at 76.1% for a second month, still 3.3pp below its long-run average.
This combination—growth without rising utilization—suggests supply-side inflation pressure remains contained.
💡 We break down what this means for the Fed’s rate path and the dollar.
The Ultimate Summary:過熱なき再加速
Two Faces of the Same Number
The most striking feature of this G.17 release is the divergence between the monthly and quarterly readings.
- Monthly: June rose just +0.1% MoM (May also +0.1%), among the softest prints in six months
- Quarterly: Q2 grew at a +4.0% annualized rate (manufacturing +4.7%), a sharp reversal from Q4 2025’s -1.9% (manufacturing -3.6%)
The release states plainly: “Industrial production (IP) ticked up 0.1 percent in June and grew at an annual rate of 4.0 percent in the second quarter.”
Understanding the Gap
The Fed’s G.17 series is unusual among US data releases in publishing both monthly percent changes and quarterly annualized rates side by side. Annualized quarterly rates compound the three months of change, so April’s strong +0.8% gain likely carried the whole quarter even as May and June flattened out. This is a classic base-effect pattern, and readers who only track the monthly print risk misjudging the trend.
Bull and Bear Reads
Bulls argue this confirms the manufacturing cycle has bottomed after 2025’s slowdown fears. Bears counter that the deceleration into June (from +0.8% in April to +0.1% in June) shows the quarterly acceleration is largely inertia from earlier months, not fresh momentum. For context, US industrial production is the closest analog to the eurozone’s industrial production index or China’s industrial value-added—all closely watched by the Fed and FOMC as real-side (non-financial) growth signals. The next release, covering July data, is due August 18, 2026, and will be the key test of which read is correct.
月次データの裏側:四半期加速のメカニズム
Decomposing the Monthly Zigzag
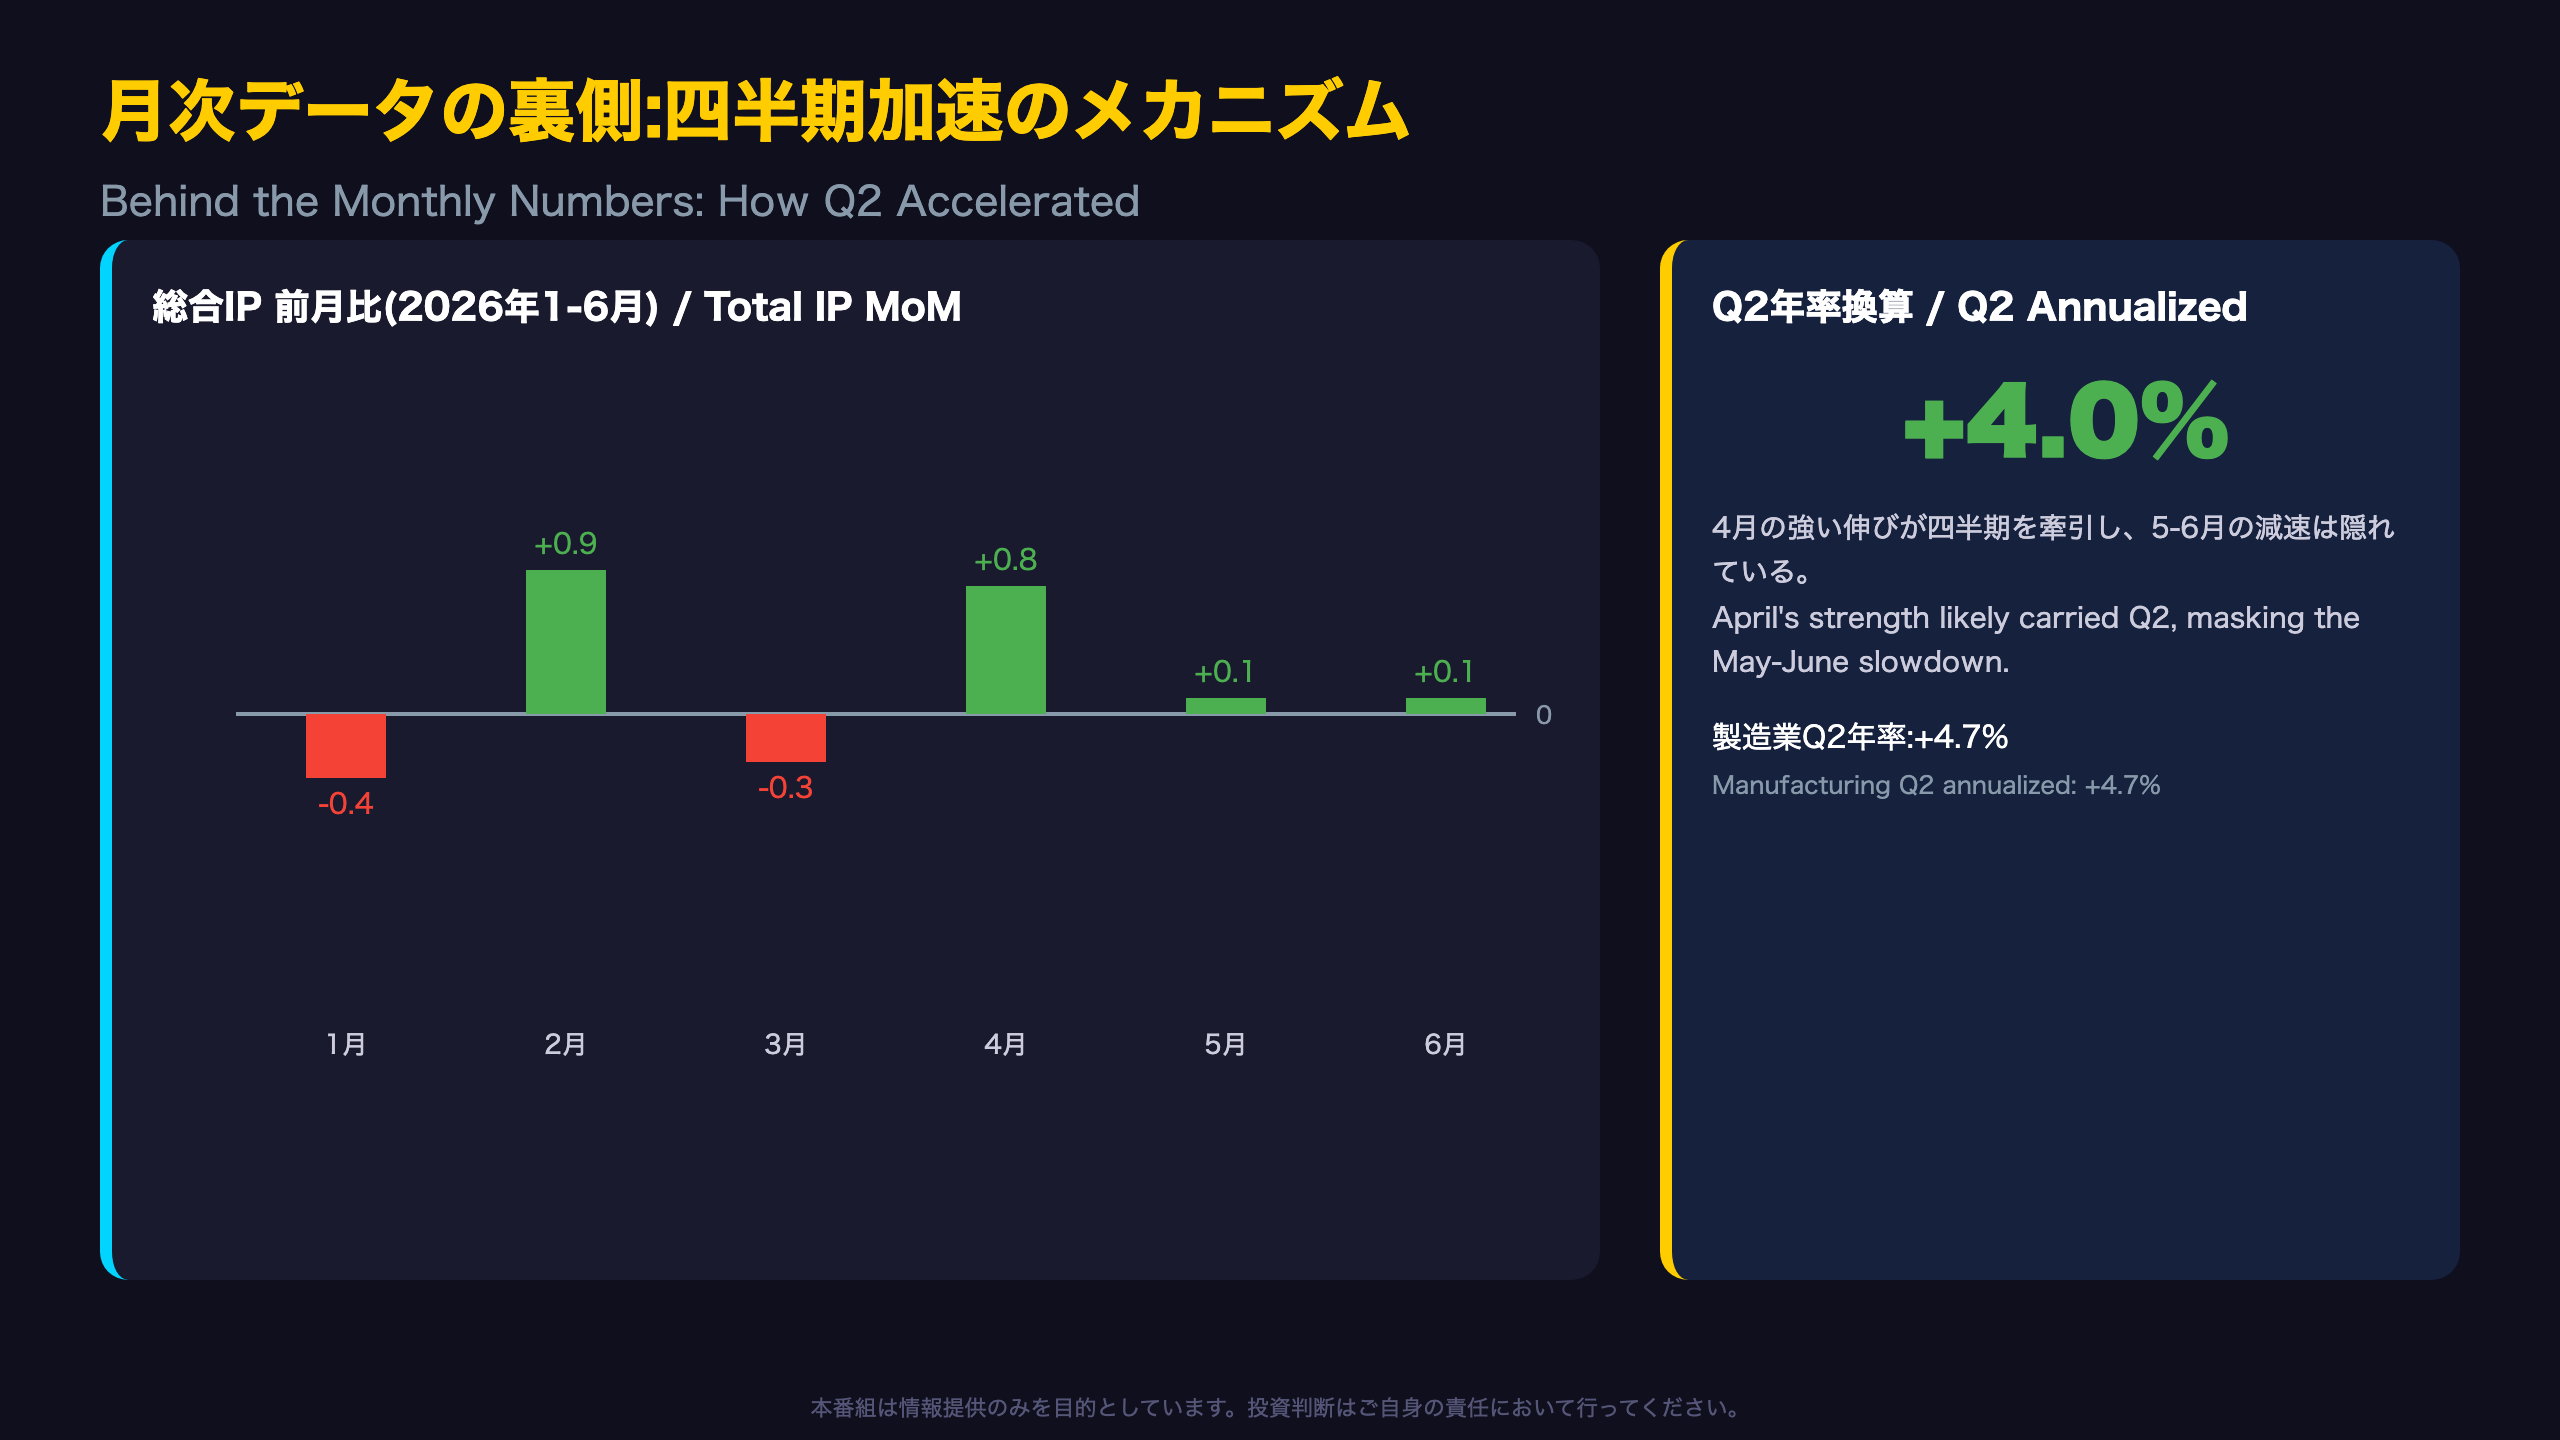
January through June 2026 monthly changes:
| Month | MoM |
|---|---|
| Jan | -0.4% |
| Feb | +0.9% |
| Mar | -0.3% |
| Apr | +0.8% |
| May | +0.1% |
| Jun | +0.1% |
The alternating negative-positive pattern in January/March versus February/April is notable and may reflect temporary weather or supply-chain disruptions (a single-month inference, not a confirmed structural signal).
How Annualized Rates Work
The Fed’s G.17 is one of the few US releases that publishes both monthly percent changes and quarterly annualized rates side by side—unlike, say, the ISM Manufacturing PMI, which is a diffusion index with no direct growth-rate equivalent. Annualized quarterly figures compound three months of change, so April’s strong +0.8% print likely drove most of Q2’s headline +4.0% result, even as May and June essentially flatlined near zero.
What to Watch Next
The next release, covering July data, arrives August 18, 2026. If July prints above +0.3% MoM, it would support a genuine reacceleration narrative; a reading near zero would instead suggest the Q2 acceleration was mostly carried by April’s one-off strength rather than fresh momentum—an important distinction for anyone positioning around US real-side growth data ahead of the September FOMC meeting.
セクター二極化:鉱業ブームと製造業の広範な軟化
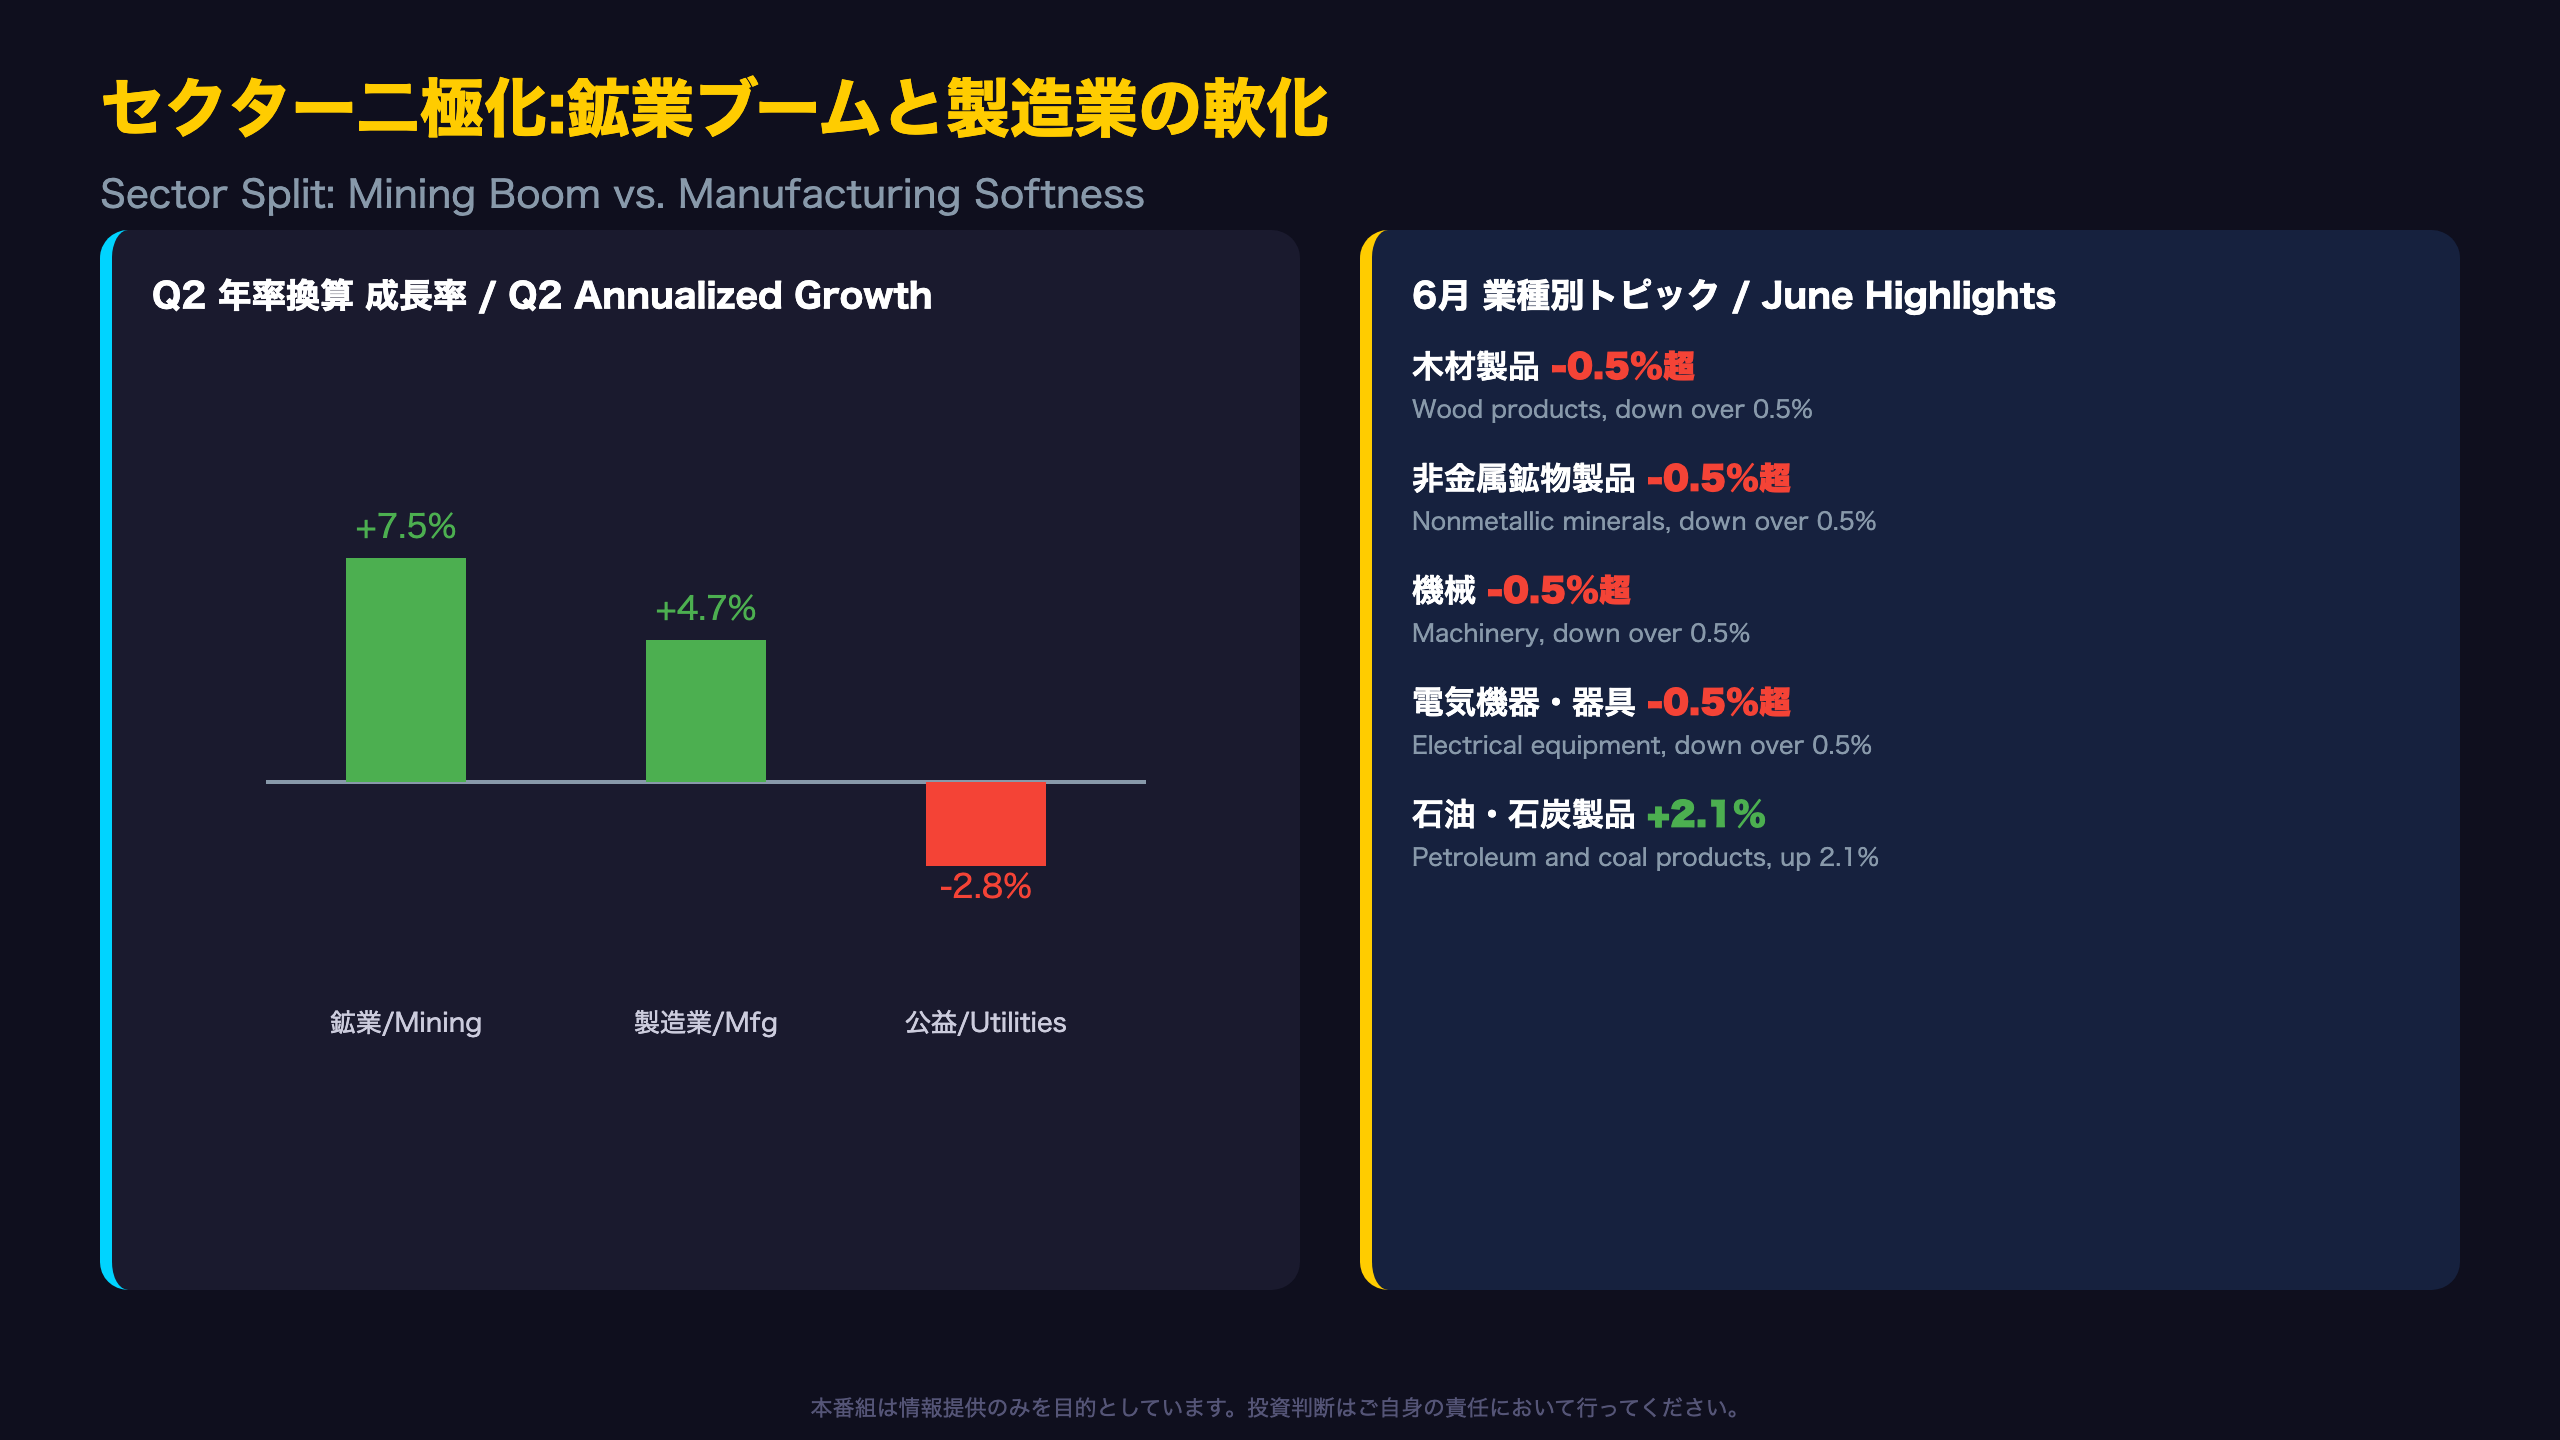
Winners and Losers by Industry
The release states: “Within durables, more industry groups posted losses than gains, with the indexes for wood products, for nonmetallic mineral products, for machinery, and for electrical equipment, appliances, and components each declining more than 0.5 percent.”
Four durable-goods categories declining more than 0.5 percent simultaneously looks less like monthly noise and more like it reflects softer housing-linked and capex-linked demand (a moderate inference supported by multiple concurrent indicators).
Nondurables’ Gain Was Almost Entirely Petroleum
Nondurable manufacturing rose 0.2%, but petroleum and coal products alone jumped 2.1% and accounted for nearly the entire gain. Strip that out, and nondurables were essentially flat—suggesting the print was driven by refining margins or crude price pass-through rather than broad-based demand strength.
Is Mining’s Tightness Structural?
Mining’s 87.4% utilization rate sits meaningfully above its 1972-2025 long-run average of 84.5%, and three consecutive months of output gains reinforce the case that this reflects genuine supply-demand tightness in energy and resource extraction—comparable in spirit to how OPEC+ spare capacity discussions are watched in oil markets. That said, mining’s weight in total industrial production is relatively small (roughly 11-12% of the 2025 IP composition), so its contribution to the headline figure, while notable, should not be overstated relative to manufacturing’s 74%-plus share.
設備稼働率のシグナル:拡大する生産能力とインフレなき成長
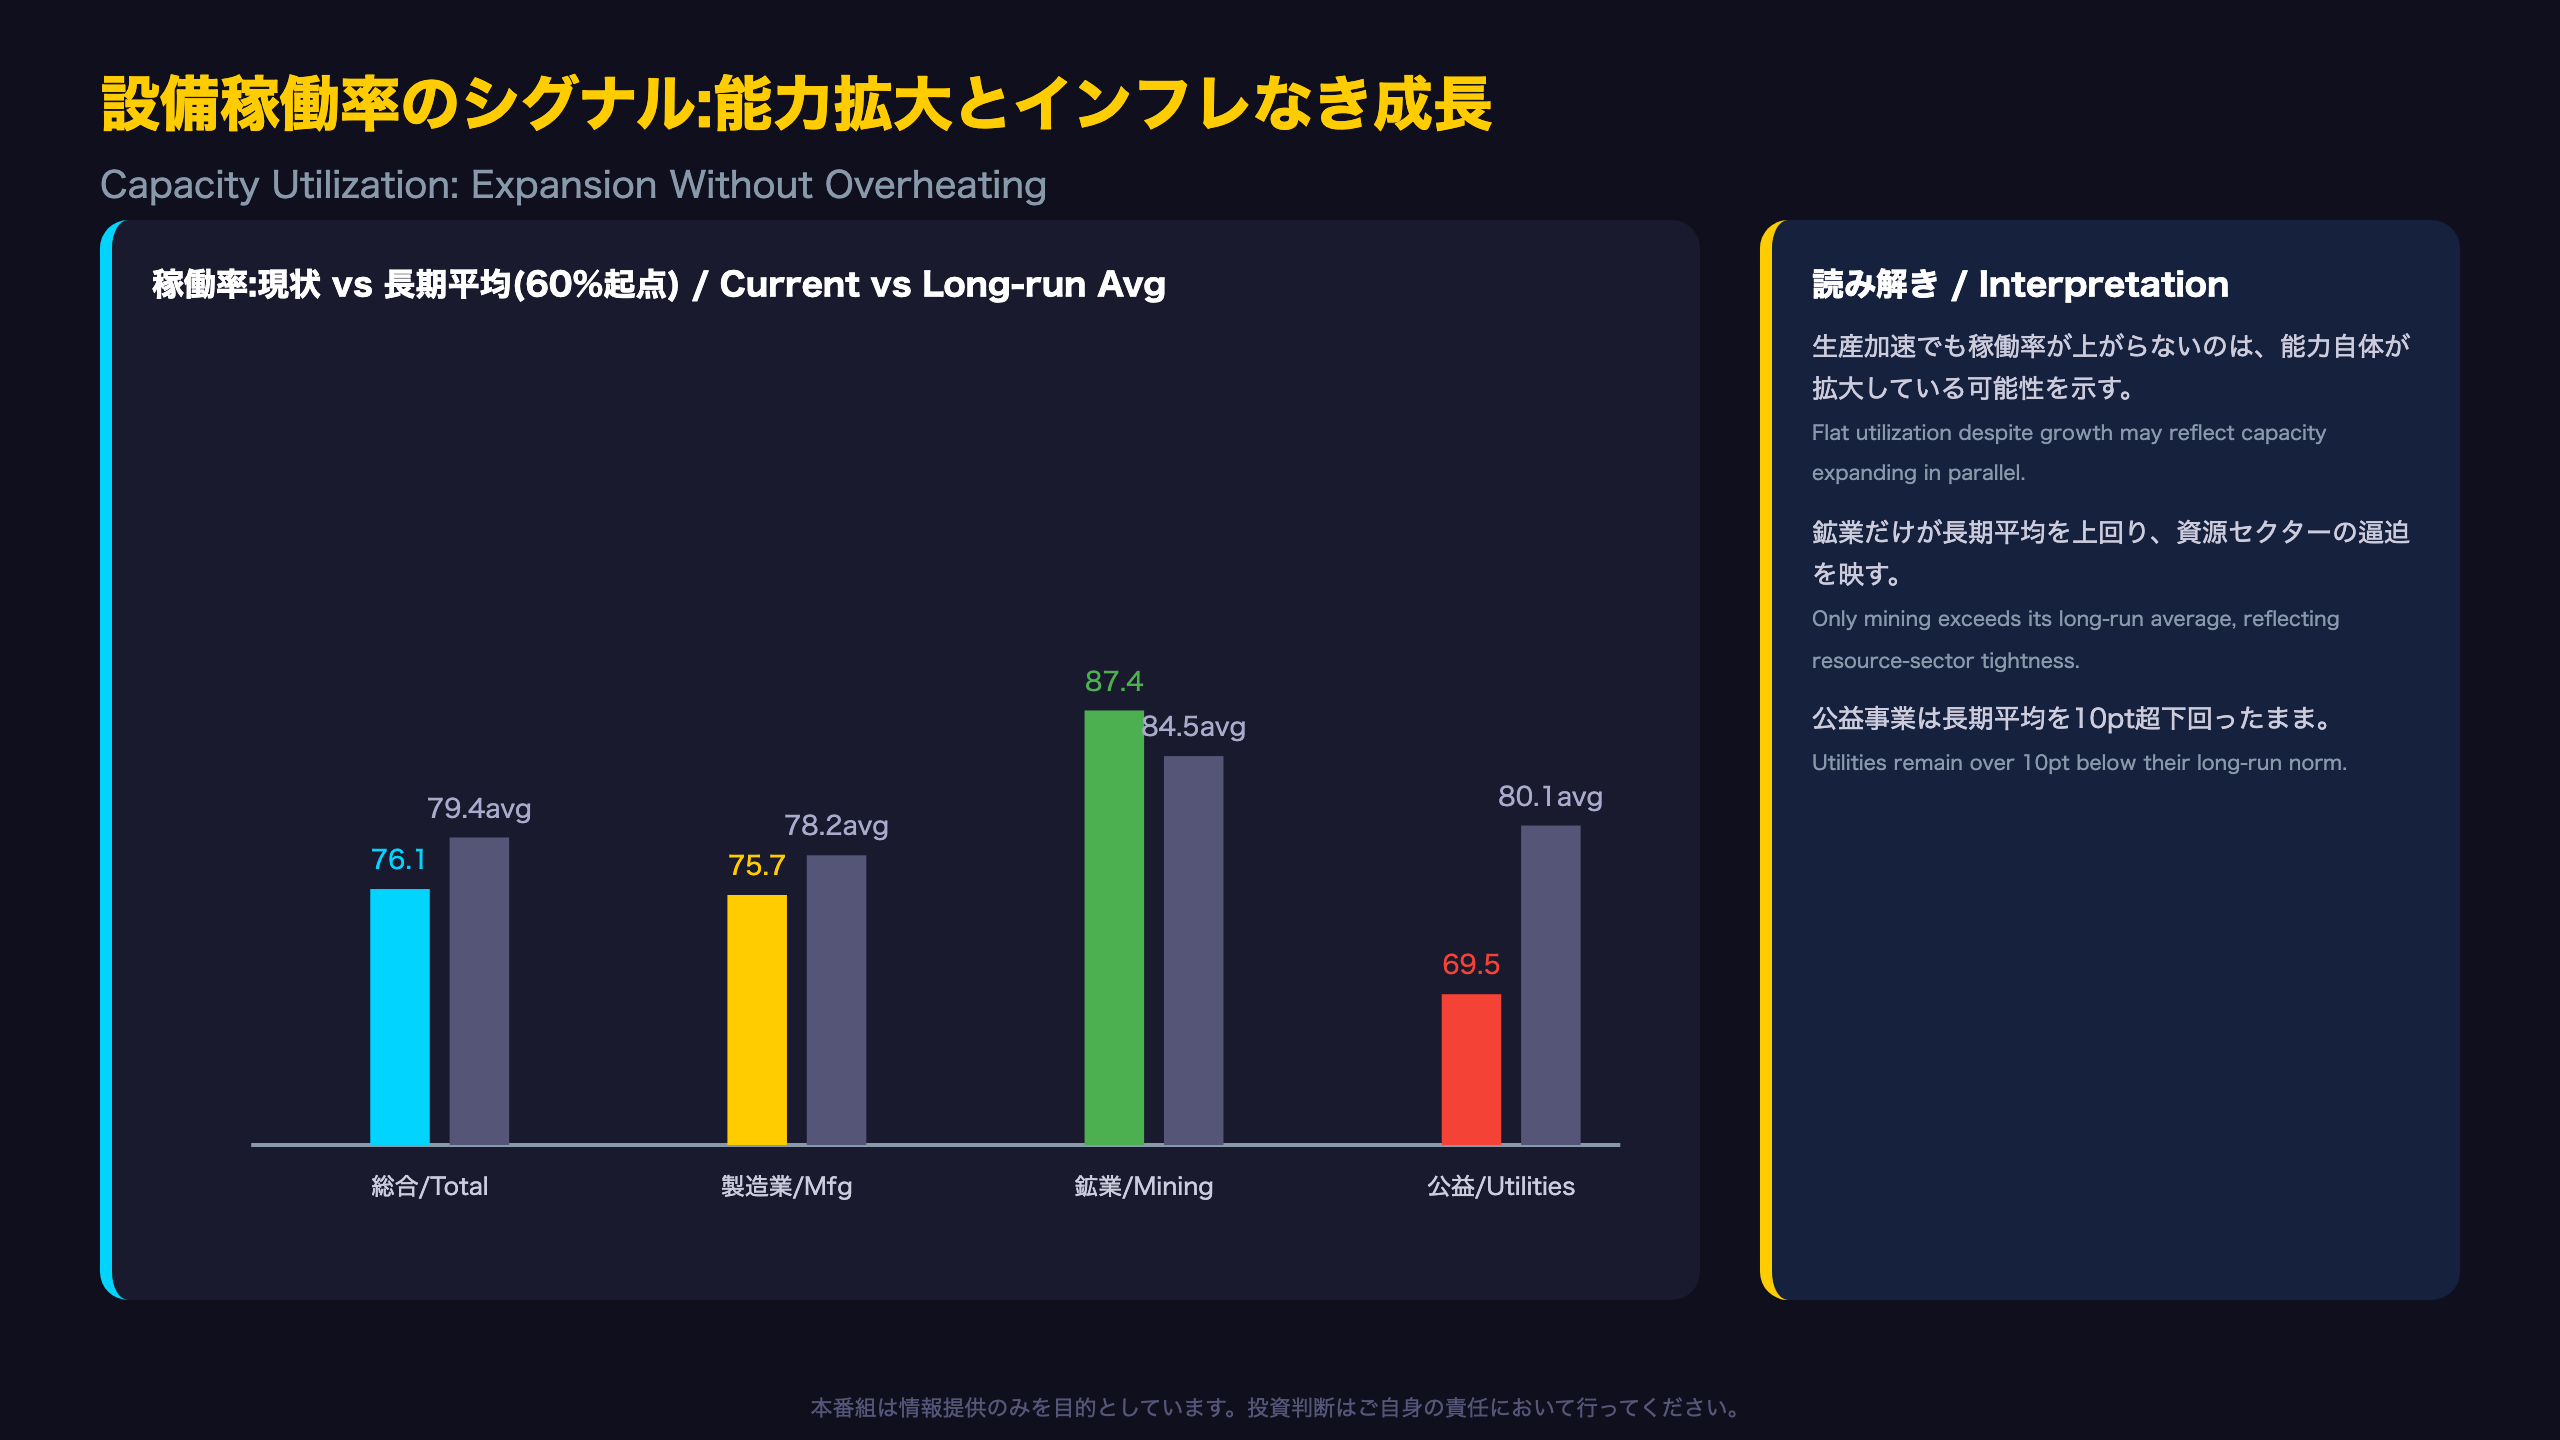
Why Isn’t Utilization Rising?
The release states plainly: “Capacity utilization was unchanged at 76.1 percent, a rate that is 3.3 percentage points below its long-run (1972–2025) average.”
Particularly notable is that manufacturing utilization actually ticked down slightly, from 75.8% in May to 75.7% in June, even as quarterly output grew 4.7% annualized. This implies the denominator—the Fed’s capacity index—expanded at least as fast as output itself. One plausible explanation (a moderate, multi-indicator inference) is that ongoing capex in data centers, AI-related infrastructure, and semiconductor fabrication is expanding measured capacity in parallel with production gains, a dynamic somewhat analogous to how US productivity growth has periodically outpaced GDP growth without triggering wage-price spirals.
Mining vs. Utilities: A Study in Contrasts
Mining’s 87.4% utilization, above its long-run average, reflects a boom in shale oil, gas, and broader resource extraction—comparable to how OPEC+ spare capacity metrics are tracked in global energy markets. Utilities, however, sit at 69.5%, more than 10 points below their 80.1% long-run norm, even as data-center-driven electricity demand is widely discussed in US media; this suggests supply (new generation and grid capacity) is currently expanding faster than demand in the aggregate utilization math, though this single data point cannot confirm the broader AI-power-demand narrative one way or the other.
Historical Context
Since 1972, average total-industry utilization has been 79.4%, and manufacturing 78.2%. Today’s 76.1% and 75.7% readings remain below those averages, but they are also far above the 2009 recession trough of 66.5% and 63.4%, respectively—a reminder that current slack, while real, is nowhere near crisis-era levels.
自動車組立とビジネス設備投資のまだら模様
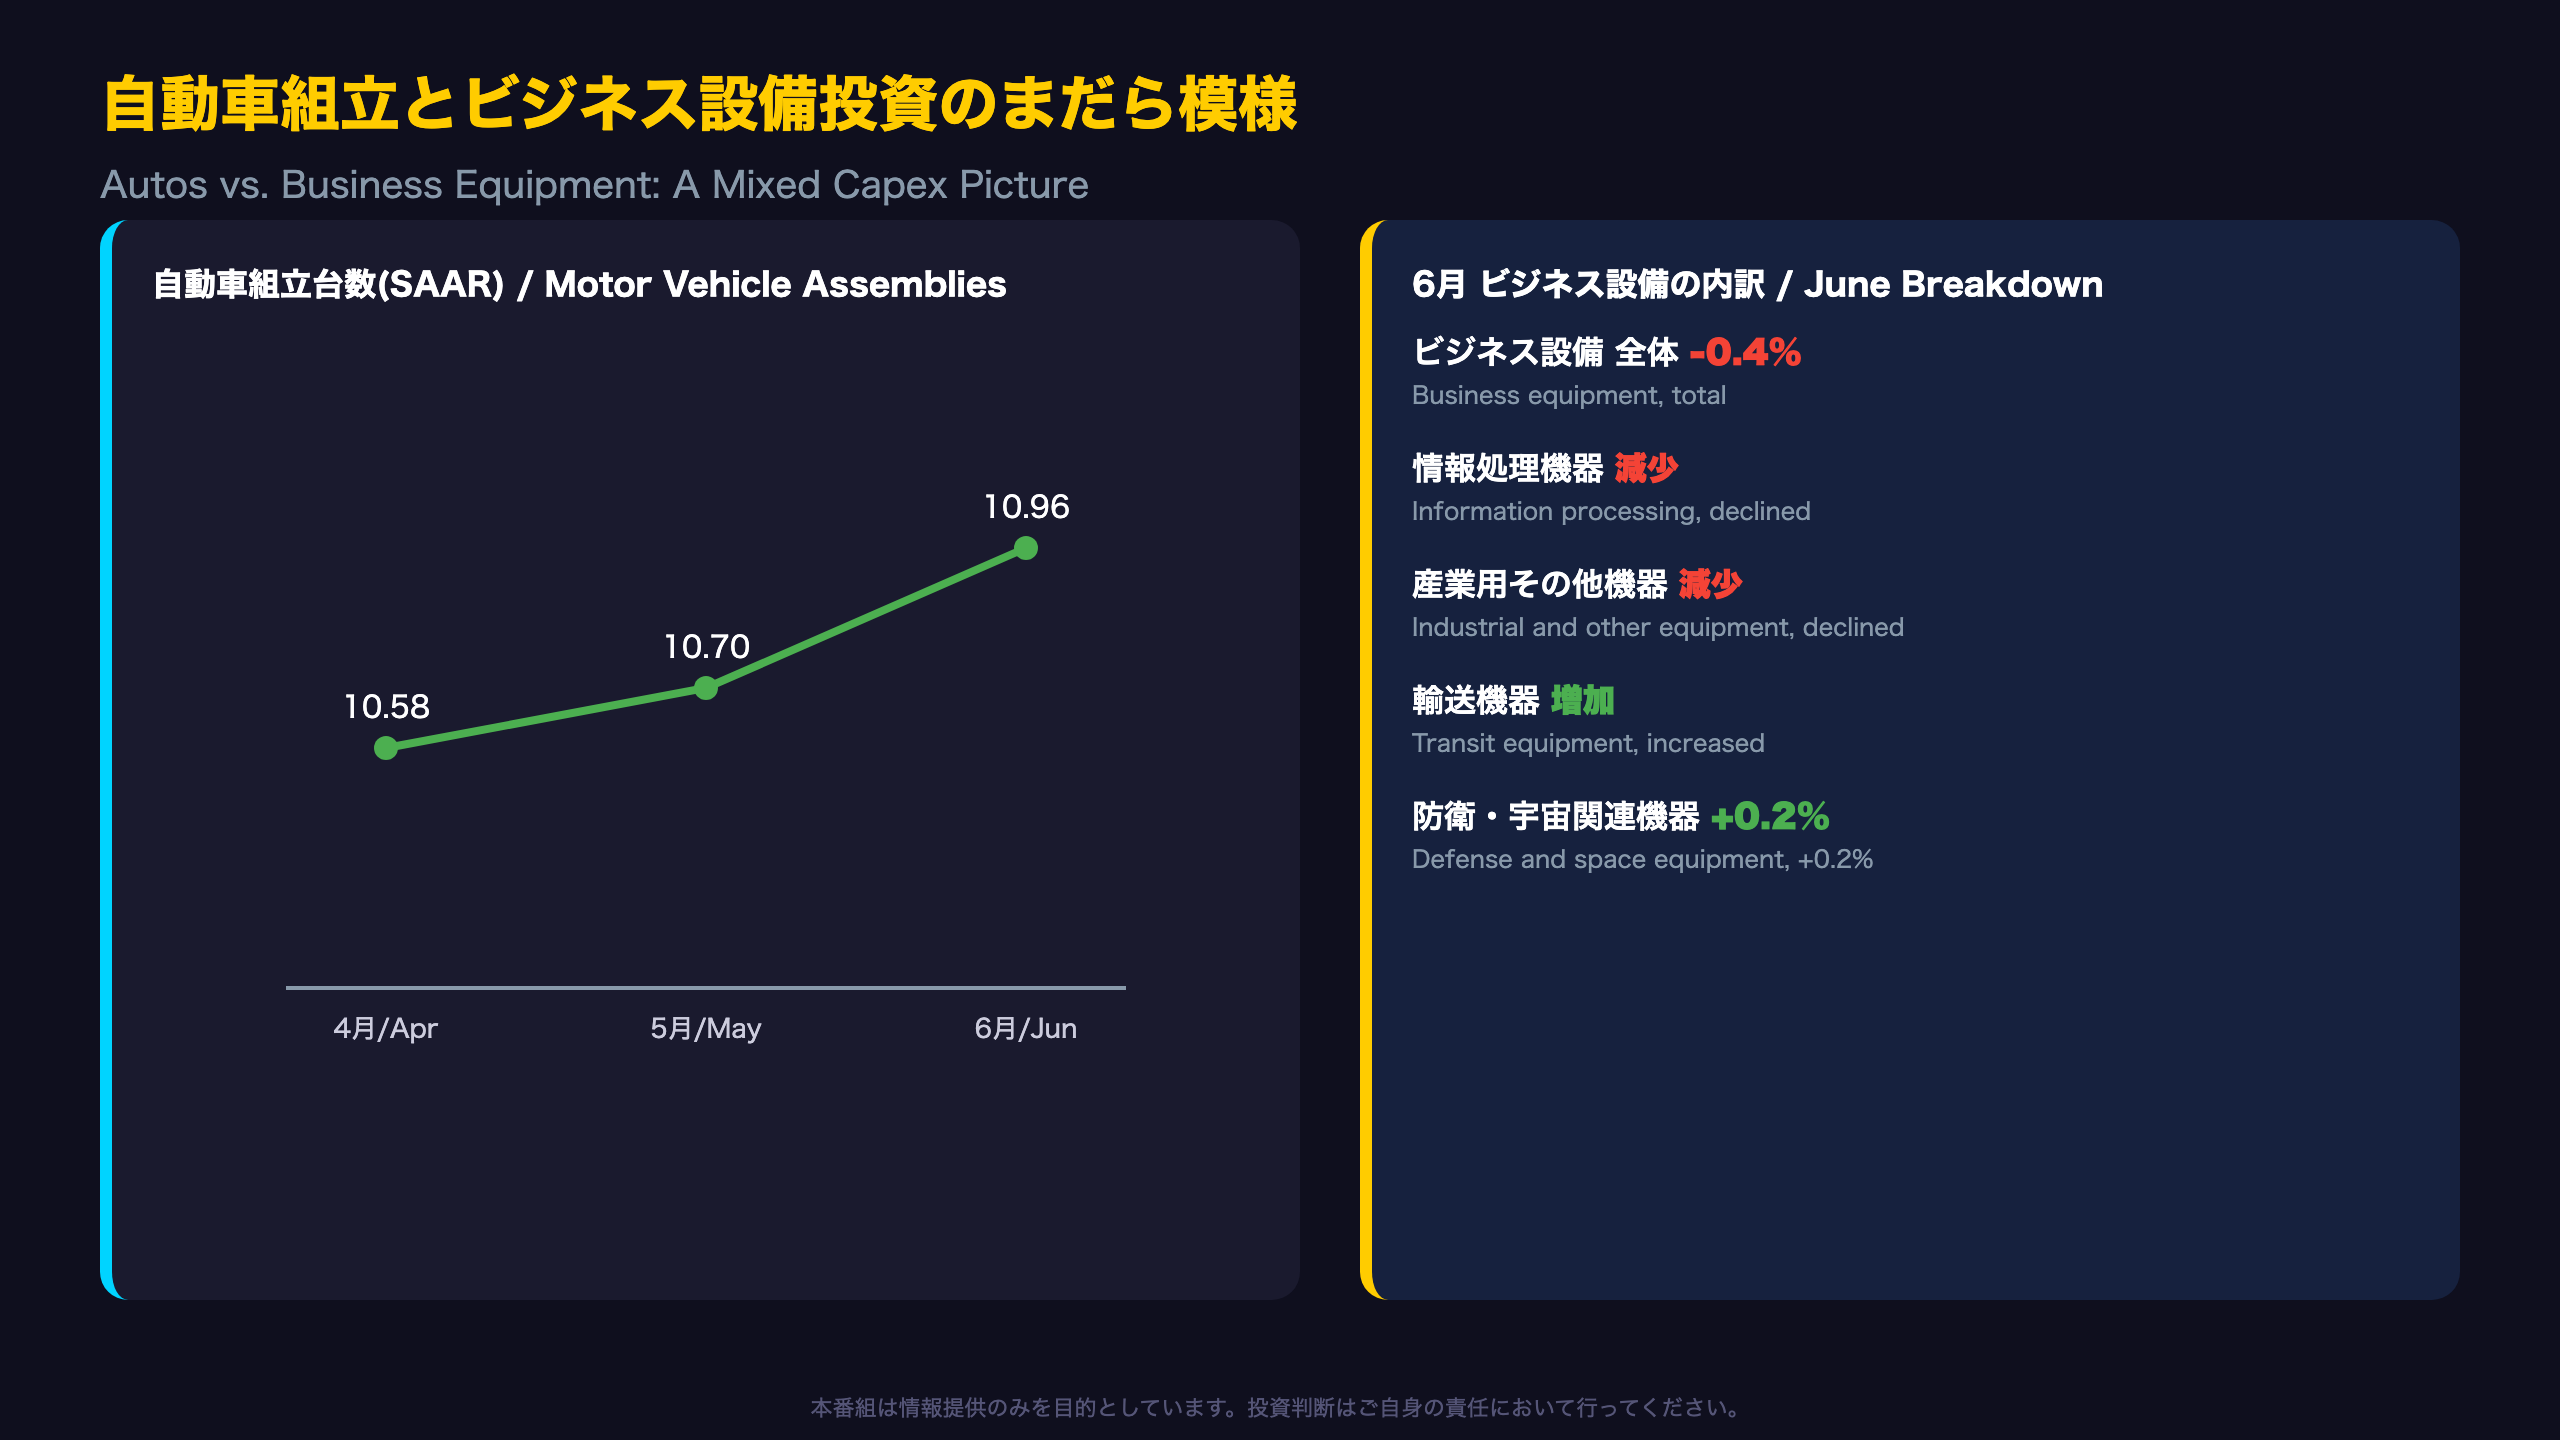
Autos: An Exception to Broader Softness
According to Table 3 (Motor Vehicle Assemblies), seasonally adjusted annualized total assemblies progressed as follows:
| Month | Assemblies (SAAR, millions) |
|---|---|
| Apr | 10.58 |
| May | 10.70 |
| Jun | 10.96 |
Three consecutive monthly gains show the auto sector holding up notably well even as durable goods broadly softened elsewhere. This aligns with the release’s note that transit equipment was the only positive contributor within business equipment.
A Shift Within Capex Categories
The release states: “The output of business equipment decreased 0.4 percent, with declines in the indexes for information processing and for industrial and other equipment more than offsetting an increase in the index for transit equipment.”
At first glance, softer information-processing equipment output seems to sit uneasily alongside widely reported strength in AI and data-center capital spending (comparable to how US business investment surveys like the ISM New Orders index are watched for capex signals). However, this is a single month’s data point, and it may reflect short-term inventory or production-cycle adjustments rather than a trend reversal (a cautious, low-confidence inference).
What to Watch
Whether the information-processing softness is transitory or the start of a trend will depend on the July and August releases—worth monitoring alongside private capex surveys such as durable goods orders from the Census Bureau, a complementary US data series that often leads or confirms G.17 equipment trends.
インプリケーション:FOMCとドル相場への含意
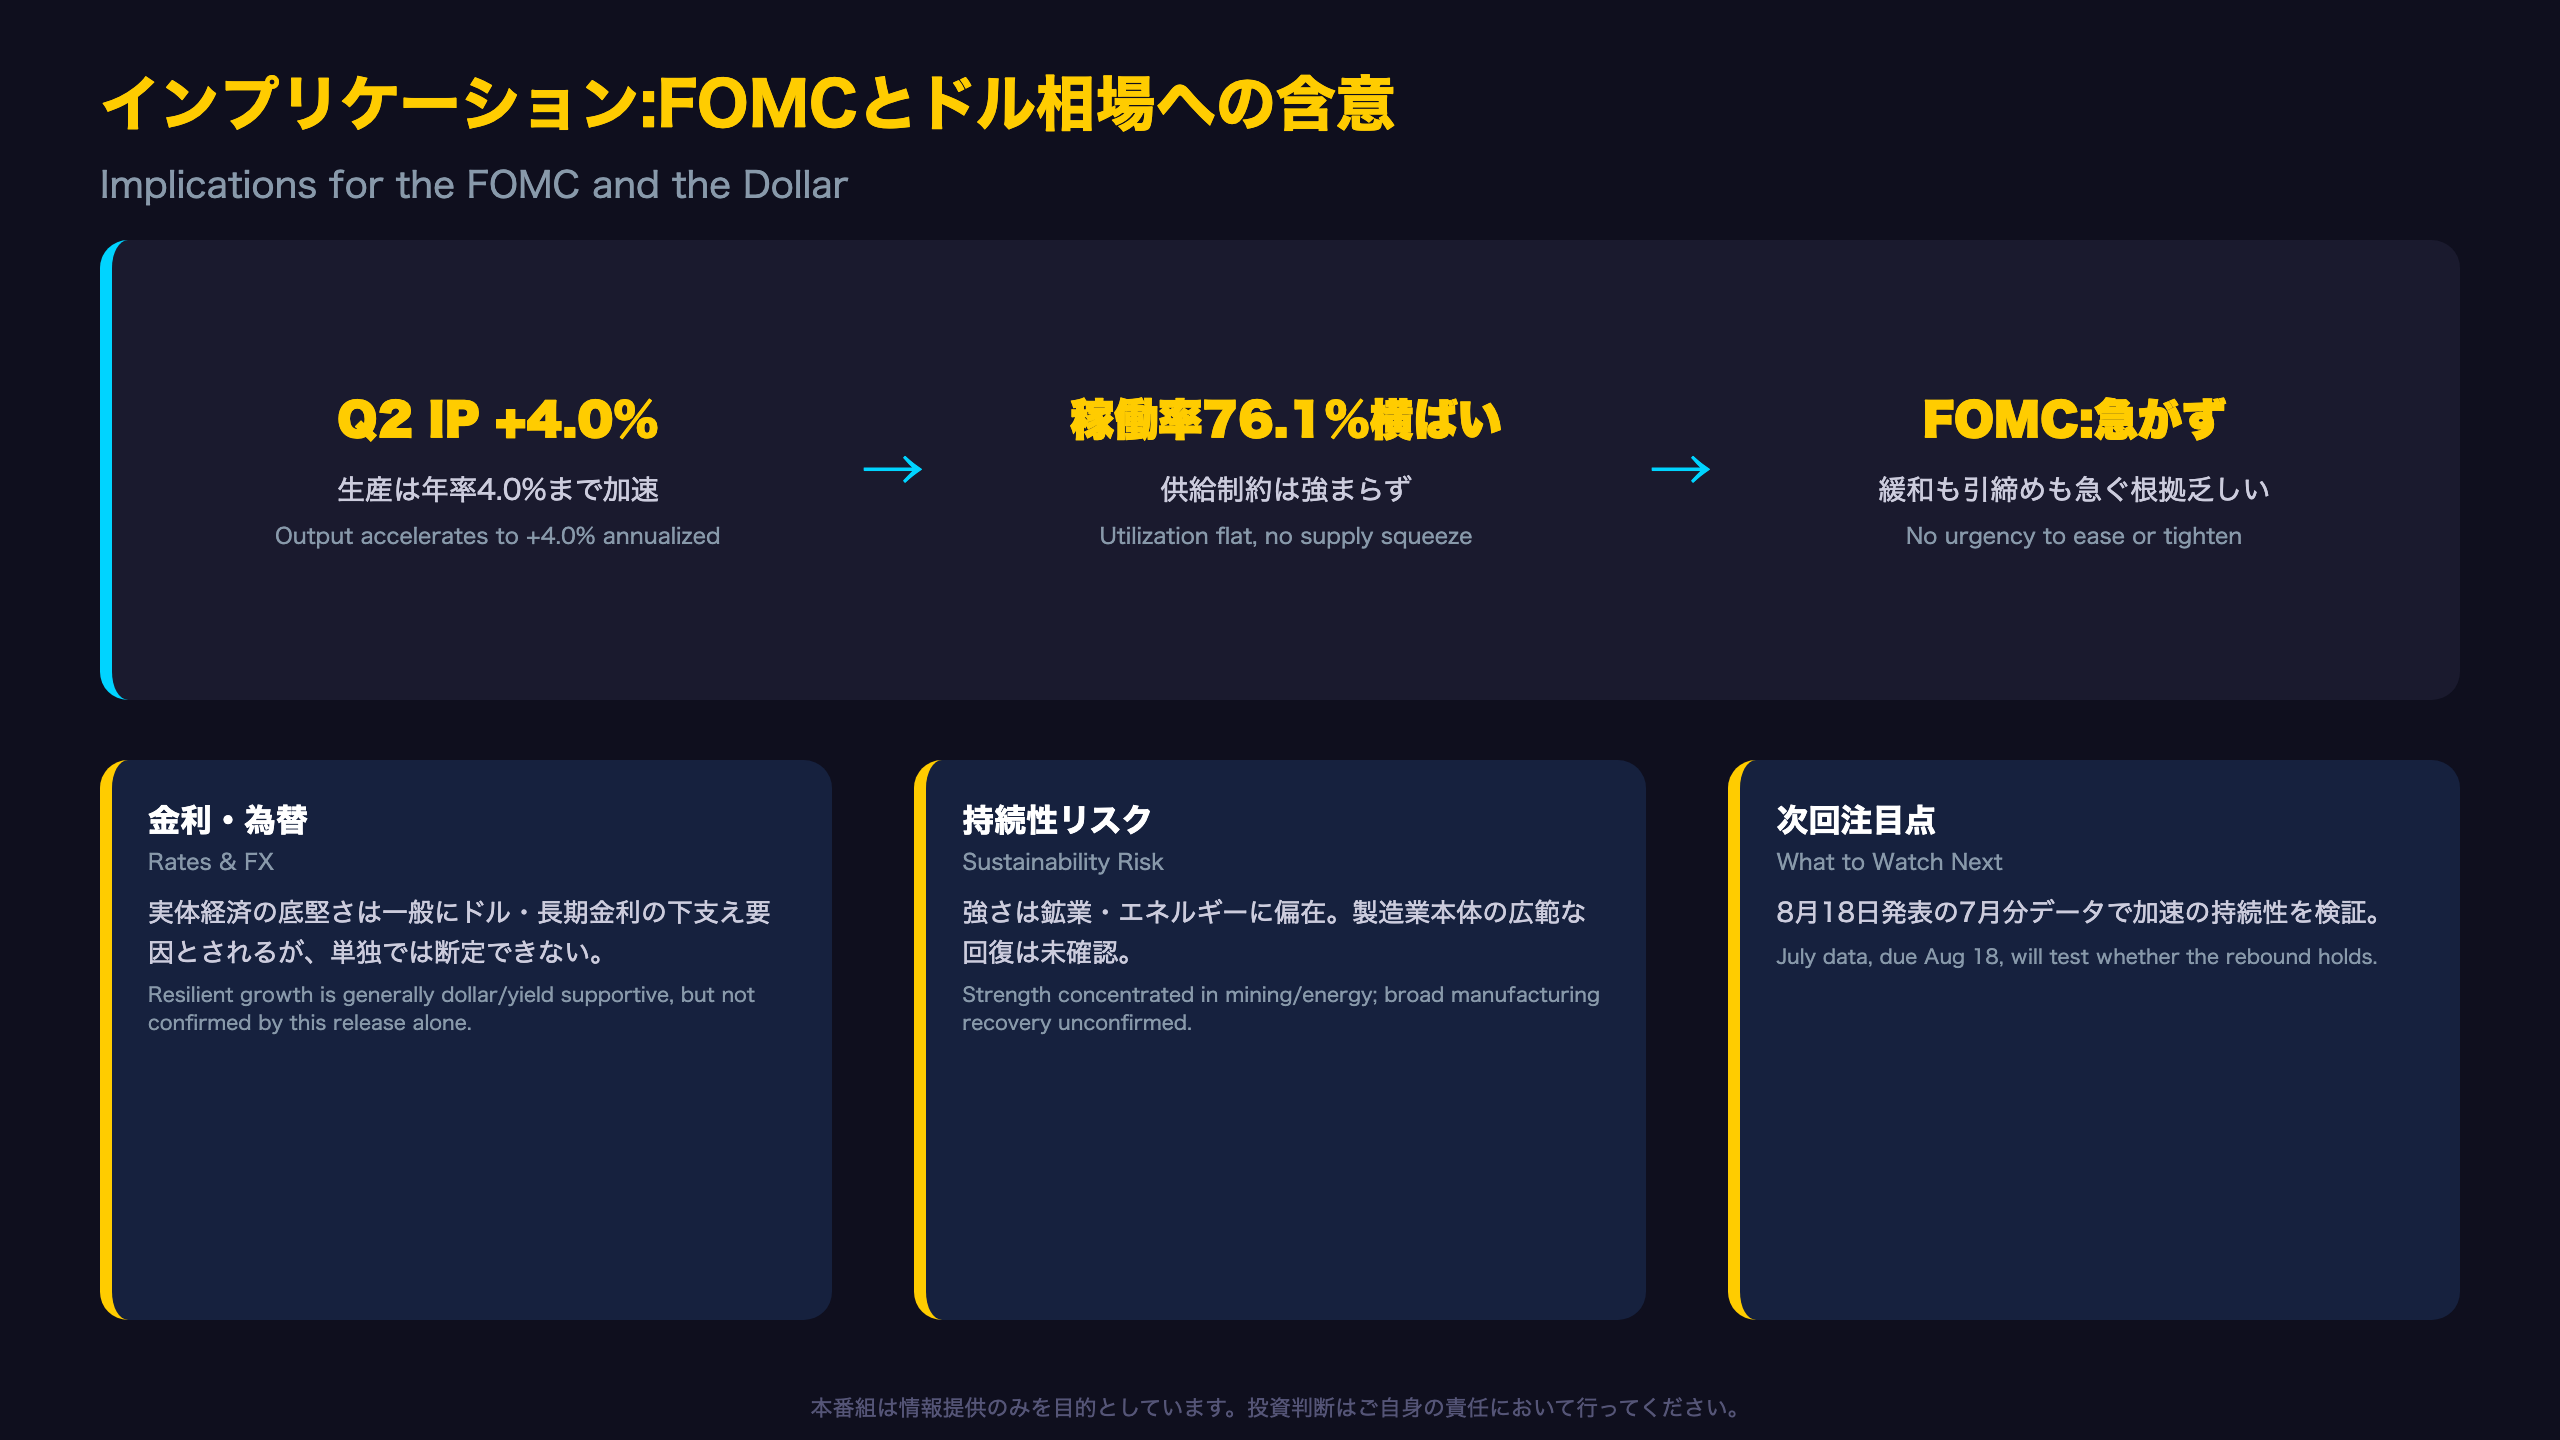
Tracing the Chain of Evidence
[Fact from the release] Q2 industrial production grew at a 4.0% annualized rate, manufacturing at 4.7%. Capacity utilization held flat at 76.1% for a second month, 3.3 points below its long-run average.
[Economic mechanism] Output growth without a rise in utilization implies capacity itself is expanding in parallel, or that existing slack is absorbing the additional production. As long as utilization remains below its long-run average, the risk of supply-constrained inflation feeding through into wages and prices appears comparatively contained.
[Market implication] It is generally believed that resilient real-side growth data, combined with limited supply pressure, gives the FOMC room to remain patient—neither rushing to ease nor to tighten. That said, this is a general market mechanism, and this G.17 release alone cannot determine the outcome of any specific upcoming FOMC meeting (no meeting date is specified in this release).
A Note for FX and Rates Traders
Reduced concern about a real-economy slowdown is commonly thought to be supportive for the dollar and longer-term Treasury yields, comparable to how strong US ISM or payrolls data typically firm up rate expectations. However, this needs to be triangulated against other releases such as nonfarm payrolls and CPI. The key swing factor to watch in the next release—July data, due August 18, 2026—is whether strength remains concentrated in mining and energy, or whether core manufacturing broadens out into genuine recovery.
Disclaimer: This article is for informational purposes only. All investment decisions are made solely at your own risk.