This article was automatically generated by the NFC Market Live AI analysis system. (Updated: 2026-07-16 21:43 JST)
📄 Primary Source
NFC Market Live
https://www.philadelphiafed.org/surveys-and-data/regional-economic-analysis/mbos-2026-07
📊 Deep dive into the Philadelphia Fed’s July Manufacturing Business Outlook Survey. The general activity index surged 31 points to 41.4, its highest level since November 2021 — nearly a five-year high.
📈 New orders and shipments also hit multi-year highs, suggesting broadening demand.
⚠️ Yet a rare inversion emerged: the 6-month-ahead future index now sits below current readings. Prices paid held at an elevated 53.9, with zero firms reporting declines.
💡 We break down the balanced, two-sided picture behind this month’s headline number.
総合活動指数、31pt急伸で5年ぶり高水準――されど先行き期待は逆転
Understanding the Five-Year High in Current Activity
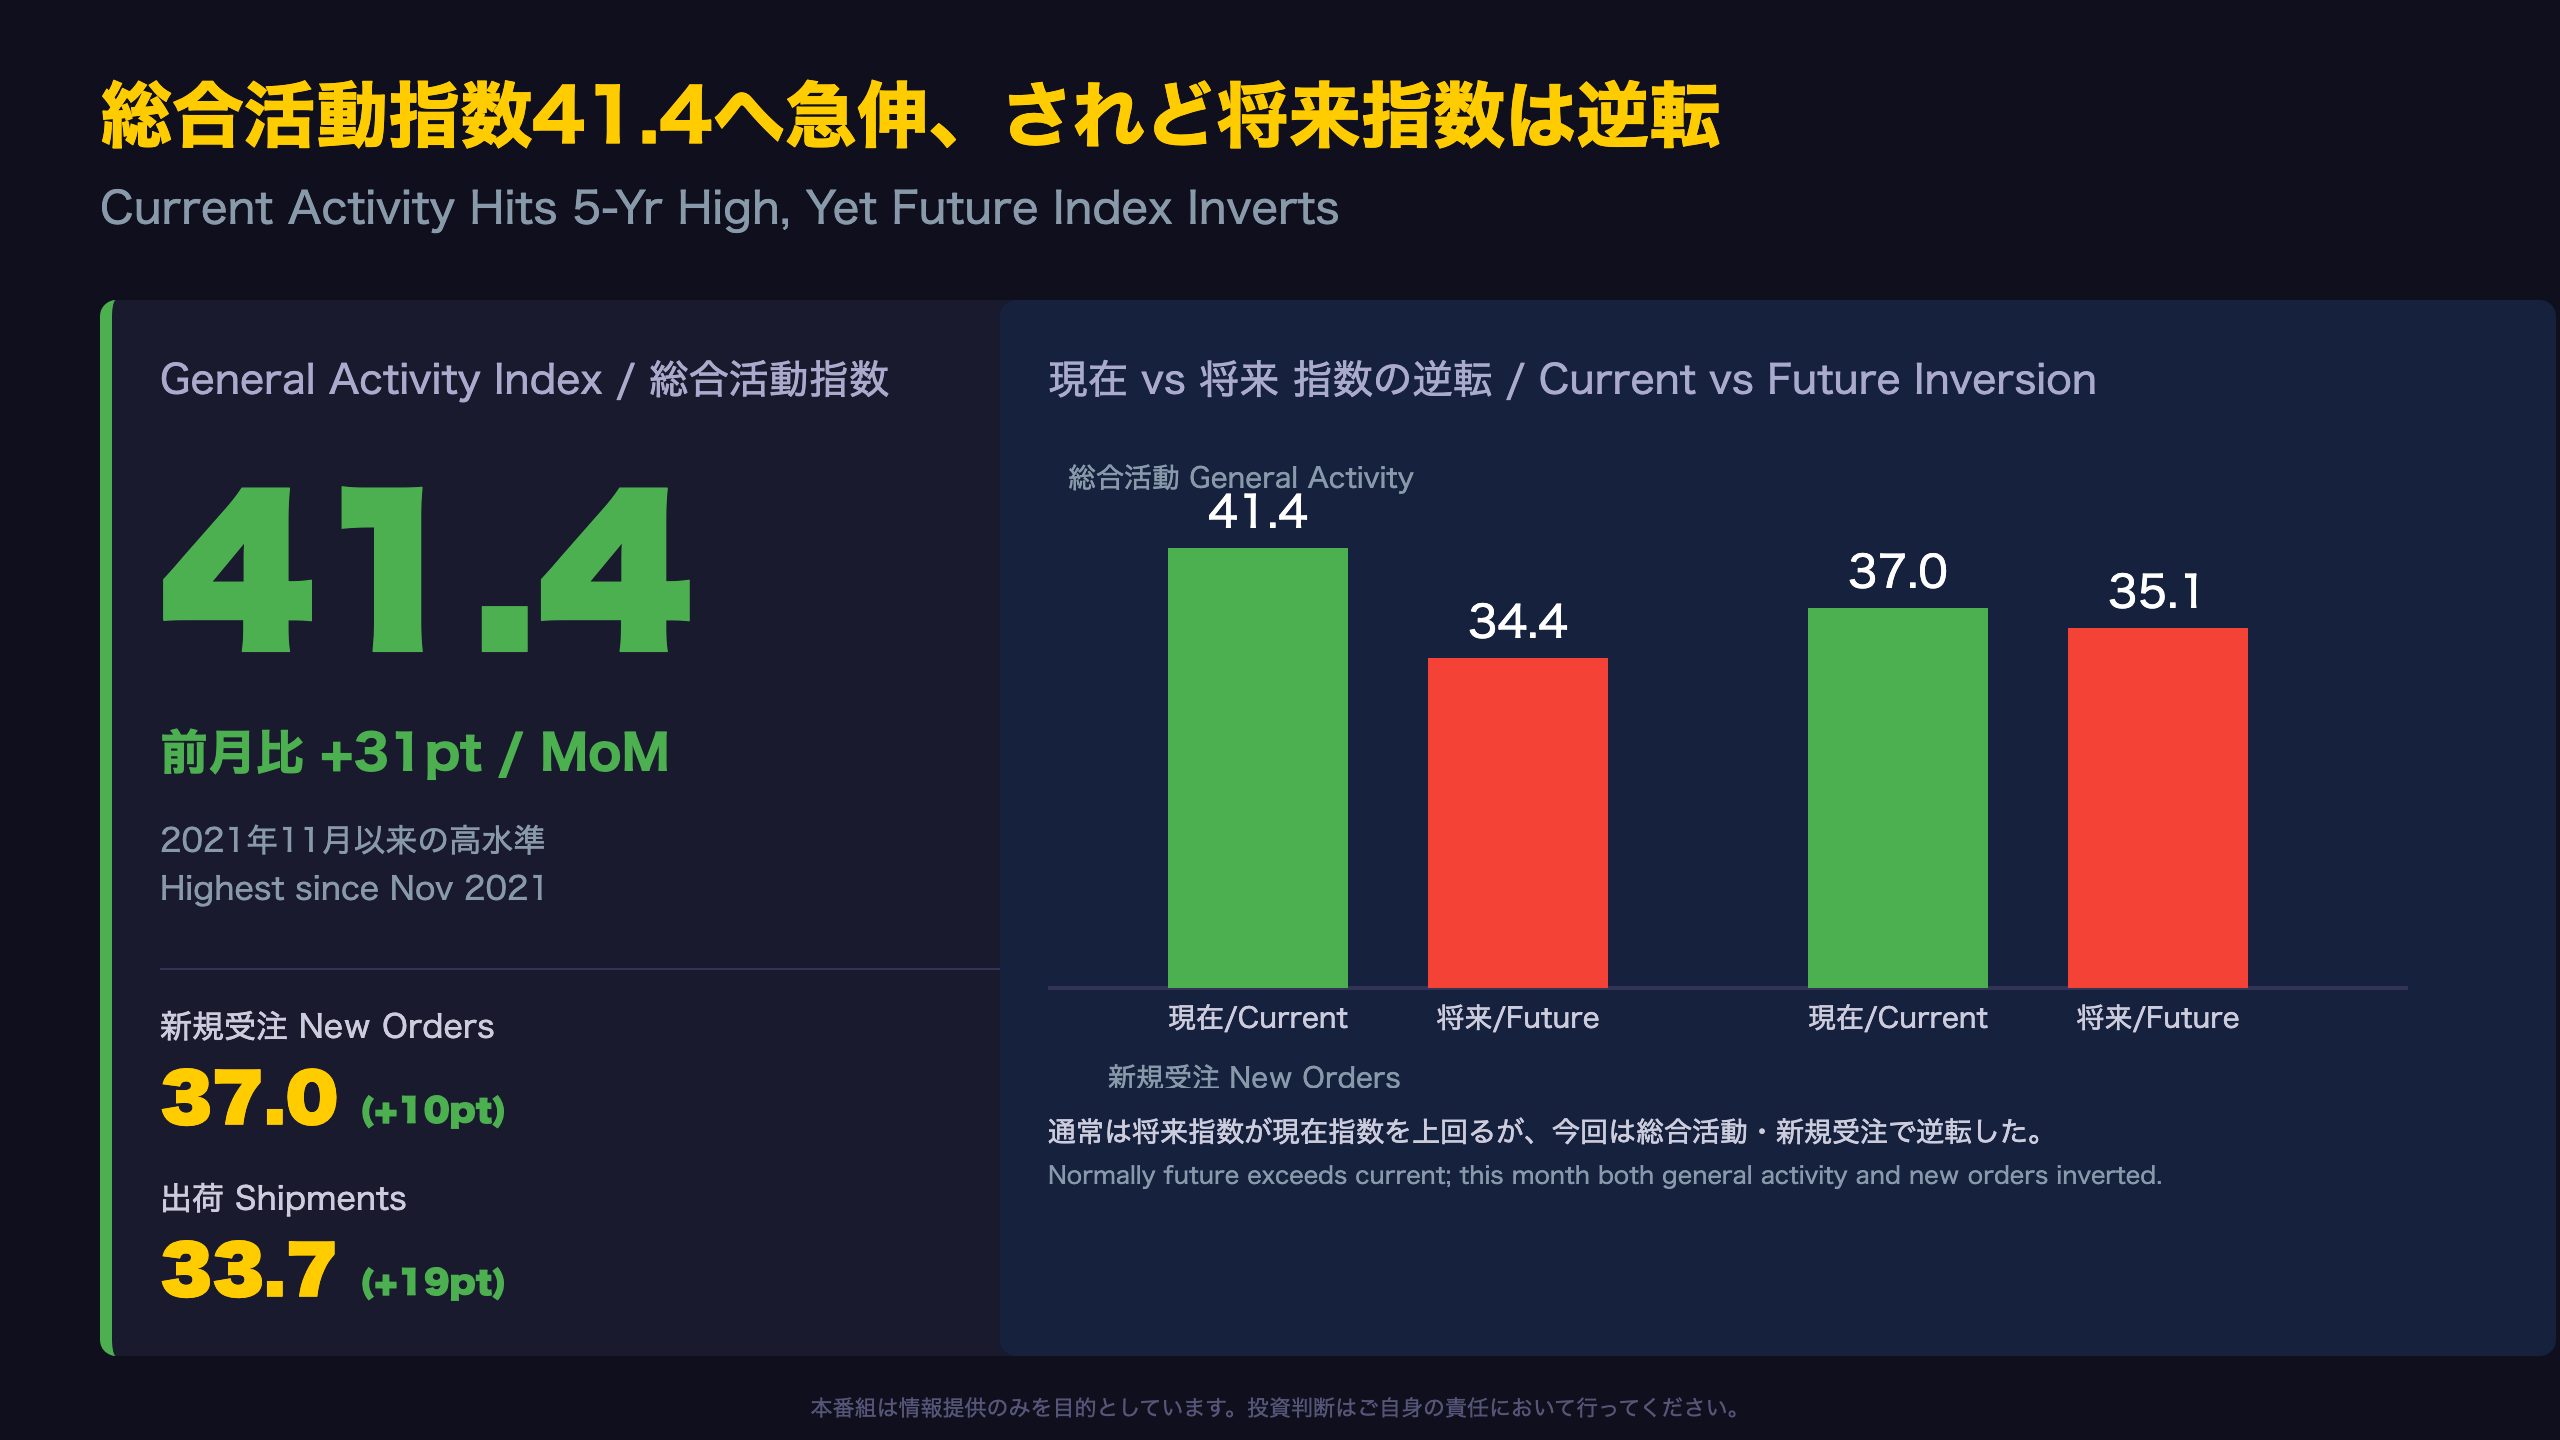
The Philadelphia Fed’s Business Outlook Survey (BOS), one of the earliest-released regional manufacturing gauges each month, showed its General Activity Index for current conditions rocketing 31 points to 41.4 in July — the highest level since November 2021, nearly five years ago. Unlike the ISM Manufacturing PMI, a national survey scaled 0-100 where 50 is the expansion/contraction line, the Philly Fed index is a diffusion index centered at zero (percent reporting increase minus percent reporting decrease), so readings above +30 represent unusually broad-based improvement.
Within the details, 53% of respondents reported increased activity (up from 32% in June), while only 12% reported declines (down from 22%). This breadth shift — not just the headline number — is what makes July’s reading noteworthy.
Direct quote: \”More than 53 percent of the firms reported increases (up from 32 percent), far exceeding the 12 percent reporting decreases (down from 22 percent).\”
The Curious Inversion
What deserves scrutiny is the relationship between current and future indices. The forward-looking index (6-month expectations) fell 16 points to 34.4, now sitting below the current reading of 41.4. This is unusual because respondents typically display an optimism bias, with future expectations running above current conditions. One plausible reading is that firms view July’s surge as a peak rather than a sustained expansion — though this is a single-month observation and should not be treated as a confirmed trend.
For US investors, this regional print is often referenced as an early proxy for the national ISM Manufacturing PMI, though correlation is imperfect given Philly Fed’s district-specific composition. The next release, expected mid-August, will be key to confirming whether this inversion persists.
需要指標の同時多発的改善――新規受注・出荷の内訳
Simultaneous Improvement Across Demand-Side Indicators
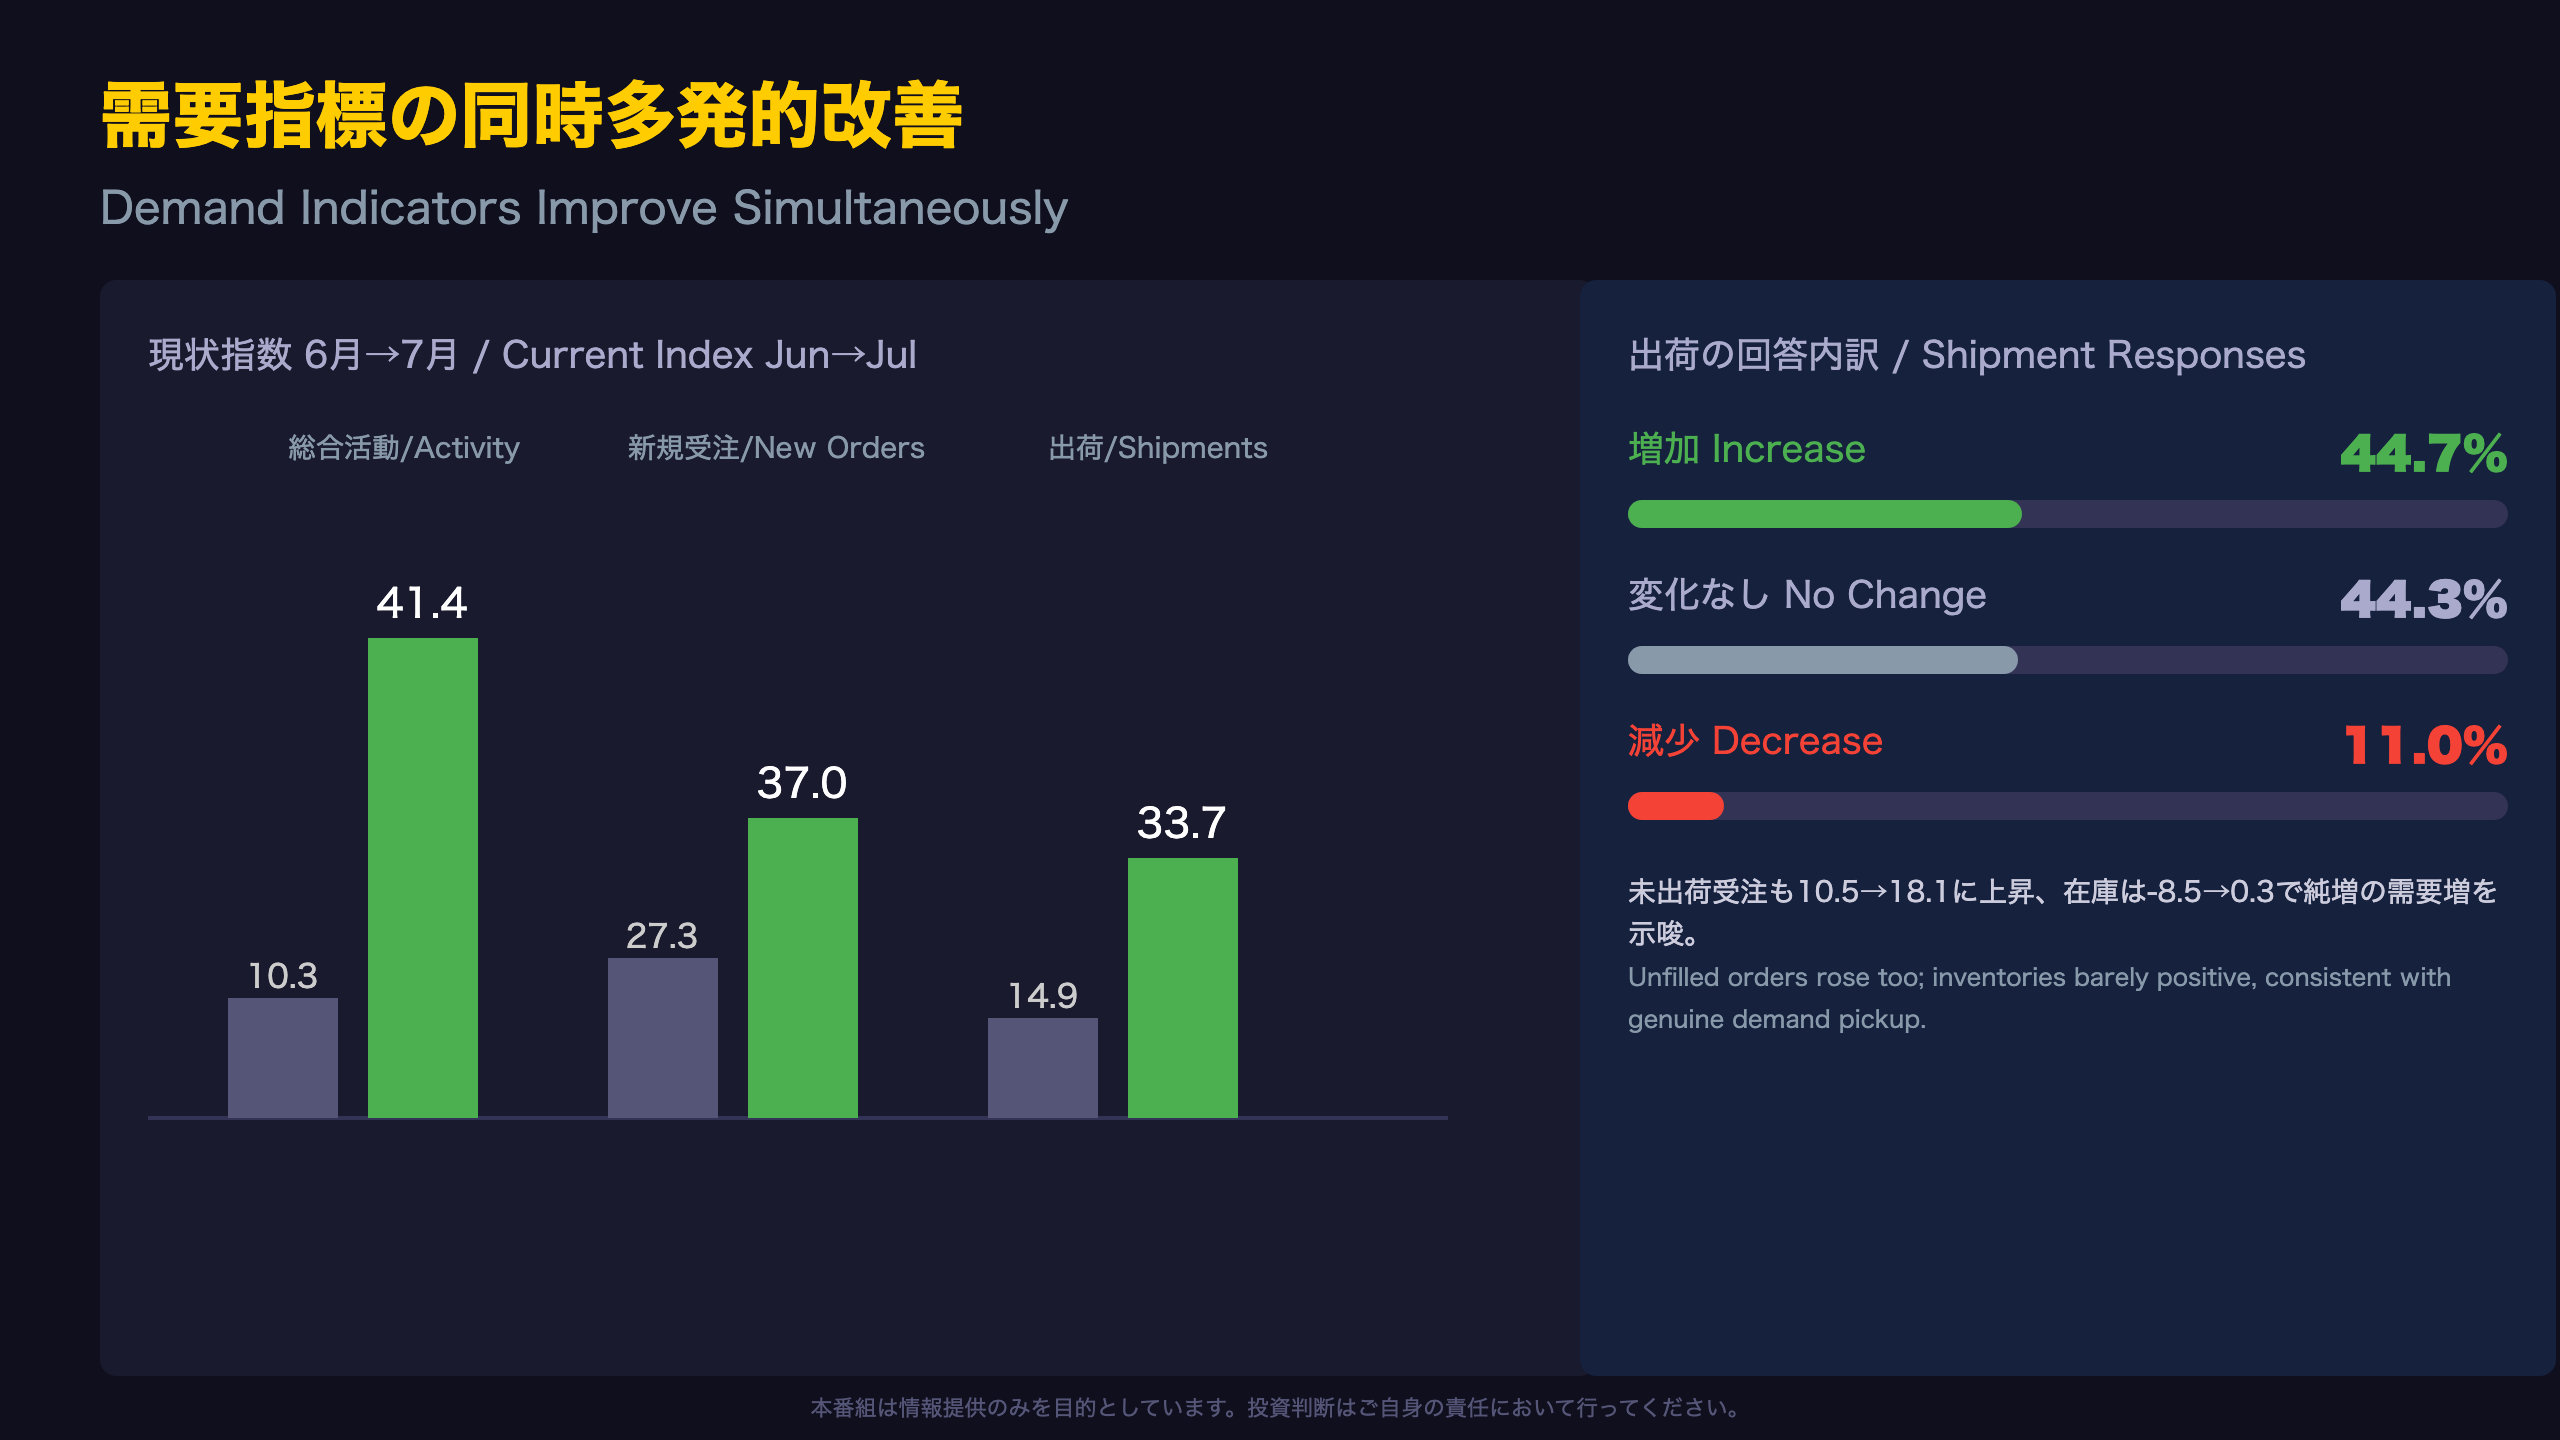
The standout feature of July’s report is that the three core current-condition indexes — general activity, new orders, and shipments — all rose together and each reached multi-year highs. New orders climbed from 27.3 to 37.0 (+10pt, highest since November 2021), while shipments jumped from 14.9 to 33.7 (+19pt, highest since April).
Shipment Breakdown Detail
Within shipments, 44.7% of firms reported increases, 11.0% reported decreases, and 44.3% reported no change. For context, the Philly Fed’s diffusion index methodology (percent increase minus percent decrease) means a headline of 33.7 reflects this wide gap between rising and falling firms — a genuinely broad-based improvement rather than a handful of outsized responses skewing the average.
Direct quote: \”Almost 45 percent of the firms reported increases in shipments, 11 percent reported decreases, and 44 percent reported no change.\”
Cross-Checking with Unfilled Orders and Inventories
One detail worth noting: the unfilled orders index also rose, from 10.5 to 18.1, suggesting new orders may be accumulating faster than shipping capacity — one possible early sign of production lines running closer to capacity. At the same time, the inventories index turned barely positive (from -8.5 to 0.3). Taken together, this combination looks more consistent with a genuine demand pickup than a supply-chain bottleneck story, though this remains a single month of data.
For US-based readers: this regional print (covering eastern Pennsylvania, southern New Jersey, and Delaware) is watched partly because its release timing makes it one of the earliest manufacturing signals available before the national ISM survey.
雇用は小幅、労働時間は急伸――早期拡大局面のシグナル
Hours Worked, Not Headcount, Is Doing the Heavy Lifting
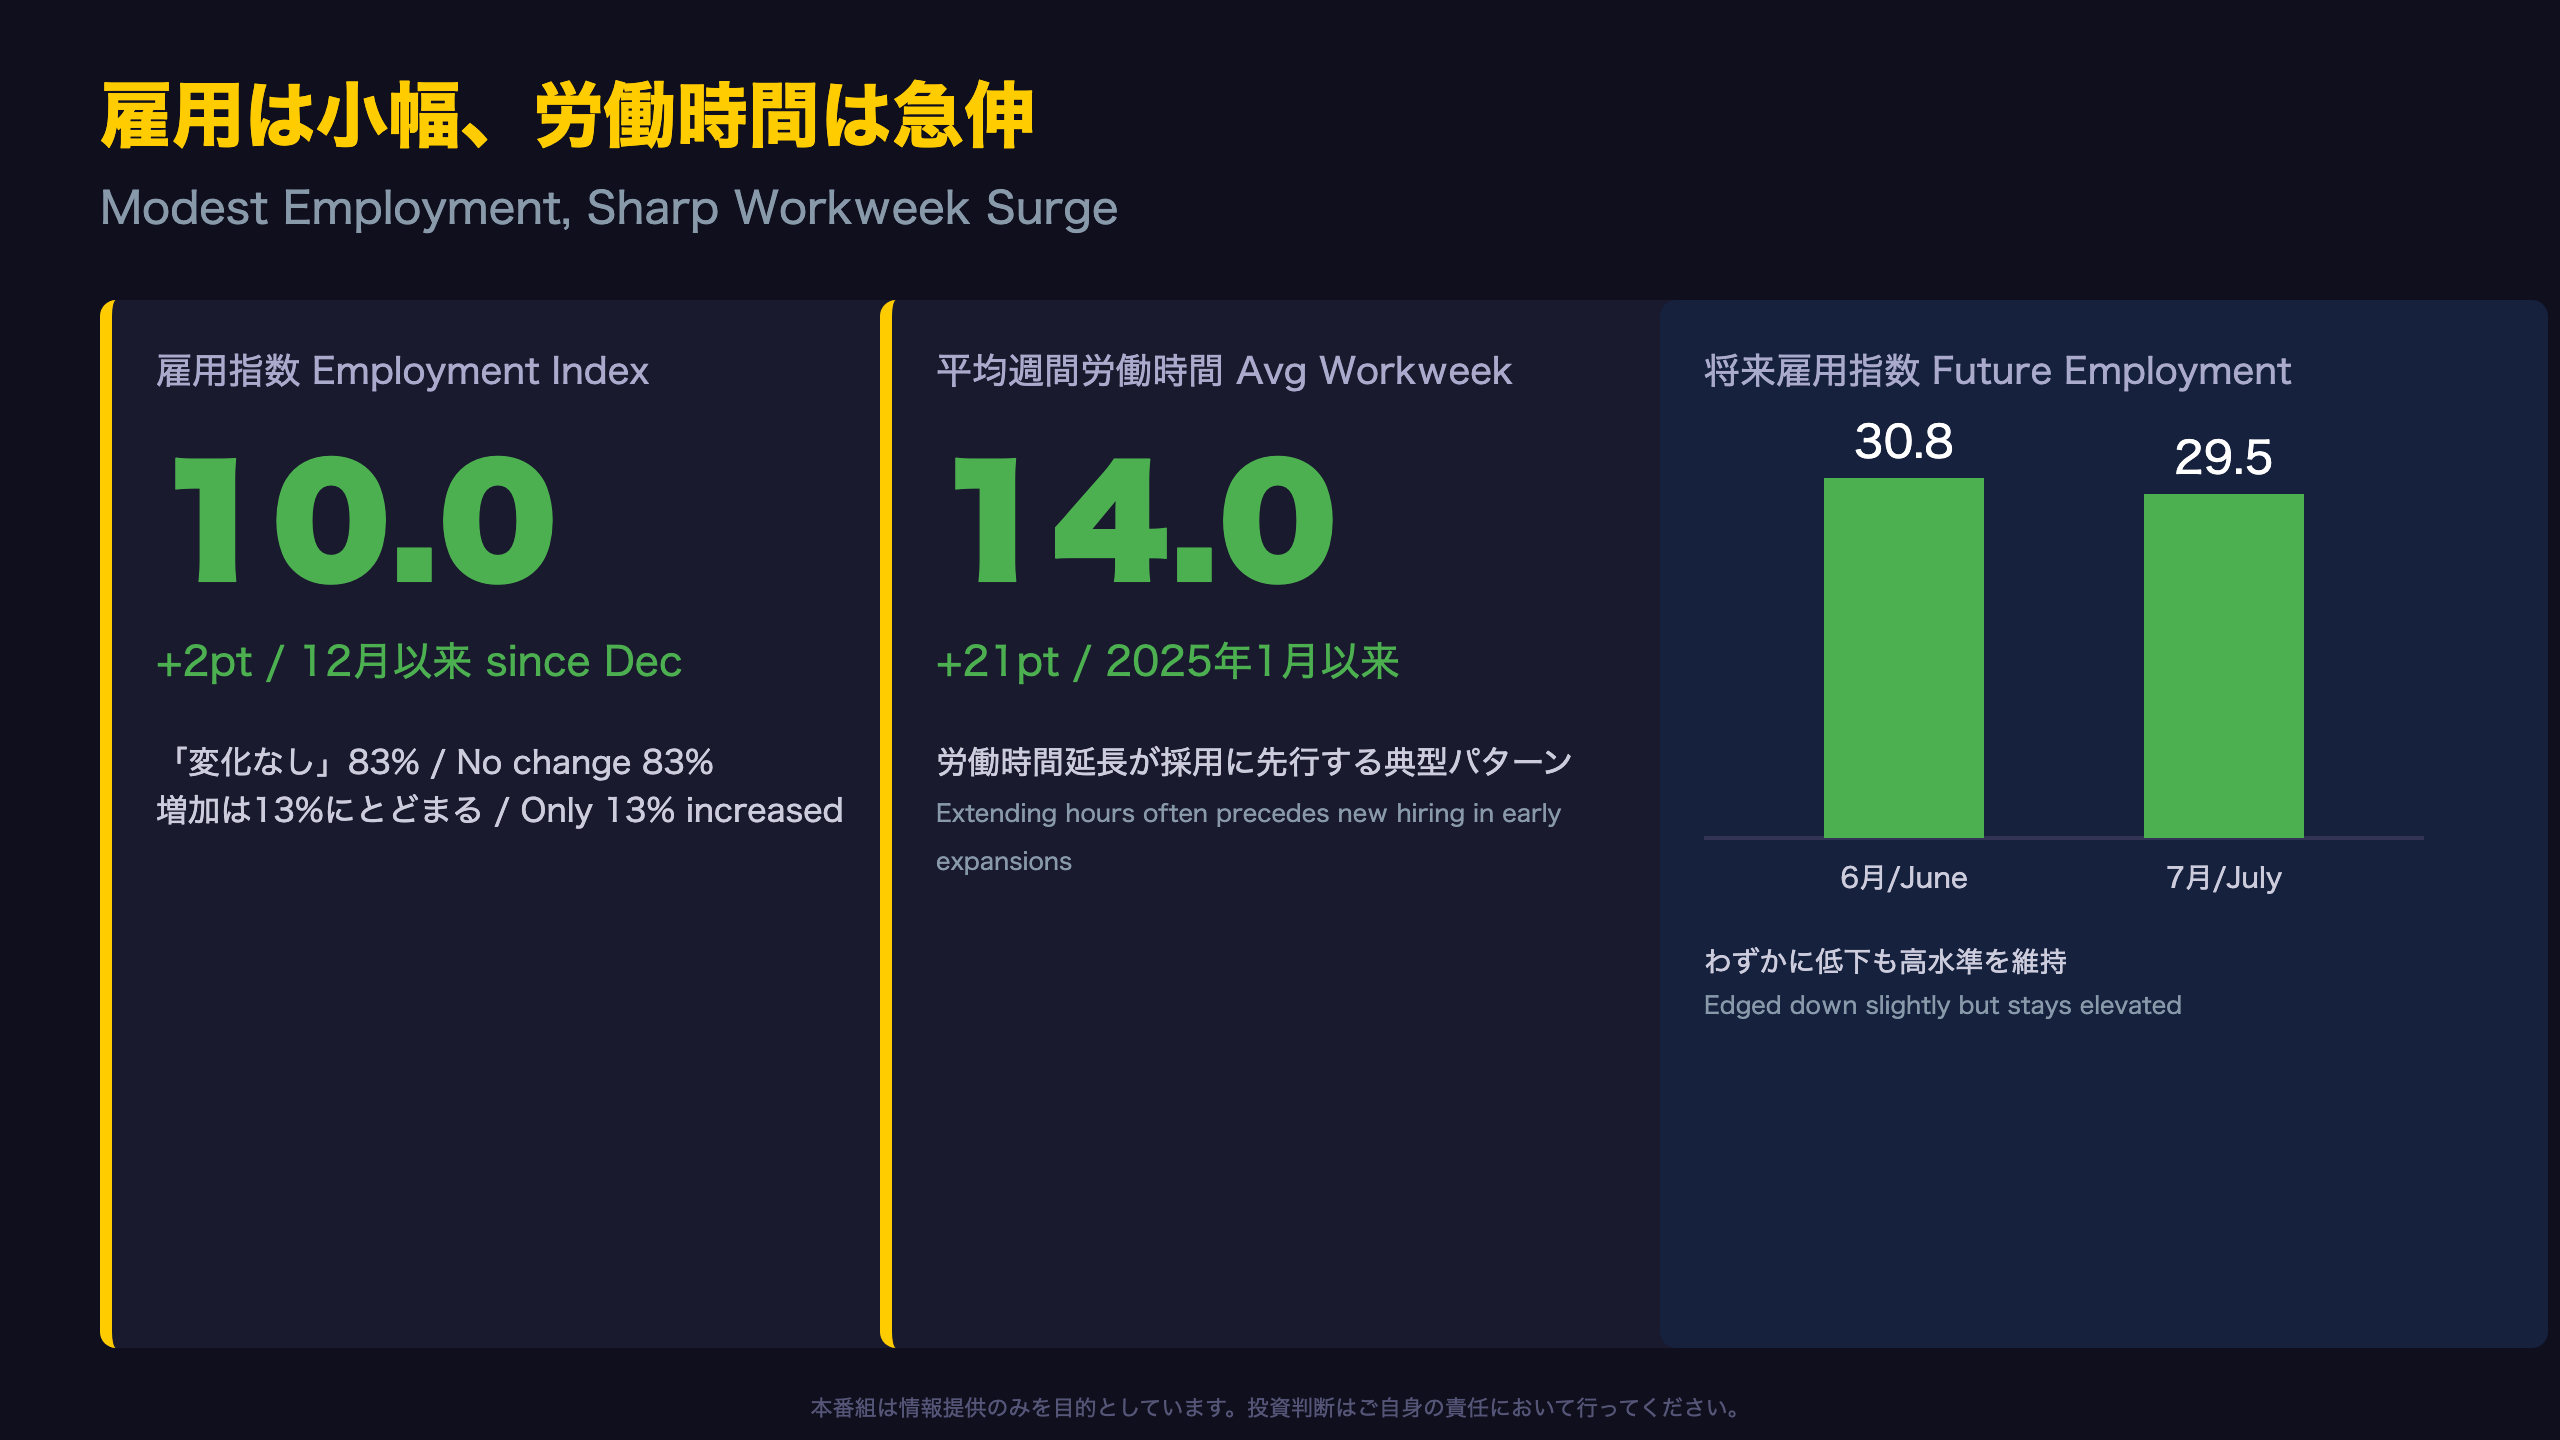
July’s employment index rose modestly, from 7.9 to 10.0, its best reading since December. But the composition matters: only 13% of firms reported increased employment, while a dominant 83% reported no change at all. In other words, headline job growth in the region remains limited in breadth.
The Workweek Surge
What stands out instead is the average workweek index, which jumped 21 points — from -6.5 to 14.0 — its highest level since January 2025. It is commonly understood in labor-market analysis that firms facing a demand pickup often extend existing employees’ hours before committing to new hires. This single month of data cannot confirm that causal sequence definitively, but the pairing of a modest employment gain with a sharp workweek increase is consistent with that pattern.
Direct quote: \”The average workweek index rose 21 points to 14.0 in July, its highest reading since January 2025.\”
What This Means for the Six-Month Outlook
The future employment index dipped only slightly, from 30.8 to 29.5, remaining comfortably positive — firms still plan to expand headcount over the next six months. Whether this month’s workweek surge eventually converts into stronger employment index readings will be worth watching in the August and September releases, particularly for anyone monitoring regional labor market tightness as an input into the national payrolls picture.
二つの価格指数――コスト転嫁の途上
Two Price Indexes, One Story of Partial Pass-Through
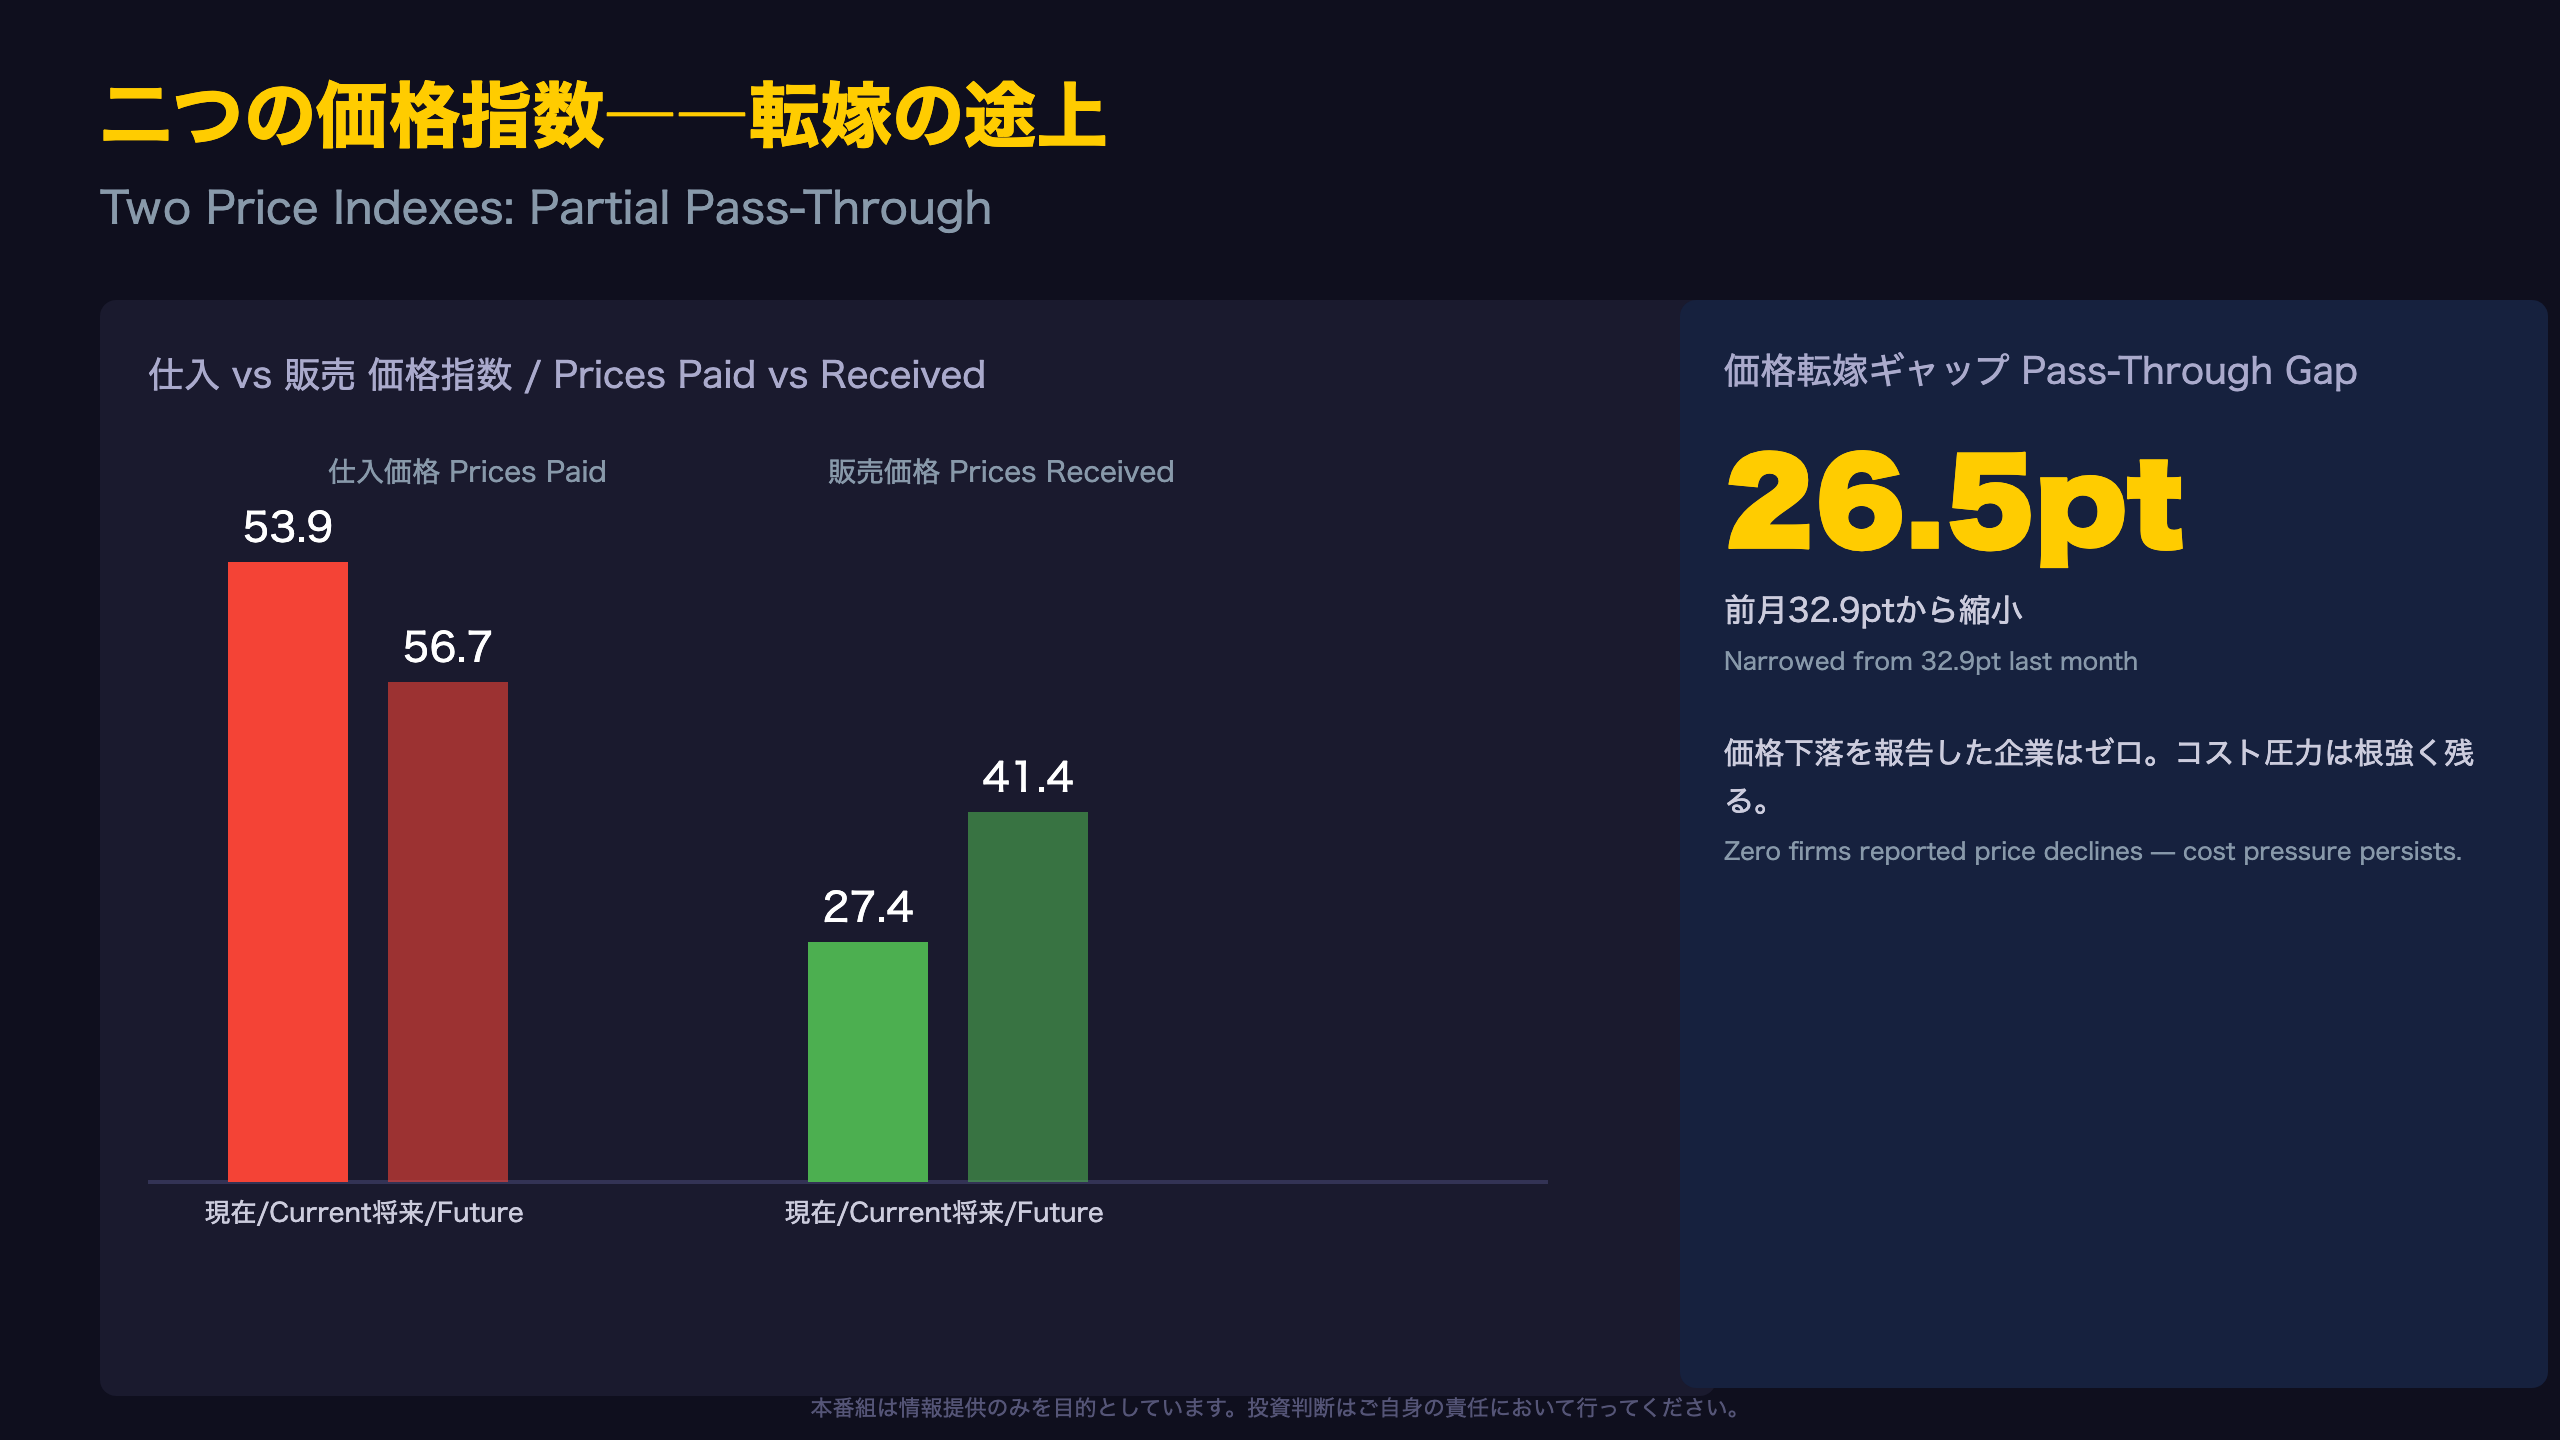
The prices paid index barely moved, from 53.2 to 53.9, holding at an elevated plateau. Within the detail, 54.4% of firms reported rising input costs, and notably zero firms reported declines. Meanwhile, the prices received index rose 7 points, from 20.3 to 27.4, with 26.9% of firms raising their own selling prices.
Reading the Narrowing Gap
The spread between prices paid (53.9) and prices received (27.4) narrowed to 26.5 points from 32.9 points last month. This narrowing could suggest firms are beginning to pass through part of their cost increases to customers — though the gap remains substantial, meaning margin pressure has not fully abated.
Direct quote: \”More than 54 percent of the firms reported increases in input prices, while no firm reported decreases; 46 percent reported no change.\”
Forward Price Expectations Cool, But Stay Elevated
Looking six months ahead, the future prices paid index fell from 63.2 to 56.7, and future prices received dropped sharply from 67.2 to 41.4 — one of the largest declines among all sub-indexes this month. For US readers comparing this to national CPI or PCE data: this is a survey-based diffusion index, not a price-level statistic, so it should be read as a directional business-sentiment signal rather than a direct proxy for the Fed’s preferred inflation gauges. Still, both future indexes remain above their long-run averages, indicating firms have not abandoned expectations of continued cost inflation.
特別質問――賃金は実行継続、コスト見通しは慎重化
Wages Are Still Rising, But the Outlook Has Turned More Measured
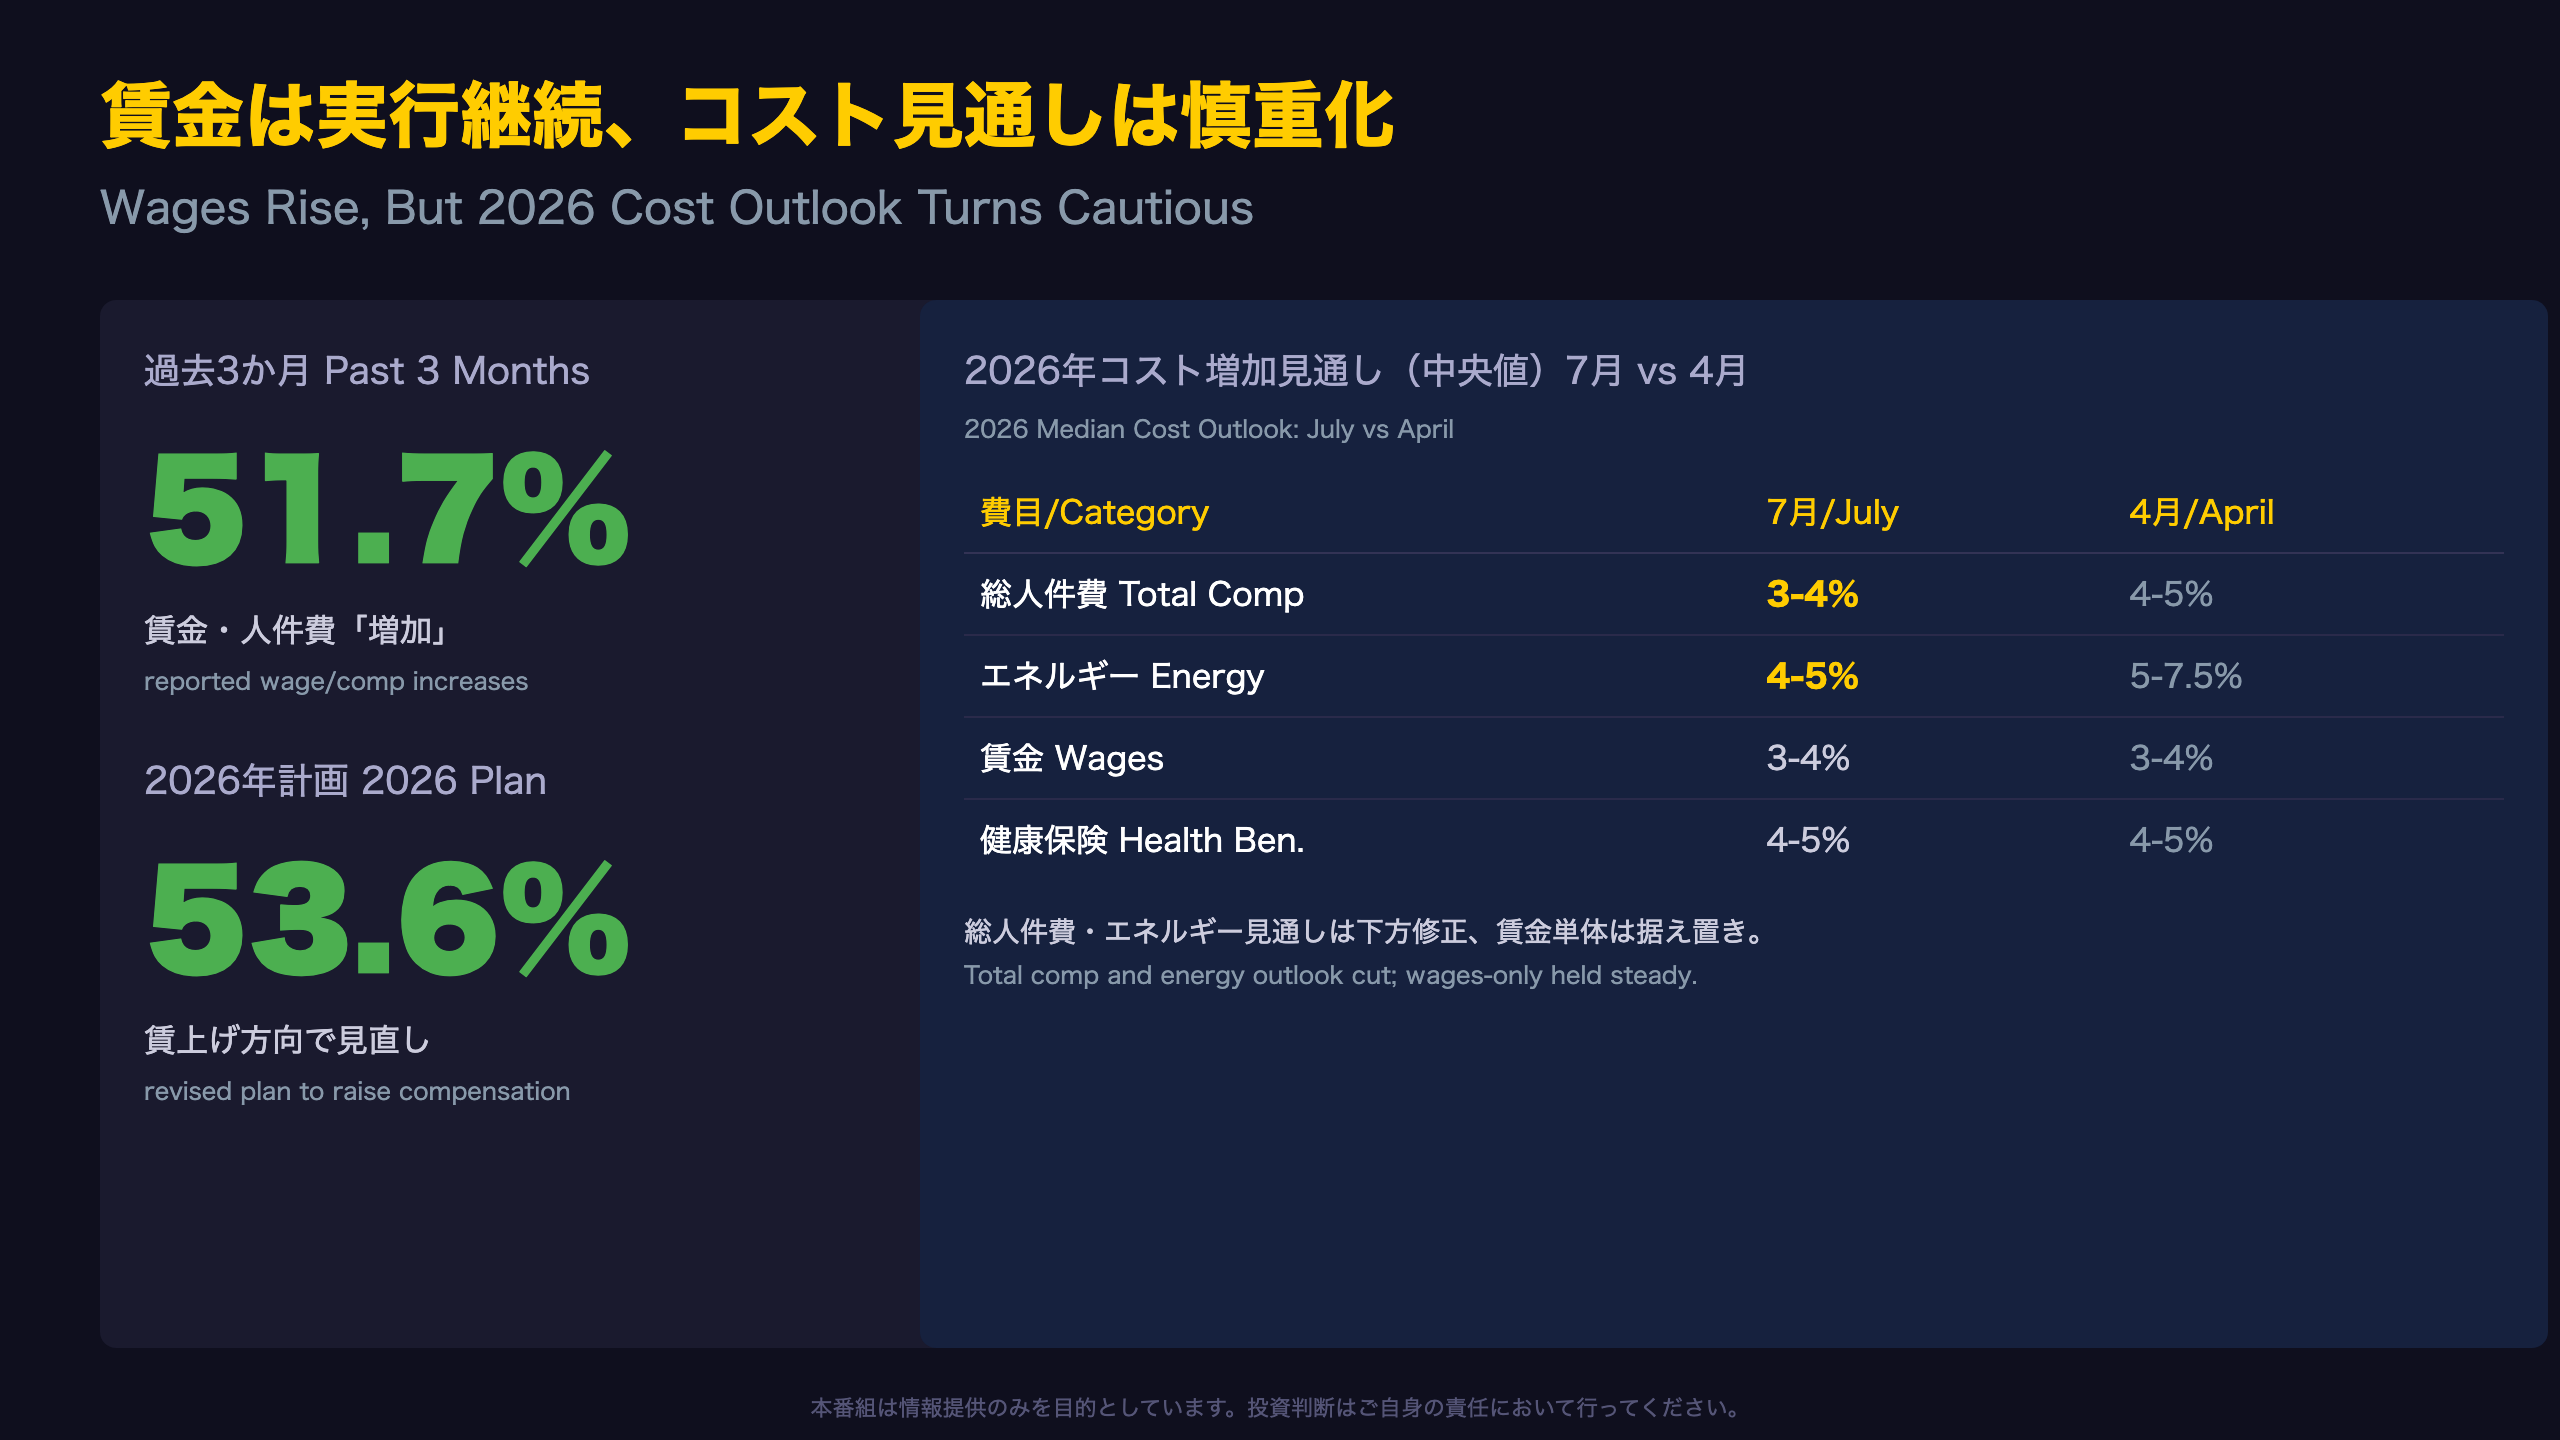
This month’s special questions probe two different time horizons: realized wage trends over the past three months, and forward-looking cost expectations for full-year 2026. On the realized side, 51.7% of firms reported increasing wages and compensation over the past quarter, with only 3.5% reporting decreases. For 2026 planning, 53.6% of firms said they have revised their compensation plans upward since the start of the year — confirming wage growth momentum has not stalled.
But the Forward Median Estimates Were Cut
The more nuanced signal comes from comparing July’s median cost expectations against April’s:
| Category | July Median | April Median |
|---|---|---|
| Total Compensation | 3-4% | 4-5% |
| Energy | 4-5% | 5-7.5% |
| Wages only | 3-4% | 3-4% (unchanged) |
| Health Benefits | 4-5% | 4-5% (unchanged) |
Direct quote: \”their median expectation for total compensation moved down to 3 to 4 percent from 4 to 5 percent in April.\”
For US readers benchmarking against national wage data (such as the Atlanta Fed Wage Growth Tracker or the Employment Cost Index), this is a survey of forward expectations among manufacturers in one Fed district, not a national wage statistic. Still, the pattern — wages-only expectations unchanged, but total compensation and energy cost expectations both revised down — could suggest firms see slightly less pressure from non-wage cost items even as base wage growth continues steadily.
将来指標が軒並み後退、逆転現象という特異点
What’s Behind the Broad Pullback in Forward-Looking Indexes
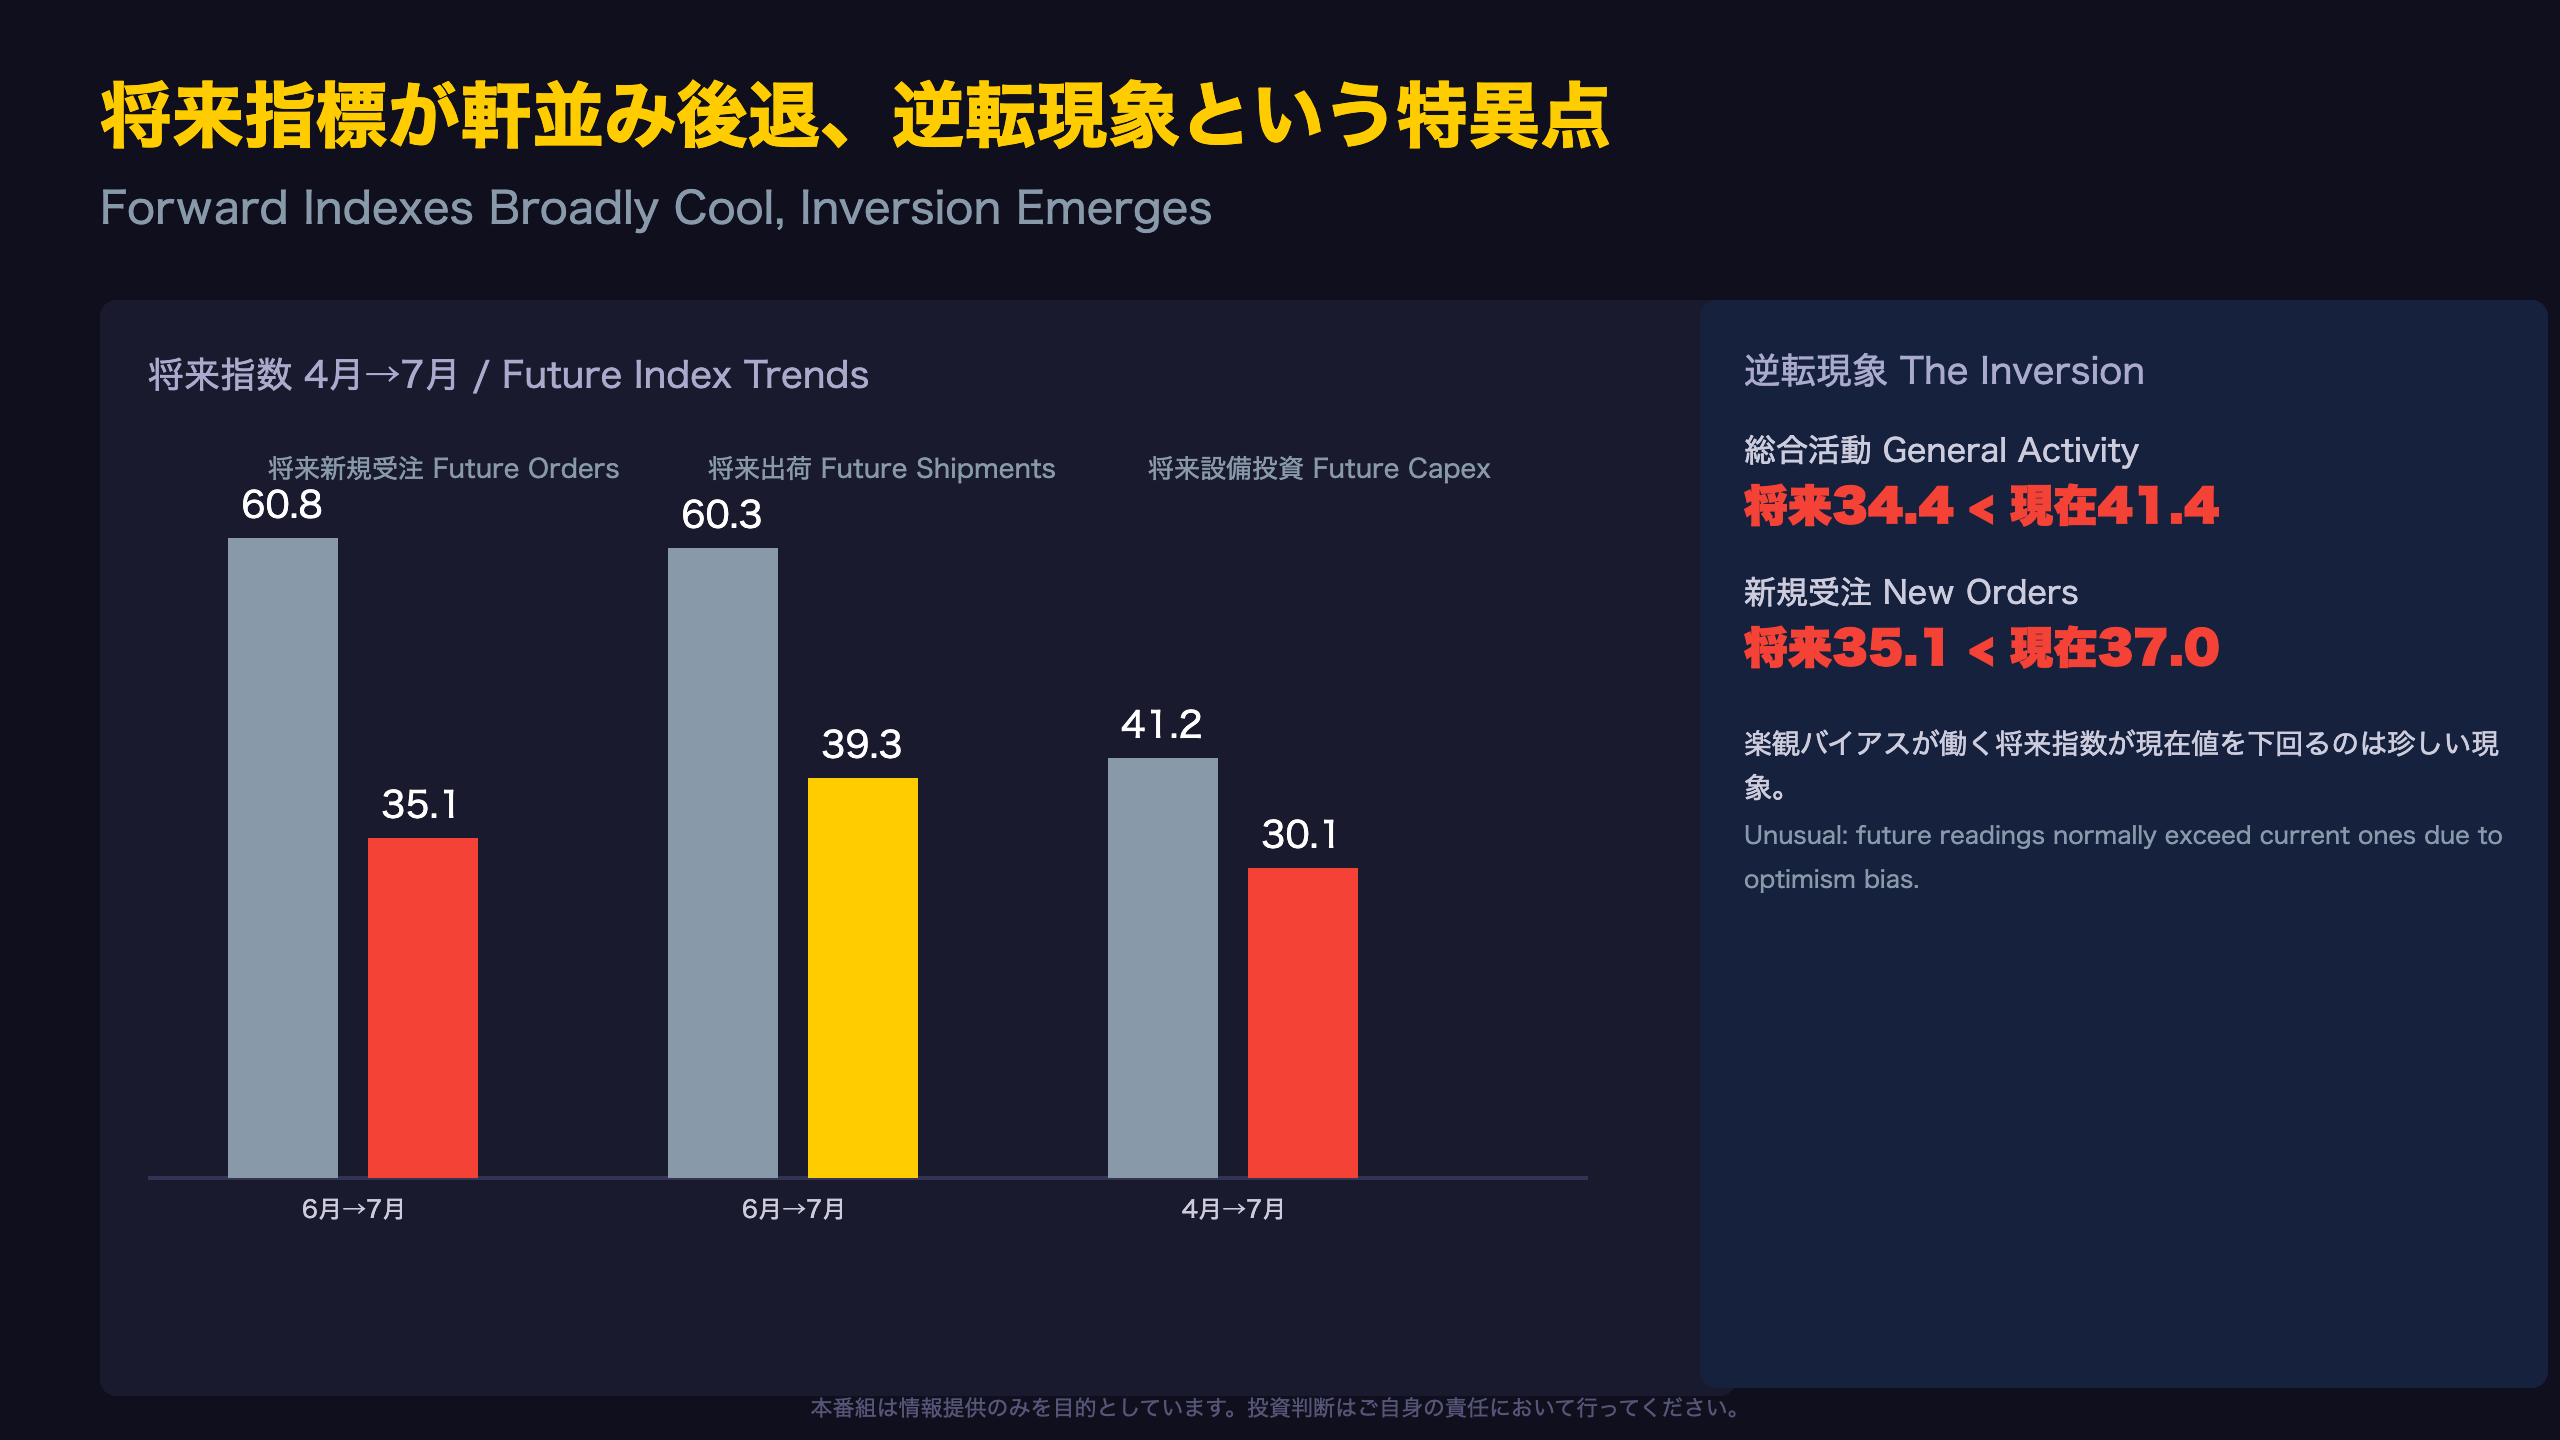
Nearly all six-month-ahead indicators fell this month. Future new orders dropped 26 points, from 60.8 to 35.1, and future prices received fell an equally sharp 26 points, from 67.2 to 41.4 — among the largest declines of any sub-index this month. Future capital expenditures also eased, from 41.2 to 30.1.
The Inversion Worth Watching
The most notable detail is the relationship between future and current readings. Survey respondents typically display an optimism bias, so future indexes usually run above current ones. This month, however, future general activity (34.4) fell below current general activity (41.4), and future new orders (35.1) came in just below current new orders (37.0).
Direct quote: \”The diffusion index for future general activity fell 16 points this month to 34.4.\”
It’s worth noting this inversion isn’t universal: future shipments (39.3) still exceeds current shipments (33.7), and future employment (29.5) remains far above current employment (10.0). So the inversion is concentrated specifically in general activity and new orders — the two headline demand indicators — rather than reflecting uniform pessimism.
The Limits of a Single Data Point
This pattern could support a reading that firms see July’s surge as a peak rather than a new normal, but a single month of data cannot confirm a structural trend. The August release will be the key test: if future indexes climb back above current readings, this month’s inversion likely reflects survey noise; if the gap persists or widens, it would strengthen the case that firms expect momentum to fade.
インプリケーション――強い現状と根強い価格、政策への含意
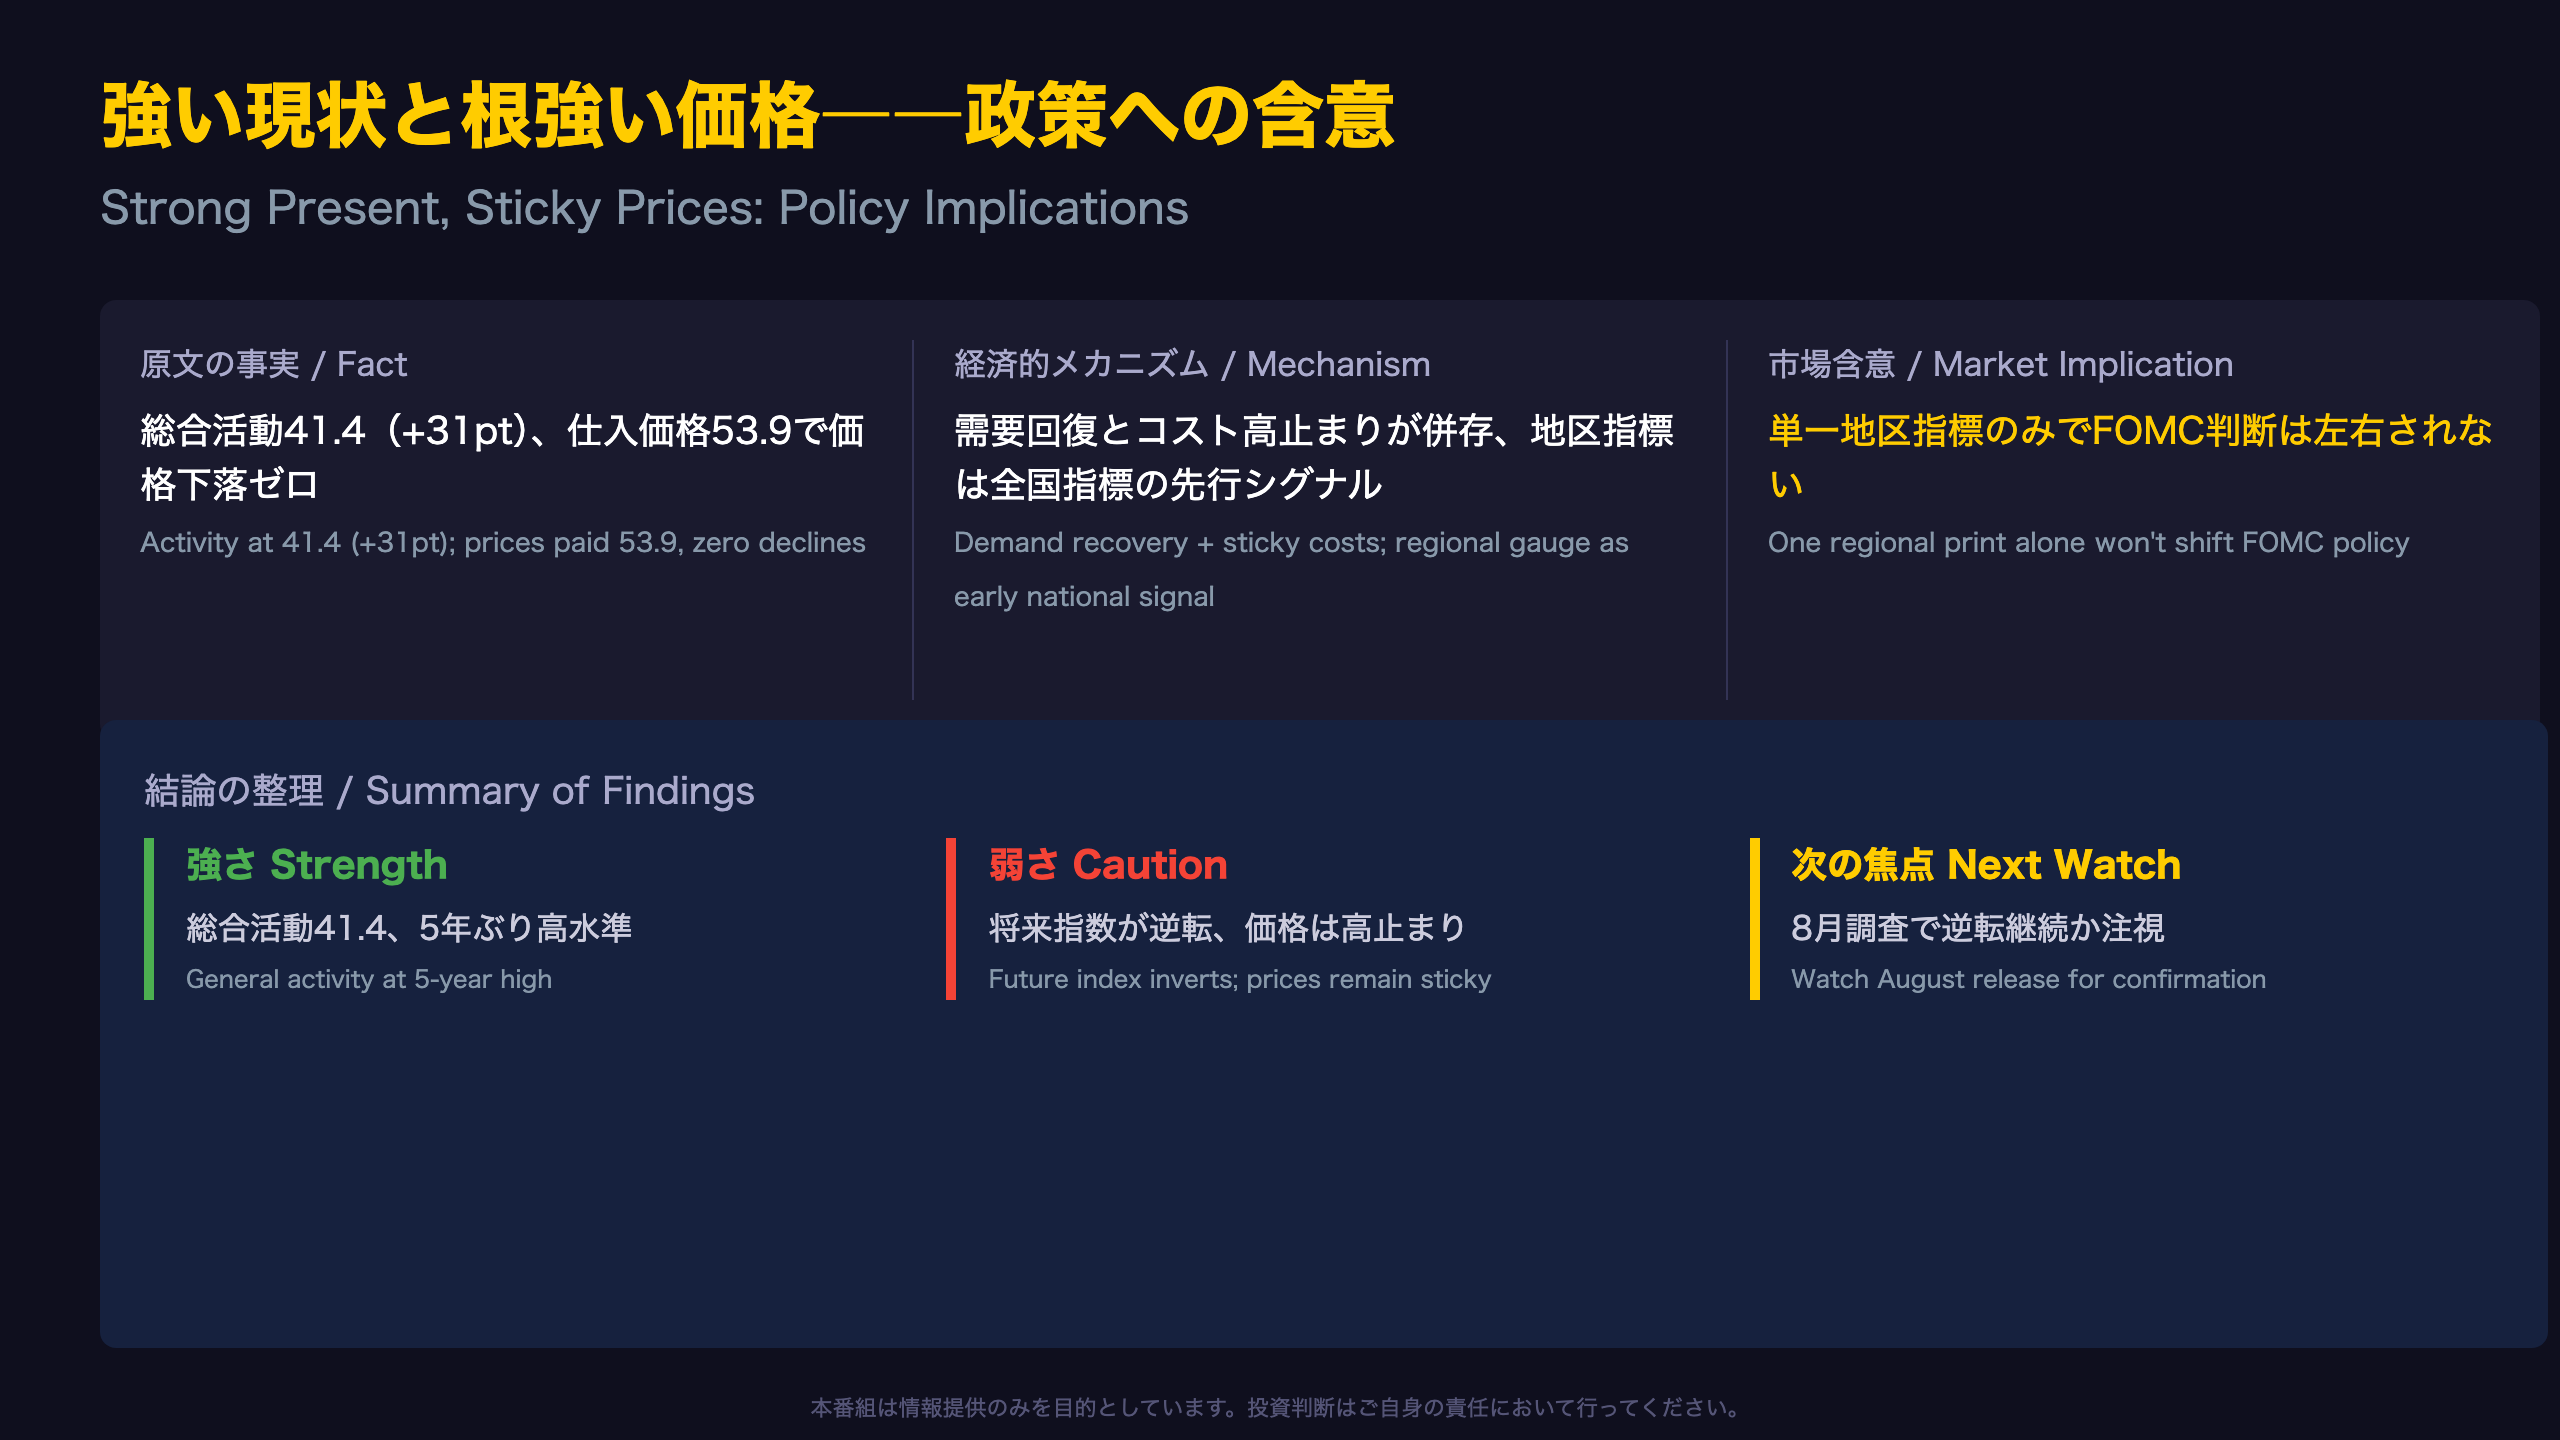
Strong Present, Sticky Prices: What This Means for Policy Watchers
The central tension in this month’s Philadelphia Fed survey is the coexistence of a five-year-high general activity reading (41.4) with an elevated, sticky prices paid index (53.9). Regional Federal Reserve manufacturing surveys — including this one, the Empire State Manufacturing Survey, and the Richmond and Kansas City Fed surveys — are widely watched by market participants as early, high-frequency proxies for the national ISM Manufacturing PMI, released roughly two weeks later each month. However, the Philadelphia Fed’s index samples firms specifically in eastern Pennsylvania, southern New Jersey, and Delaware, a fundamentally different and much smaller population than the ISM’s national panel. This single regional data point cannot, on its own, confirm a national manufacturing turning point.
Reading This Through an FOMC Lens
The detail that zero firms reported declining input prices this month is notable — it means there is currently no disinflationary pull from the cost side within this survey. At the same time, both forward-looking price indexes (prices paid at 56.7, prices received at 41.4) declined from April, suggesting firms’ own inflation expectations are gradually cooling even if current cost pressure persists. For FOMC watchers, this combination — sticky near-term prices alongside moderating forward expectations — is a relatively balanced signal, not a clear hawkish or dovish tilt on its own.
The Unresolved Question: Is the Surge a Peak?
The most distinctive feature of this report is the inversion where future general activity (34.4) sits below the current reading (41.4). Given the well-documented optimism bias typically present in forward-looking survey responses, this inversion is unusual enough to flag, but a single month cannot confirm whether it reflects a genuine peaking signal or simple survey noise.
Direct quote: \”The firms continue to expect overall growth over the next six months, although most future indicators moved down from elevated levels.\”
For US equity and rates markets, the practical takeaway is that this report alone is unlikely to shift Fed policy expectations meaningfully — but it adds a data point supporting the view that goods-sector activity, while currently robust, may not be accelerating further in the second half of the year. Traders typically weigh this print alongside the Empire State survey and wait for the national ISM release for confirmation before repricing manufacturing-sector risk.
Disclaimer: This article is for informational purposes only. All investment decisions are made solely at your own risk.