📺 Watch the Full Video Analysis
This article was automatically generated by the NFC Market Live AI analysis system. (Updated: 2026-07-16 09:56 JST)
Analysis of Japan’s Ministry of Finance weekly international securities flow data.
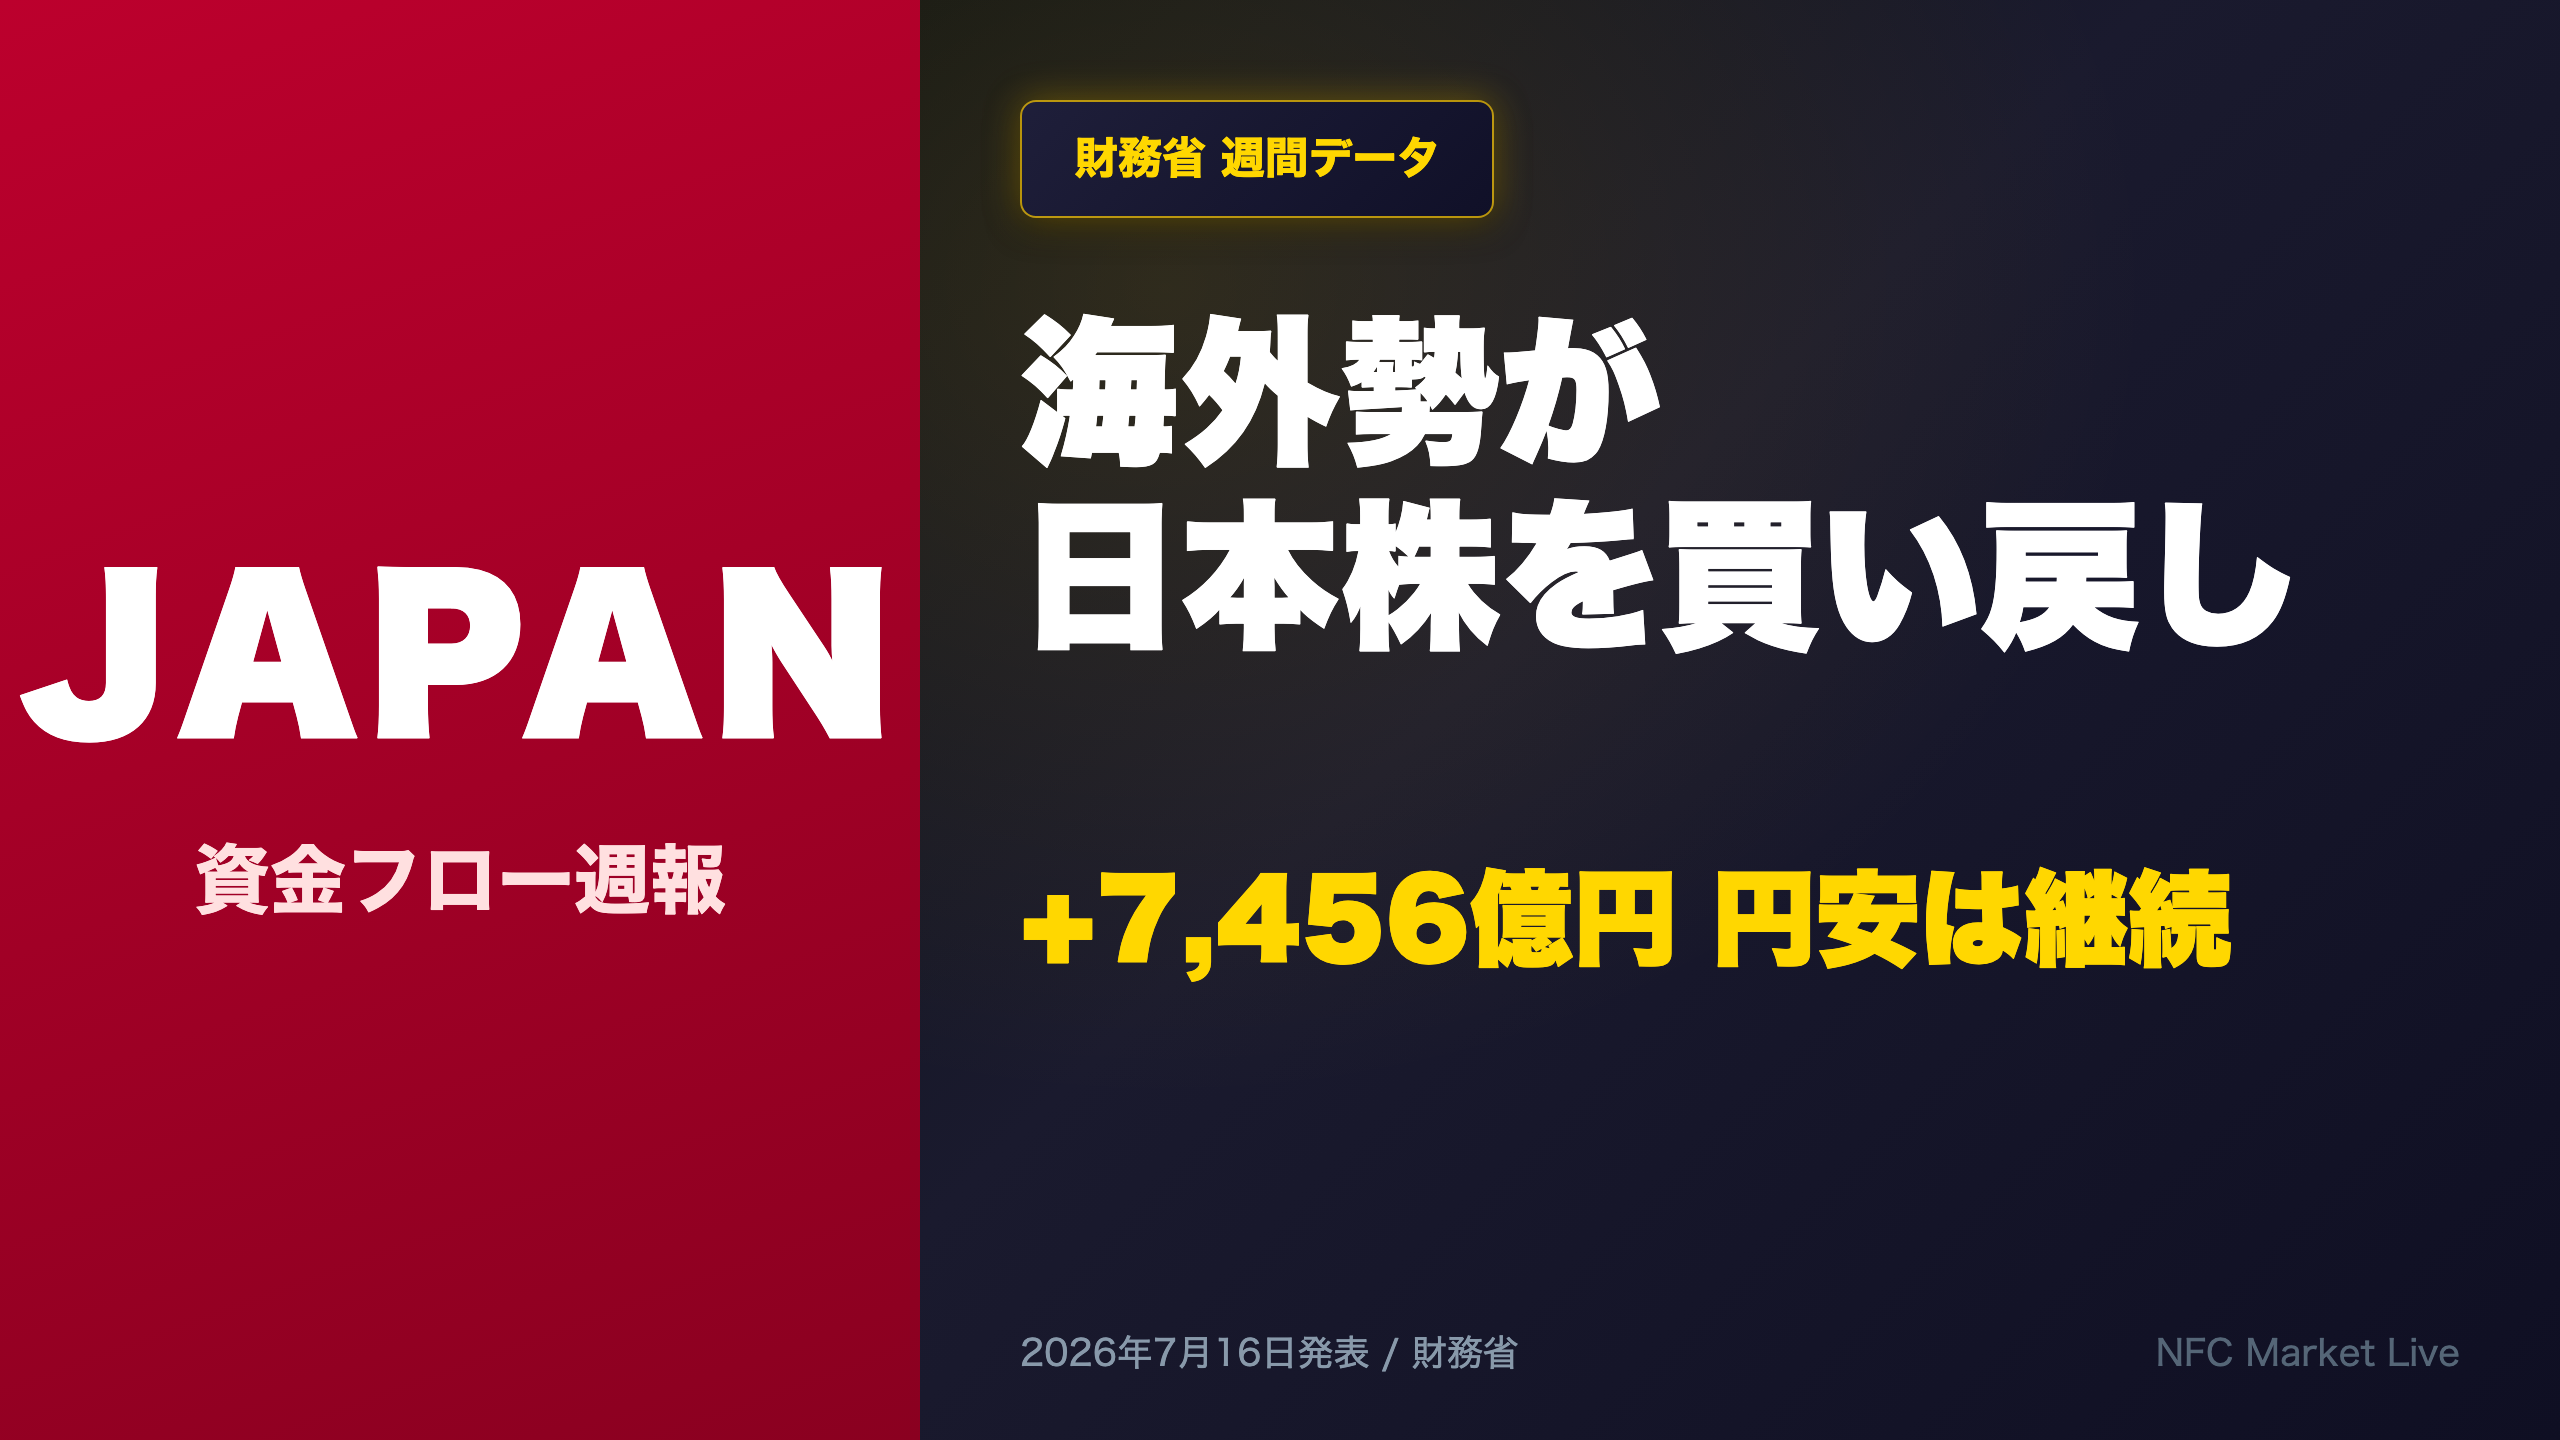
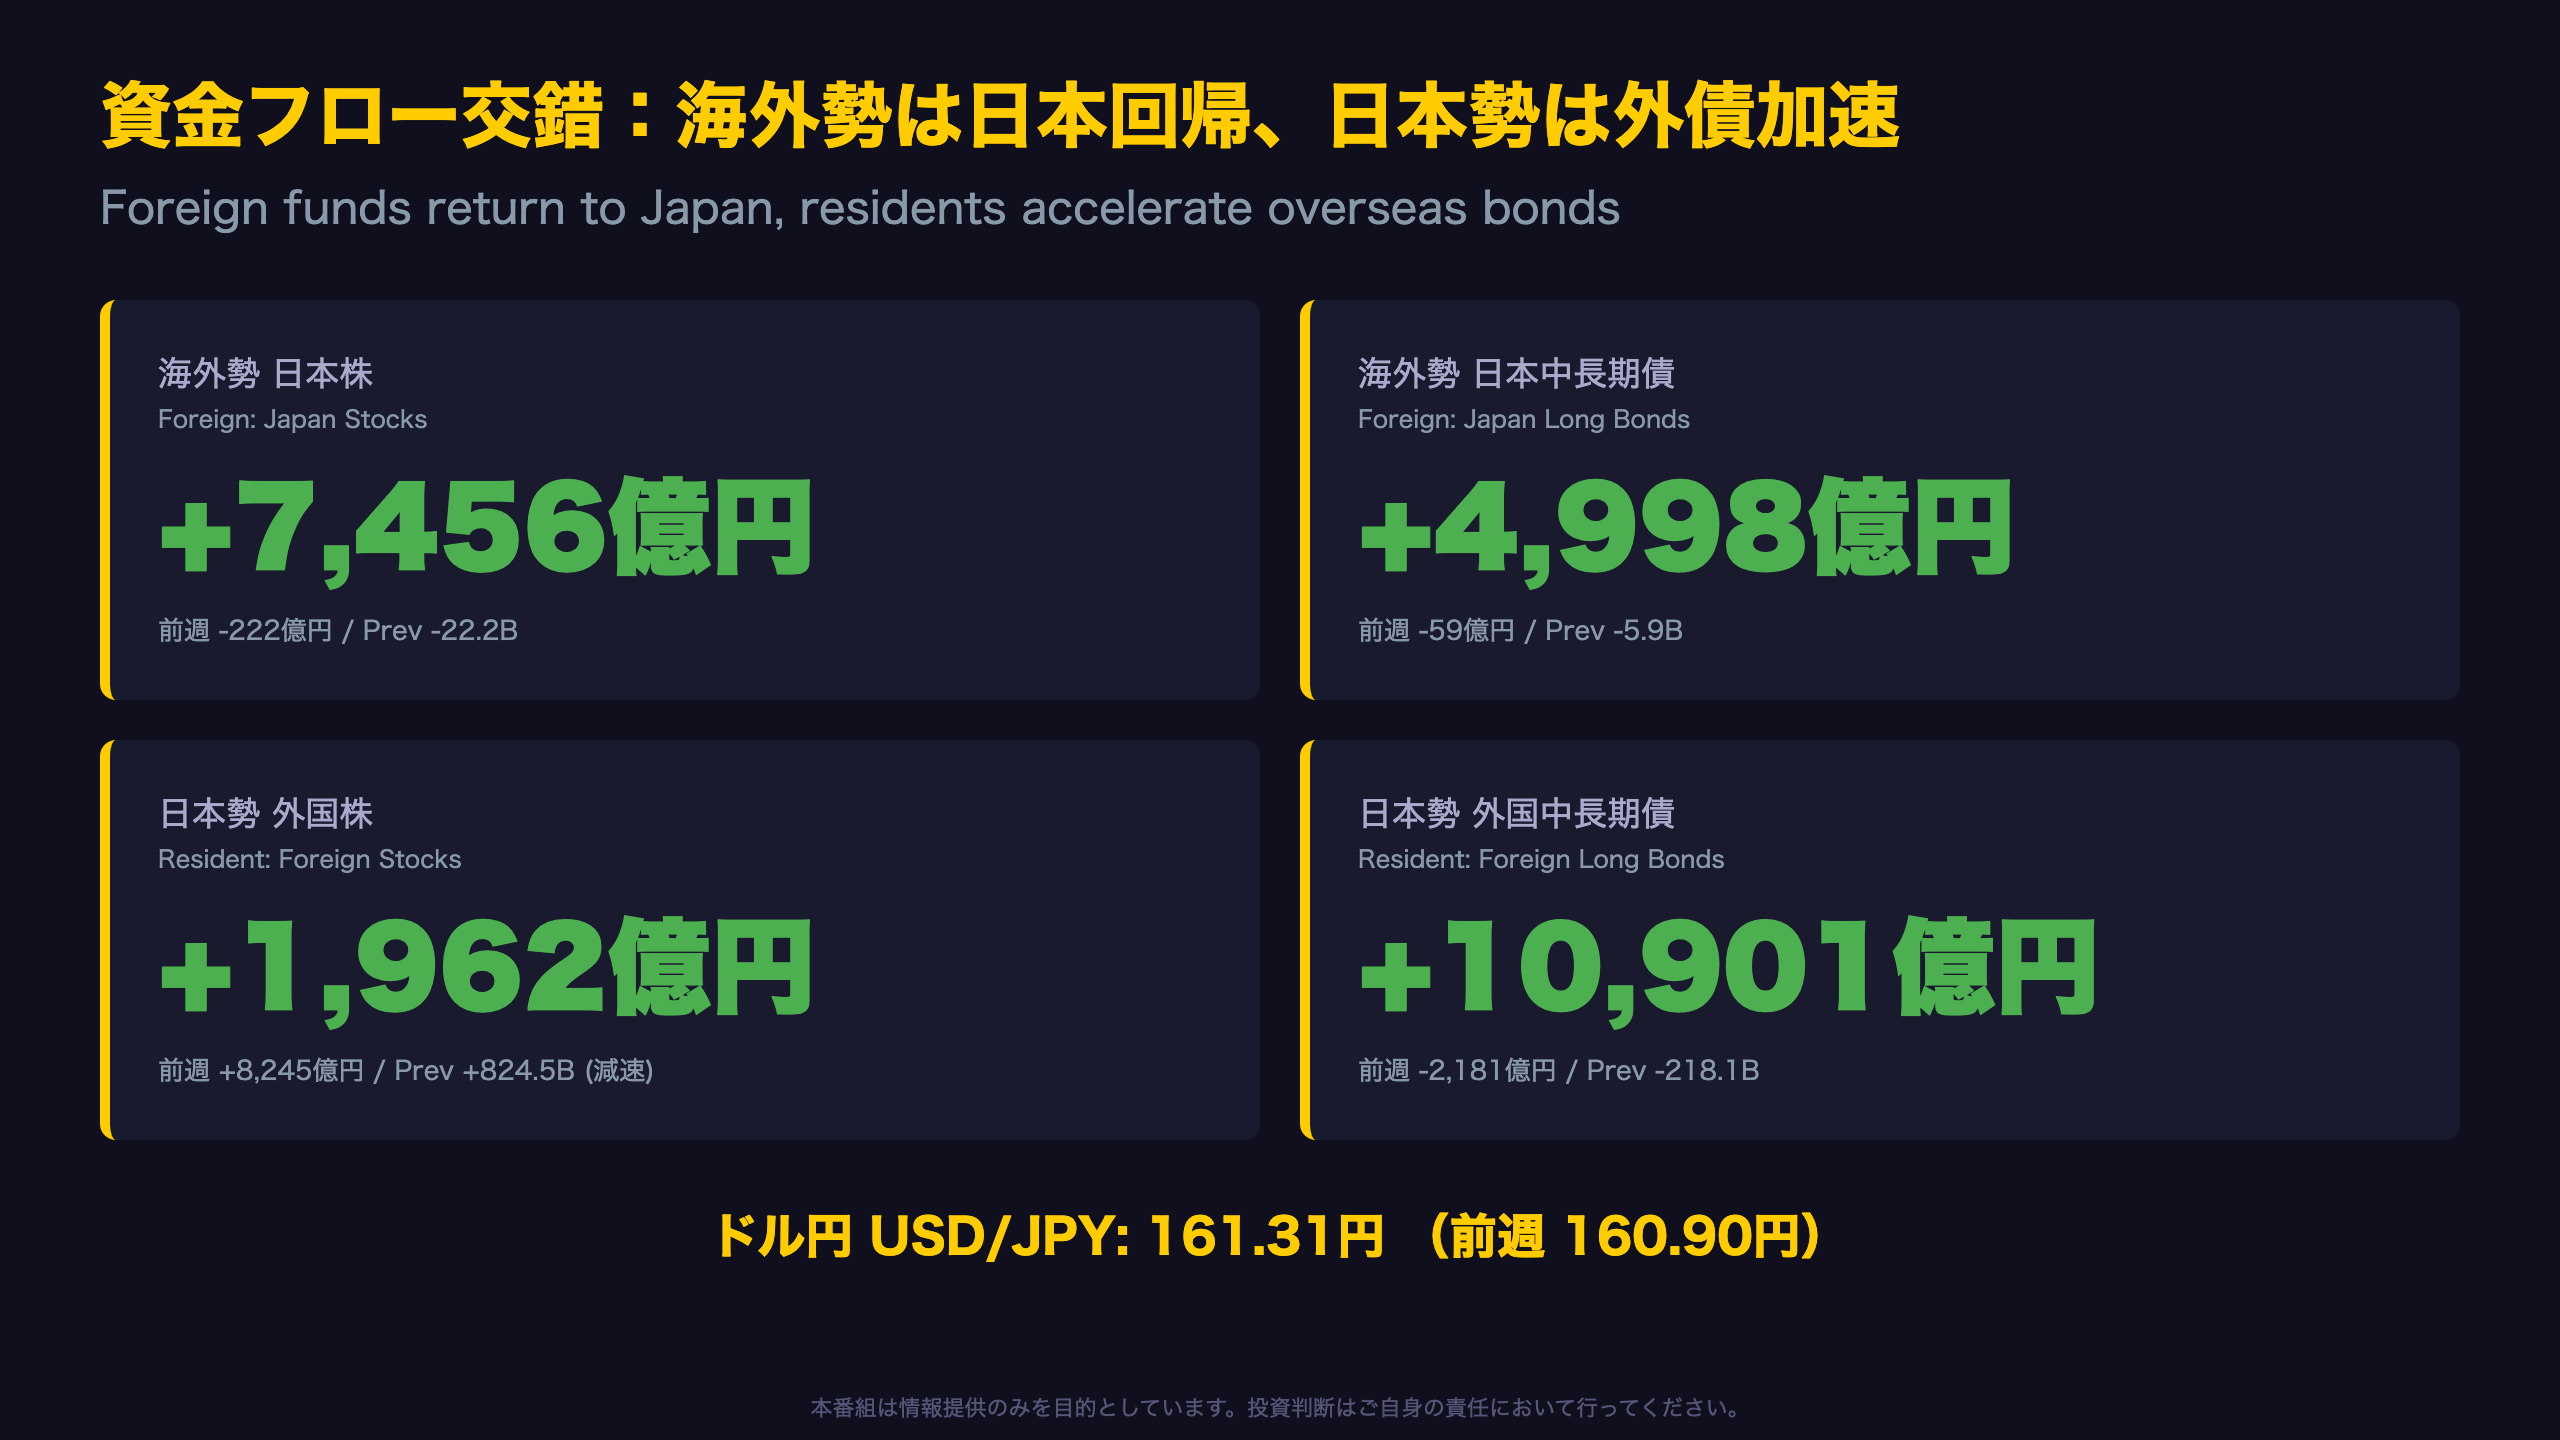
📊 Foreign investors flipped from -¥22.2B to +¥745.6B in Japan stock buying
📈 Japanese residents’ overseas bond buying surged to +¥1,090.1B
💴 USD/JPY holds near 161.31, a multi-decade high zone
A complex week where foreign capital returns to Japan even as Japanese institutions accelerate overseas bond investment. What does this cross-current in capital flows mean for the yen going forward?
⚠️ This program is for informational purposes only and does not constitute investment advice.
資金フロー交錯 ― 海外勢は日本回帰、日本勢は外債加速
Overview: A Week of Reversals
Japan’s Ministry of Finance (MOF) publishes weekly data on “International Transactions in Securities,” tracking net purchases and sales of stocks and bonds by residents (Japanese investors buying abroad) and non-residents (foreign investors buying Japan). Unlike the monthly Balance of Payments, this weekly release offers a high-frequency read on portfolio capital flows.
Key Numbers (in JPY, billions)
| Item | Latest Week | Prior Week |
|---|---|---|
| Foreign buying, Japan stocks | +745.6 | -22.2 |
| Foreign buying, Japan long bonds | +499.8 | -5.9 |
| Resident buying, foreign stocks | +196.2 | +824.5 |
| Resident buying, foreign long bonds | +1,090.1 | -218.1 |
| USD/JPY | 161.31 | 160.90 |
The prior week’s pattern — foreign selling of Japan combined with Japanese buying of foreign equities — flipped entirely. This week showed foreign inflows into Japan alongside a surge in Japanese outbound bond buying.
Why This Matters for International Investors
Unlike the U.S. TIC data, MOF’s weekly release is unusually timely, giving markets an early signal on cross-border portfolio positioning before monthly balance-of-payments data confirms the trend. For USD/JPY traders, this dataset is a standard input alongside rate differentials.
Short-Term Bond Divergence
Foreign investors sold 589.7 billion yen of short-term Japanese debt (versus +23.7 billion the prior week), a divergence from the long-bond buying that likely reflects short-term arbitrage or repo-related flows rather than durable portfolio allocation.
Next release (week of July 12-18, expected around July 23) will show whether the foreign buying of Japan stocks persists — a key test of whether this is a genuine trend reversal.
海外勢フローの反転 ― 日本株・日本債への回帰
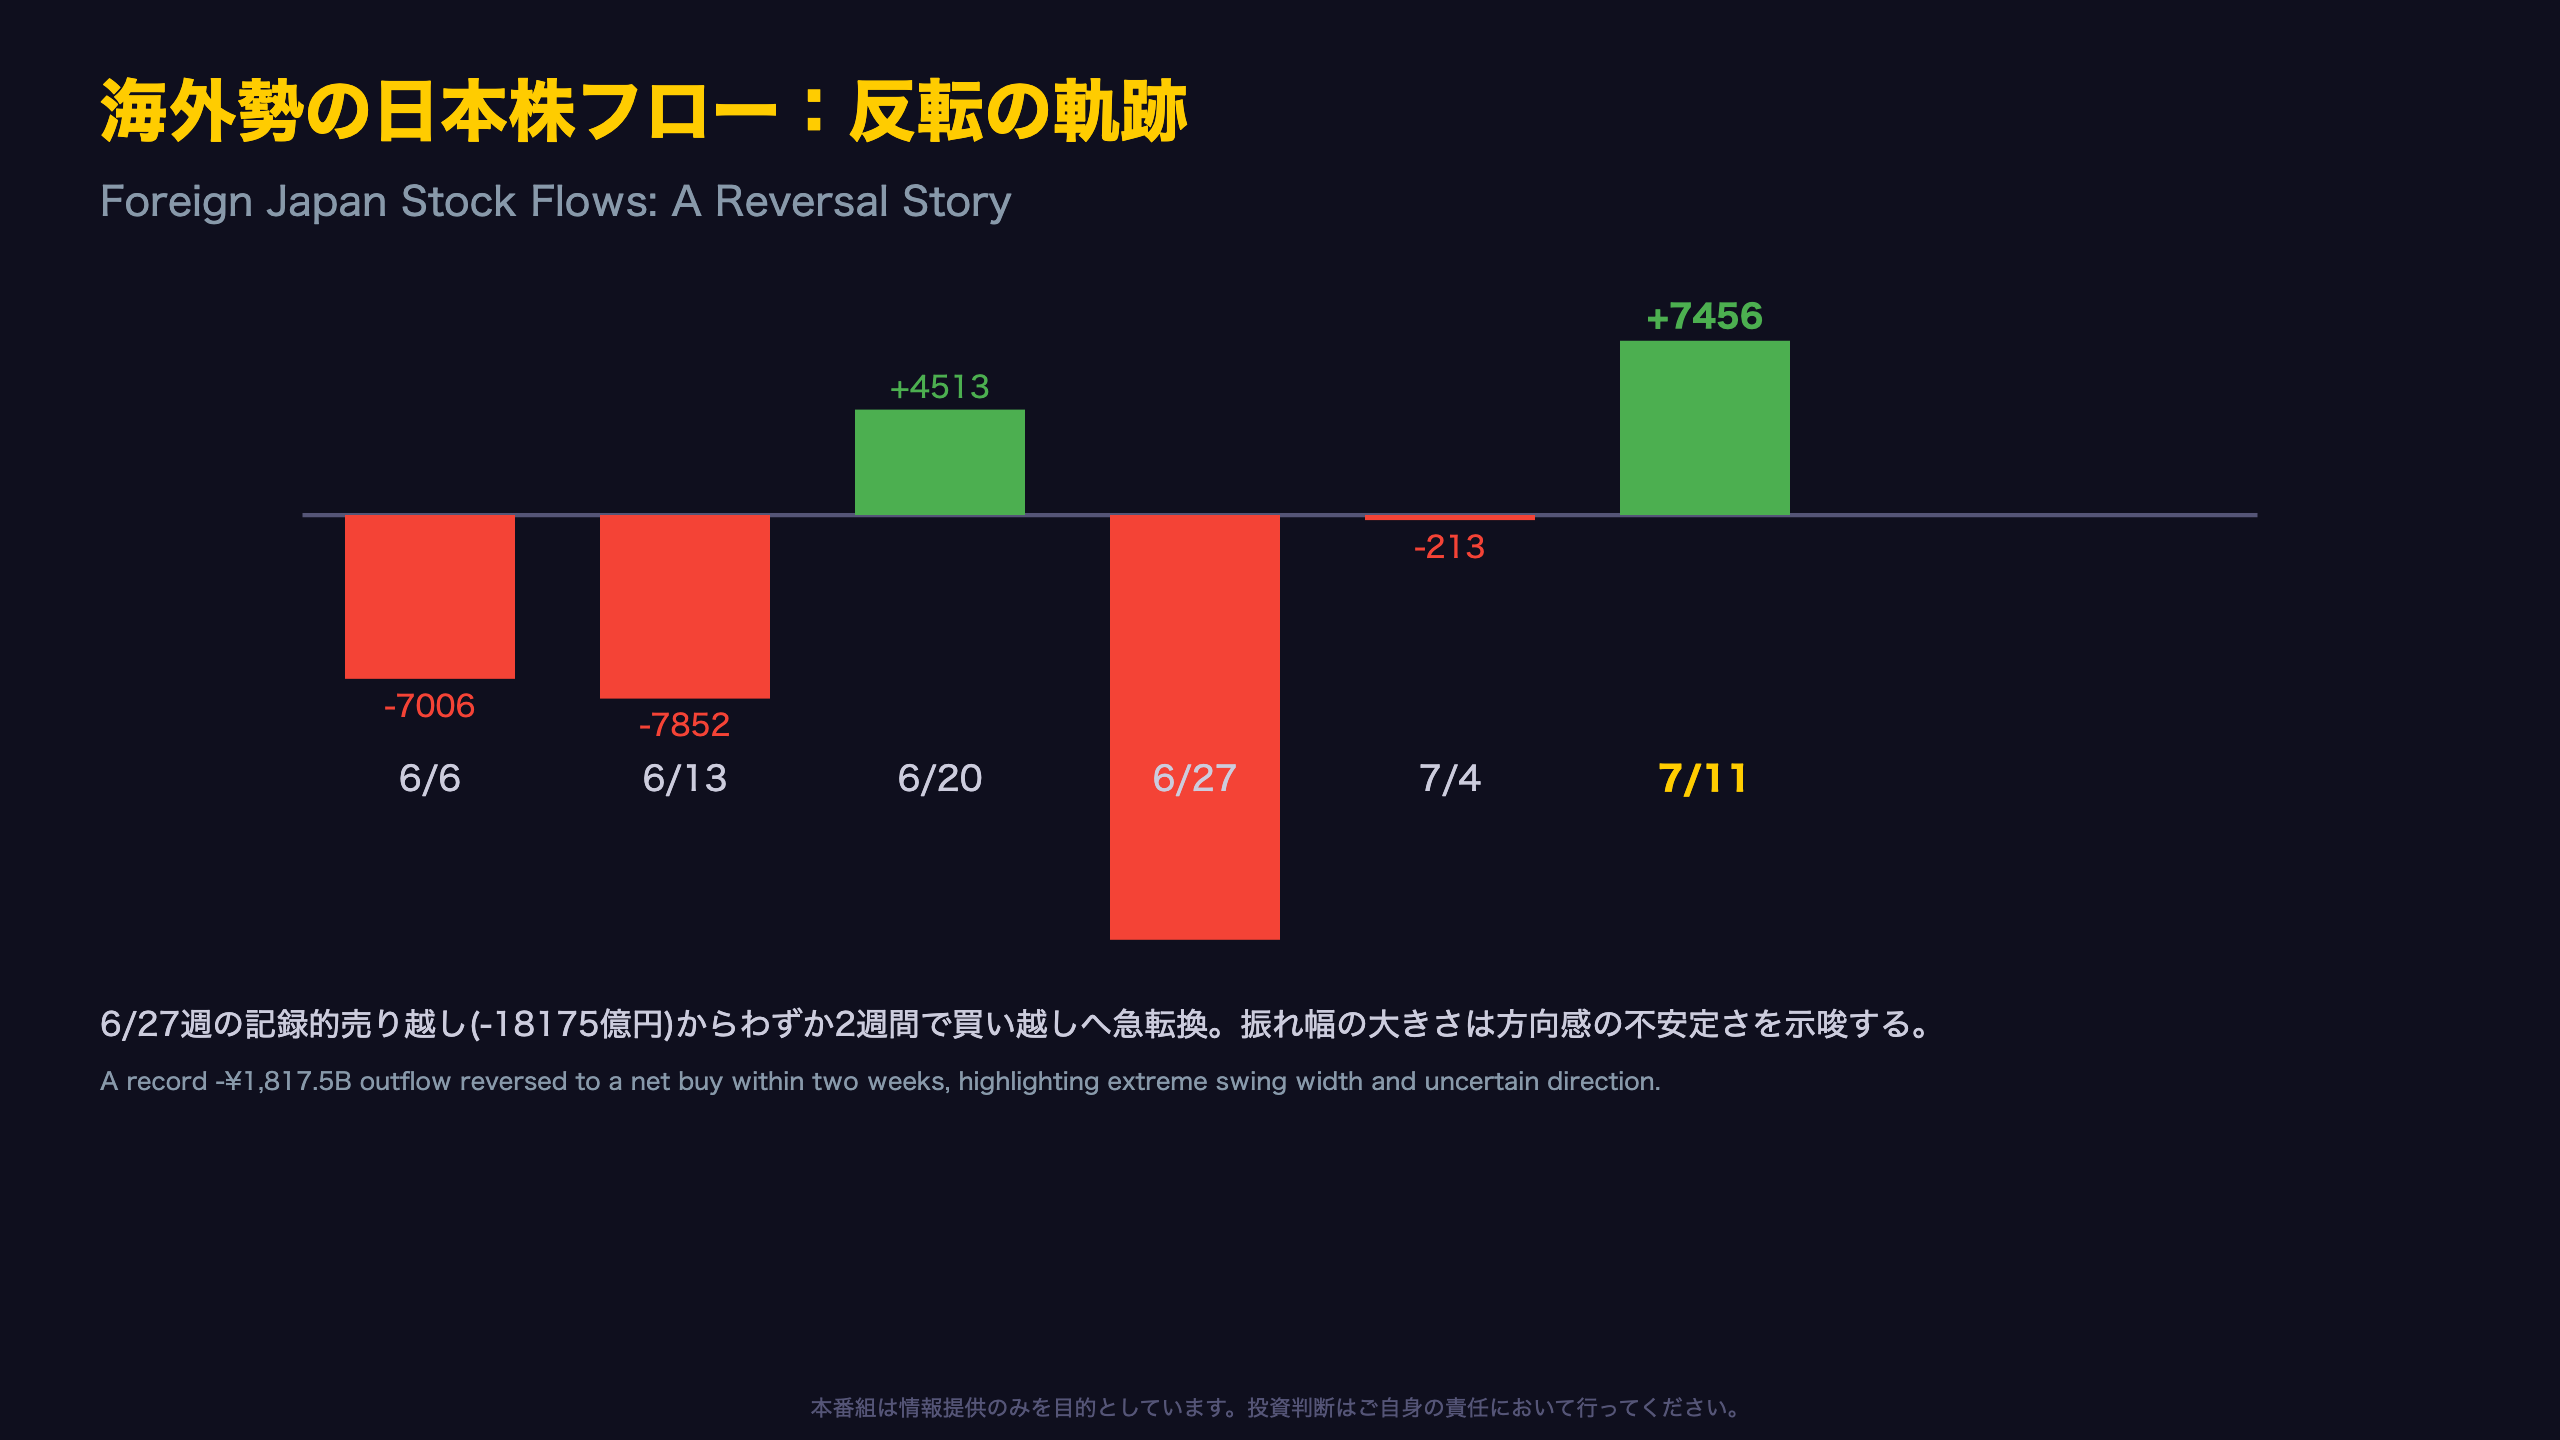
Reading the Volatility in Foreign Flows
The six-week pattern of foreign net buying/selling in Japanese equities reveals extreme volatility:
| Week Ending | Foreign Japan Stock Flow (JPY bn) |
|---|---|
| Jun 6 | -700.6 |
| Jun 13 | -785.2 |
| Jun 20 | +451.3 |
| Jun 27 | -1,817.5 |
| Jul 4 | -21.3 |
| Jul 11 | +745.6 |
The 1,817.5 billion yen net sale in the week of June 27 stands out as one of the largest single-week outflows in the trailing year. That it reversed to a 745.6 billion yen inflow within two weeks suggests rapid position adjustment among foreign investors, though the underlying driver is not disclosed in the MOF release.
Bonds Moved in Tandem
Long-term bond flows mirrored the equity pattern, moving from a 502.3 billion yen net sale (week of June 27) to a 499.8 billion yen net buy (week of July 11). When both stocks and bonds swing the same direction, it is more consistent with a broad-based reallocation toward Japan than an isolated single-asset trade.
A Note of Caution for U.S./European Readers
Compared to U.S. TIC data, which is released monthly with a lag, Japan’s weekly cadence captures short-term hedge fund and arbitrage flows that longer-dated series smooth over. Given that no single direction persisted for more than roughly three consecutive weeks over the past year, treating this reversal as a durable trend would be premature — confirmation from subsequent weekly prints is needed.
日本勢の外債投資加速 ― 実需の円売りシグナル
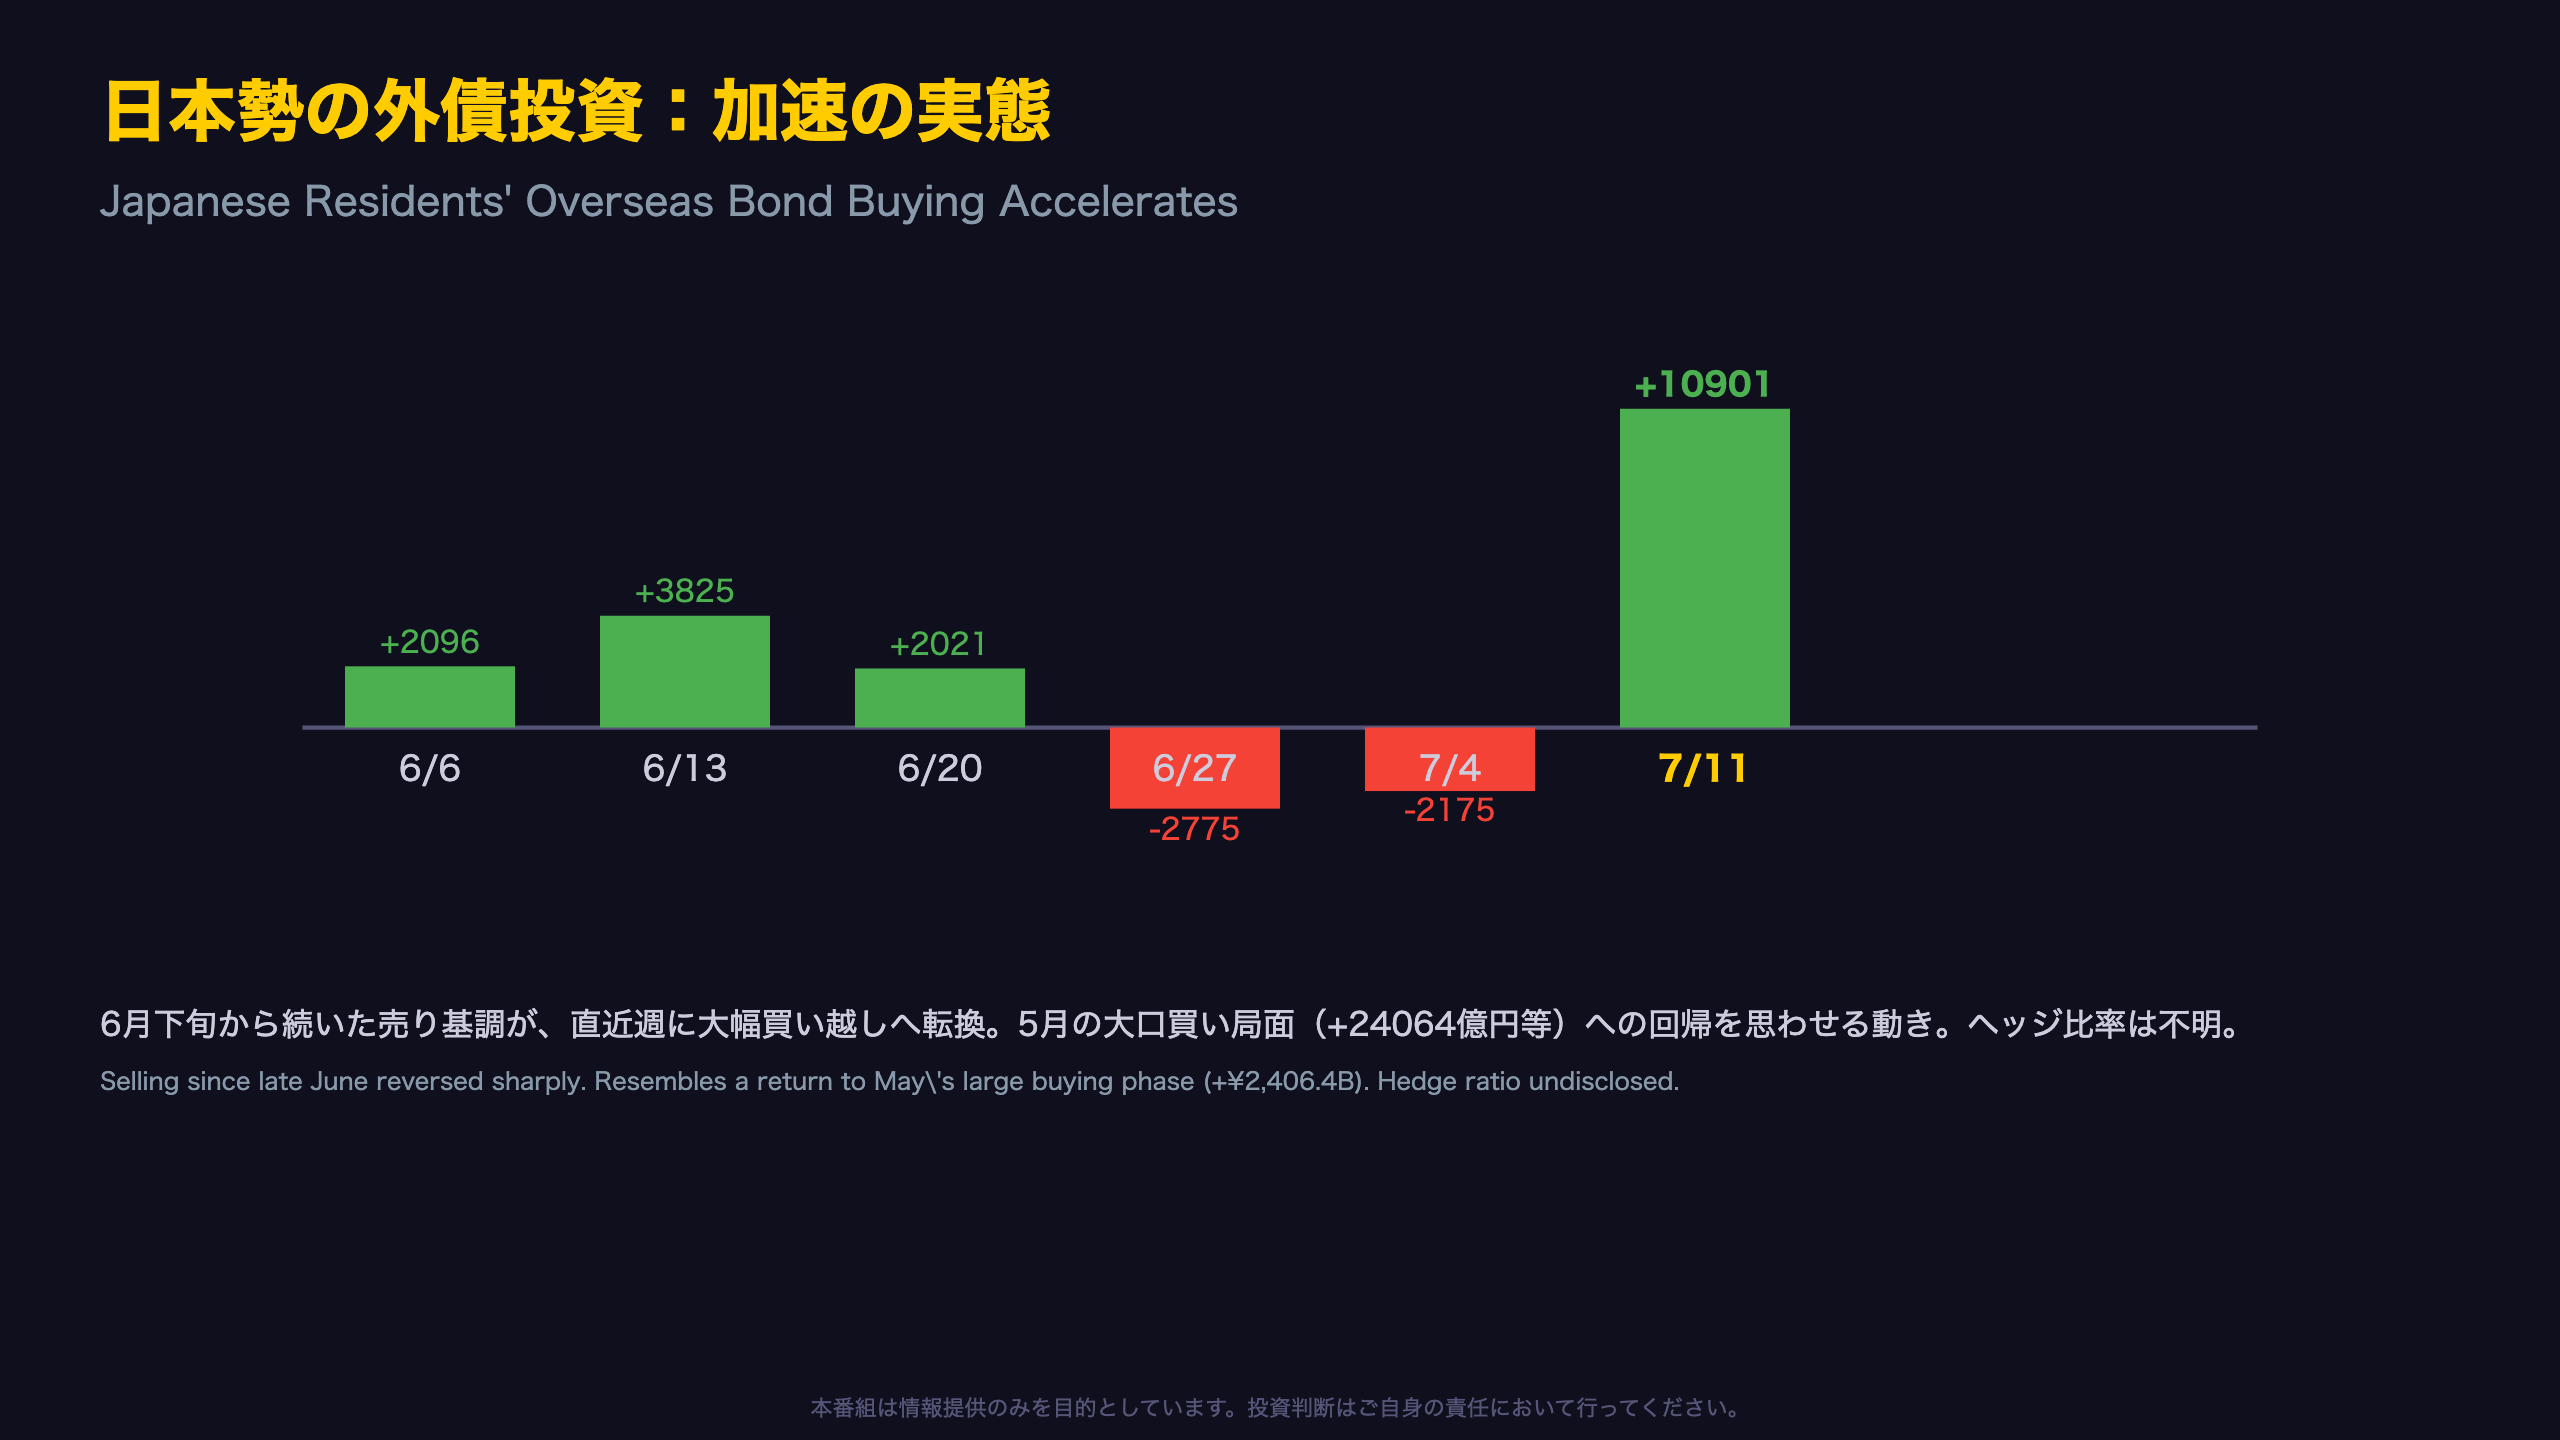
Japanese Outbound Bond Buying Accelerates
Japanese residents (households, insurers, pension funds) bought a net 1,090.1 billion yen of foreign long-term bonds in the latest week — among the larger weekly figures over the trailing year.
Comparison to Prior Large Buying Episodes
| Week | Resident Foreign Long-Bond Flow (JPY bn) |
|---|---|
| May 2, 2026 | +2,406.4 |
| May 9, 2026 | +1,644.3 |
| Jul 11, 2026 | +1,090.1 |
While smaller than the May buying spree, this week’s figure marks a clear reversal from the selling seen in late June and early July (-277.5 billion yen the week of June 27, -217.5 billion yen the week of July 4).
Context for International Readers: Why This Series Matters
Japan’s life insurers and pension funds (notably the Government Pension Investment Fund, GPIF) are among the world’s largest holders of foreign bonds, and their weekly buying/selling patterns are closely watched as a proxy for “Japan money” flows into U.S. Treasuries and European sovereign debt. Unlike the U.S. TIC report, which lags by roughly six weeks, MOF’s weekly release offers near real-time visibility into these flows.
The Hedging Caveat
Whether this buying pressures the yen lower depends critically on whether the purchases are currency-hedged. Unhedged (“open”) foreign bond buying constitutes a direct yen-selling flow, while hedged purchases largely neutralize the FX impact via forward contracts. The MOF weekly release does not disclose hedge ratios, so this report alone cannot confirm the currency impact — a key limitation international investors should bear in mind when reading headline flow numbers.
ネットフローとドル円の関係 ― 拮抗する資本移動
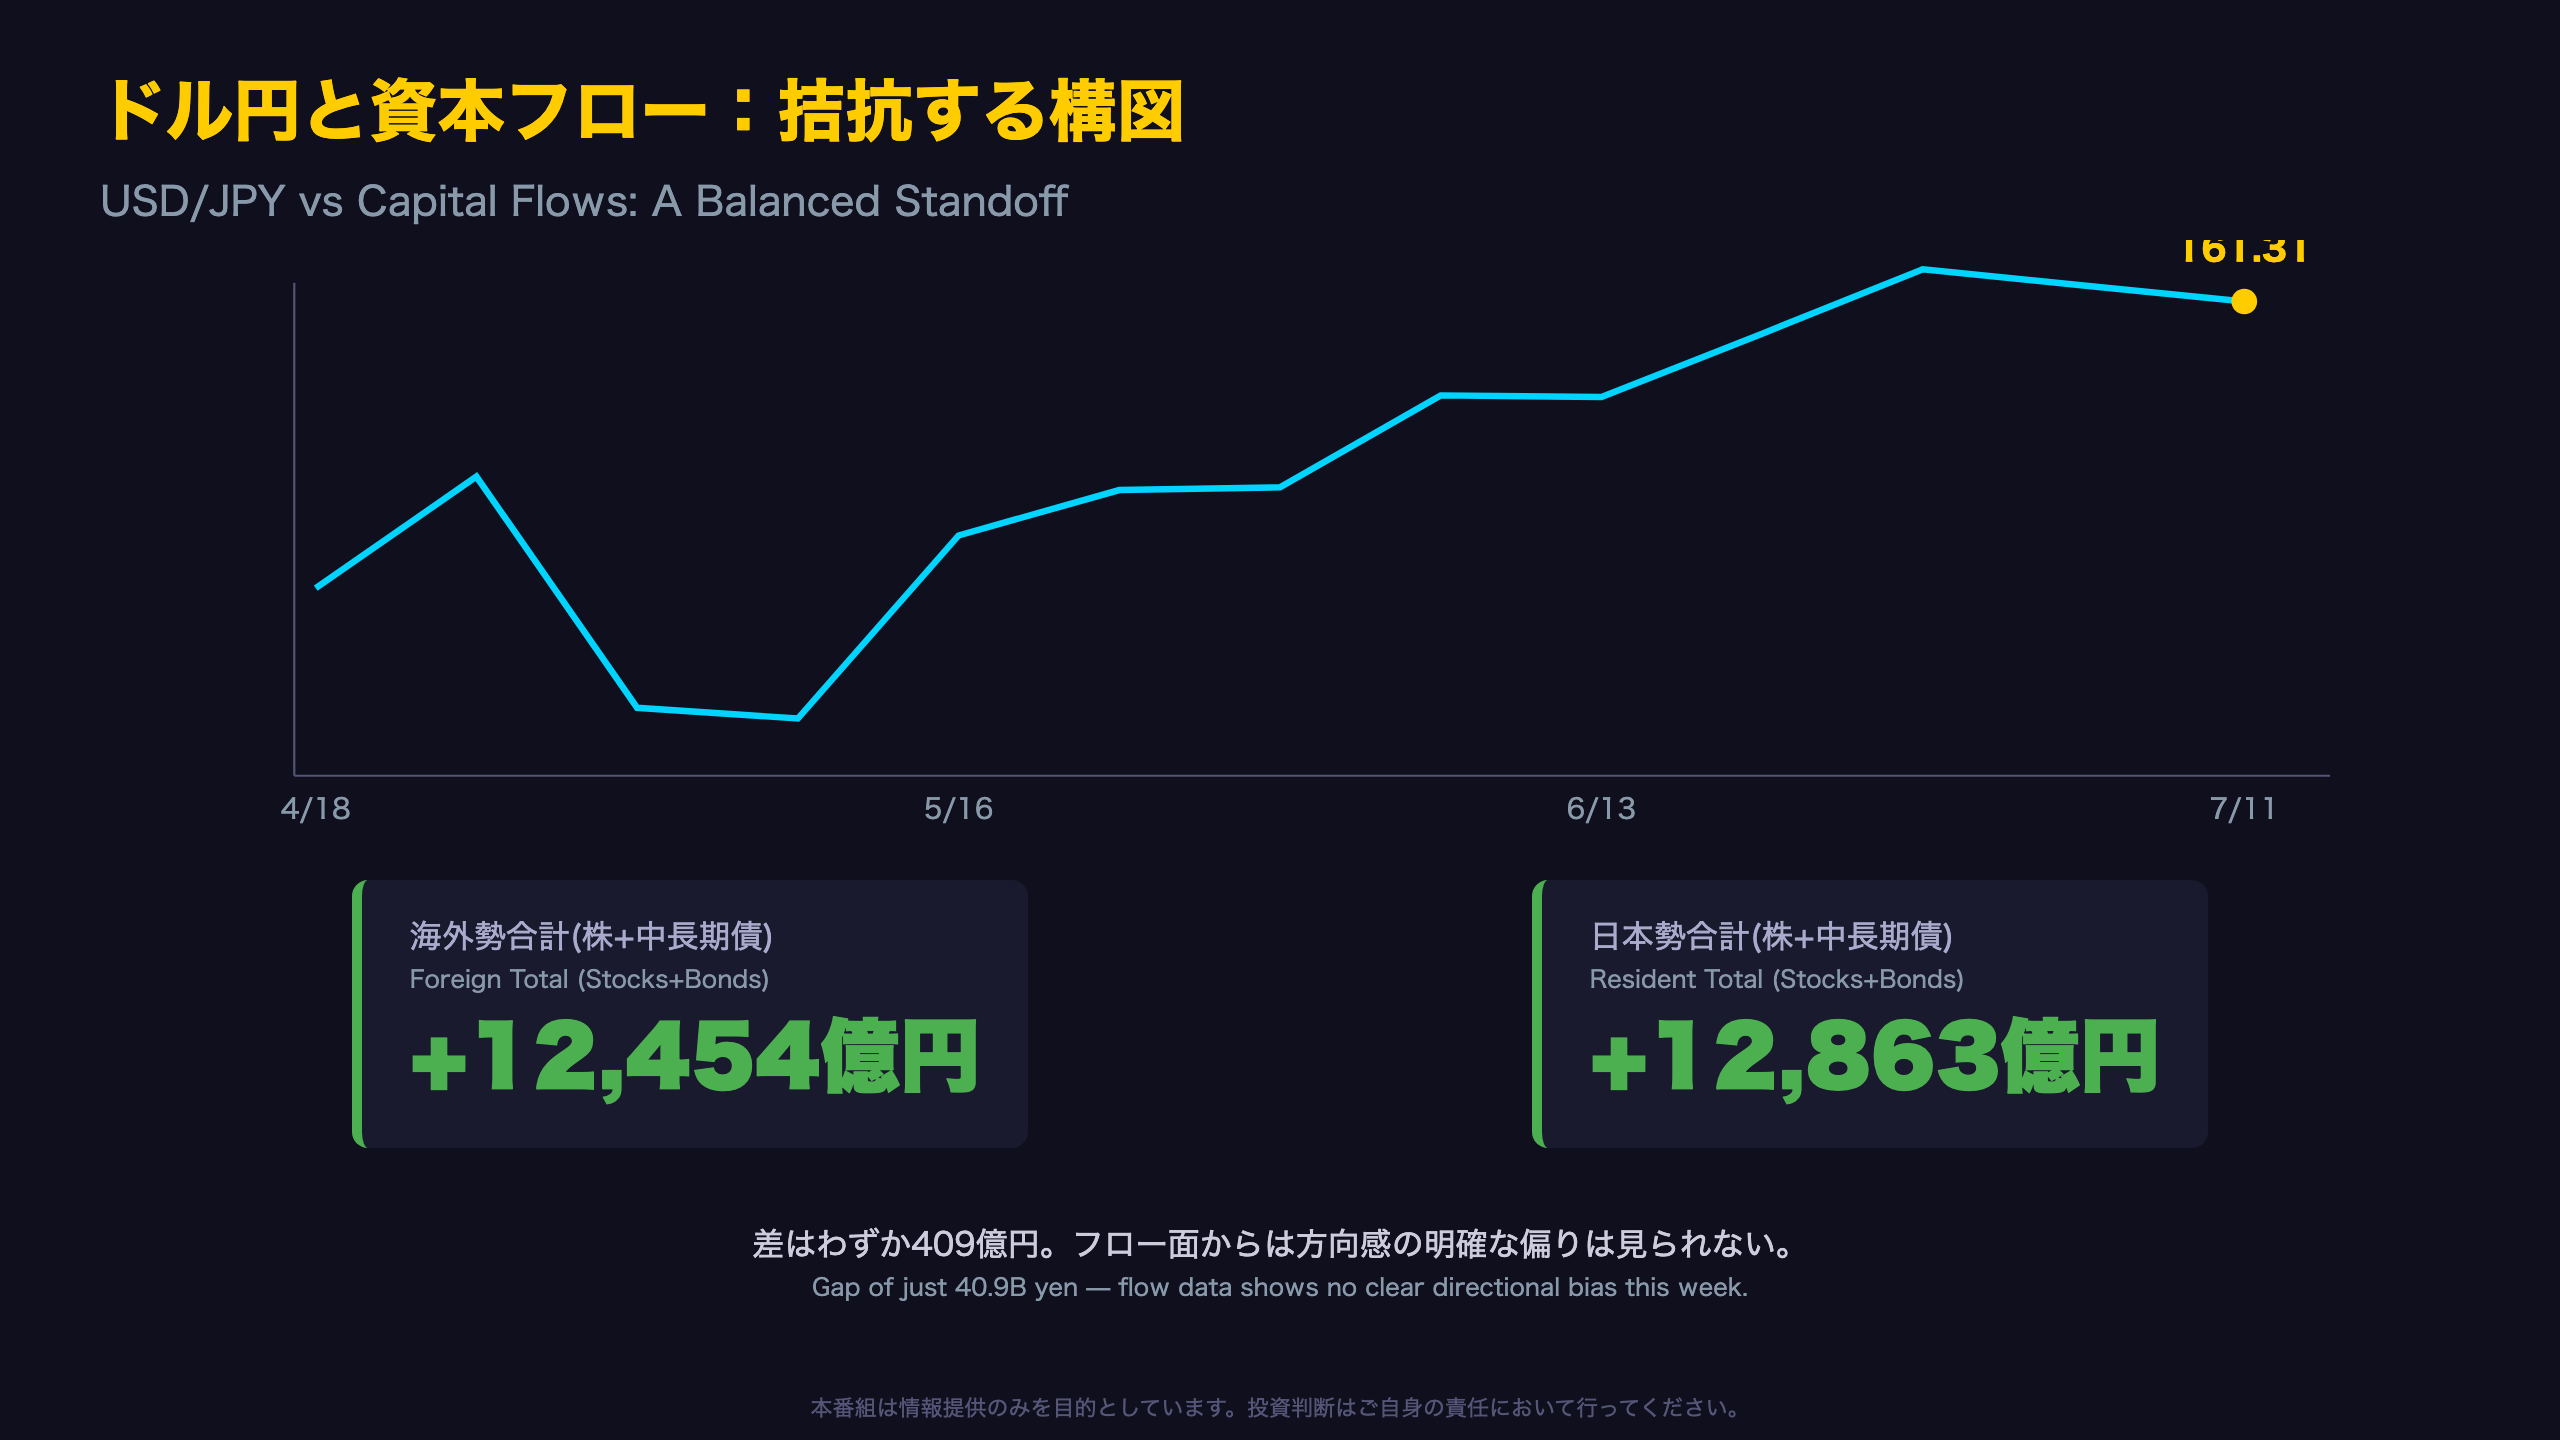
One Year of Yen Weakness Against a Backdrop of Volatile Flows
USD/JPY rose from 148.55 on July 19, 2025, to 161.31 on July 11, 2026 — a depreciation of roughly 12.76 yen, or about 8.6%. This was not a smooth, monotonic decline; the yen saw notable retracements along the way (e.g., 152.77 on Feb 14, 2026, and 156.76 on May 2, 2026).
This Week’s Net Flow Comparison
| Flow Type | Net Buying (JPY bn) |
|---|---|
| Foreign (Japan stocks + long bonds) | +1,245.4 |
| Resident (foreign stocks + long bonds) | +1,286.3 |
The gap between the two is a mere 40.9 billion yen — arguably within the range of weekly statistical noise. Taken at face value, this week’s flow data shows no clear directional bias for the yen.
A Balance-of-Payments Perspective for International Readers
For readers accustomed to the U.S. Balance of Payments framework, Japan’s weekly securities flow data is analogous to a high-frequency proxy for the financial account. It should be read alongside Japan’s monthly current account data (published by the Ministry of Finance) to assess whether capital outflows are being driven by portfolio rebalancing (financial account) or by a persistent goods/services trade imbalance (current account) — the drivers carry different implications for the yen’s medium-term trajectory.
Caveat: Contract-Basis Timing
It’s worth noting that this data reflects transaction contracts, not settlement dates, meaning actual FX conversion may occur with a lag relative to the reported flow. This timing mismatch is a structural limitation of using weekly flow data to explain same-week currency moves.
過去1年の特異点 ― 3月末の記録的売りと4月の急反発
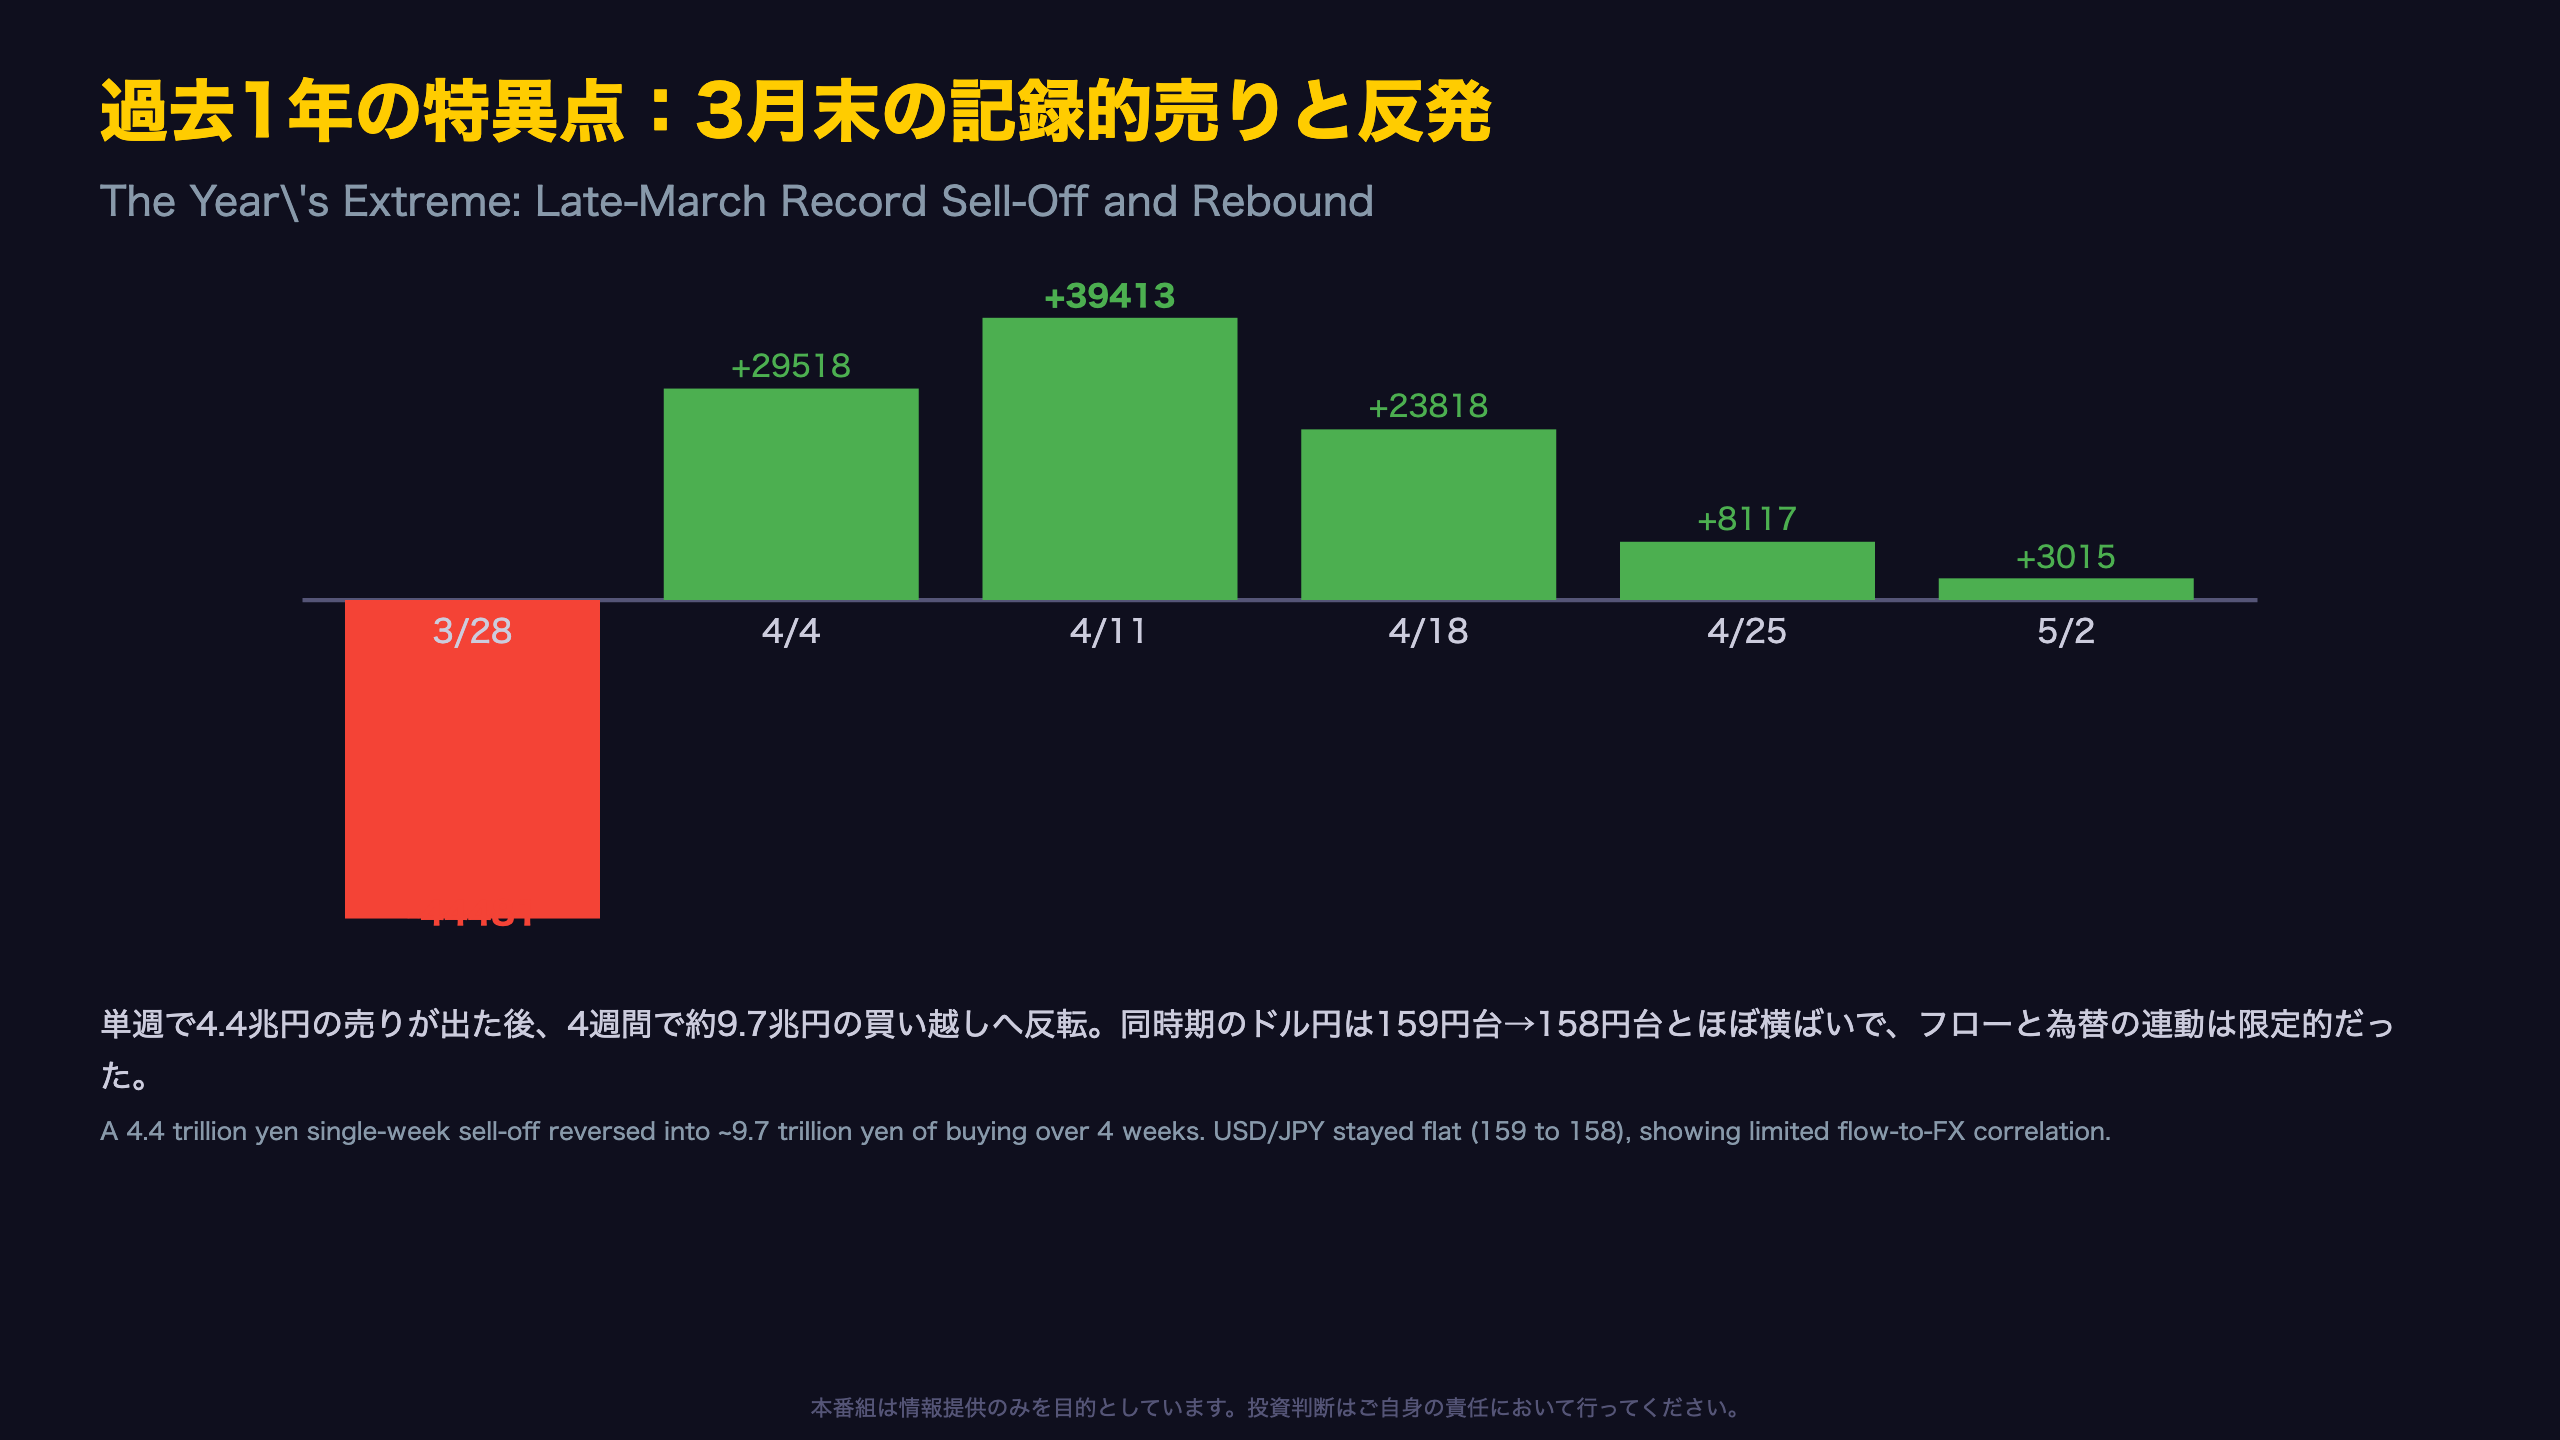
The Record Sell-Off and Rapid Rebound: Late March to April
The most extreme episode in the trailing year occurred in the week of March 22-28, 2026, when foreign investors net-sold 4,448.1 billion yen of Japanese stocks — the largest single-week outflow in this dataset, more than double the 1,817.5 billion yen sell-off seen in late June.
The Rebound Sequence
| Week | Foreign Japan Stock Flow (JPY bn) |
|---|---|
| Mar 22-28 | -4,448.1 |
| Mar 29-Apr 4 | +2,951.8 |
| Apr 5-11 | +3,941.3 |
| Apr 12-18 | +2,381.8 |
| Apr 19-25 | +811.7 |
| Apr 26-May 2 | +301.5 |
After a roughly 4.4 trillion yen outflow in a single week, the subsequent four weeks saw a cumulative inflow of nearly 9.7 trillion yen. A reversal of this magnitude in such a short window is more consistent with fiscal year-end (Japan’s fiscal year ends March 31) rebalancing dynamics or large single-investor repositioning than routine portfolio flow — though the underlying driver cannot be confirmed from this data alone.
Limited Currency Correlation — A Useful Lesson for FX Traders
Interestingly, USD/JPY barely moved during this period, going from 159.26 (March 21) to 158.10 (April 18) — if anything, a modest yen appreciation despite the dramatic equity outflow. This is a useful reminder for international investors: equity portfolio flows, even at trillion-yen scale, do not always translate one-to-one into currency moves, particularly when offset by other capital account items like bond flows or corporate FX hedging activity.
インプリケーション ― 資本フロー拮抗の中のドル円161円
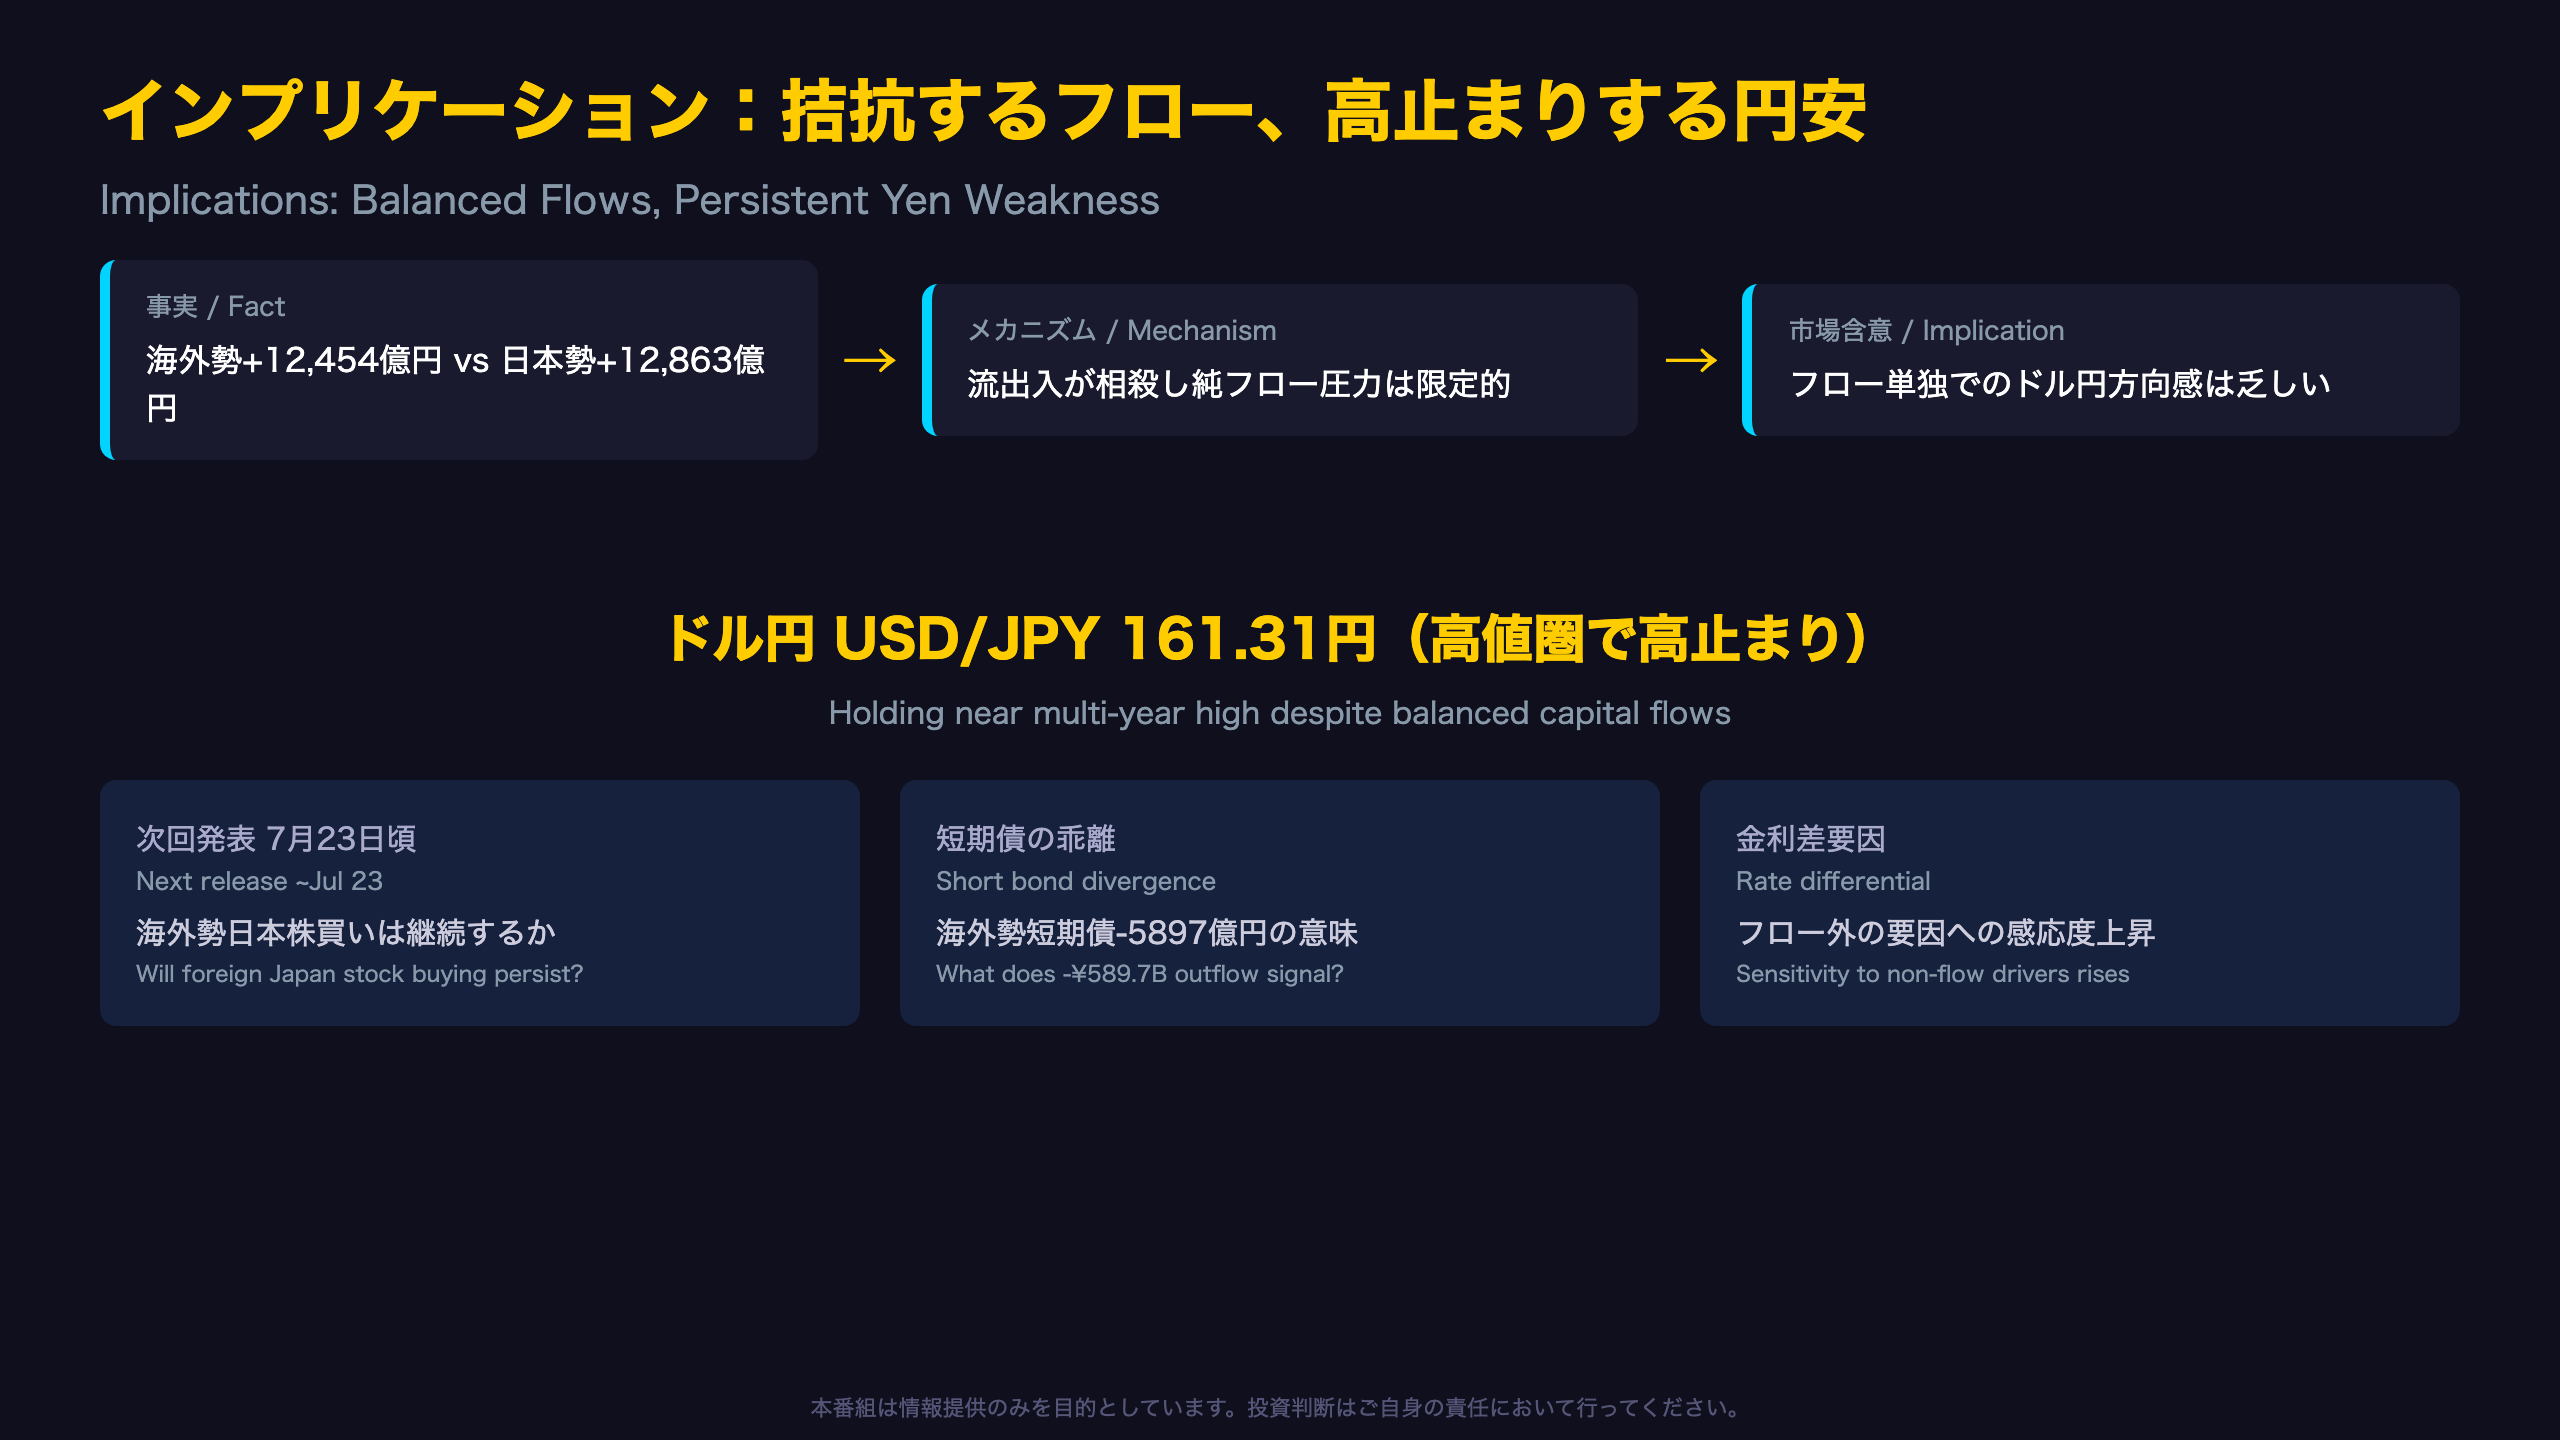
Conclusion: Balanced Flows, Persistent Yen Weakness
Chain of Evidence
- [Fact] Foreign net buying of Japanese stocks and long bonds totaled 1,245.4 billion yen, almost exactly matched by resident net buying of foreign stocks and long bonds at 1,286.3 billion yen.
- [Mechanism] When capital inflows and outflows largely offset each other, the pure flow-based pressure on currency supply and demand is limited.
- [Market Implication] As a result, this week’s flow data alone provides little directional signal for USD/JPY. While net capital flows are generally cited as one influence on exchange rates, this data alone cannot identify the primary driver keeping USD/JPY elevated near 161.
Interest Rate Differentials: The Other Half of the Story
For readers familiar with Fed/ECB frameworks, it’s worth noting that the persistent USD/JPY strength likely also reflects the wide gap between U.S. and Japanese policy rates — a factor entirely outside the scope of this weekly flow report. This dataset should be read alongside Japanese Government Bond (JGB) yields, U.S. Treasury yields, and BOJ/Fed policy rate decisions for a fuller picture.
What to Watch Next
- Next release (~July 23): Whether foreign buying of Japanese stocks extends to a second consecutive week.
- Short-term bond divergence: Foreign investors sold 589.7 billion yen of short-term JGBs this week — watch whether this diverges further from long-bond buying.
- Durability of resident bond buying: Whether the 1,090.1 billion yen figure is a one-off or persists as it did during the May buying spree.
Bottom Line
This week’s data offers no strong directional trading signal. Instead, it illustrates a broader lesson for FX market participants: when capital flows are balanced and offsetting, sensitivity to non-flow drivers — rate differentials, geopolitics, and seasonal factors — tends to rise correspondingly.
Disclaimer: This article is for informational purposes only. All investment decisions are made solely at your own risk.