📺 Watch the Full Video Analysis
This article was automatically generated by the NFC Market Live AI analysis system. (Updated: 2026-07-13 07:09 JST)
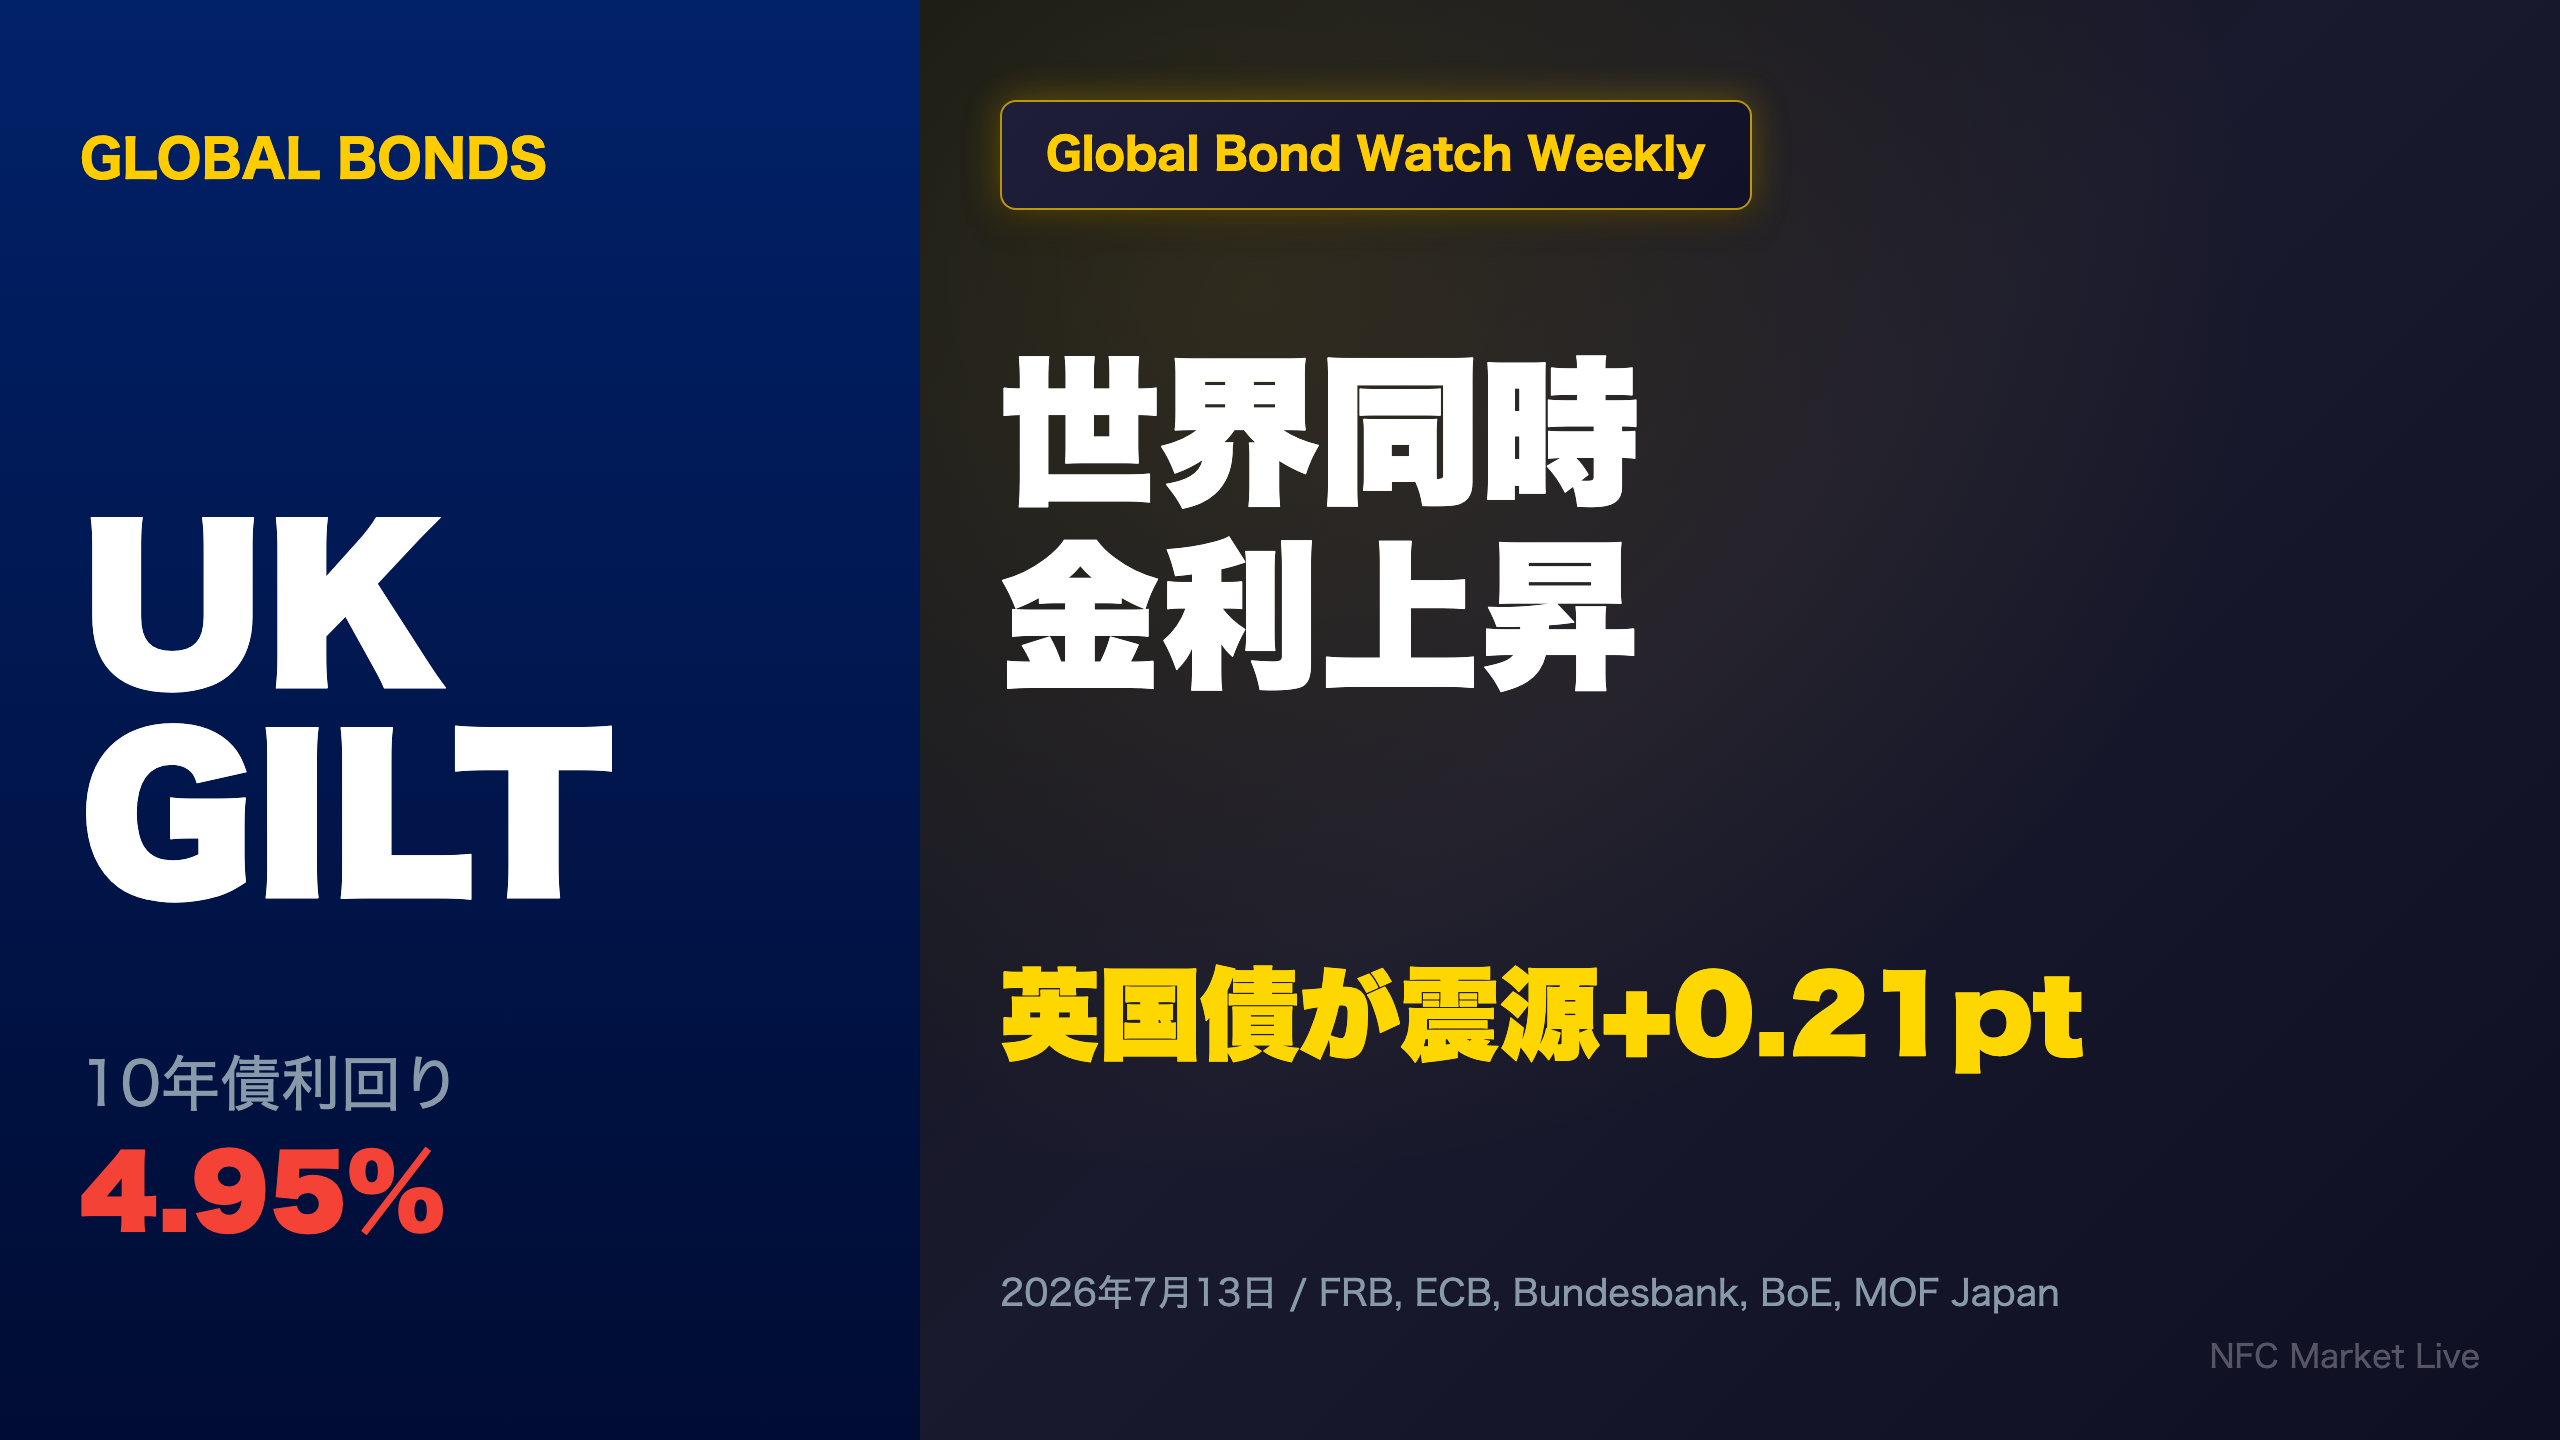
Global bond yields rose broadly this week, with UK Gilts leading the move.
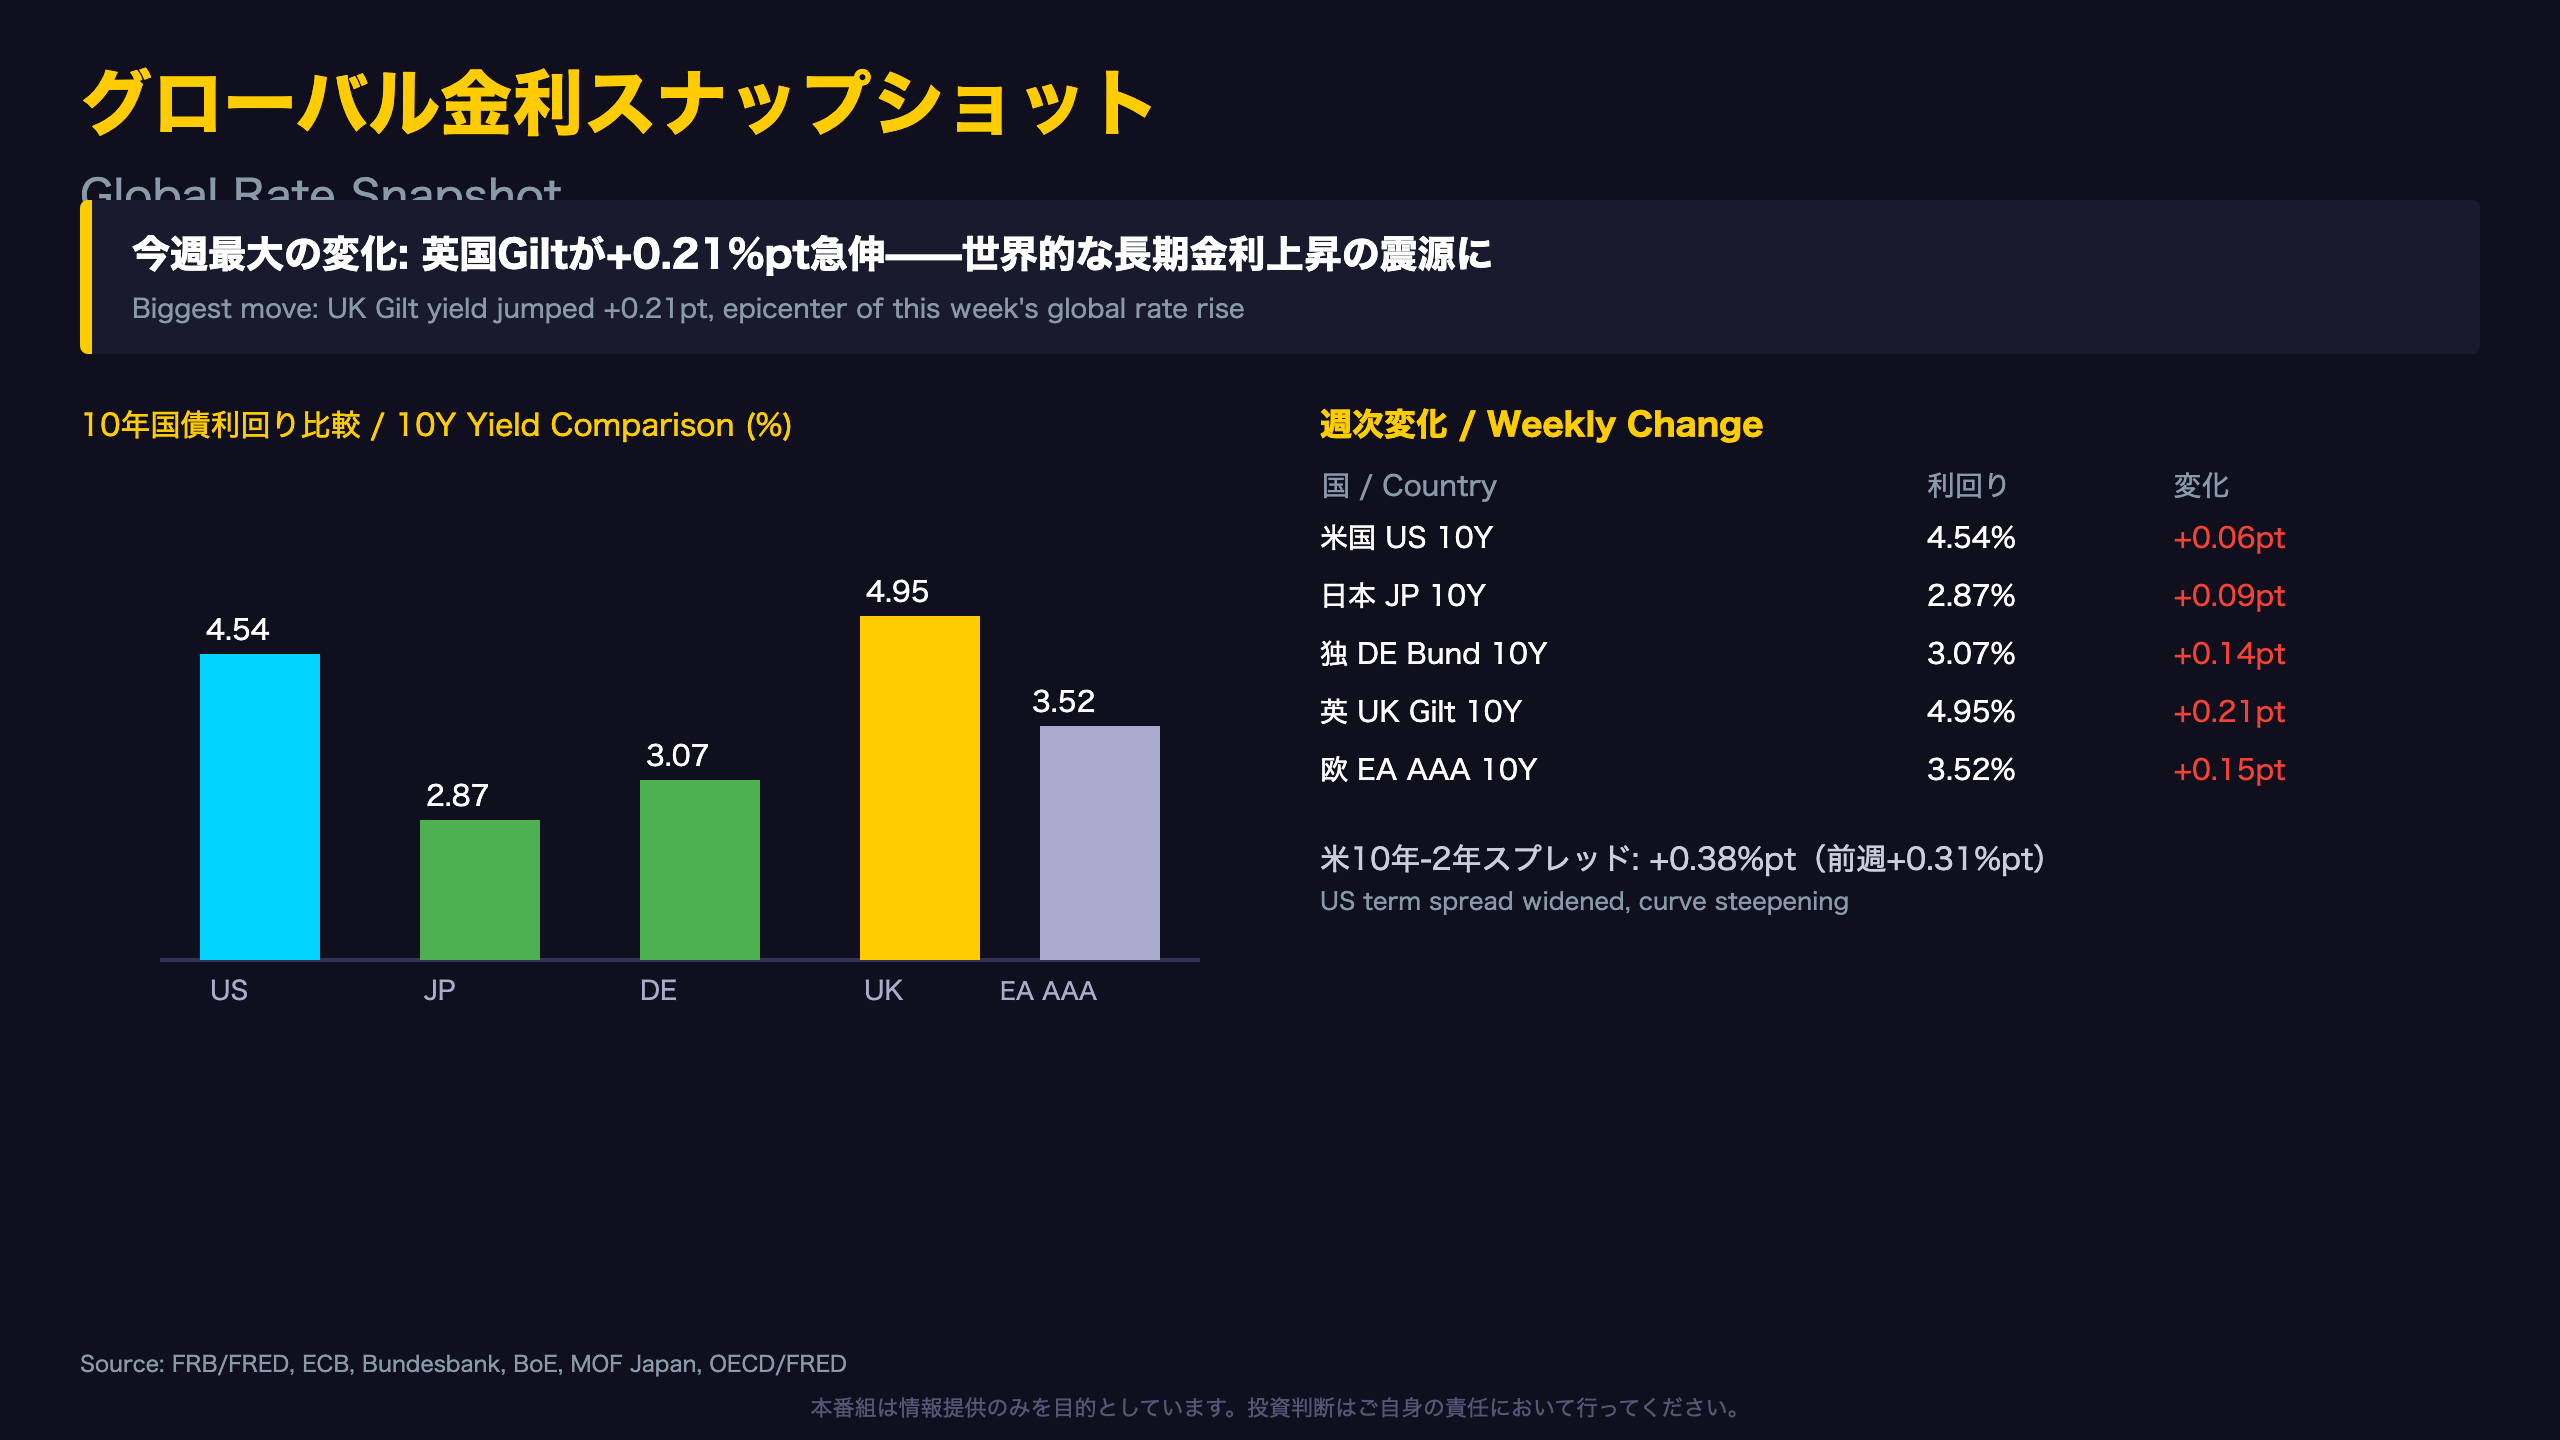
📊 UK 10Y Gilt: 4.95% (+0.21pt WoW) – the week’s biggest mover
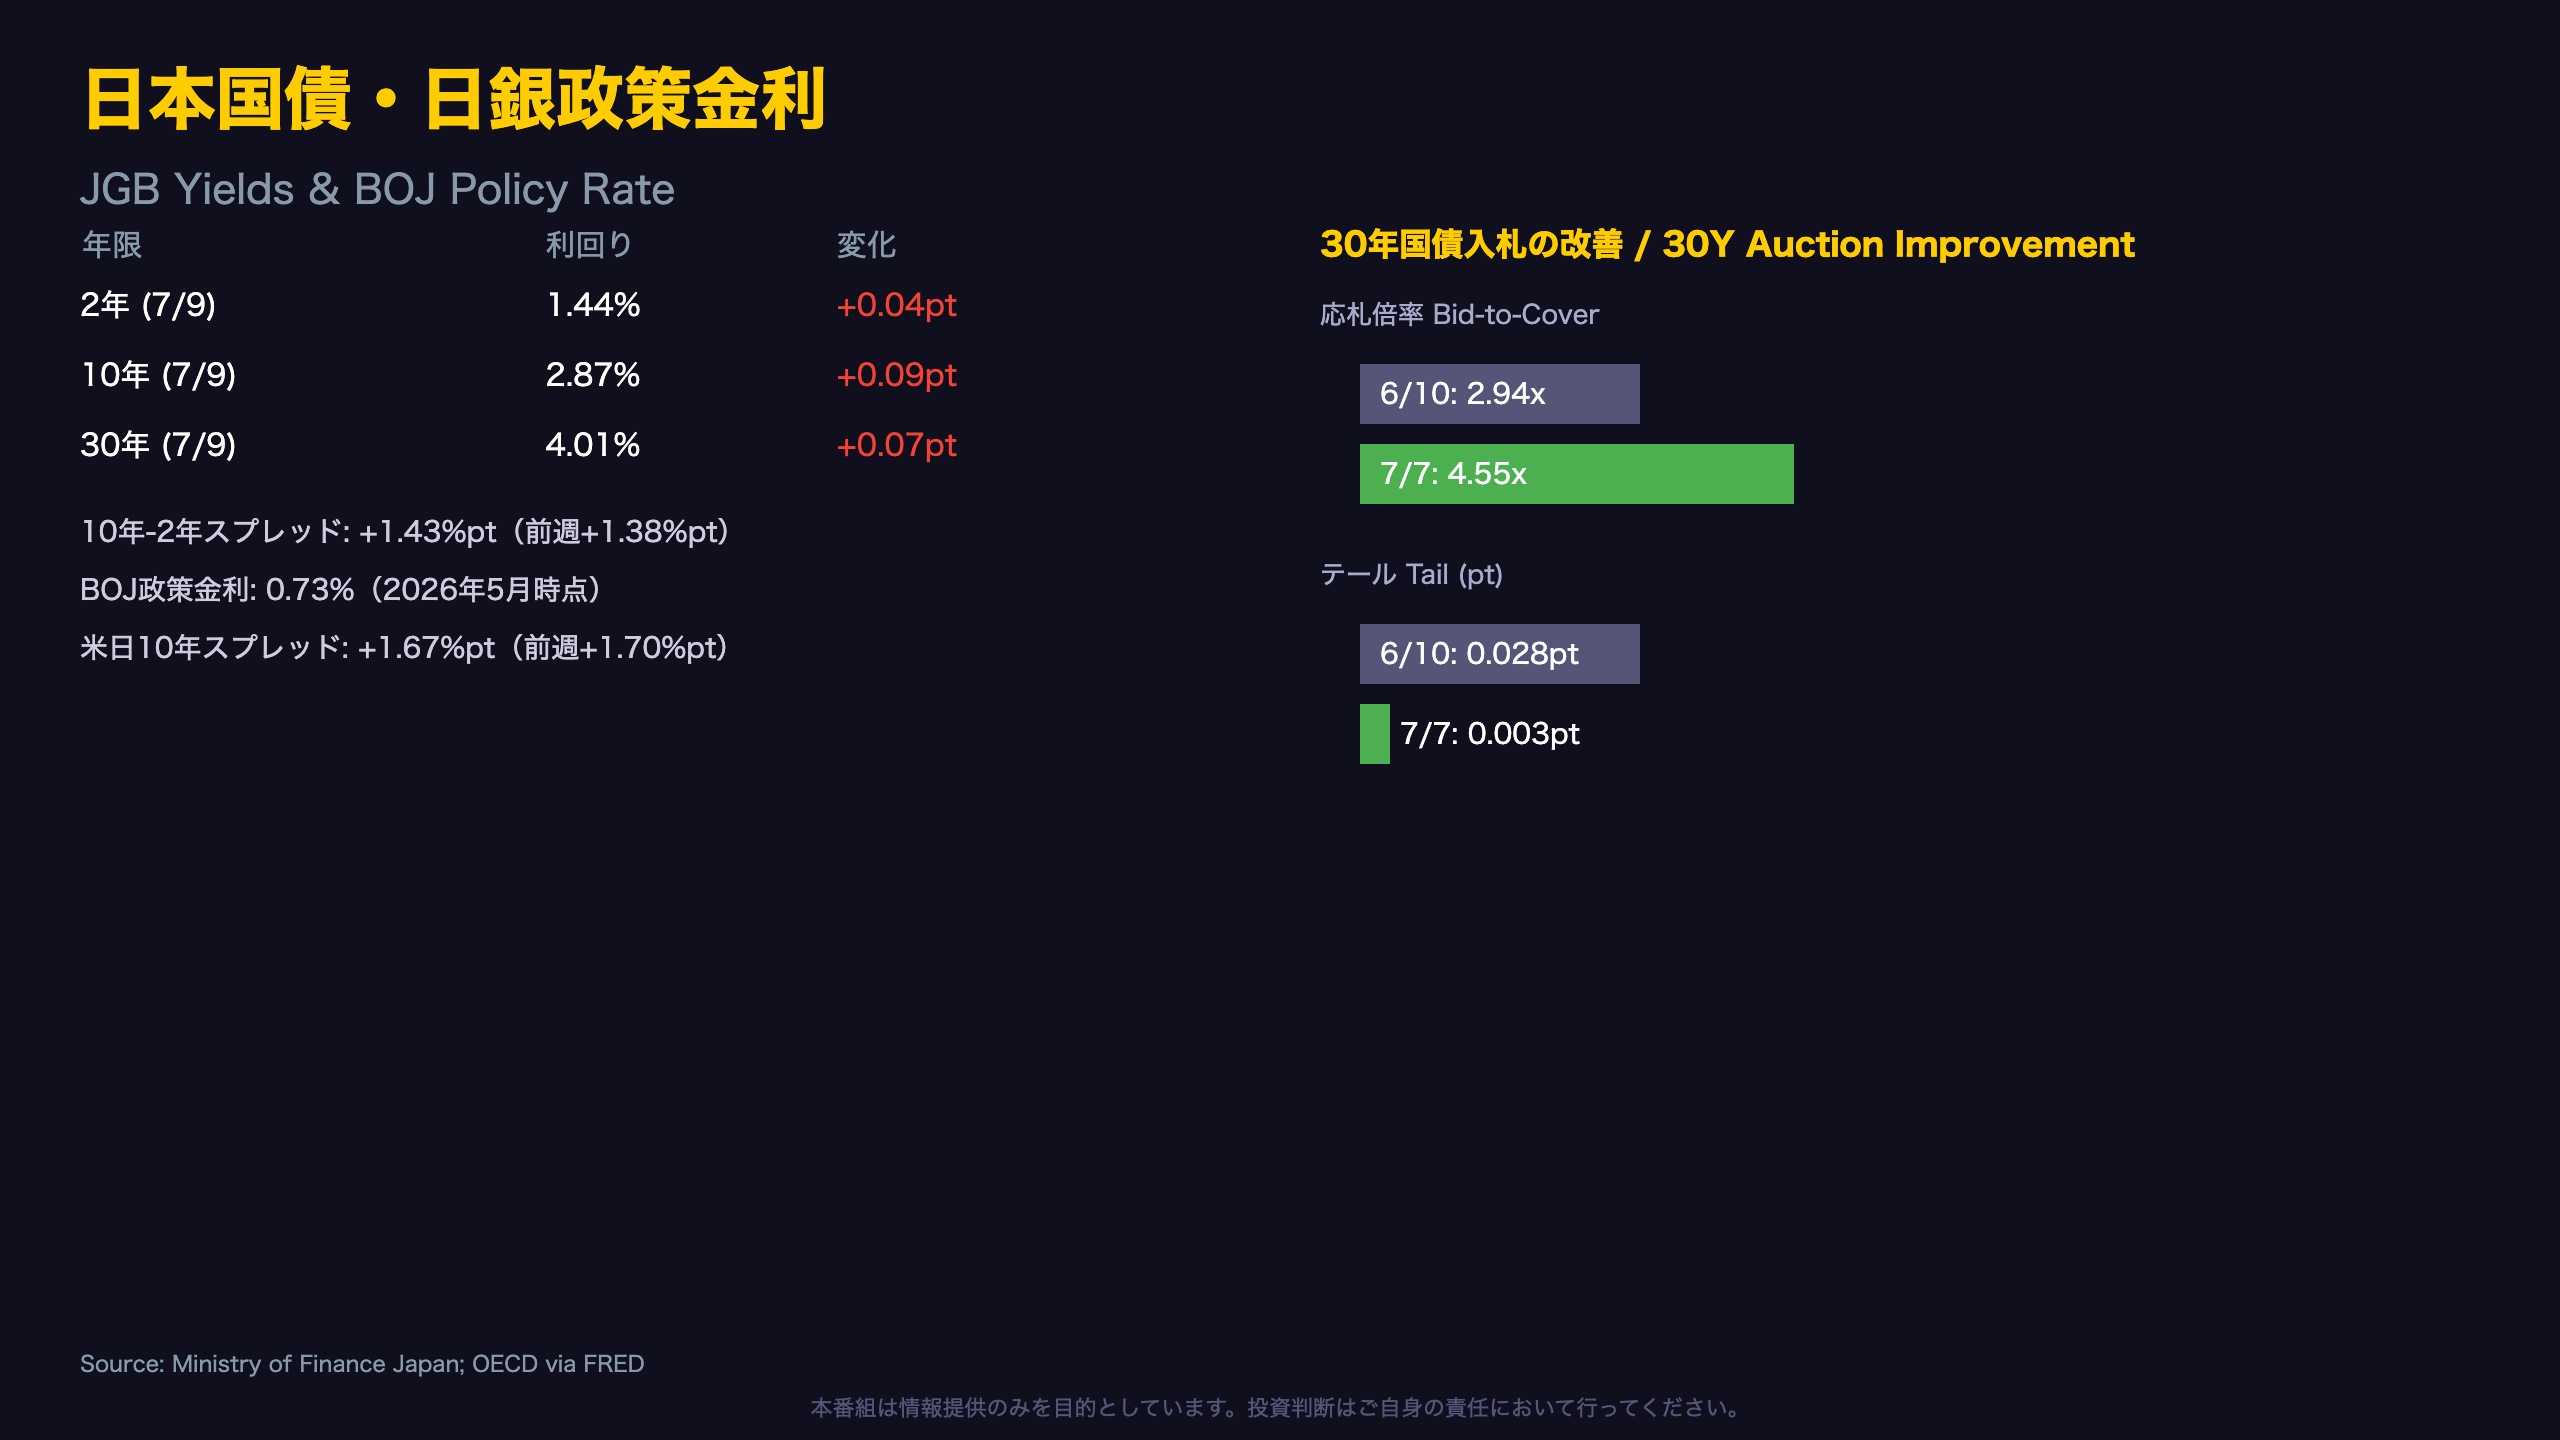
📊 US 10Y: 4.54% (+0.06pt), Japan 10Y: 2.87% (+0.09pt)
📊 US 10Y-2Y term spread widened to +0.38pt, curve steepening
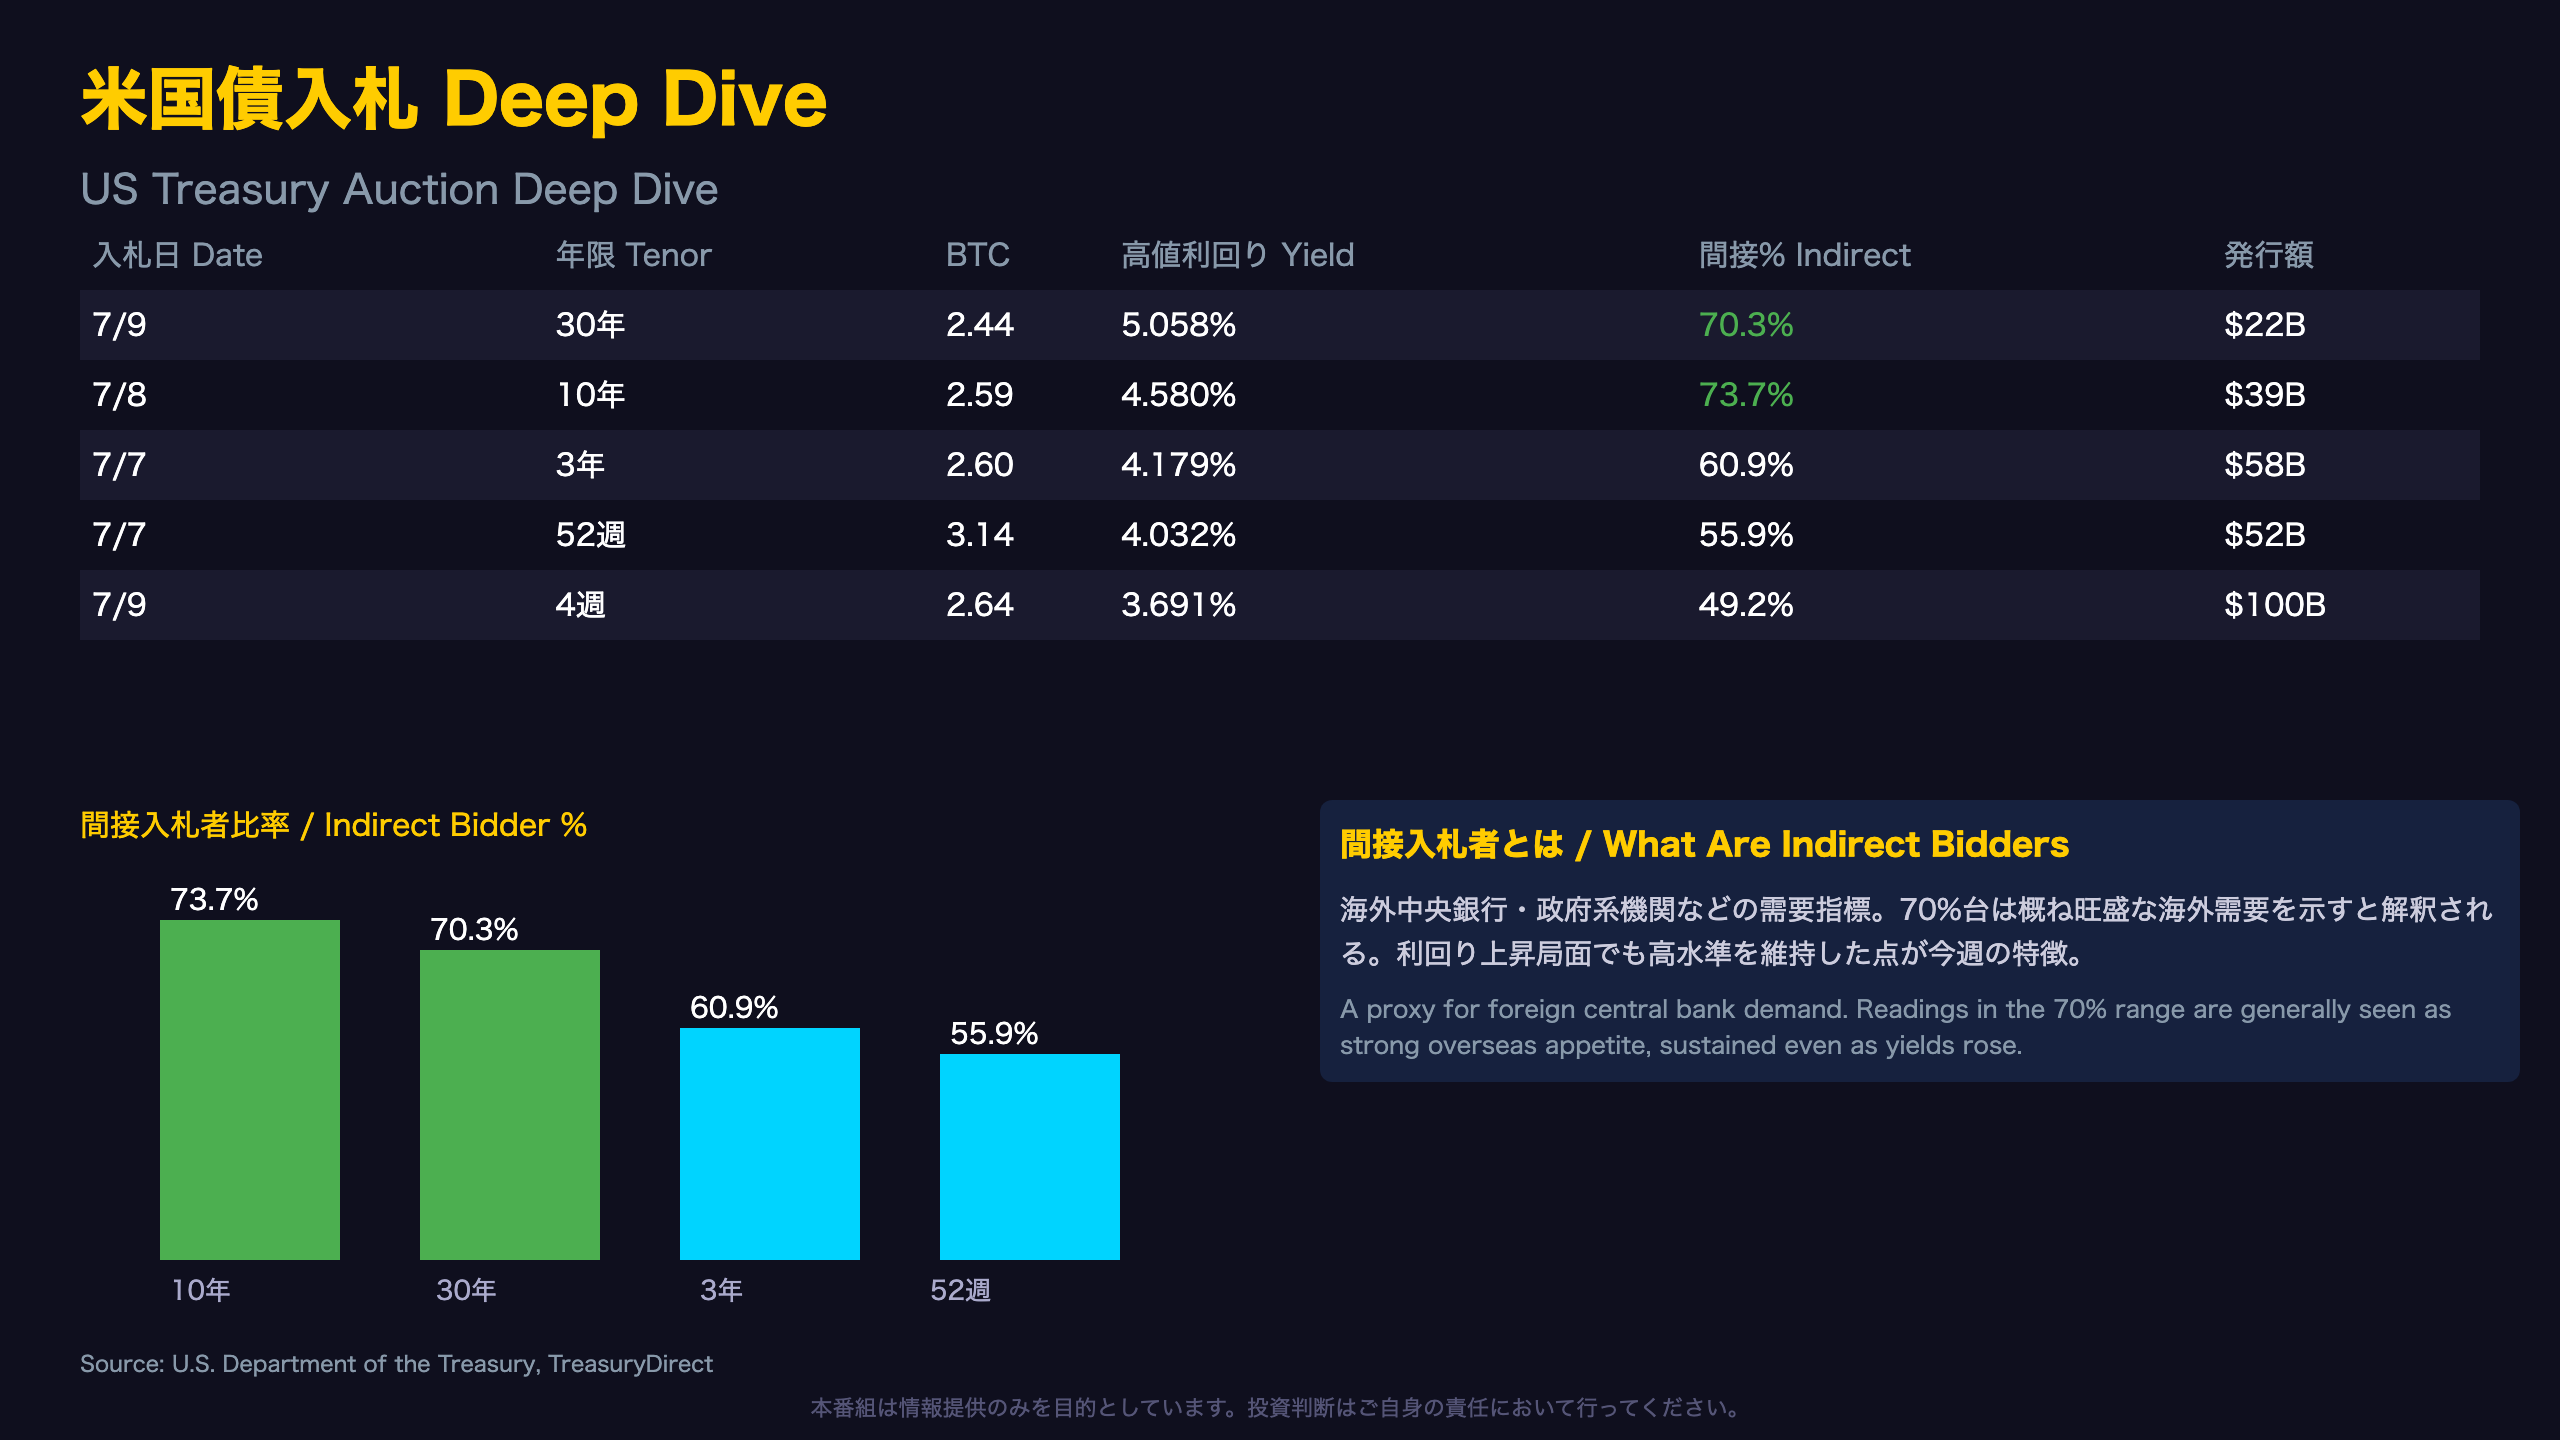
Yet auction demand stayed resilient: indirect bidders took 73.7% of the US 10Y note and 70.3% of the 30Y bond, while Japan’s 30Y JGB auction bid-to-cover jumped from 2.94x to 4.55x.
💡 Demand isn’t breaking down even as yields climb.
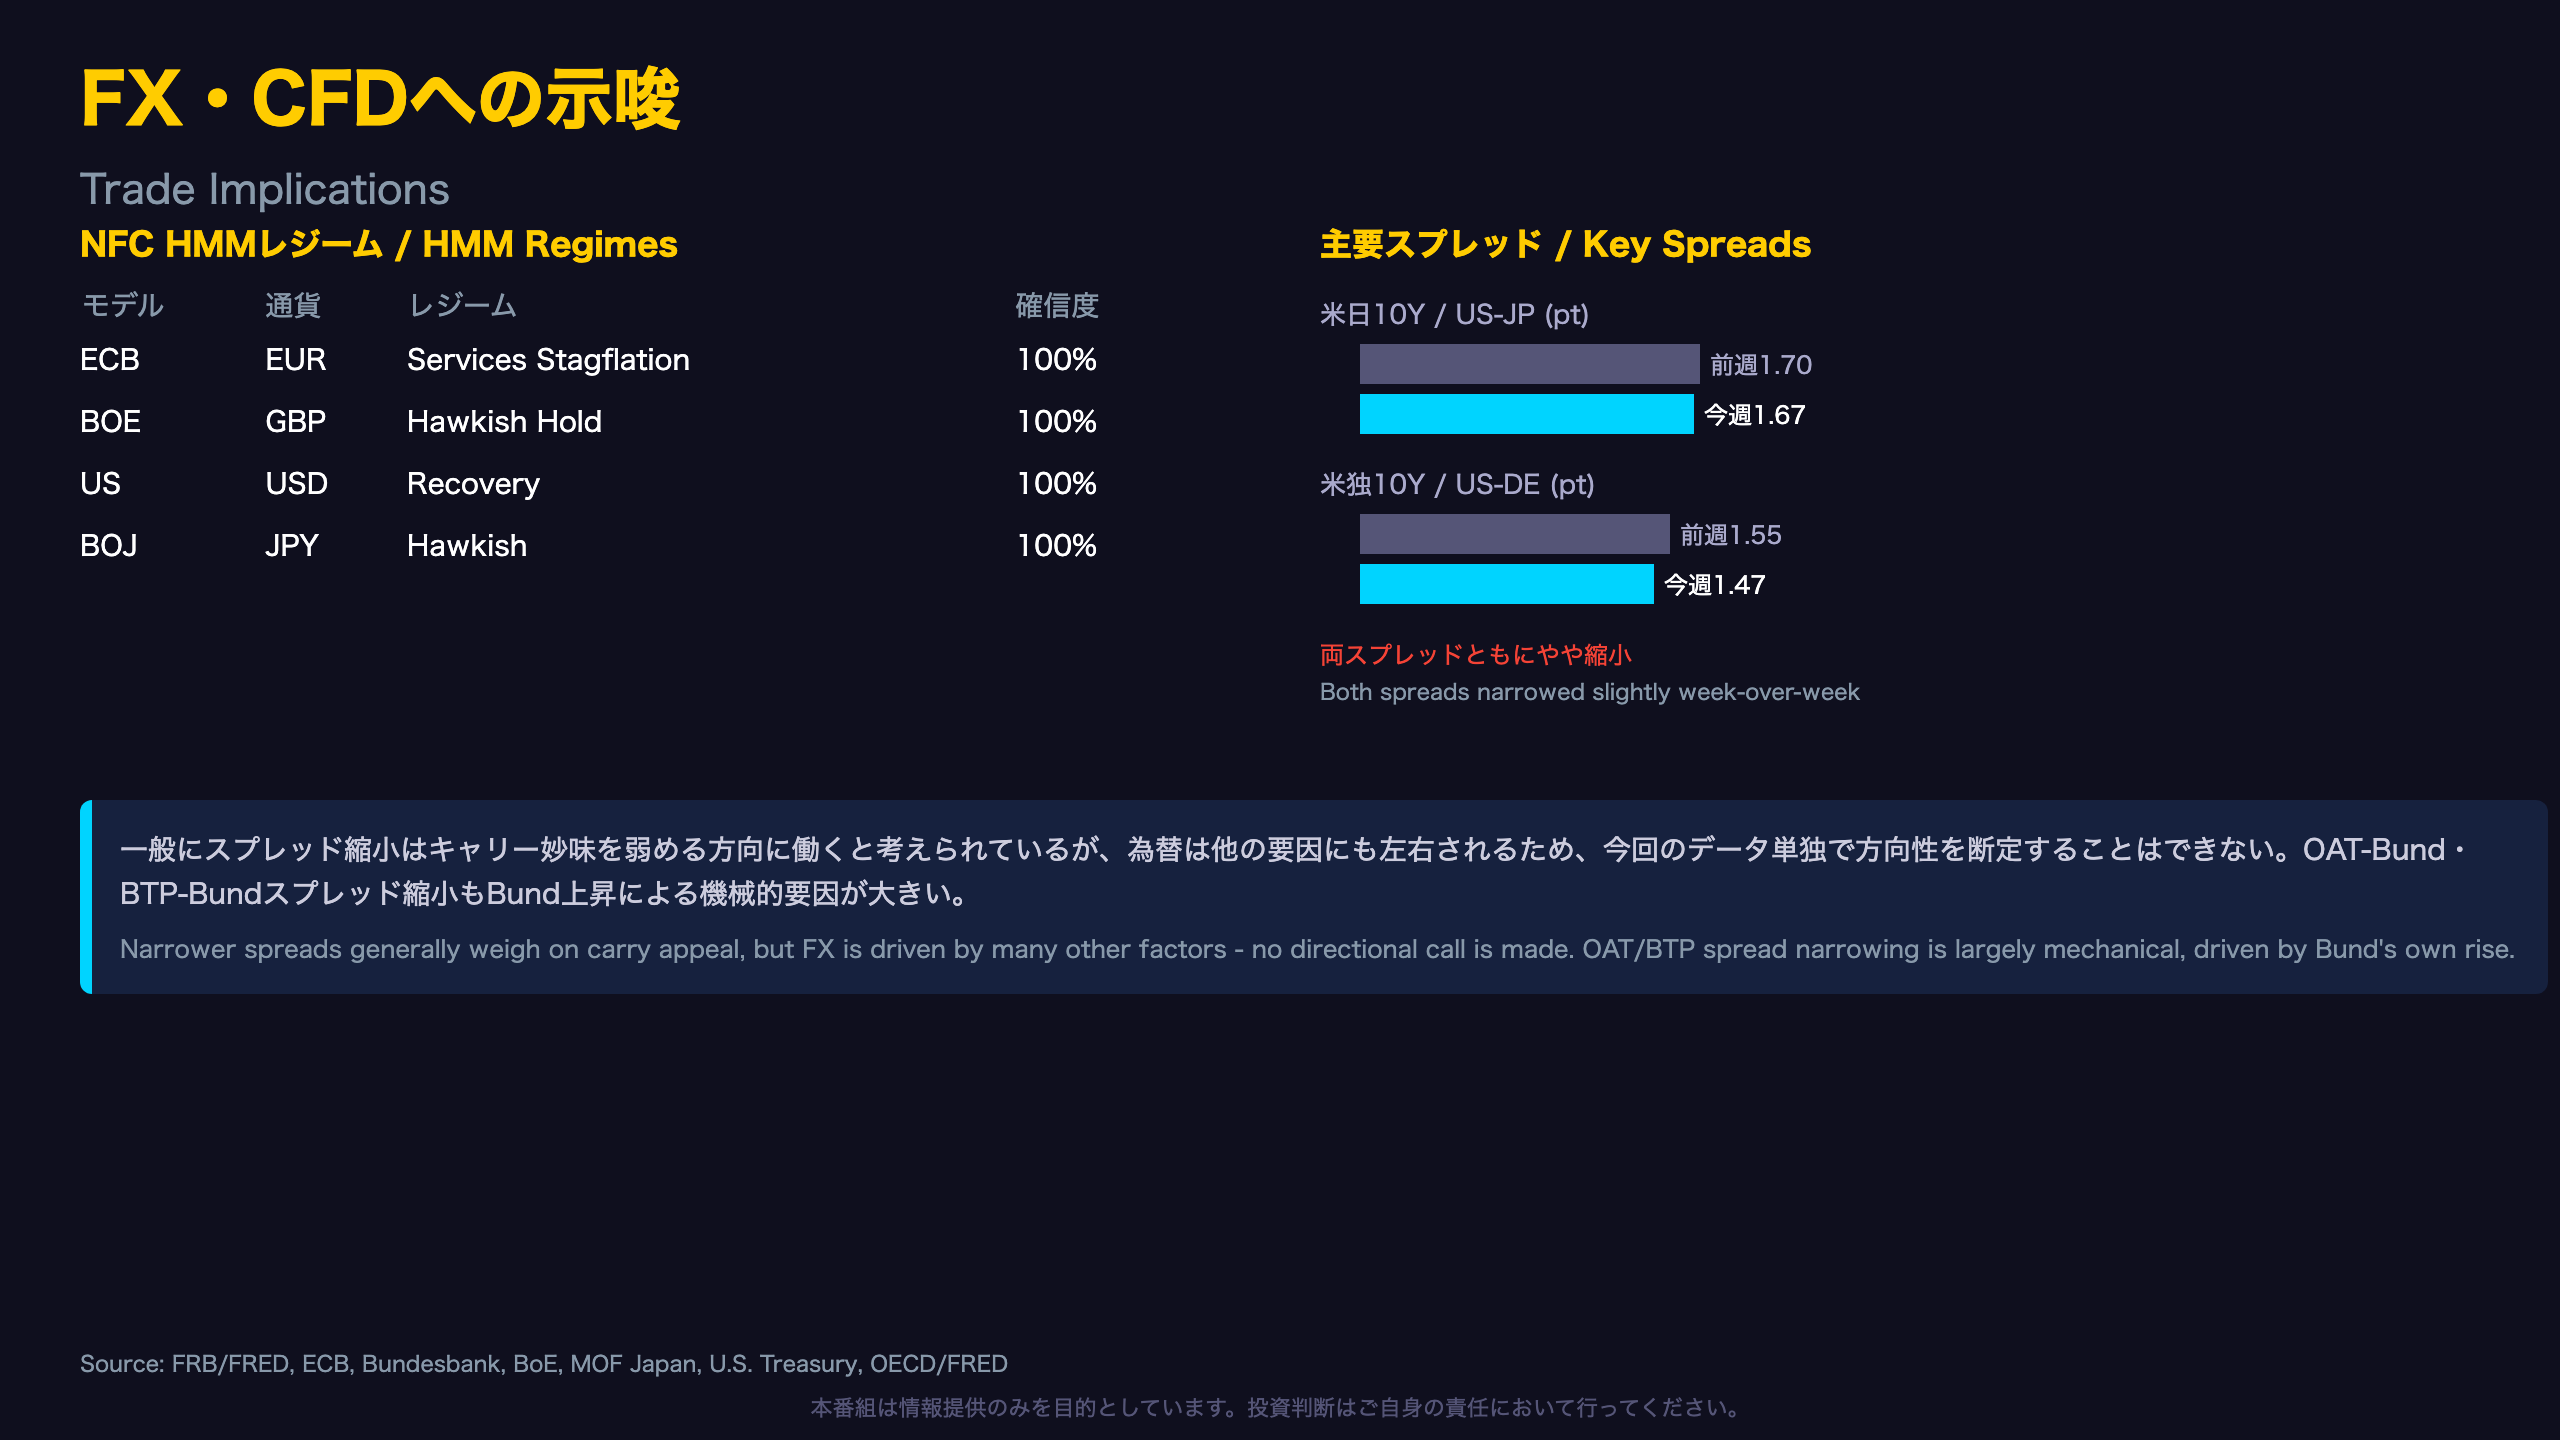
We also connect this week’s moves to NFC’s HMM regime signals (ECB: Services Stagflation, BOE: Hawkish Hold, US: Recovery, BOJ: Hawkish).
⚠️ Not investment advice – no directional calls are made.
グローバル金利スナップショット
This Week’s Global Rate Map
Long-term sovereign yields rose broadly this week, but the UK’s move stood out. Gilt 10-year yields jumped +0.21 percentage points, outpacing the US (+0.06pt), Germany (+0.14pt), and Japan (+0.09pt).
Understanding the US Term Spread
The US 10-2 year term spread widened from +0.31pt to +0.38pt week-over-week – a 7 basis point move. Because the 2-year barely moved (-0.01pt) while the 10-year and 30-year rose, this fits the classic pattern of ‘bear steepening,’ where long yields rise faster than short yields. This typically occurs when the market expects the policy rate to stay anchored near-term while pricing in higher term premia or inflation risk further out the curve – though this single week of data cannot confirm which driver dominates.
A Note on Data Freshness
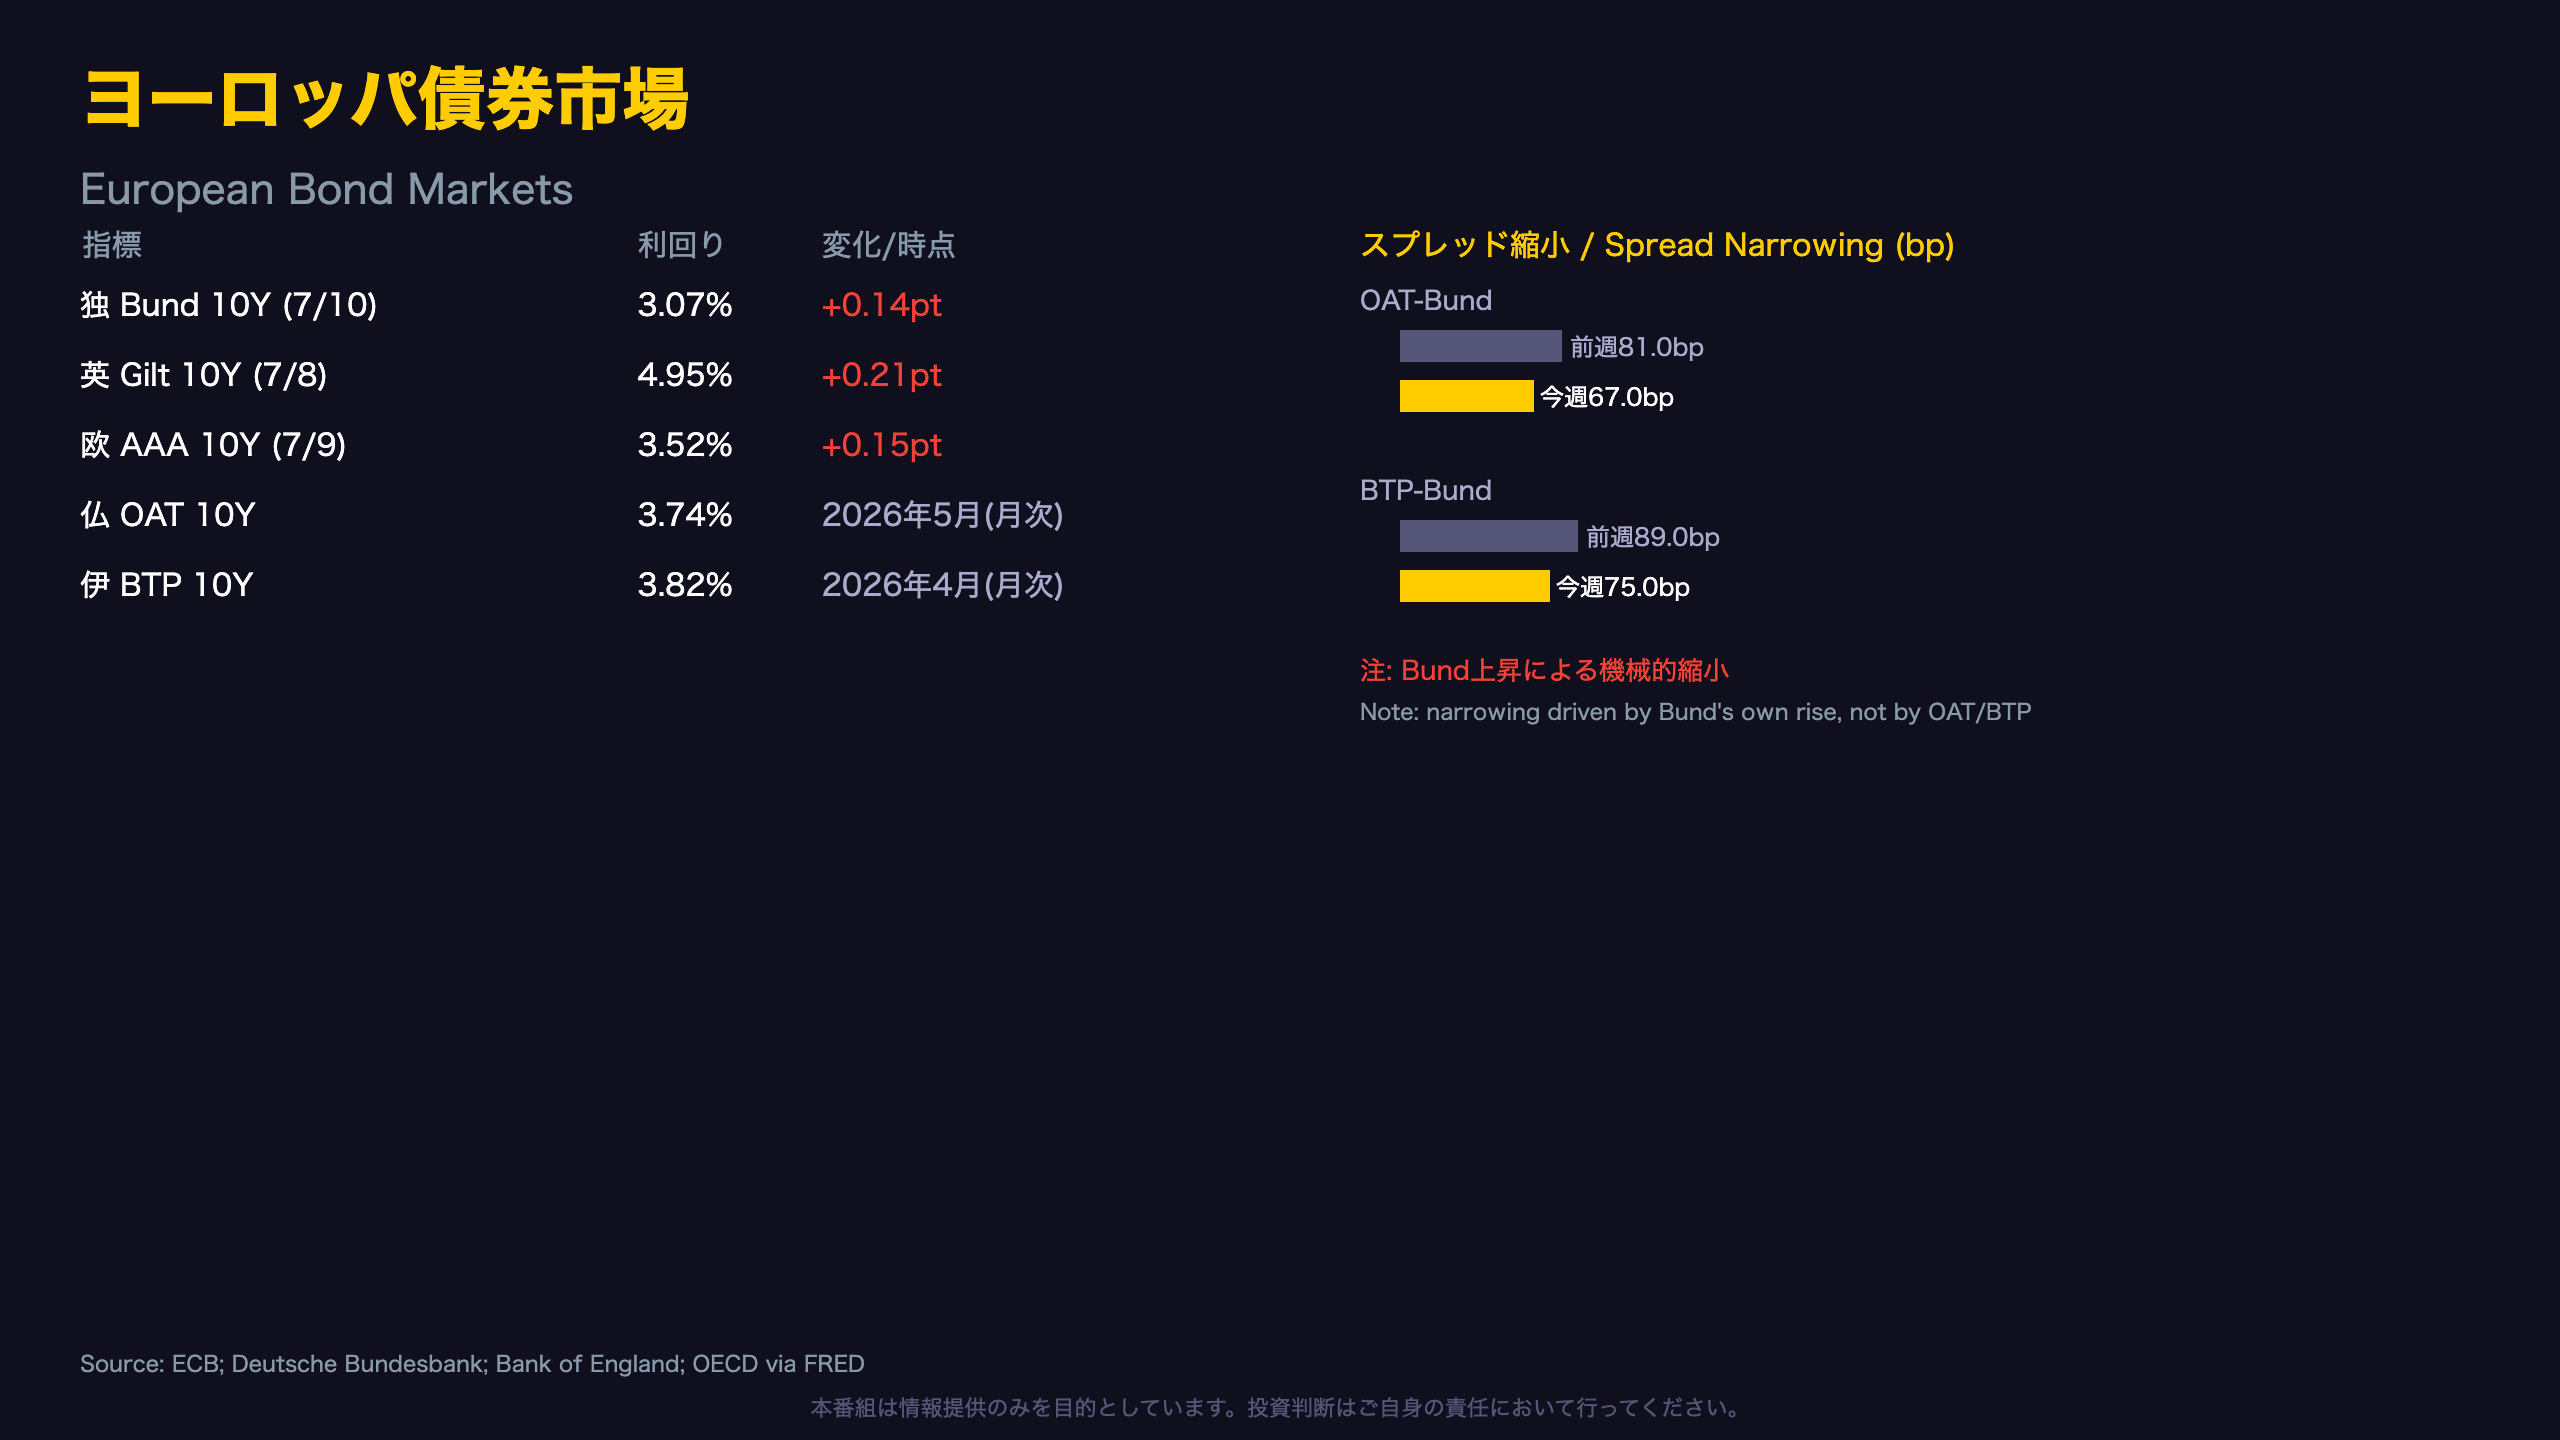
For readers unfamiliar with the mechanics: France’s OAT (3.74%, as of May 2026) and Italy’s BTP (3.82%, as of April 2026) are sourced from OECD monthly series and are therefore stale relative to the daily German Bund and UK Gilt figures used elsewhere in this report. Any spread calculations involving these two series should be read with that lag in mind – see Slide 3 for a detailed breakdown.
What’s Next
Upcoming Fed speaker commentary and ECB meeting minutes could help clarify whether this week’s long-end yield rise reflects a durable repricing of growth/inflation expectations or a shorter-term technical move.
米国債入札 Deep Dive
Reading US Treasury Auction Demand
Key Auction Results
| Tenor | Date | Bid-to-Cover | Stop-out Yield | Indirect % |
|---|---|---|---|---|
| 30Y | Jul 9 | 2.44 | 5.058% | 70.3% |
| 10Y | Jul 8 | 2.59 | 4.580% | 73.7% |
| 3Y | Jul 7 | 2.60 | 4.179% | 60.9% |
| 52W Bill | Jul 7 | 3.14 | 4.032% | 55.9% |
| 4W Bill | Jul 9 | 2.64 | 3.691% | 49.2% |
Context for International Readers
Indirect bidders in US Treasury auctions represent buyers placing bids through primary dealers, most notably foreign central banks and sovereign wealth funds via the New York Fed’s custody accounts. A reading in the 70% range – as seen in both this week’s 10-year (73.7%) and 30-year (70.3%) auctions – is generally read as a signal of solid overseas appetite, even as headline stop-out yields moved higher.
A Caveat on Comparability
Unlike the prior week’s report, which covered 7-year, 5-year, and 2-year notes rather than 10-year and 30-year, this week’s dataset does not provide a direct prior-week benchmark for the 10Y/30Y bid-to-cover ratios. As such, we cannot claim demand ‘improved’ – only that current readings sit at healthy absolute levels.
Looking Ahead
The next 3-year, 10-year, and 30-year auction cycle is expected in early August, and will be closely watched for continued signs of resilient demand amid ongoing US fiscal deficit concerns.
欧州債券市場
European Bonds: The Mechanics Behind a Narrower Spread
Breaking Down the Math
The OAT-Bund spread is simply French OAT yield minus German Bund yield. This week, OAT held at 3.74% (unchanged since May) while Bund rose to 3.07% (+0.14pt), producing a spread of 3.74-3.07 = 0.67pt (67.0bp), down from 3.74-2.93 = 0.81pt (81.0bp) the prior week.
‘OAT-Bund spread: +67.0bps’ (vs +81.0bps prior week)
The BTP-Bund spread narrowed similarly – from 89.0bp to 75.0bp – purely because Bund yields rose while Italy’s BTP (unchanged at 3.82% since April) stayed flat.
For Readers New to Eurozone Spreads
The OAT-Bund and BTP-Bund spreads are widely watched proxies for French and Italian sovereign risk relative to Germany’s benchmark, similar to how US high-yield spreads over Treasuries gauge credit risk. A narrowing spread is often read as improving risk sentiment – but that interpretation only holds when both legs of the spread are updated with fresh data.
Two Ways to Read This
One view: rising Bund yields reflect a broader normalization of real rates across the Eurozone, a constructive signal. The other view, more cautious: since France’s and Italy’s own yields are frozen at last month’s levels, this week’s ‘spread narrowing’ tells us nothing about whether French or Italian political and fiscal risks have actually eased. If June/July OAT and BTP prints – due in early August – also show yields rising in step with Germany, the spread could snap back to its prior width.
What to Watch Next
The next OECD update for France (June data) and Italy (May data) is expected in early August. Until then, spread figures involving these two markets should be treated as a partial snapshot rather than a real-time risk gauge.
日本国債・日銀政策金利
Strong Demand Amid Broad JGB Yield Increases
Auction Detail Comparison
| Tenor | Date | Bid-to-Cover | Avg Yield | Stop Yield | Tail |
|---|---|---|---|---|---|
| 5Y | Jul 9 | 3.43 | 2.020% | 2.026% | 0.006pt |
| 30Y | Jul 7 | 4.55 | 3.993% | 3.996% | 0.003pt |
| 10Y | Jul 2 | 3.13 | 2.729% | 2.755% | 0.026pt |
| 2Y | Jun 30 | 4.82 | 1.407% | 1.410% | 0.003pt |
Context: What Is a JGB Auction ‘Tail’?
For readers unfamiliar with Japan’s Ministry of Finance (MOF) auction process, the ‘tail’ – the gap between the average accepted yield and the highest accepted (stop-out) yield – is a standard gauge of demand dispersion. A narrow tail signals bidders clustered tightly around a similar price; a wide tail suggests uncertainty or weaker demand at the margin.
The 30-Year Auction Stood Out
July 7’s 30-year JGB auction drew a bid-to-cover ratio of 4.55 with a razor-thin 0.003 point tail. Compare that to the prior 30-year auction on June 10, which drew only 2.94 cover and a much wider 0.028 point tail. That’s roughly a 55% jump in cover ratio and a tail nearly one-ninth as wide. One month’s improvement cannot confirm a durable shift in demand, but it may partly reflect Japanese life insurers stepping in to buy at higher yield levels – a pattern sometimes seen after yield backups.
Implications for BOJ Policy Watchers
The JGB 10-2 year term spread widened to +1.43 points from +1.38 the prior week. A gradually steepening term spread is often read as broadly consistent with market expectations for continued gradual BOJ normalization – though a single week of data cannot be used to forecast the BOJ’s next policy move.
What’s Next
The BOJ policy rate figure, sourced from OECD’s monthly series, is next expected to update in August with the June reading.
FX・CFDへの示唆
Connecting HMM Regimes to This Week’s Rate Map
Current Regime Readings
| Model | Currency | Regime | Confidence |
|---|---|---|---|
| ECB | EUR | Services Stagflation | 100% |
| BOE | GBP | Hawkish Hold | 100% |
| US | USD | Recovery | 100% |
| BOJ | JPY | Hawkish | 100% |
What Is NFC’s HMM Regime System?
For readers unfamiliar with this framework: NFC’s Hidden Markov Model (HMM) classifies each central bank’s policy stance into a small number of latent ‘regimes’ based on incoming macro and market data, each reported with a confidence level. This week, all four models show 100% confidence in their current regime assignment.
Regime-Data Consistency Check
The BOE’s ‘Hawkish Hold’ regime lines up directionally with this week’s standout move: UK 10-year Gilt yields rising 0.21 percentage points, the largest increase among major markets covered. It is generally believed that expectations of a prolonged high policy rate tend to push long-end yields higher, but this single week of data cannot be used to forecast the BOE’s next policy decision.
For the ECB’s ‘Services Stagflation’ regime, the rise in Bund yields (+0.14pt) could reflect a broader normalization of Eurozone real rates – but because France’s OAT and Italy’s BTP data remain frozen at last month’s levels, this report’s data cannot verify whether individual French or Italian risk dynamics are consistent with the ECB regime call.
Carry Trade Mechanics, in Plain English
The US-Japan 10-year spread (+1.67pt) and US-Germany 10-year spread (+1.47pt) are commonly referenced as rough proxies for carry-trade return potential – the idea being that a wider yield gap generally supports higher-yielding currencies via carry flows. Both spreads narrowed slightly this week. It is generally believed that a narrowing yield differential tends to reduce carry appeal for the higher-yielding currency, but FX rates are also driven by risk appetite, capital flows, and central bank intervention, so this data alone cannot support a directional currency call.
Risk-On or Risk-Off?
Nothing in this week’s data points to a clear flight-to-quality signal. Rising long-term yields can reflect either reassessed growth/inflation expectations (constructive) or fiscal sustainability concerns (cautionary) – and a single week of data is not sufficient to determine which force is dominant.
Disclaimer: This article is for informational purposes only. All investment decisions are made solely at your own risk.