📺 Watch the Full Video Analysis
This article was automatically generated by the NFC Market Live AI analysis system. (Updated: 2026-07-06 07:11 JST)
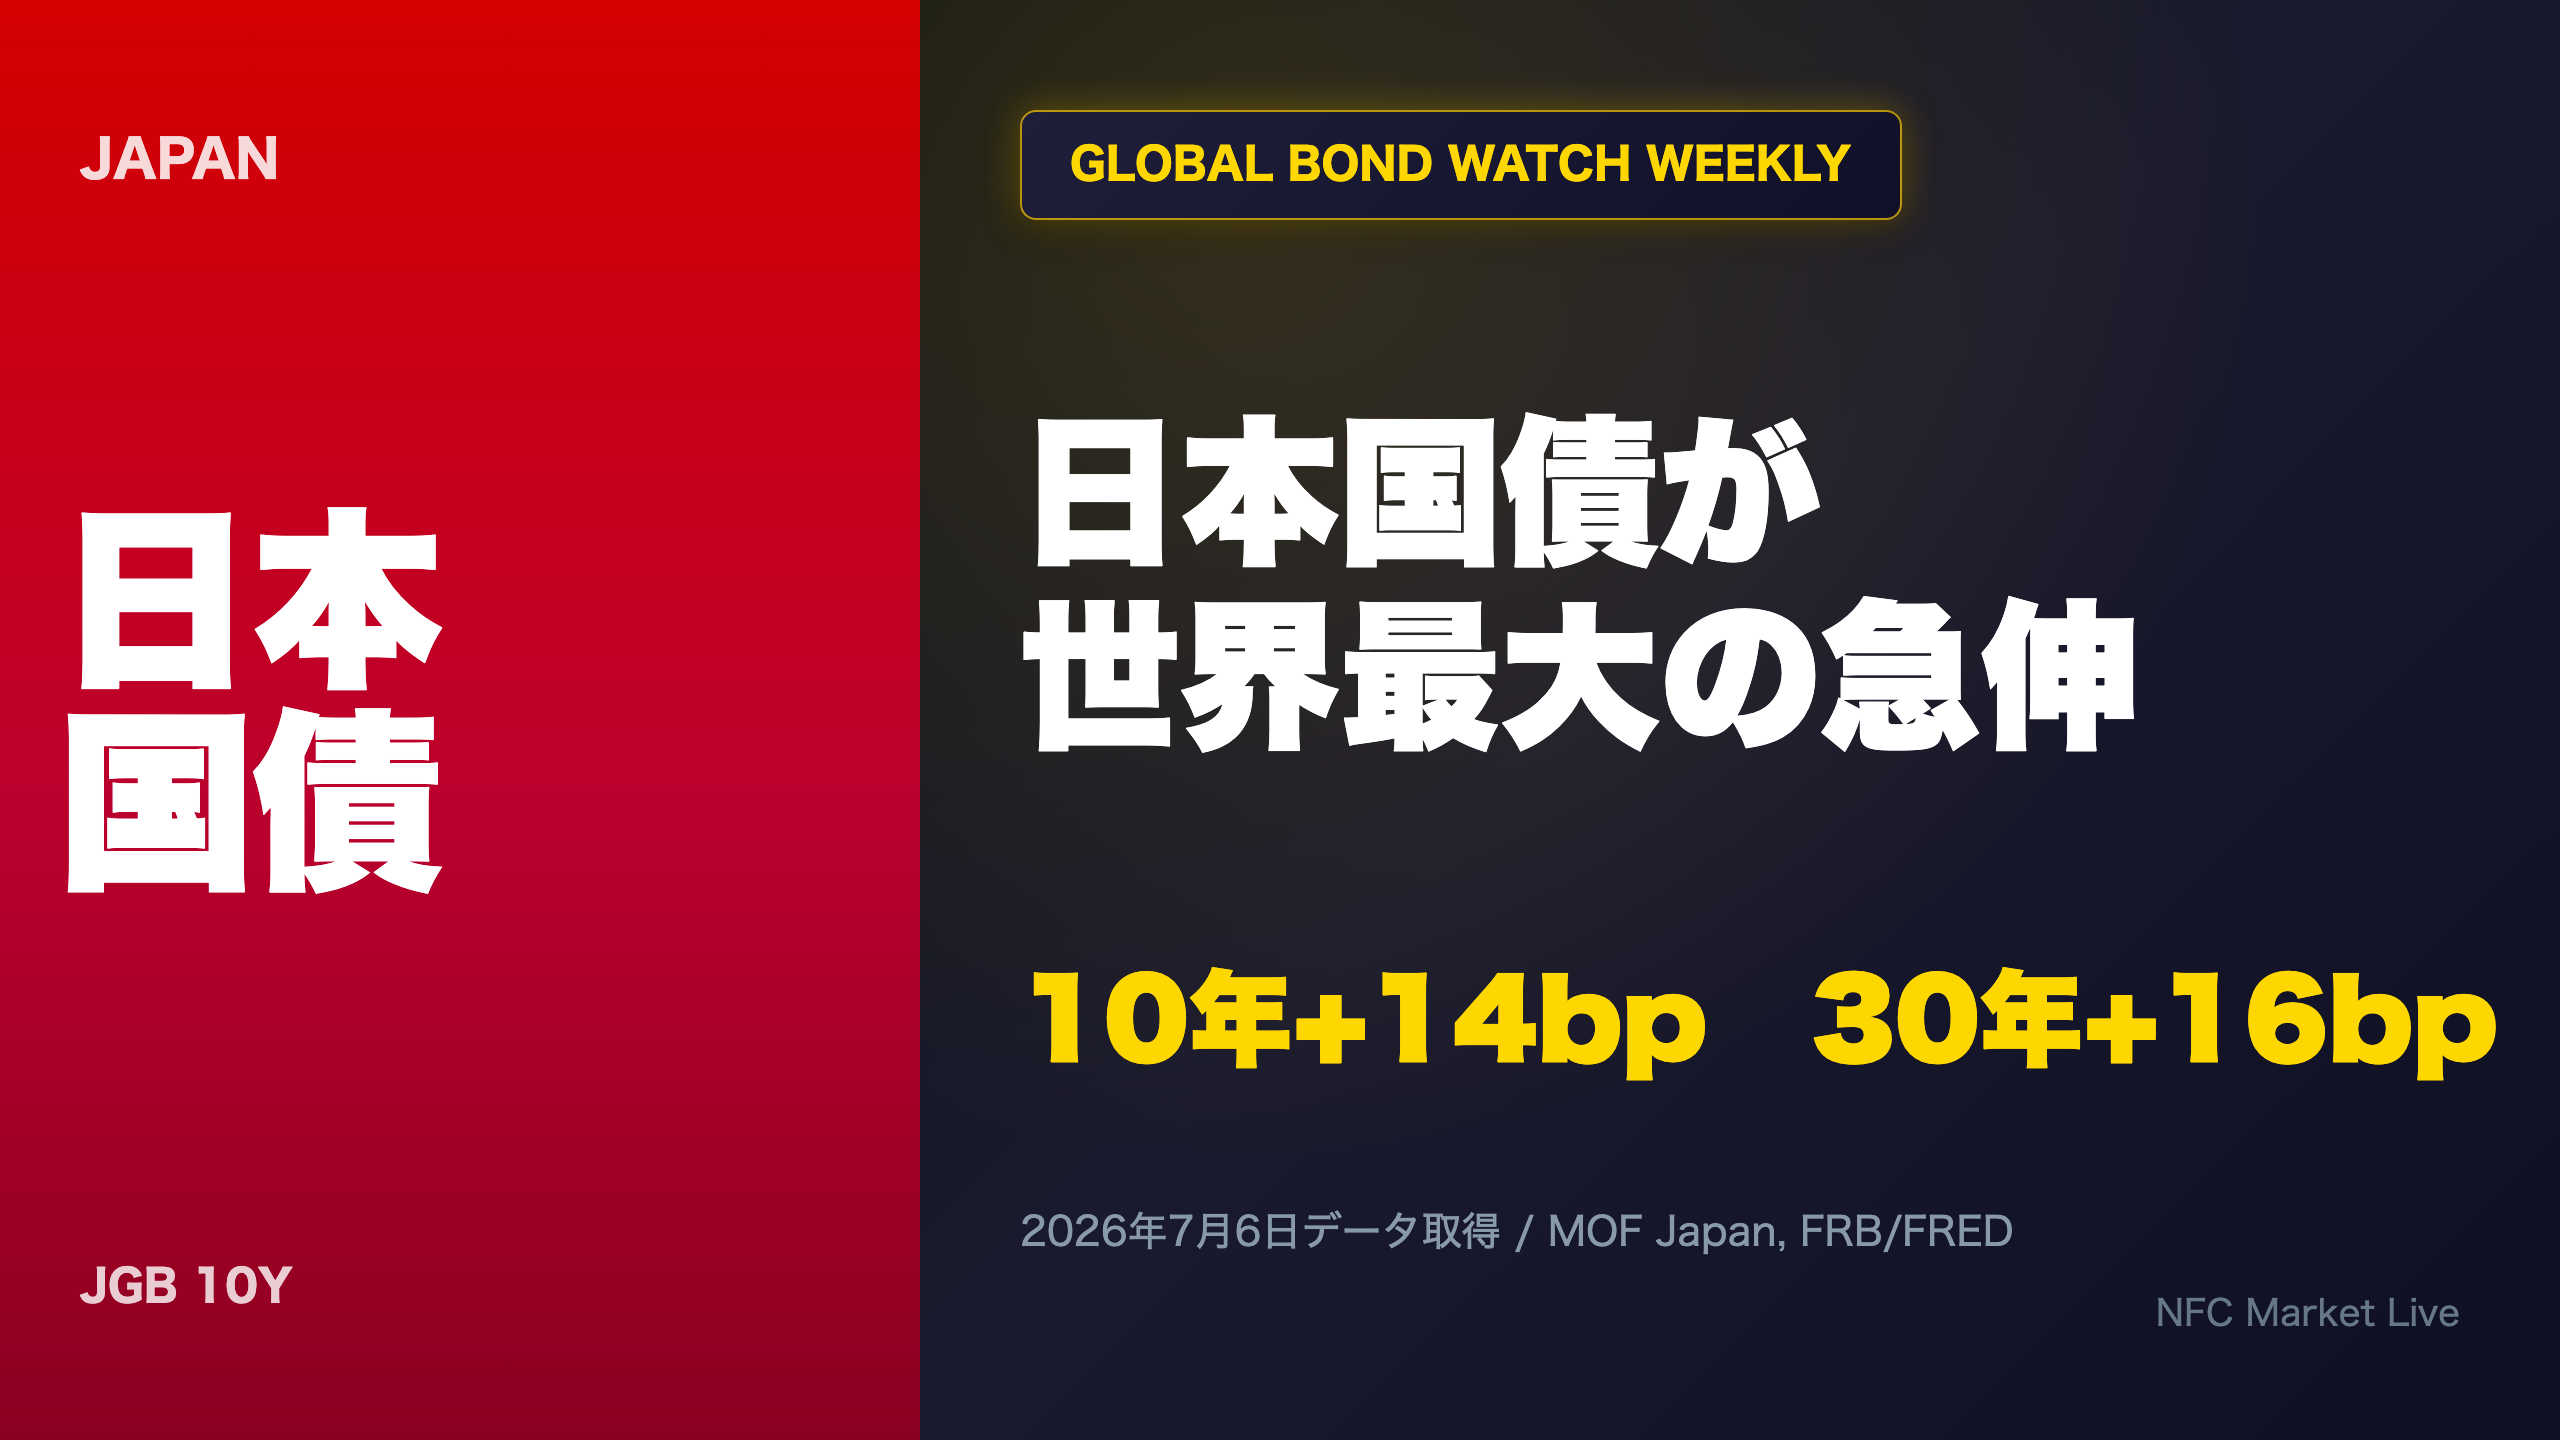
A deep dive into global bond market data as of July 6, 2026. While 10-year yields rose across the US, Germany, UK, and Japan, Japan’s JGB posted the largest weekly move among G7 peers—10Y +14bp, 30Y +16bp. We break down JGB auction data showing a front-end-strong, long-end-soft demand pattern, shifting indirect bidder participation in US Treasury auctions, narrowing European periphery spreads, and NFC’s proprietary HMM regime analysis for FX implications.
グローバル金利スナップショット / Global Rate Snapshot
Global Yields Rise in Unison — But Japan Leads
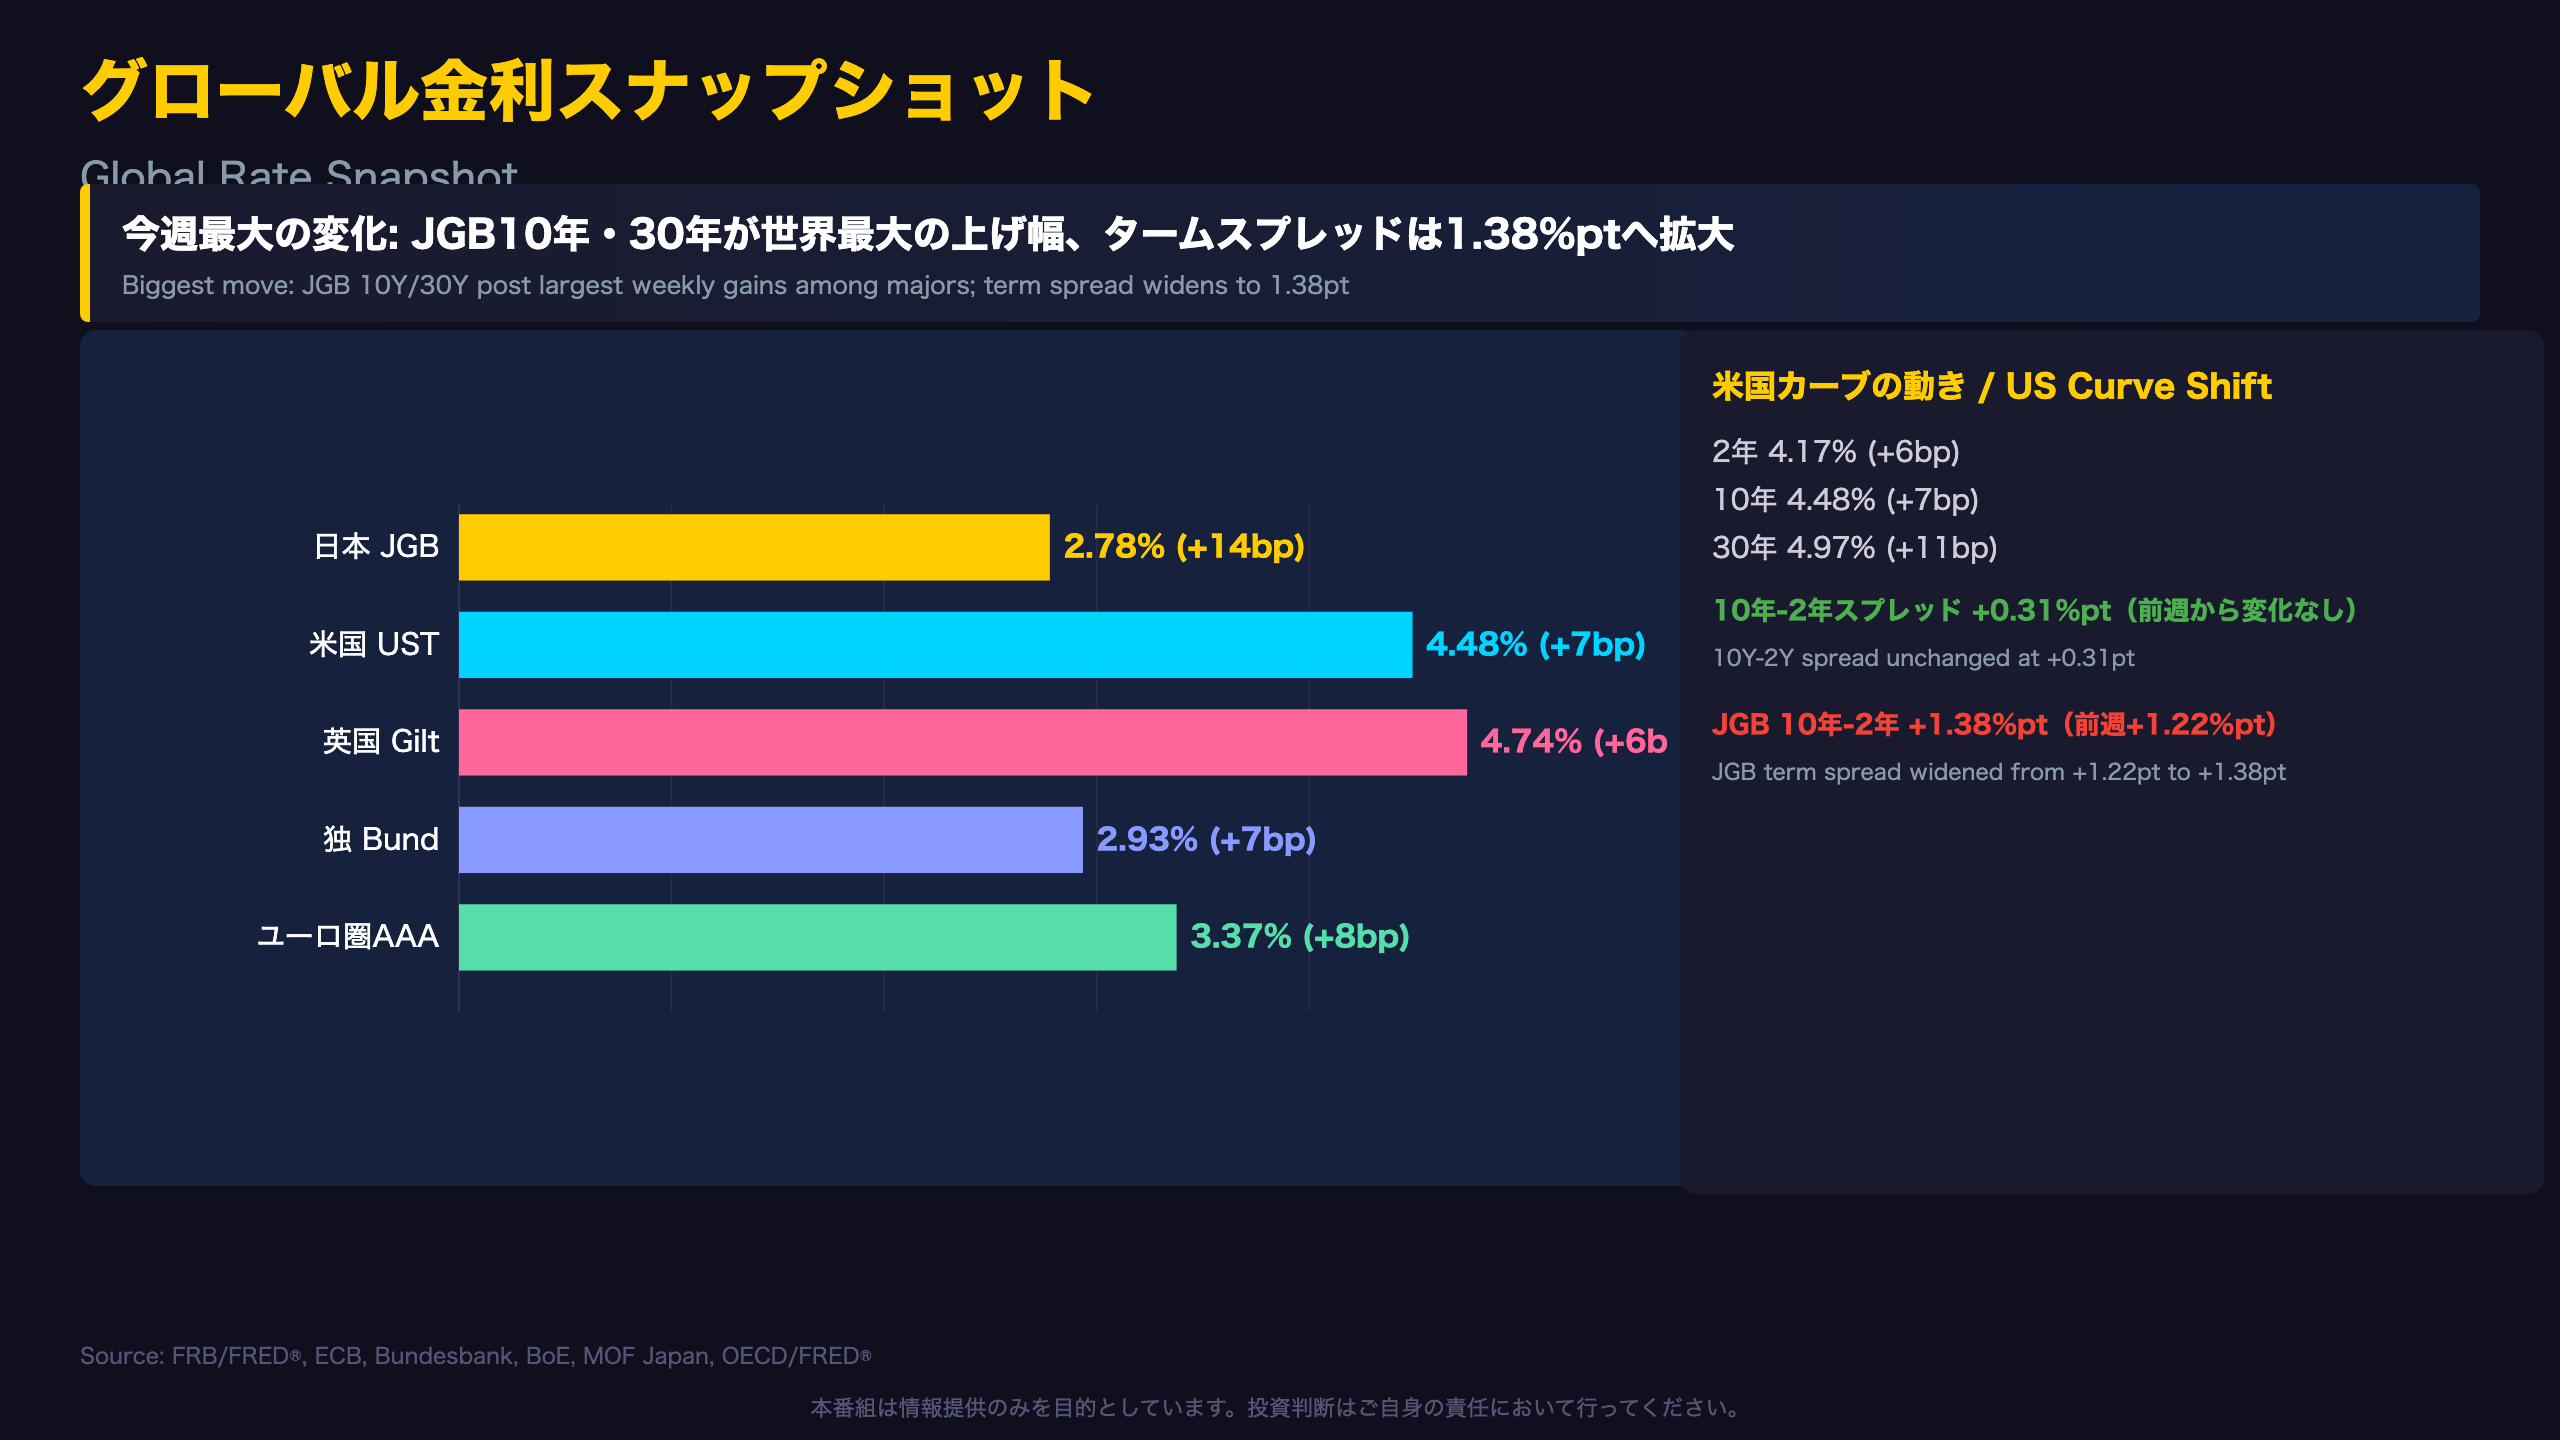
Comparing the two available snapshots in this report (late June vs. July 1-3, 2026), 10-year yields rose across every major market tracked — but not by equal amounts.
| Market | This Week | Prior Week | Change |
|---|---|---|---|
| US Treasury | 4.48% | 4.40% | +7bp |
| German Bund | 2.93% | 2.85% | +7bp |
| UK Gilt | 4.74% | 4.67% | +6bp |
| Eurozone AAA | 3.37% | 3.29% | +8bp |
| Japan (JGB) | 2.78% | 2.64% | +14bp |
For readers unfamiliar with Japan’s market: the JGB 10-year yield is set largely through Ministry of Finance auction supply/demand against the backdrop of BOJ policy. Unlike the Fed or ECB, the BOJ only recently exited decades of near-zero rates, so JGB moves carry outsized signal value for BOJ normalization expectations.
This week JGB’s move dwarfed peers — 14bp on the 10-year, 16bp on the 30-year, versus 6-8bp for the US, Germany and UK. Notably, Japan’s 2-year yield actually declined slightly (1.42% to 1.40%), meaning the entire move was concentrated at the long end. That pushed Japan’s 10Y-2Y term spread from +1.22 to +1.38 percentage points, a steepening that dwarfs the US equivalent, which held flat at +0.31pt.
Why this matters: a steepening JGB curve concentrated at the long end typically reflects rising term premium or market pricing of further BOJ normalization — this report’s data alone cannot separate the two, but auction data in a later section offers clues.
Separately, France’s OAT and Italy’s BTP are month-old data points (May/April 2026) and cannot be compared week-over-week, a limitation worth remembering when reading periphery-core spreads.
米国債入札 Deep Dive / US Treasury Auction Deep Dive
Reading Treasury Auctions: Bid-to-Cover and Indirect Bidders
For readers new to auction mechanics: the Bid-to-Cover (BTC) ratio measures total bids divided by the amount offered — above 2.5x is generally solid demand. The indirect bidder share captures participation by foreign central banks and sovereign entities, the closest available proxy for overseas appetite for US debt.
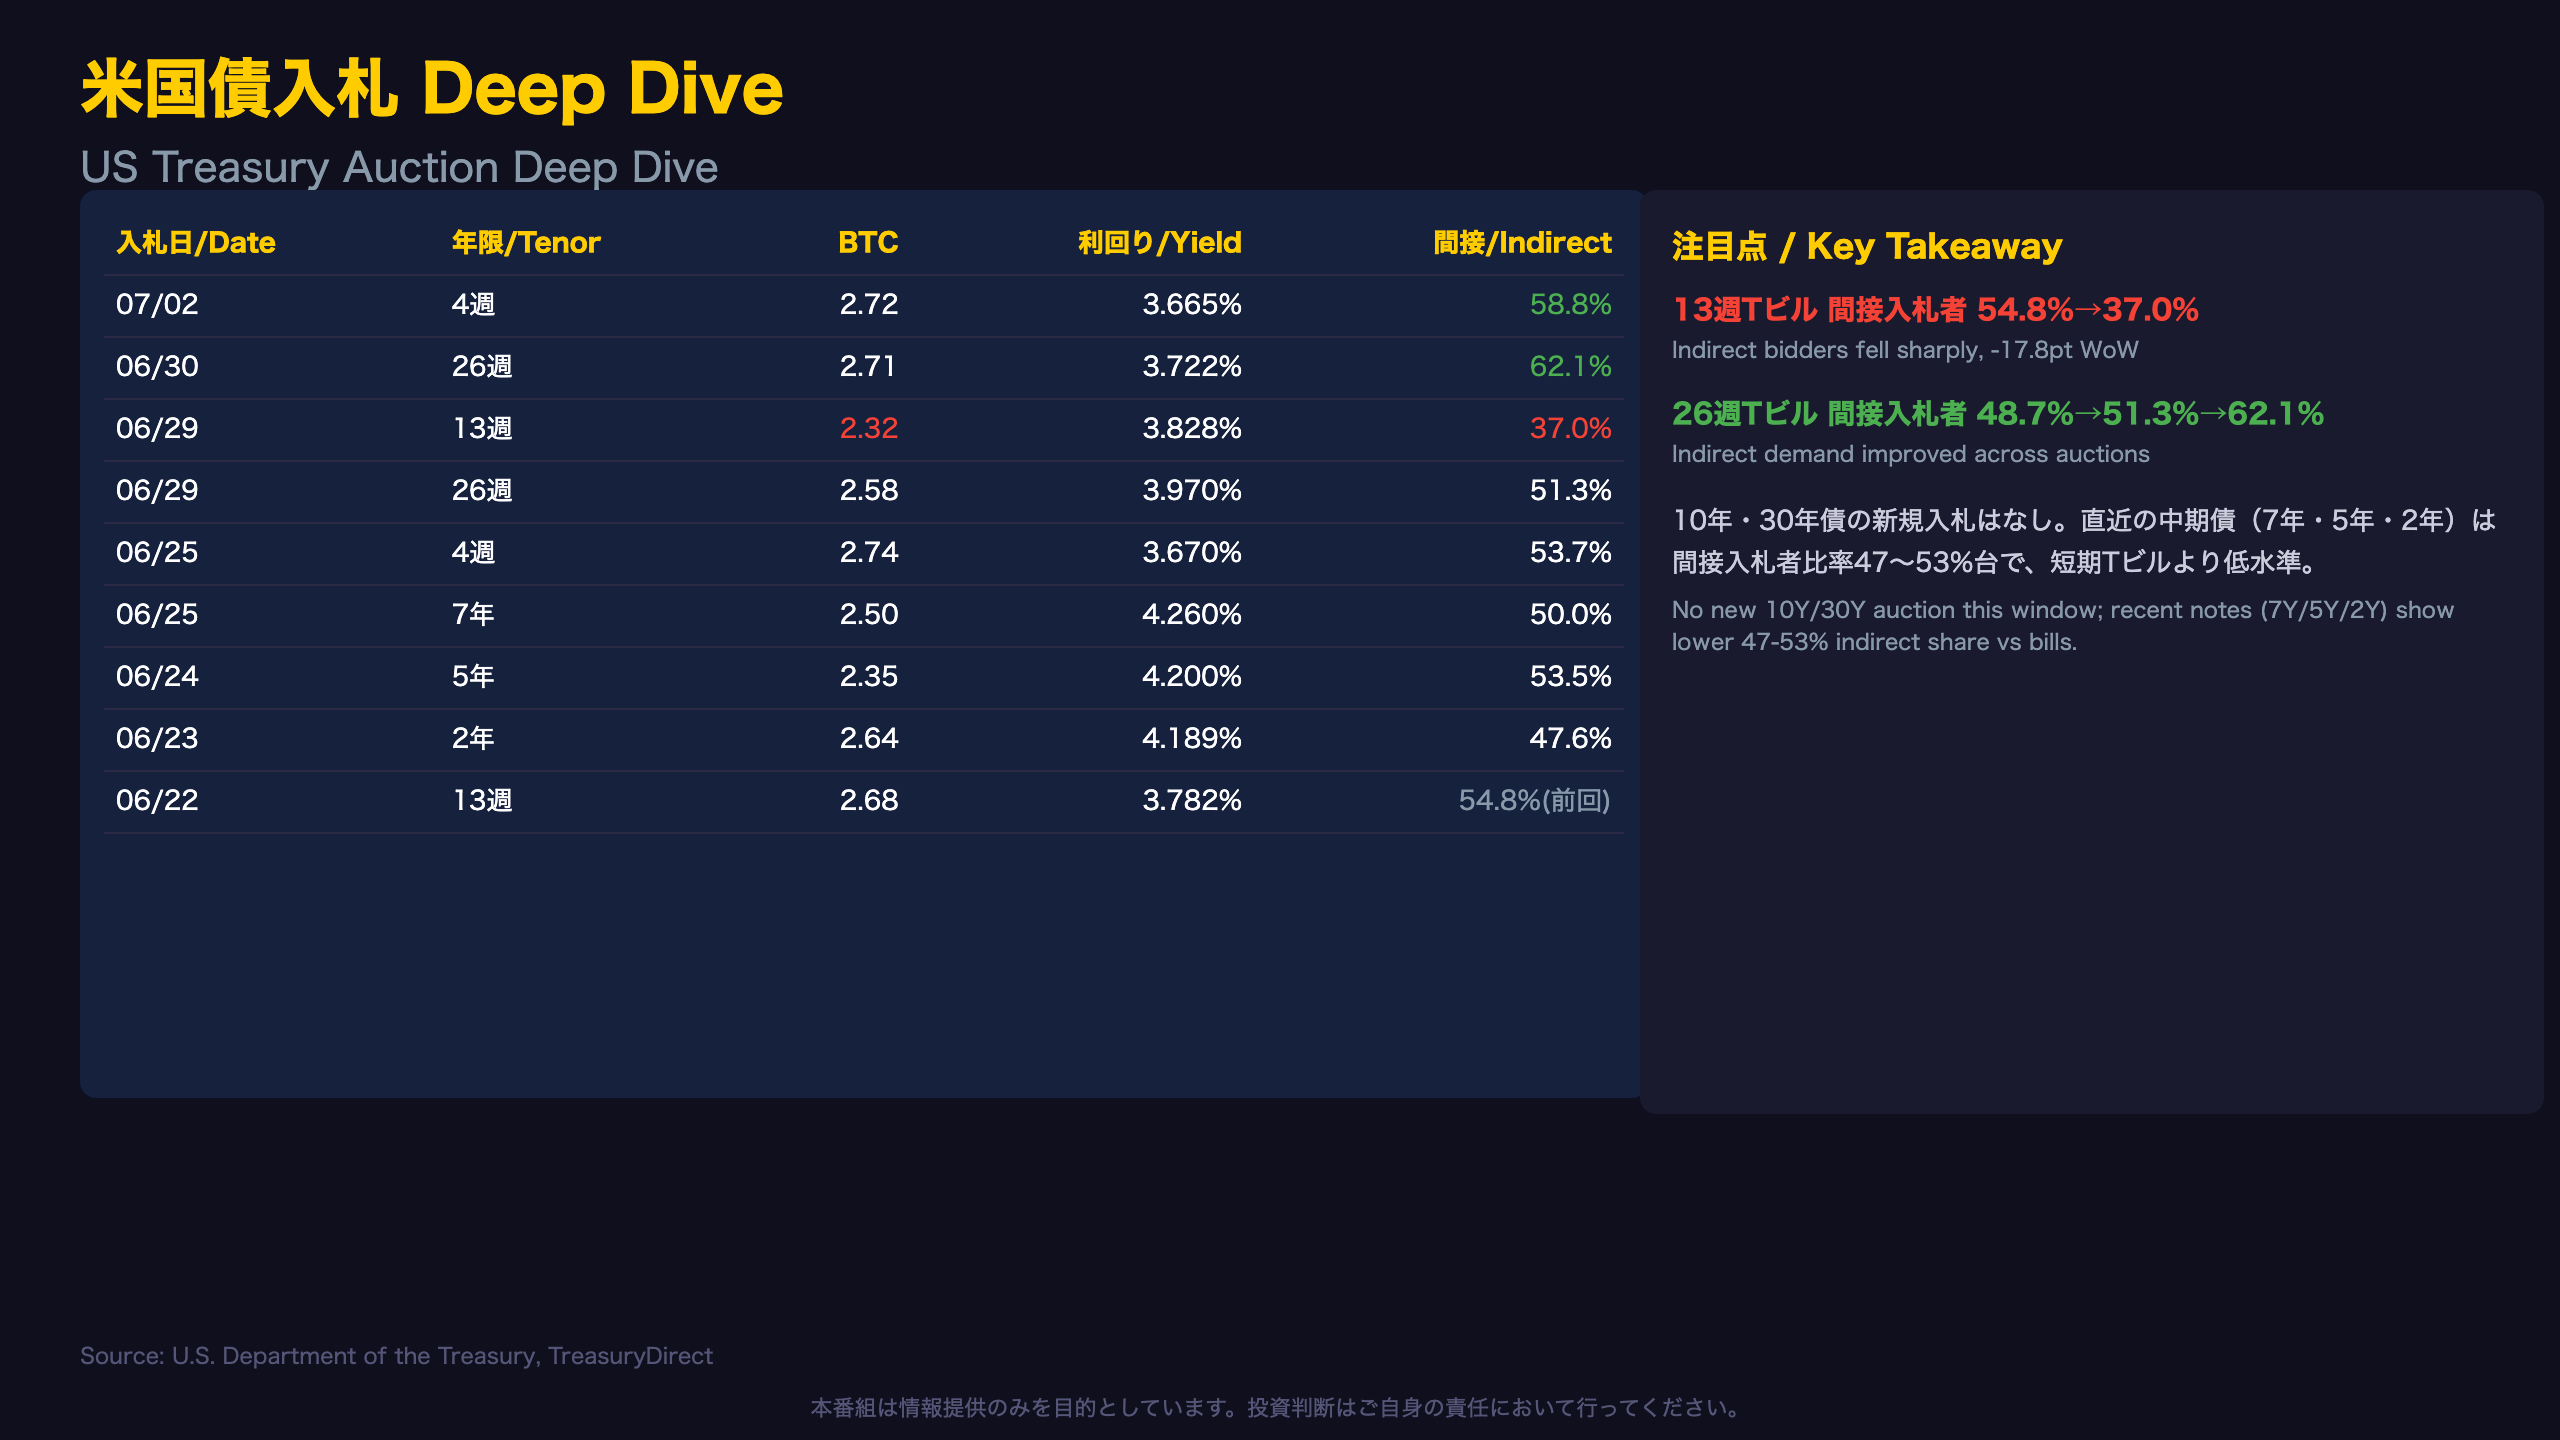
The standout signal: the 13-week bill auctioned June 29 saw indirect participation collapse to 37.0%, down 17.8 points from 54.8% a week earlier. The BTC ratio also slipped from 2.68x to 2.32x — both metrics point the same direction, strengthening the read.
But this weakness wasn’t uniform. The 26-week bill saw indirect participation improve, from 48.7% (June 22) to 51.3% (June 29) and 62.1% (June 30). The 4-week bill held at 58.8% (July 2), suggesting the 13-week tenor specifically saw softer demand — not a broad retreat from US paper.
No new 10-year or 30-year auction fell within this window. The most recent coupon auctions were the 7-year note (June 25, BTC 2.50x, indirect 50.0%), 5-year note (June 24, BTC 2.35x, indirect 53.5%), and 2-year note (June 23, BTC 2.64x, indirect 47.6%) — all below the 58-62% indirect share seen in short bills.
Context for global readers: indirect bidder share is often cited in debates over whether foreign central banks (historically led by Japan and China) are reducing Treasury exposure amid US fiscal deficit concerns. A single week’s data point is insufficient to confirm such a trend, but it’s worth monitoring into the next 10-year and 30-year auctions.
ヨーロッパ債券市場 / European Bond Markets
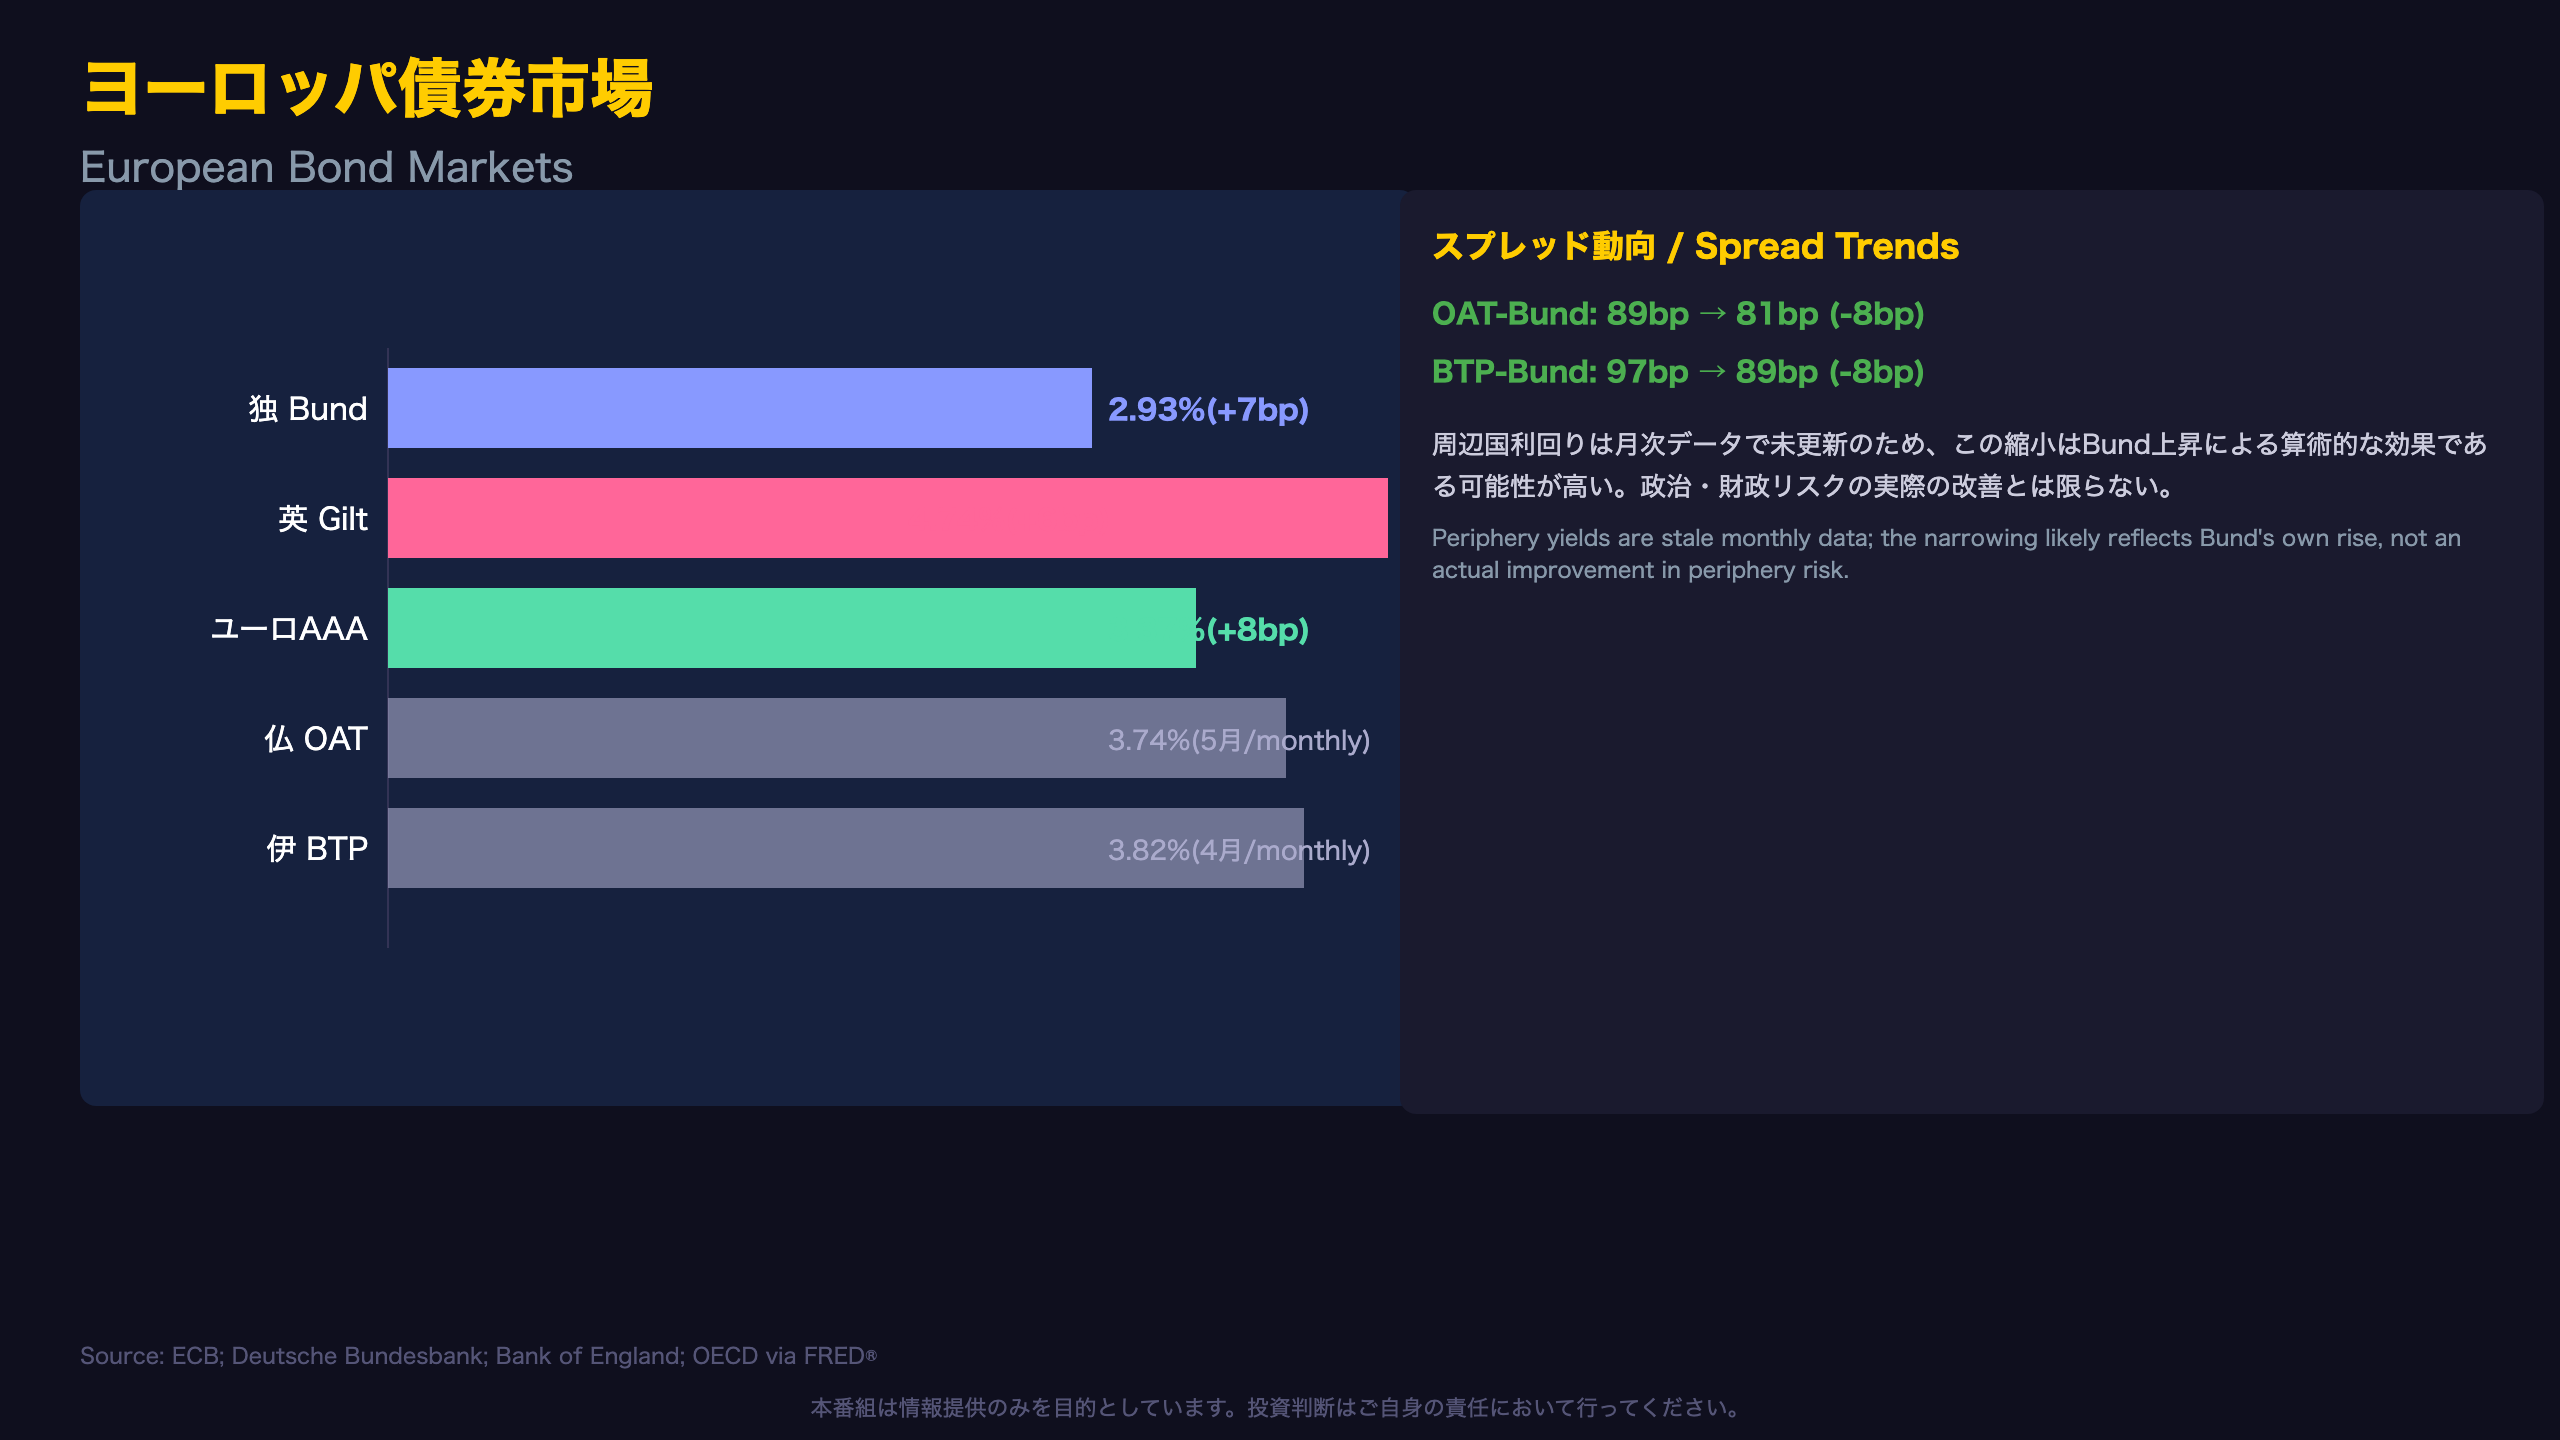
Core Yields Rise While Periphery Spreads Look Deceptively Tighter
Germany’s Bund and the UK’s Gilt — both daily-frequency series — rose in tandem with the US and Japan this week. The ECB’s own Eurozone AAA composite yield reached 3.37% (July 2), up 8bp from 3.29%.
Background: “Bund” refers to German federal bonds, the eurozone’s risk-free benchmark; “Gilt” is the UK equivalent; “OAT” and “BTP” are France’s and Italy’s sovereign bonds, both carrying a yield premium over Bunds reflecting relatively higher perceived fiscal/political risk.
The nuance this week: the OAT-Bund spread narrowed from 89bp to 81bp, and BTP-Bund from 97bp to 89bp. At first glance this reads as improving periphery sentiment — but France’s OAT and Italy’s BTP yields here are month-old snapshots (May and April 2026) that were not updated this cycle. The spread compression is therefore driven almost entirely by Bund’s own +7bp rise, not a re-rating of French or Italian credit risk.
Why this matters: investors tracking eurozone fragmentation risk should treat this week’s spread move as a statistical artifact rather than genuine easing of periphery stress. The next monthly OAT/BTP release will be the real test of whether spreads stay compressed once fresh yield data replaces the stale reference points.
Separately, NFC’s proprietary HMM model currently places the ECB regime in “Services Stagflation” — consistent with rising core (Bund) yields amid persistent services-sector inflation pressure, discussed further in the FX implications section.
日本国債・日銀政策金利 / JGB & BOJ
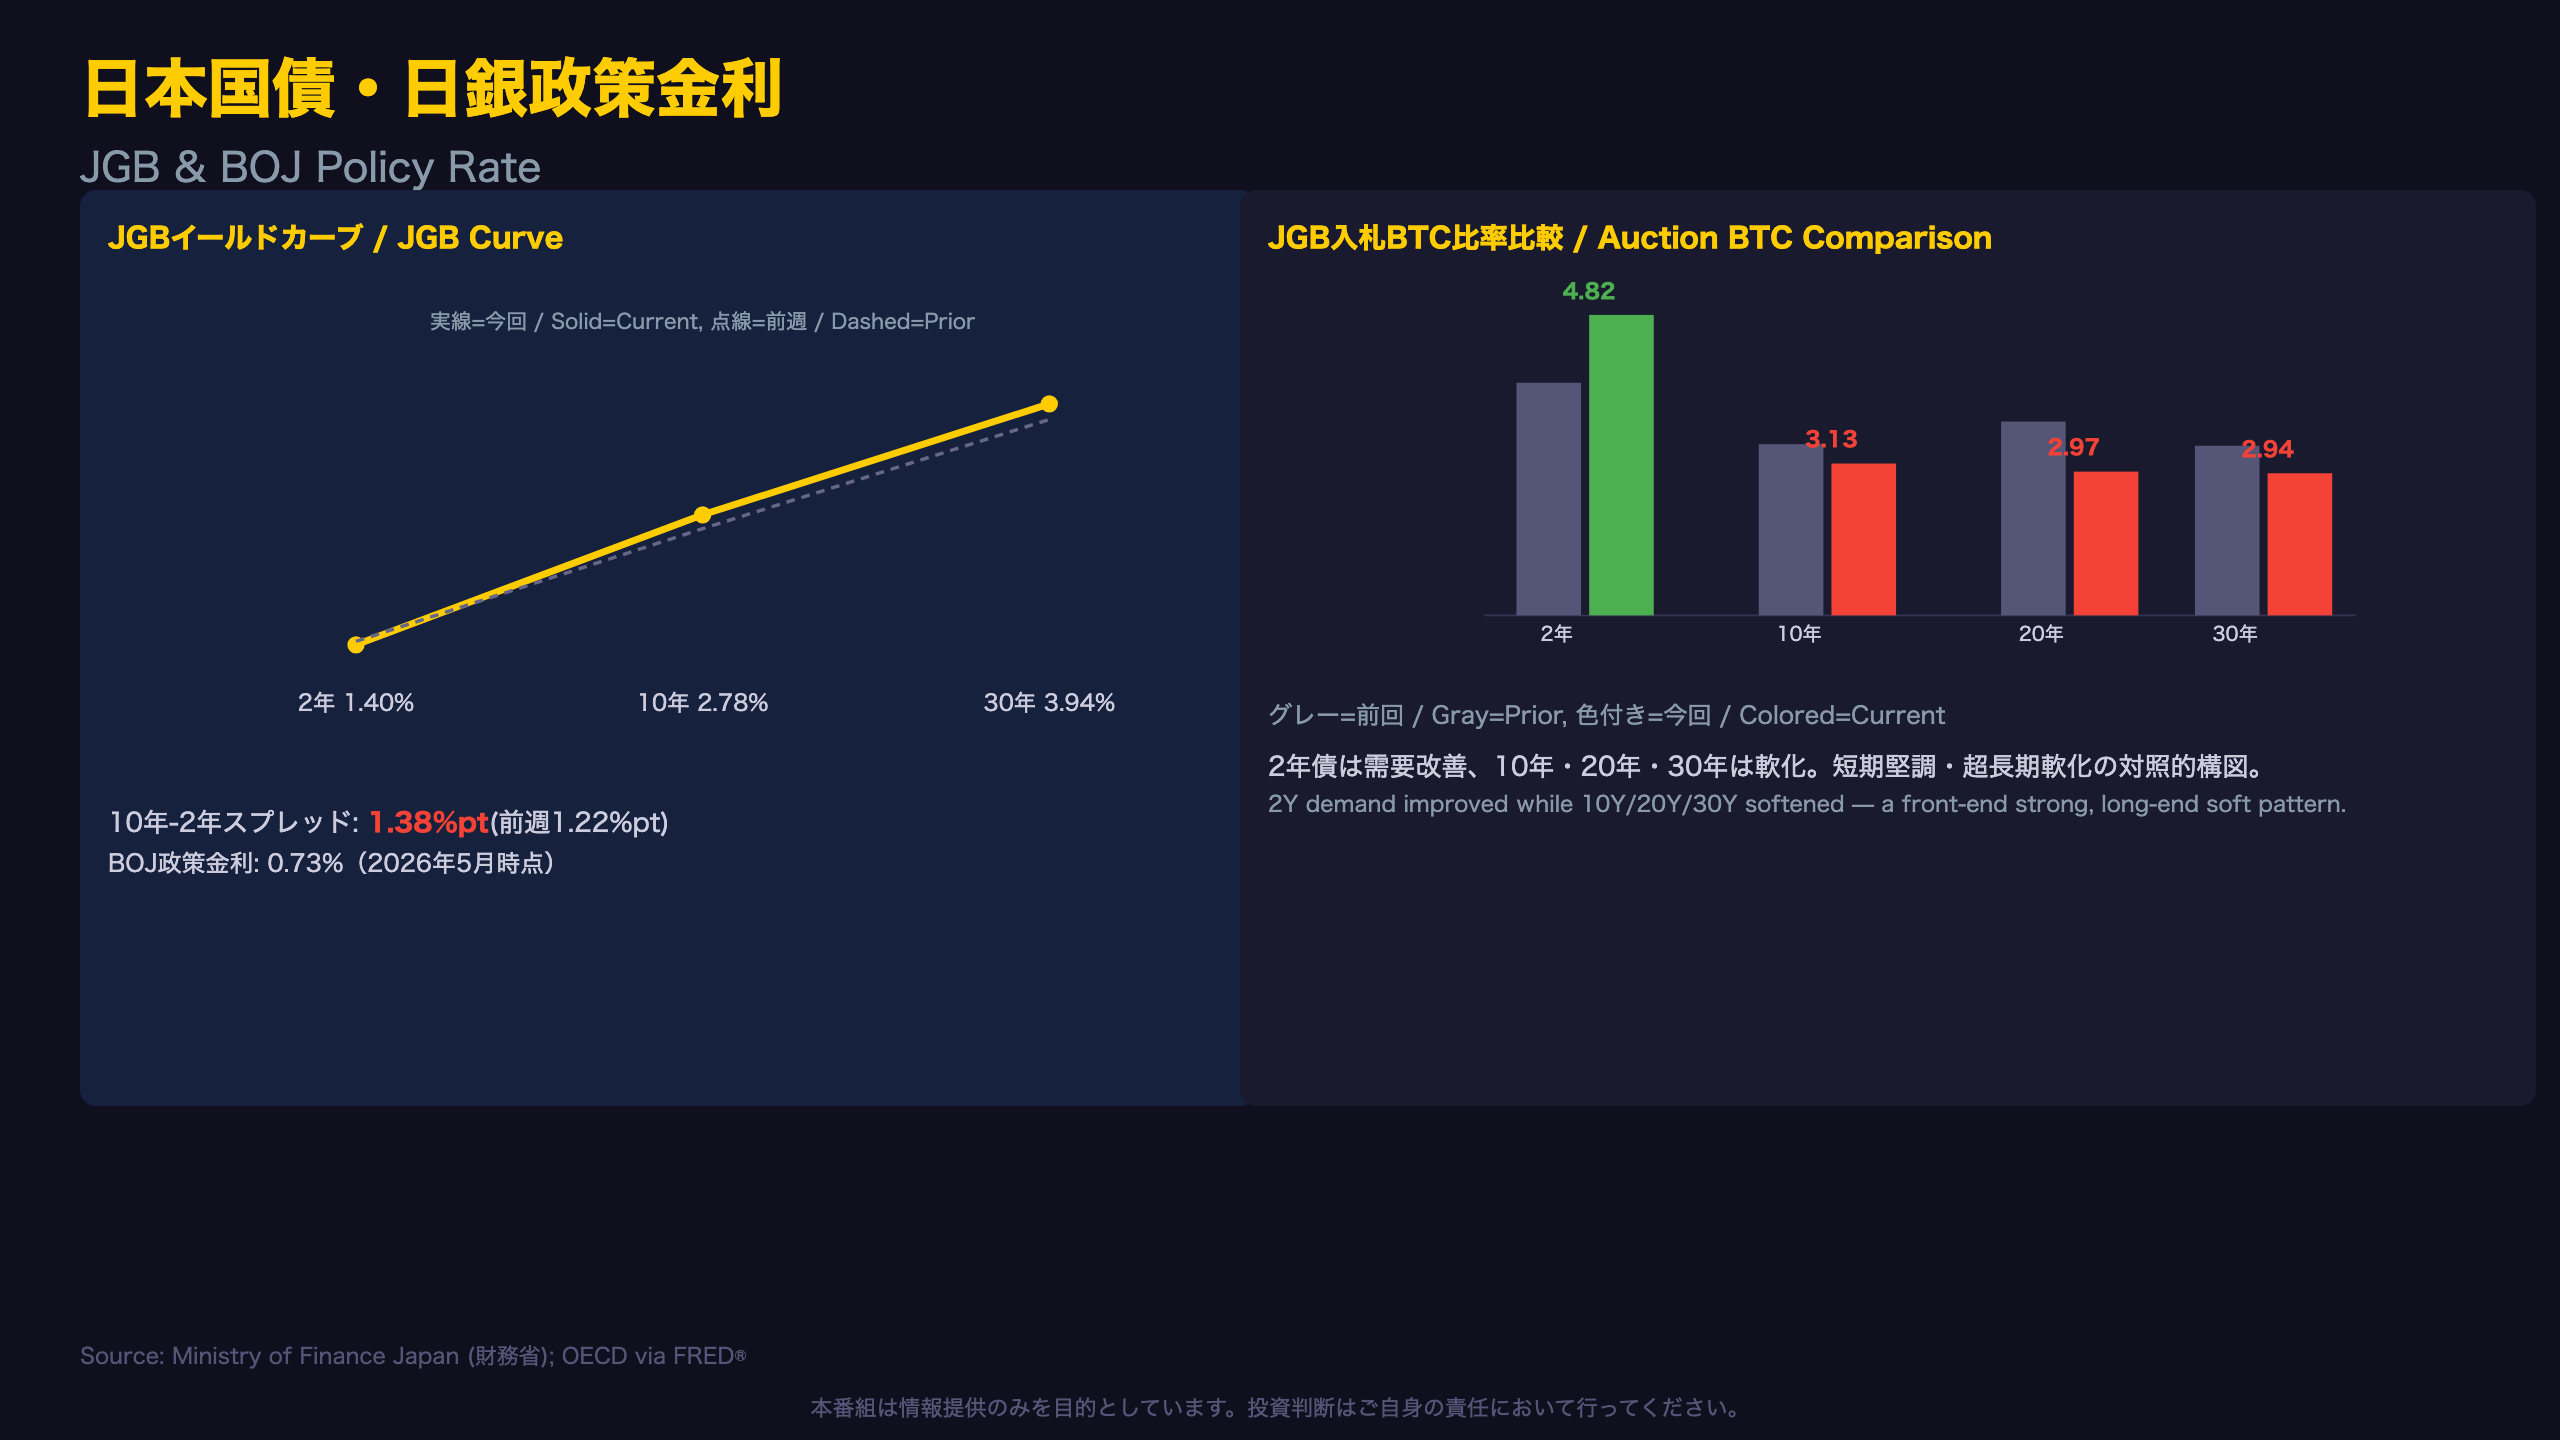
What JGB Auction Data Reveals: Front-End Strength, Long-End Softness
Comparing the most recent JGB auction for each tenor against its prior instance reveals a sharply bifurcated demand picture.
| Tenor | Date | BTC Ratio | Tail |
|---|---|---|---|
| 2-Year | Jun 30 | 4.82x (prior 3.70x) | 0.3bp (prior 1.0bp) |
| 10-Year | Jul 2 | 3.13x (prior 3.53x) | 2.6bp (prior 0.7bp) |
| 20-Year | Jun 25 | 2.97x (prior 4.01x) | 2.2bp (prior 0.4bp) |
| 30-Year | Jun 10 | 2.94x (prior 3.49x) | n/a |
Background: Japan’s Ministry of Finance (MOF) auctions JGBs roughly monthly. The “tail” measures the gap between the highest accepted yield (stop-out) and the average — a widening tail signals dispersion in investor expectations, often read as softening demand.
The 2-year auction stood out: BTC jumped to 4.82x from 3.70x, and the tail compressed to 0.3bp from 1.0bp — pointing to unusually strong, well-anchored short-end demand. Bid volume surged to ¥103.7tn from ¥78.9tn.
The 10-year and 20-year tell the opposite story: the 10-year’s tail widened more than threefold (0.7bp to 2.6bp) while BTC fell to 3.13x from 3.53x; the 20-year showed a similar pattern (BTC 4.01x to 2.97x, tail 0.4bp to 2.2bp).
Why this matters: this timing lines up with this week’s sharp rise in 10-year (+14bp) and 30-year (+16bp) JGB yields. It’s reasonable to view softer long-end auction demand as one contributing factor, though a single auction cycle can’t confirm a structural shift in appetite for Japanese duration — something the BOJ, which only recently exited ultra-easy policy, will watch closely.
FX・CFDへの含意 / Trade Implications
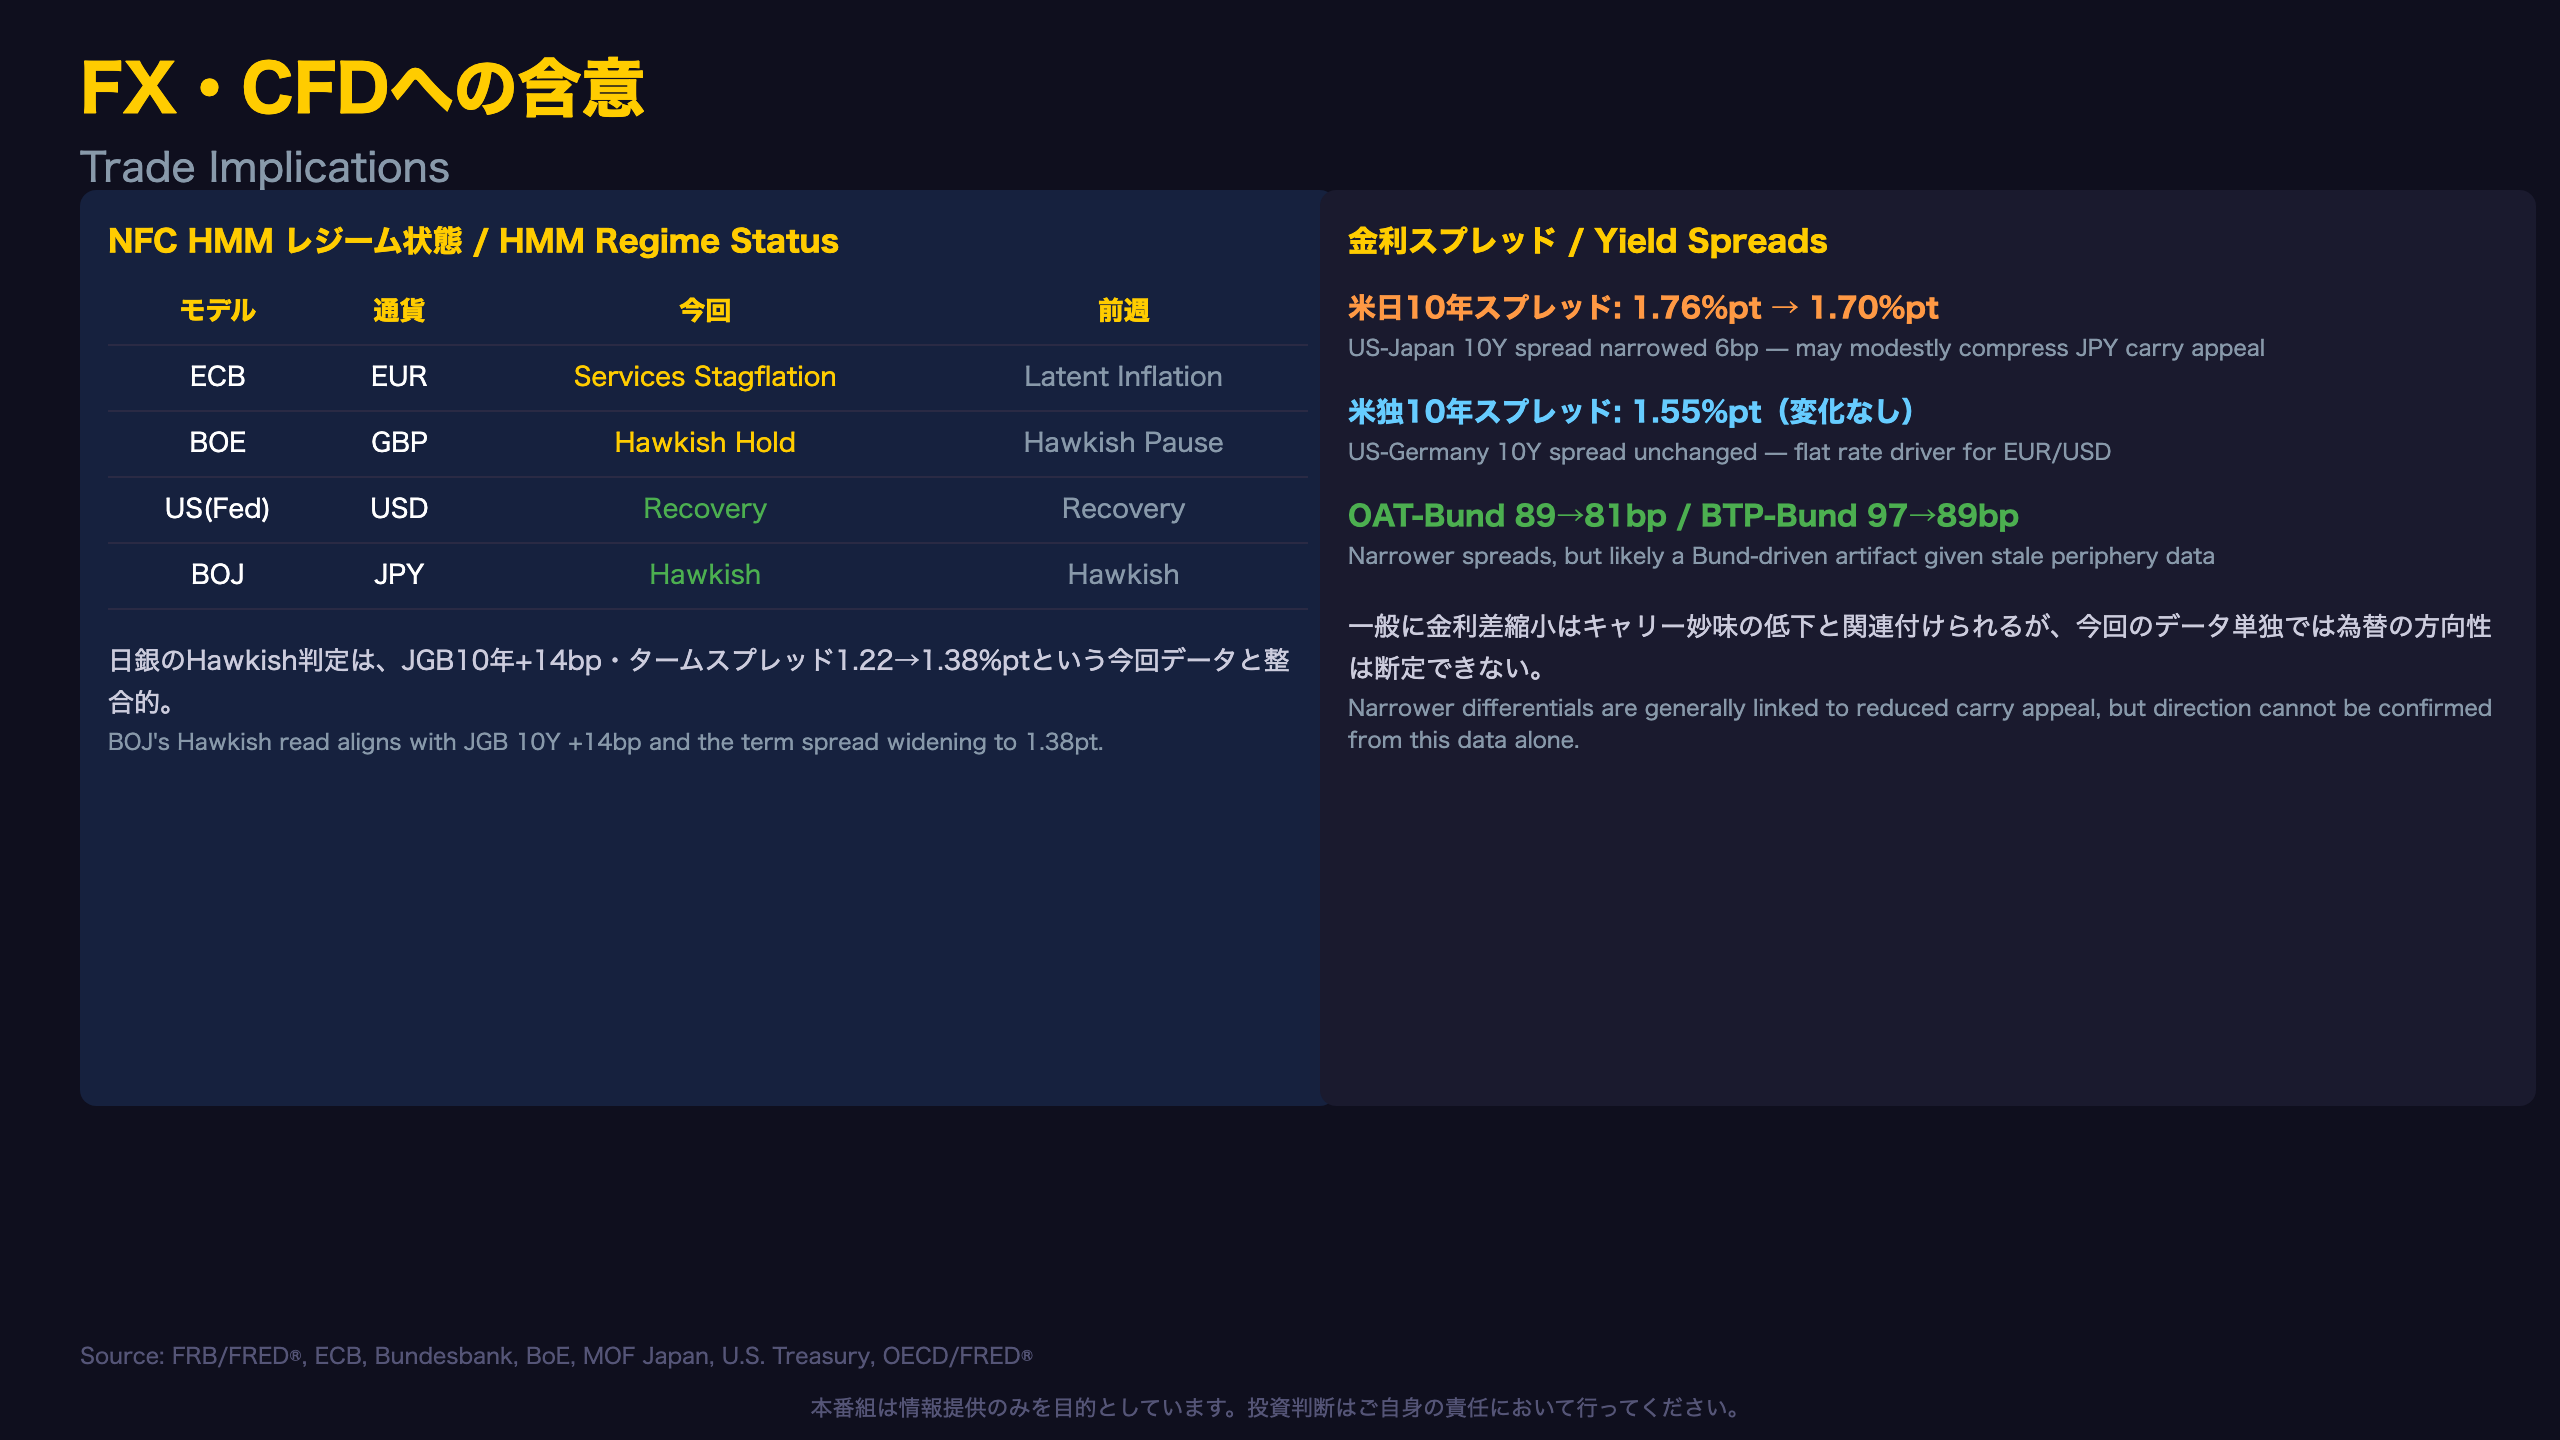
Cross-Checking HMM Regimes Against Rate Data
NFC’s proprietary Hidden Markov Model (HMM) classifies each central bank’s policy stance probabilistically. This week’s readings:
| Model | Currency | Current | Prior |
|---|---|---|---|
| ECB | EUR | Services Stagflation | Latent Inflation |
| BOE | GBP | Hawkish Hold | Hawkish Pause |
| Fed (US) | USD | Recovery | Recovery |
| BOJ | JPY | Hawkish | Hawkish |
The ECB and BOE regime labels shifted this week, while the Fed and BOJ held steady.
BOJ’s “Hawkish” reading aligns with this week’s JGB data: the 10-year yield rose 14bp, the 30-year 16bp, and the term spread widened from 1.22 to 1.38 percentage points. Multiple independent signals — yield levels, curve shape, and the HMM classification — point the same direction, strengthening confidence that markets are pricing continued BOJ policy normalization.
The ECB’s move into “Services Stagflation” is consistent with Bund’s +7bp yield rise. It appears less consistent with the narrowing OAT-Bund/BTP-Bund spreads — but as discussed previously, that narrowing is largely a technical artifact of stale French/Italian data, so it doesn’t necessarily contradict the regime read.
Rate differentials and FX implications:
- US-Japan 10Y spread: 1.76pt to 1.70pt (narrowed 6bp). Mechanism: a narrower gap generally reduces JPY-funded carry appeal. Market implication: commonly associated with reduced carry demand, though this week’s data alone cannot determine USD/JPY’s directional path.
- US-Germany 10Y spread: unchanged at 1.55pt, suggesting the rate-differential driver for EUR/USD was flat this week.
For readers less familiar with carry trade dynamics: investors have historically borrowed in low-yielding JPY to fund higher-yielding USD assets, a trade highly sensitive to shifts in the US-Japan yield gap. This week’s modest narrowing is worth watching but is not, alone, a signal of a major regime shift.
Disclaimer: This article is for informational purposes only. All investment decisions are made solely at your own risk.