📺 Watch the Full Video Analysis
This article was automatically generated by the NFC Market Live AI analysis system. (Updated: 2026-07-05 11:40 JST)
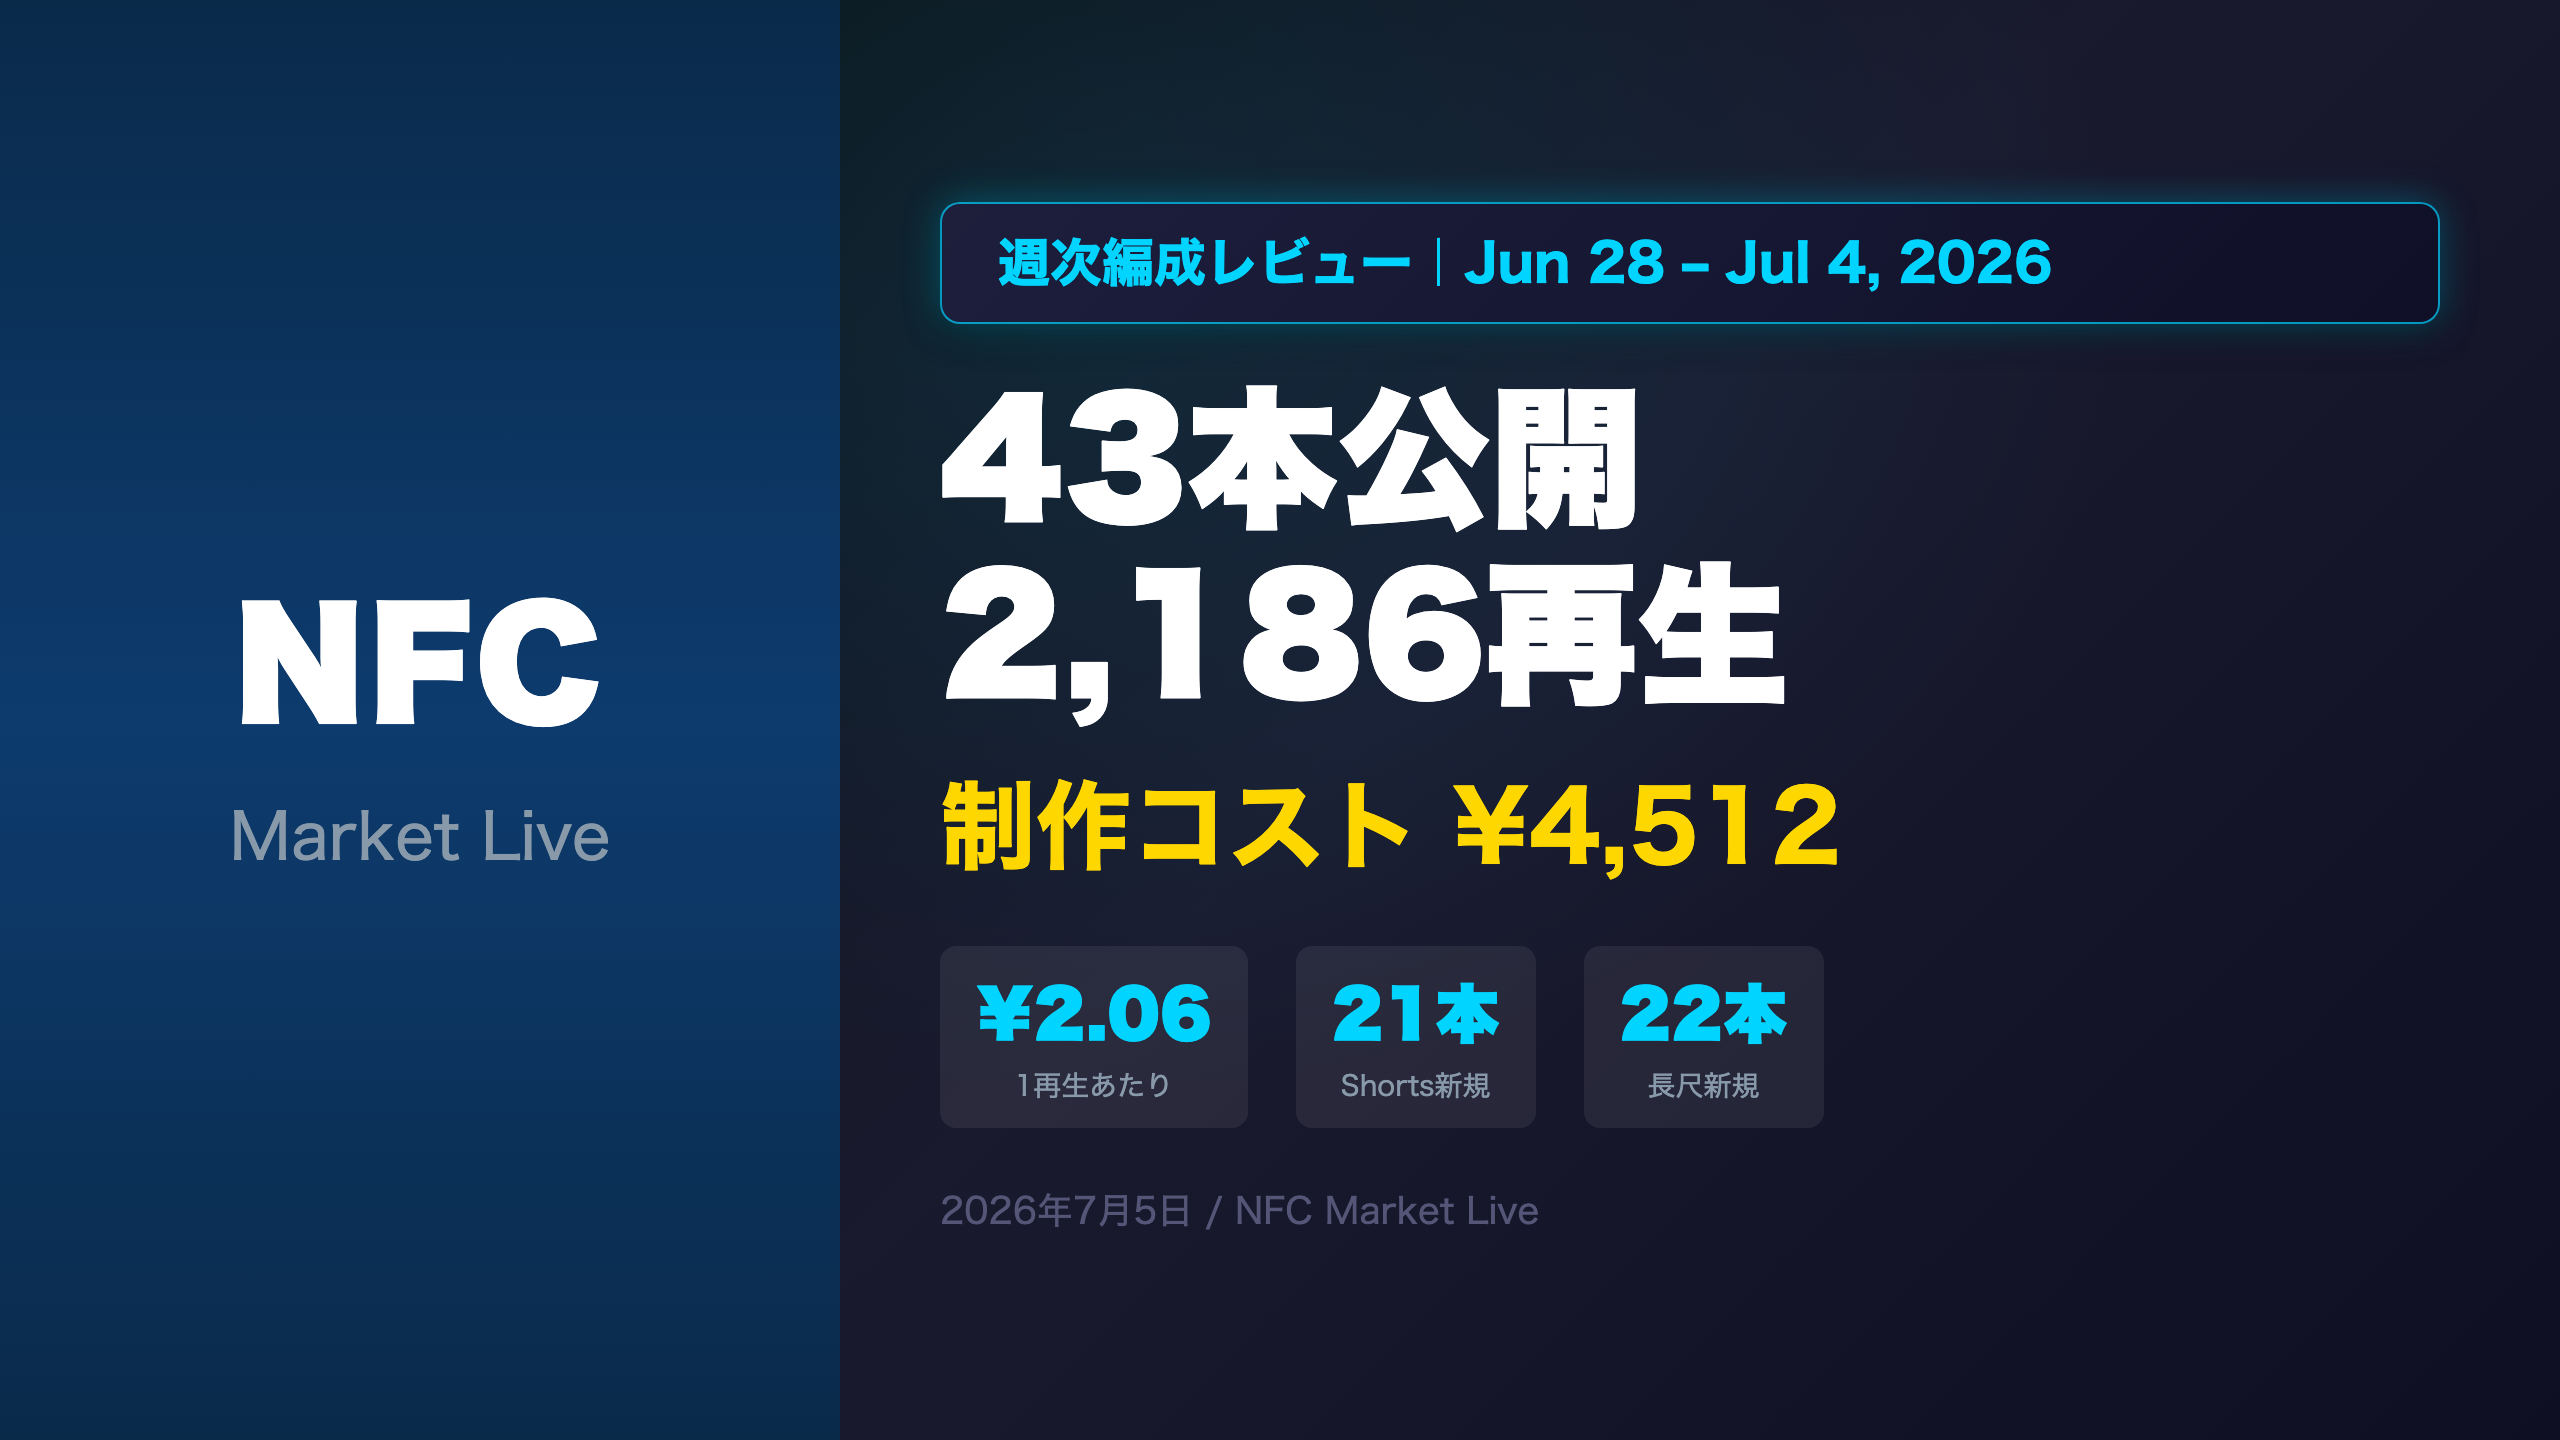
Weekly programming review for Jun 28–Jul 4, 2026. NFC Market Live published 21 Shorts and 22 long-form videos, generating 2,186 total views at a production cost of ¥4,512 (¥2.06/view). The US Jobs Report Short led with 150 views. This episode covers 28-day trend analysis, policy milestone impact, cost breakdown, and next week’s production strategy.
オープニング:週次編成レビュー 2026年6月28日〜7月4日
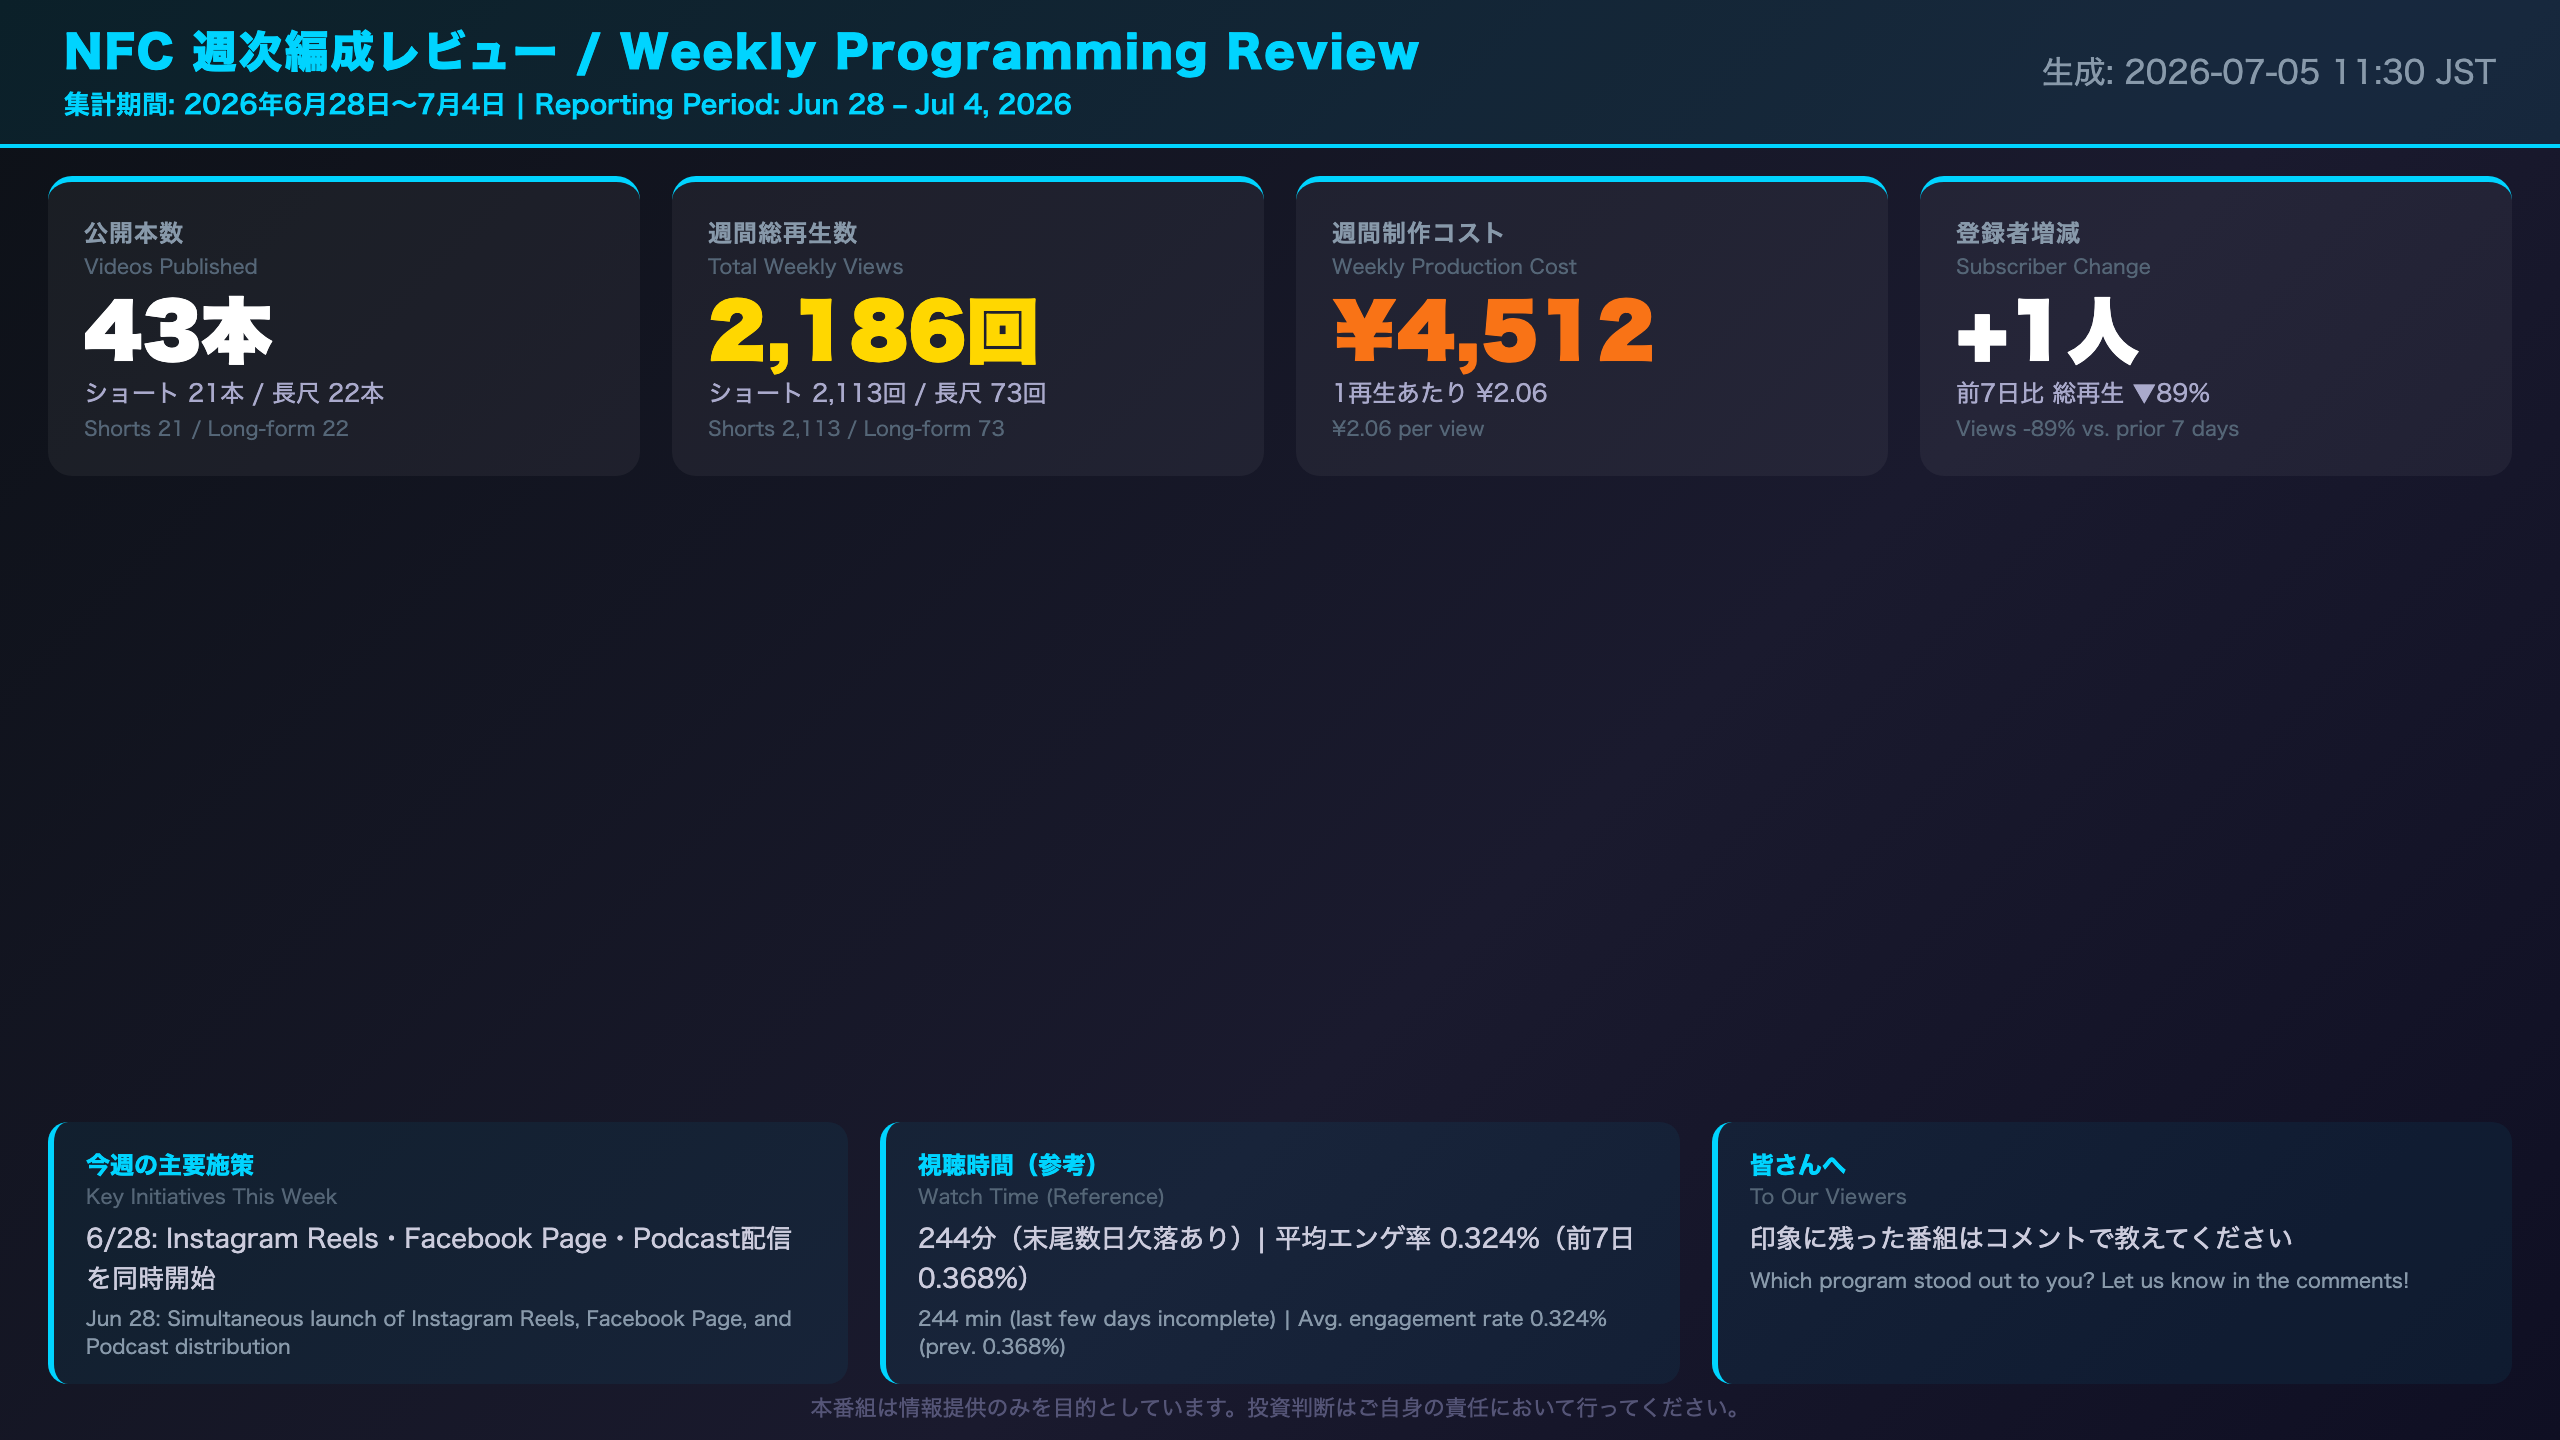
Weekly Programming Review — Opening Summary (Jun 28–Jul 4, 2026)
Key Performance Indicators
| Metric | This Week | Prior 7 Days (ref.) | Change |
|---|---|---|---|
| Total Views | 2,186 | 19,435 | ▼~89% |
| Shorts Views | 2,113 | — | — |
| Long-form Views | 73 | — | — |
| Production Cost | ¥4,512 | — | — |
| Cost per View | ¥2.06 | — | — |
| Videos Published | 43 (S21+L22) | — | — |
| Subscriber Change | +1 | — | — |
Context
The ~89% week-over-week decline in views looks alarming at first glance, but context matters. The prior 7-day period included June 24, when the English-language rollout drove a single-day spike of 2,802 views — an outlier that inflates the comparison base significantly.
NFC Market Live is an AI-automated economic news channel that publishes macro data analysis for Japanese and international investors. This weekly review is an internal editorial audit examining content performance, cost efficiency, and strategic direction.
Three New Platforms Launched Simultaneously
On June 28, the channel launched Instagram Reels auto-posting, Facebook Page distribution, and Podcast syndication (Apple Podcasts, Spotify, Amazon Music) in a single day. The immediate impact on YouTube views appears neutral-to-negative in the short term, which is consistent with the typical lag between platform launch and audience discovery. Whether these channels generate meaningful cross-platform traffic will be visible in the July 5–11 data window.
今週新規ショート動画 成績リスト(★新規21本)
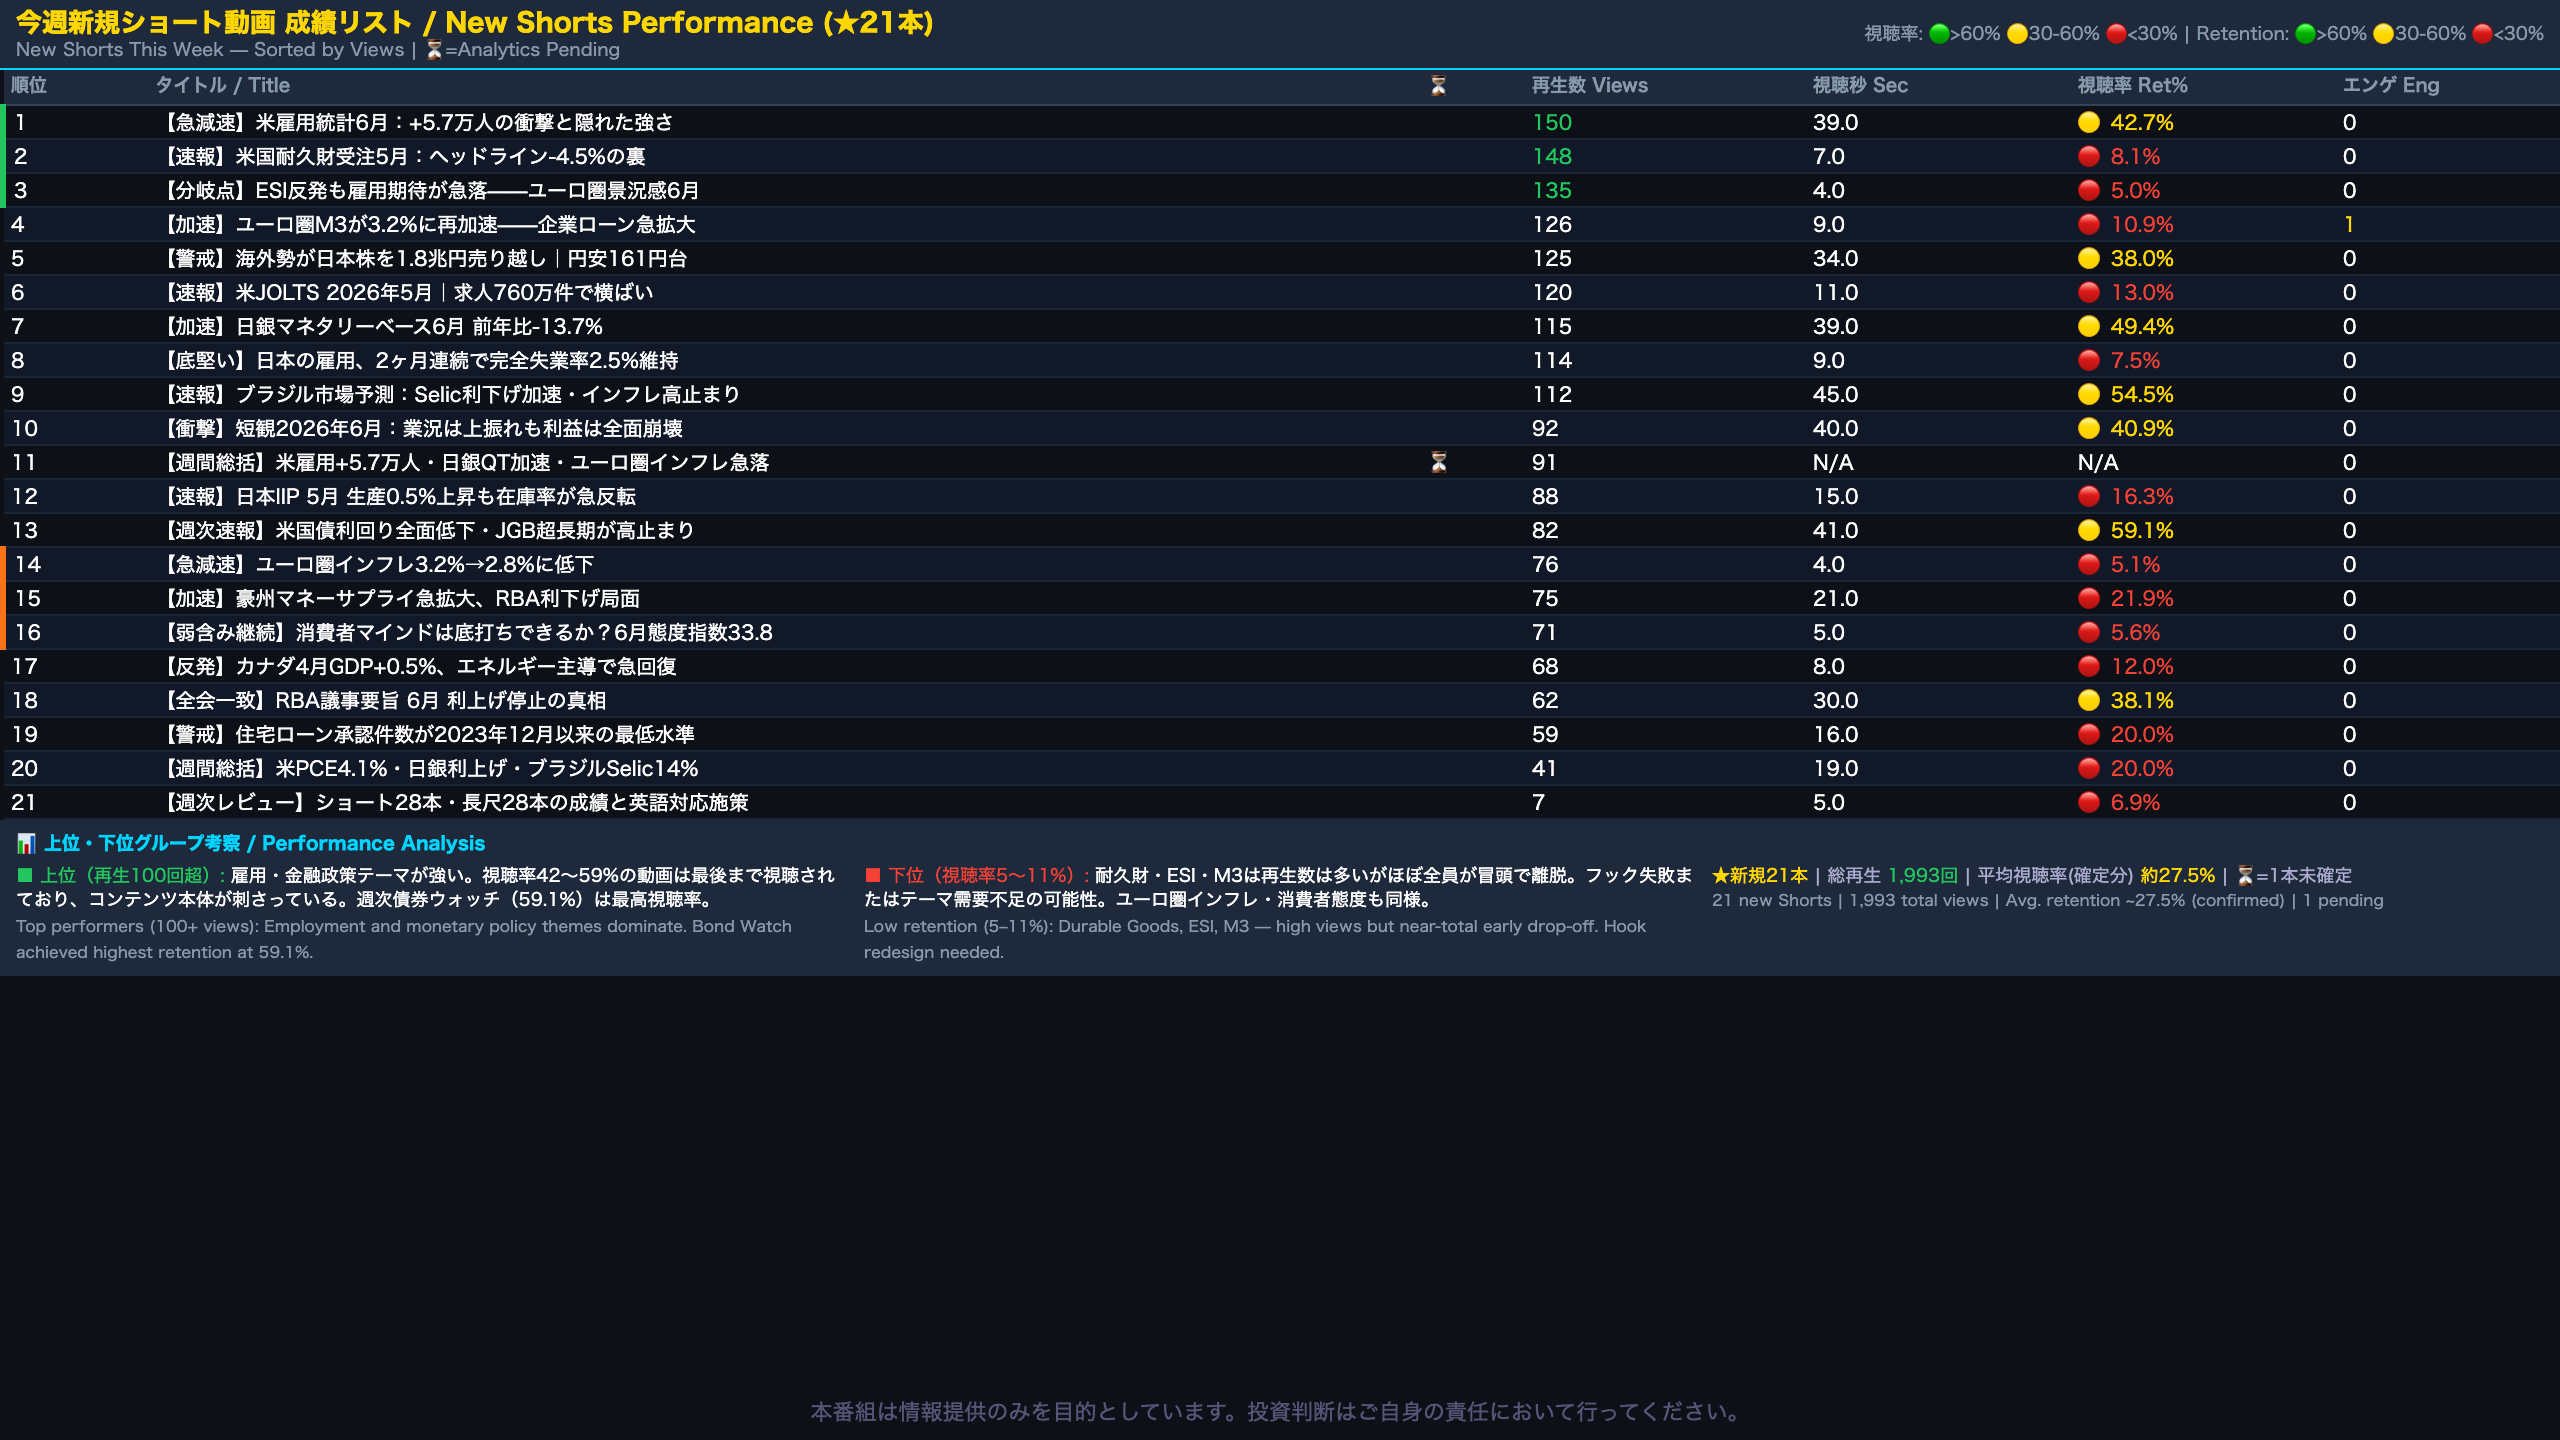
New Shorts Performance Analysis — Week of Jun 28–Jul 4, 2026
The Paradox: High Views, Low Retention
The most striking finding this week is the inverse relationship between view count and retention rate for several Shorts. Durable Goods Orders (148 views, 8.1% retention) and Euro Area ESI (135 views, 5.0% retention) ranked 2nd and 3rd in views respectively, yet posted the lowest retention rates among all new Shorts.
This pattern suggests the YouTube algorithm successfully distributed these videos, but viewers swiped away within the first few seconds. In Shorts, the algorithm rewards completion rate — so low retention actively suppresses future distribution.
Retention Rate Breakdown
| Tier | Threshold | Examples |
|---|---|---|
| Strong | >40% | Jobs Report (42.7%), BOJ MB (49.4%), Brazil (54.5%), Bond Watch (59.1%) |
| Moderate | 30–40% | Japan Stocks (38.0%), Tankan (40.9%), RBA Minutes (38.1%) |
| Weak | <30% | Durable Goods (8.1%), ESI (5.0%), M3 (10.9%), IIP (16.3%) |
What Drives Strong Retention in This Channel’s Shorts?
The high-retention Shorts share a common trait: they cover labor market or monetary policy themes with a clear narrative tension (e.g., “jobs collapsed but there’s hidden strength”). The weak performers tend to cover flow/money supply data (M3, monetary base, durable goods) where the economic stakes are less immediately intuitive to a general audience.
Recommendation
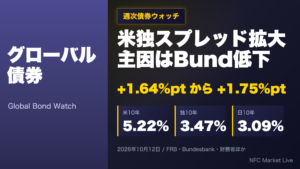
The Global Bond Watch format (59.1% retention, 82 views) deserves replication across other multi-indicator weekly roundup topics. For the weak-retention group, the opening hook — the first 3 seconds — needs a complete redesign before the next publication cycle.
今週新規長尺動画 成績リスト(★新規22本)
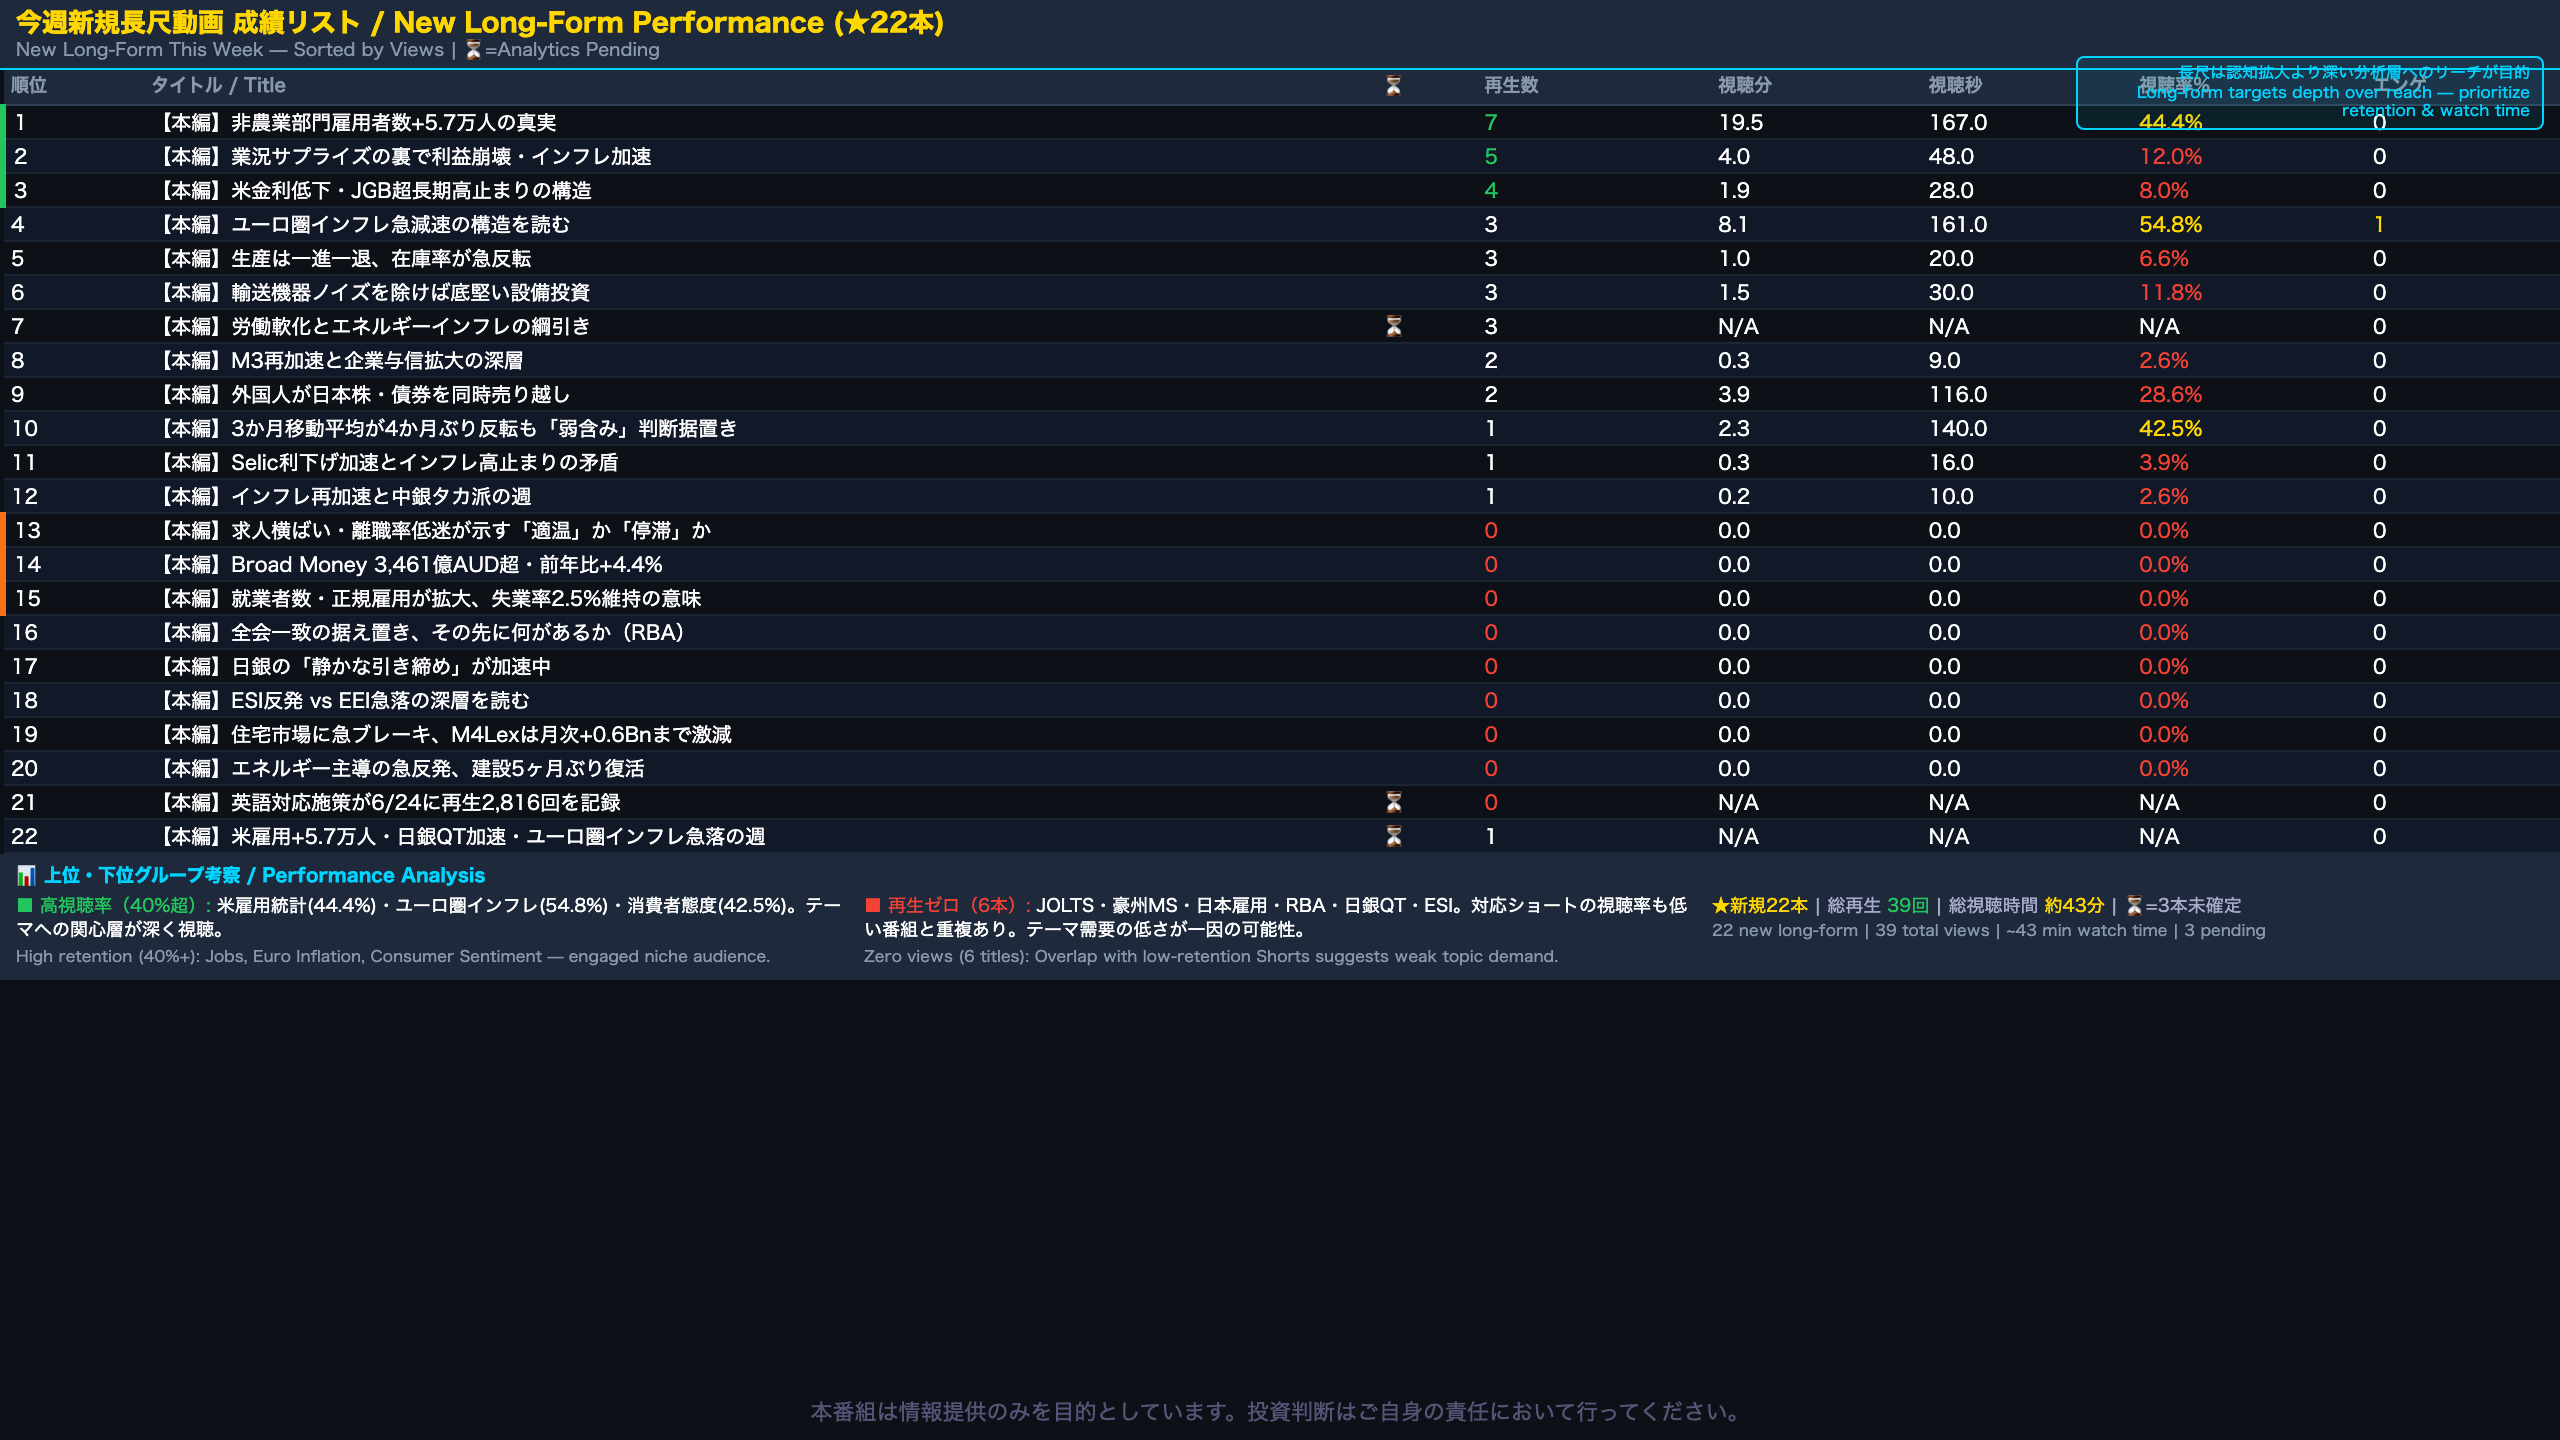
New Long-Form Video Performance Analysis — Week of Jun 28–Jul 4, 2026
Overview
NFC Market Live’s long-form “Deep Dive” videos are designed to serve a different purpose than Shorts: rather than maximizing reach, they target a smaller audience of investors who want in-depth macro analysis. This week’s 22 new long-form titles generated a combined 39 views, with the top performer — the US Jobs Report deep-dive — achieving 7 views and 44.4% retention.
High-Retention Standouts
The Euro Area Inflation deep-dive (3 views, 54.8% retention) and the Consumer Sentiment deep-dive (1 view, 42.5% retention) both demonstrate that when viewers do find these videos, they watch a substantial portion. This is the intended behavior for long-form content.
Zero-View Titles (6 of 22)
Six new long-form titles recorded zero views this week:
– JOLTS Job Openings deep-dive
– Australian Money Supply deep-dive
– Japan Employment Statistics deep-dive
– RBA Minutes deep-dive
– BOJ Monetary Base deep-dive
– Euro Area ESI deep-dive
It is important to note that several of these were published within the final days of the reporting period, and YouTube’s algorithm typically requires 48–72 hours to begin distributing new content. However, the correlation between low Short retention (ESI: 5.0%, Australian Money Supply: 21.9%) and zero long-form views for the same topics suggests that topic demand may be genuinely low for these subjects among the current audience.
Existing Video Benchmark
Among existing (non-new) long-form videos, several titles show retention rates above 90% (e.g., 97.5%, 94.3%), confirming that the deep-dive format resonates strongly with the small but engaged audience that discovers it.
28日間 チャンネル成長トレンド(2026年6月7日〜7月2日)
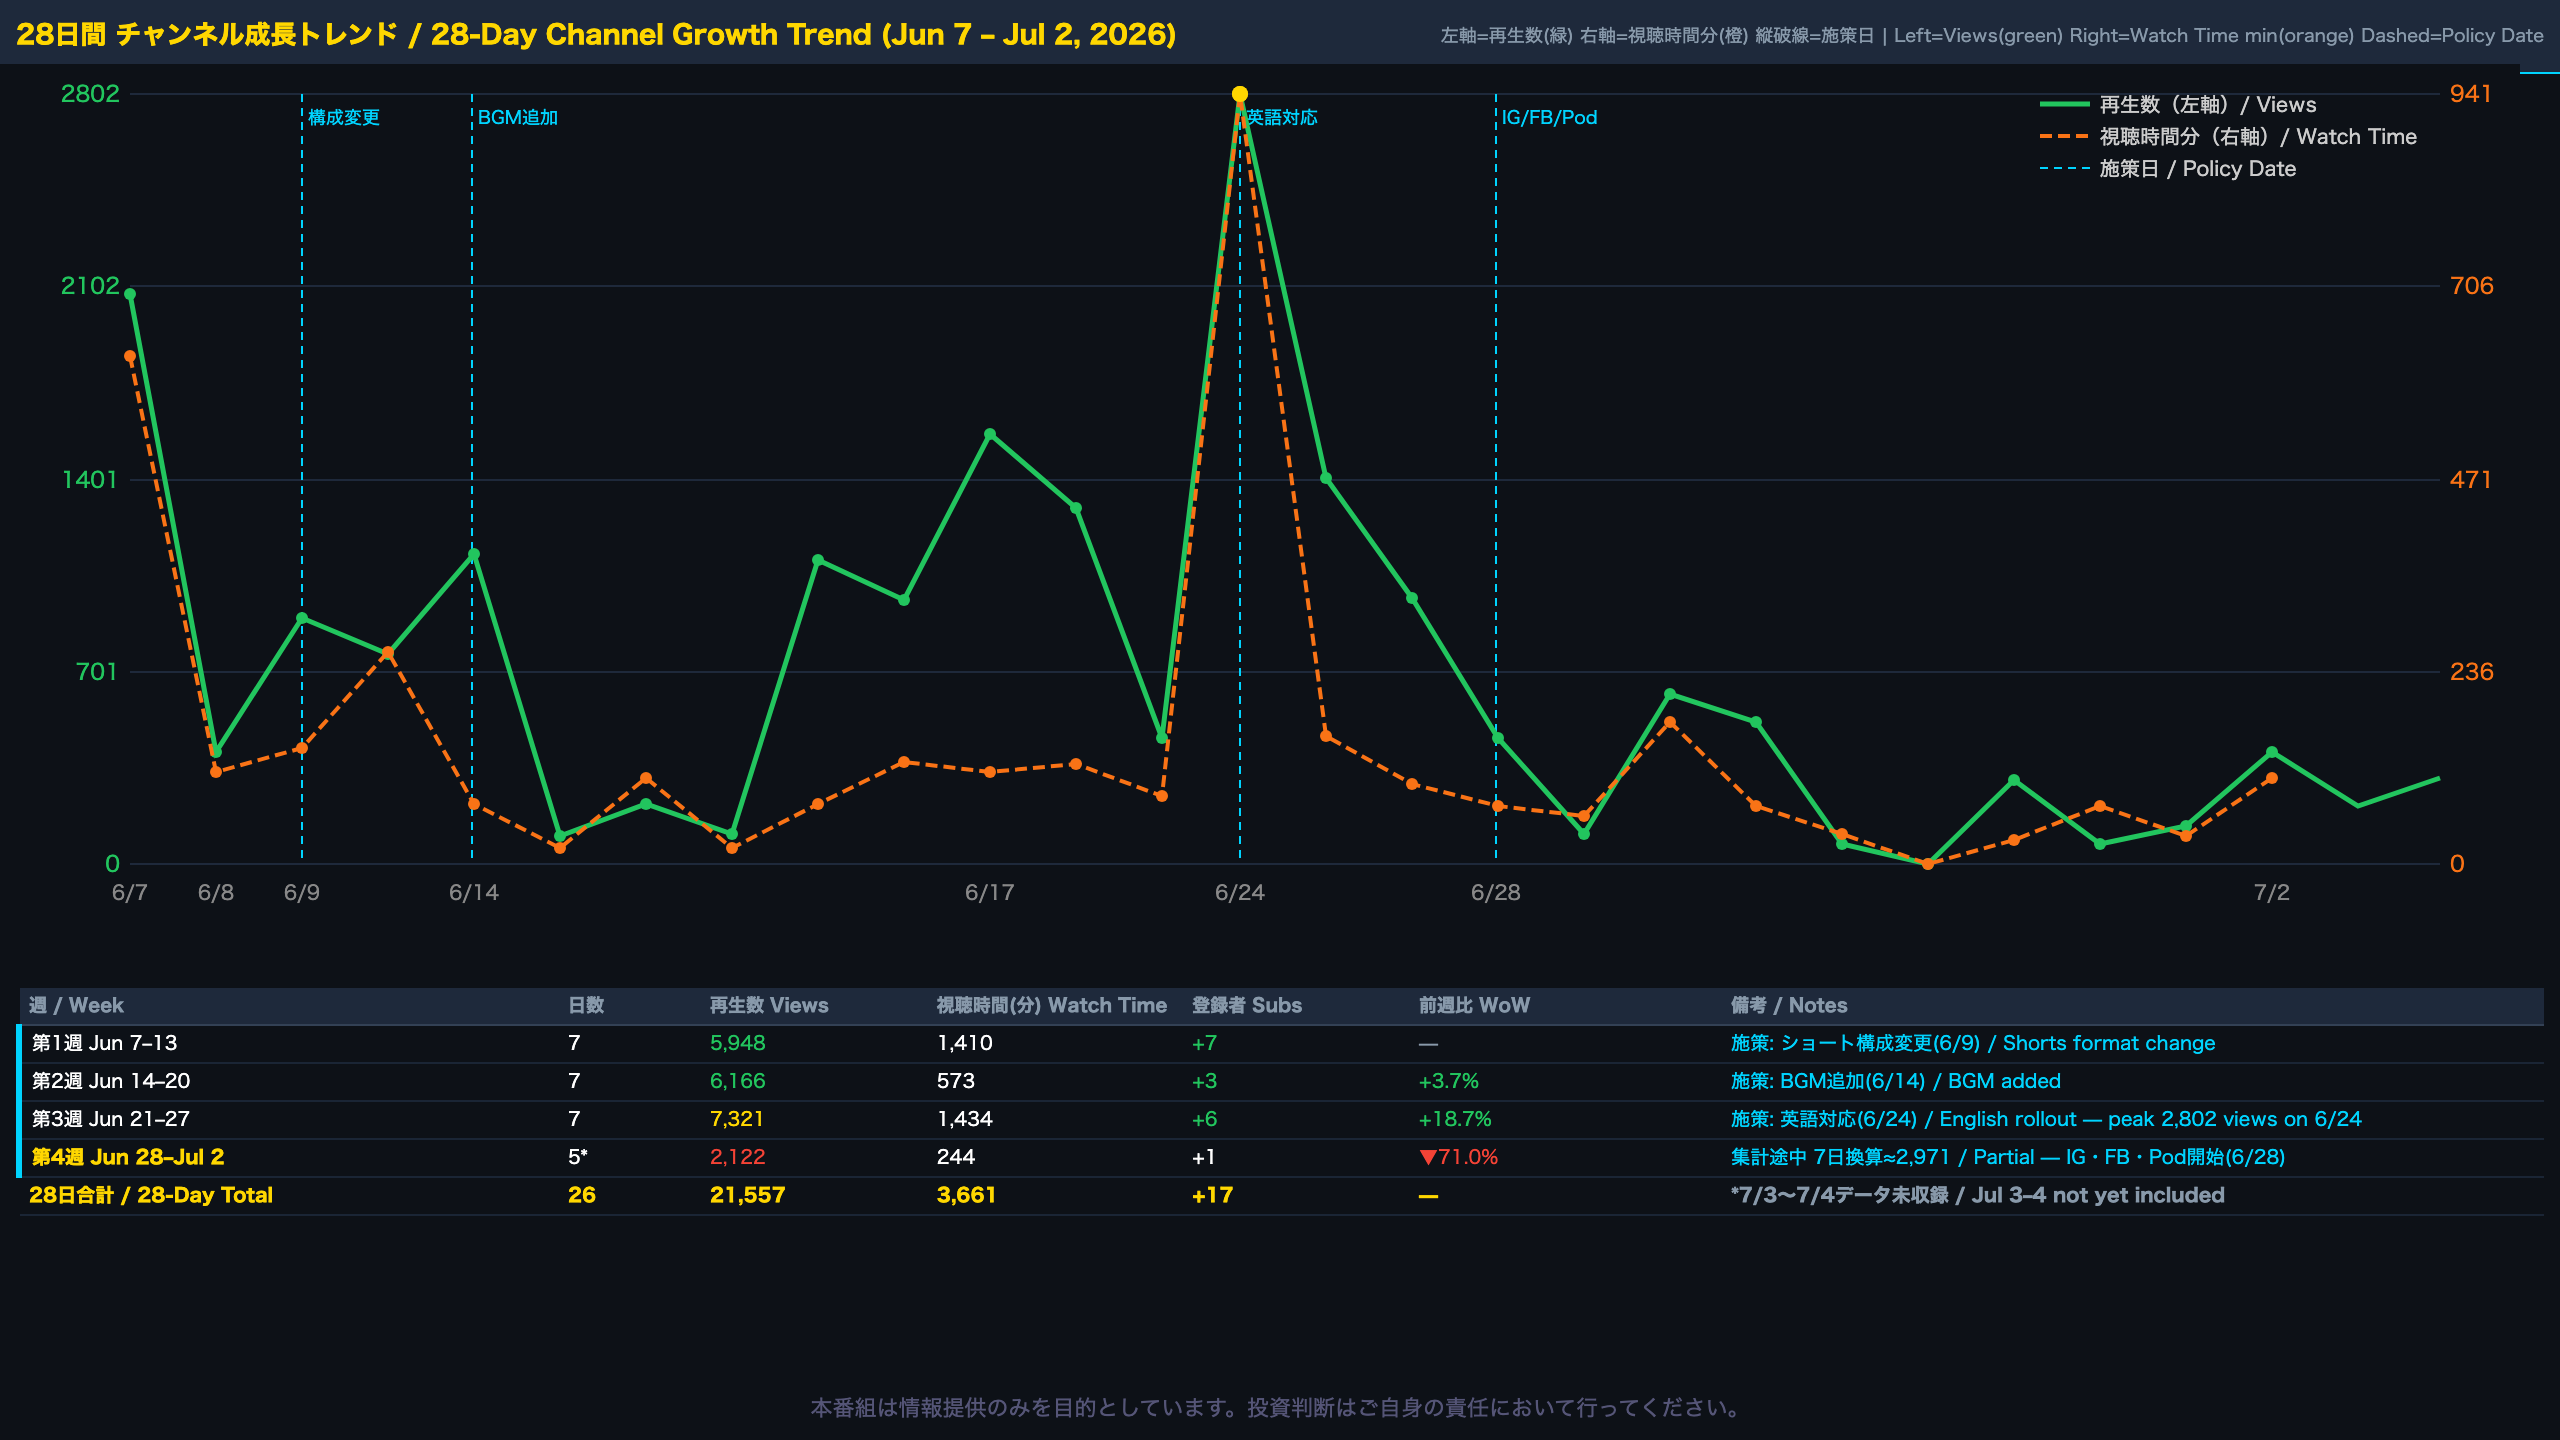
28-Day Channel Growth Trend — Detailed Analysis
Weekly Summary
| Week | Period | Views | Watch Time (min) | Subscribers | WoW Change |
|---|---|---|---|---|---|
| Week 1 | Jun 7–13 | 5,948 | 1,410 | +7 | — |
| Week 2 | Jun 14–20 | 6,166 | 573 | +3 | +3.7% |
| Week 3 | Jun 21–27 | 7,321 | 1,434 | +6 | +18.7% |
| Week 4 | Jun 28–Jul 2 | 2,122 | 244 | +1 | ▼71.0% (partial) |
Policy Milestone Analysis
Jun 9 — Shorts Format Redesign: Views recovered from 507 to 891 on the day of the change, but subsequent days showed high volatility (779 → 1,093 → 230 → 281), making it difficult to isolate the format change’s effect.
Jun 14 — BGM Addition: The day itself saw only 233 views, but the following day jumped to 1,047. Whether this reflects BGM impact or organic variation is unclear from a single data point.
Jun 24 — English Language Rollout: The single largest day in the 28-day window: 2,802 views and 941 minutes of watch time. This likely reflects a burst of viewing from existing English-speaking subscribers who discovered the new content format. The rapid decay over subsequent days (1,177 → 935 → 307) suggests this was a one-time discovery event rather than a sustained new audience inflow. Monitoring the Jul 5–11 window will be critical to assess whether English-language content is generating ongoing organic discovery.
Jun 28 — Instagram, Facebook, Podcast Launch: Immediate YouTube impact appears minimal (213 views on launch day). This is expected — cross-platform traffic requires first building a follower base on the new platforms, which takes weeks to months.
Views vs. Watch Time Divergence
Week 2 shows a notable divergence: 6,166 views but only 573 minutes of watch time, compared to Week 1’s 5,948 views and 1,410 minutes. This suggests Week 2 had a higher proportion of short-duration content (flash report Shorts), which generate views but minimal watch time.
今週の番組制作コスト分析(37番組・合計4,512円)
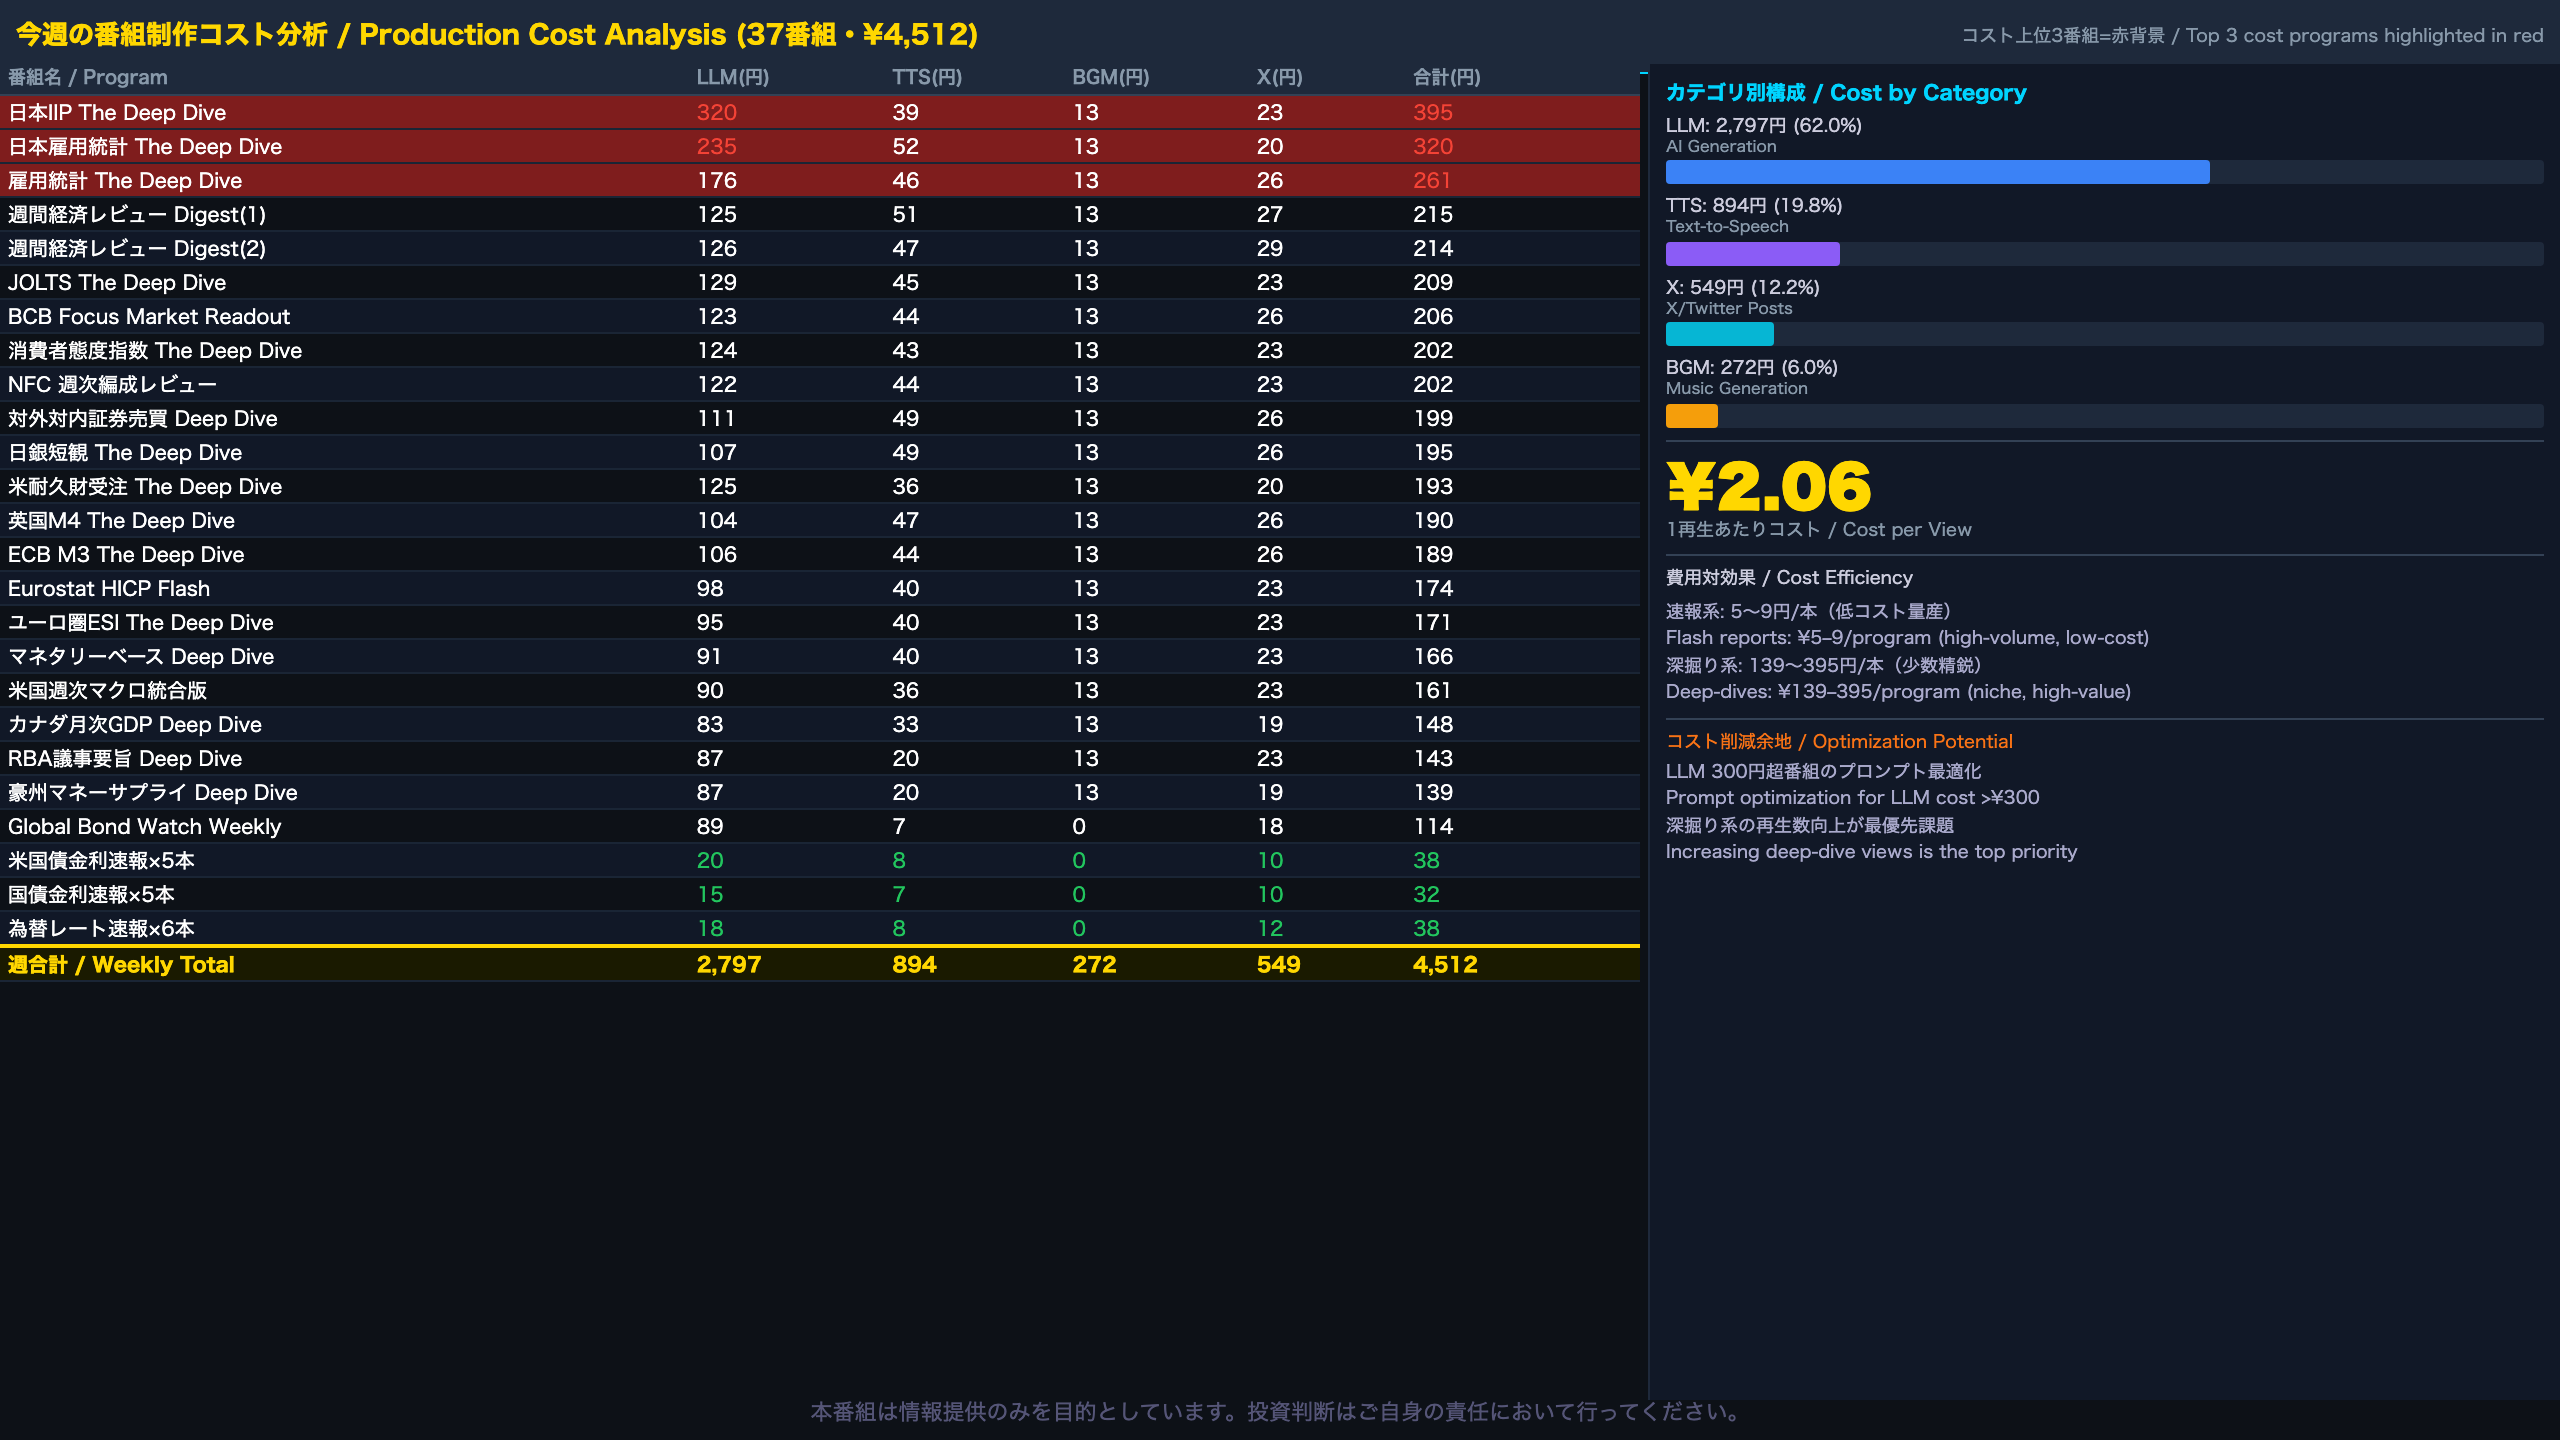
Production Cost Analysis — Week of Jun 28–Jul 4, 2026
Cost Breakdown by Category
| Category | Amount (¥) | Share |
|---|---|---|
| LLM (AI generation) | 2,797 | 62.0% |
| TTS (text-to-speech) | 894 | 19.8% |
| BGM (music generation) | 272 | 6.0% |
| X (Twitter/X posts) | 549 | 12.2% |
| Total | 4,512 | 100% |
LLM costs dominate at 62% of total spend. This reflects the AI-first production model where each program requires a full LLM pass for script generation, slide content, blog articles, and metadata.
Top 3 Most Expensive Programs
- Japan IIP Deep Dive: ¥395 — LLM cost of ¥320 is the primary driver
- Japan Employment Statistics Deep Dive: ¥320 — LLM ¥235, TTS ¥52
- US Jobs Report Deep Dive: ¥261 — LLM ¥176, TTS ¥46
Cost Efficiency Assessment
The channel operates a two-tier cost model:
– Flash Reports (interest rate/FX alerts): ¥5–9 per program, 1–8 views each. Extremely low cost, acceptable even at low view counts.
– Deep Dives: ¥139–395 per program, 1–7 views for long-form. When evaluated in isolation, cost-per-view is high (¥37–395). However, each Deep Dive generates a corresponding Short that typically achieves 60–150 views, making the blended cost-per-view more reasonable.
Optimization Opportunities
- LLM costs above ¥300 (Japan IIP, Japan Employment) may be reducible through prompt optimization or model tier selection
- BGM cost of ¥13/program for all deep-dives is fixed; evaluating whether BGM meaningfully improves retention would justify or challenge this spend
- X posting costs (¥18–29/program) are consistent and appear proportional to content length
来週の番組制作方針(まとめ)
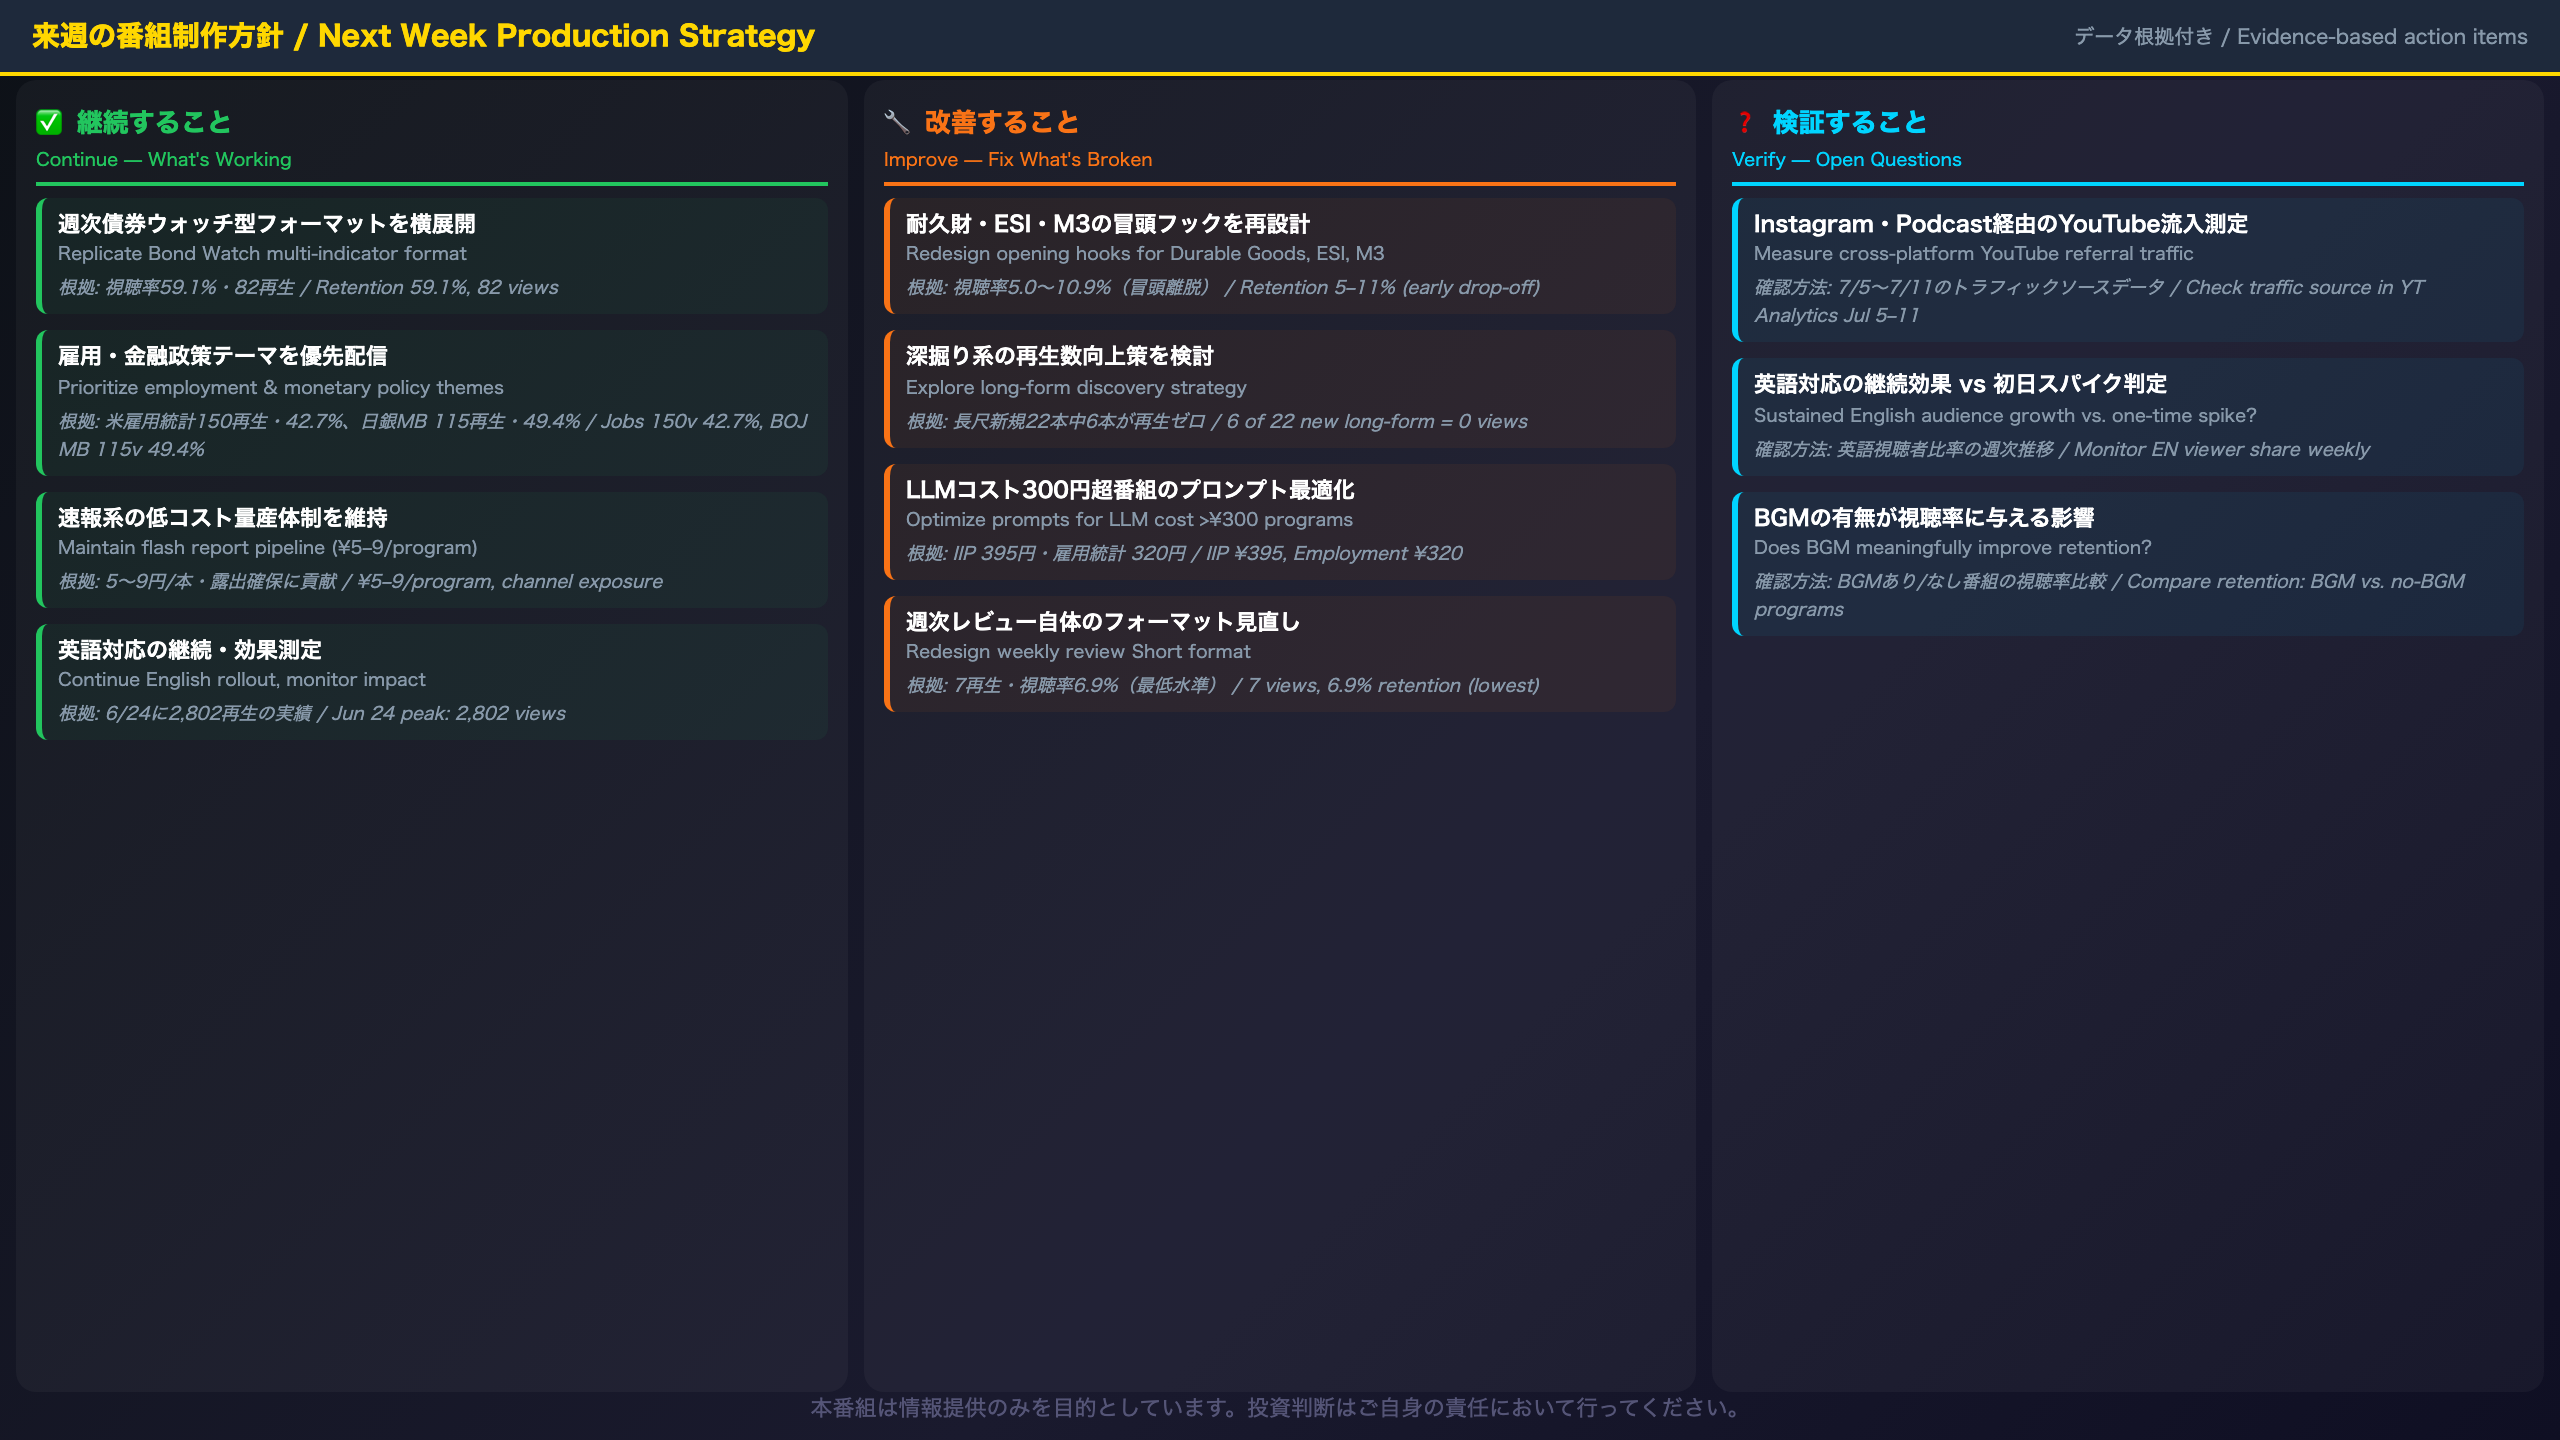
Next Week’s Production Strategy — Detailed Action Plan
What to Continue
1. Multi-Indicator Weekly Roundup Format
The Global Bond Watch Short achieved 59.1% retention on 82 views — the highest retention rate among all new Shorts this week. This format (covering multiple related indicators in a single cohesive narrative) should be replicated for other weekly macro themes such as the Weekly Macro Pulse and the Weekly Economic Review.
2. Employment and Monetary Policy Theme Priority
The US Jobs Report Short (150 views, 42.7% retention) and BOJ Monetary Base Short (115 views, 49.4% retention) confirm that these themes consistently deliver both reach and engagement. They should remain the production priority.
3. Low-Cost Flash Report Pipeline
At ¥5–9 per program, flash reports for interest rates and FX provide channel exposure at negligible cost. This pipeline should be maintained as-is.
What to Improve
1. Opening Hook Redesign for Low-Retention Shorts
Durable Goods (8.1%), ESI (5.0%), and M3 (10.9%) all failed to retain viewers past the first few seconds. The redesign should lead with a counter-intuitive fact stated as a declarative sentence — not a question — within the first 3 seconds.
2. Long-Form Discovery Strategy
With most new long-form titles generating 0–3 views, the current organic discovery rate is insufficient. Options include: (a) adding end-screen links from high-performing Shorts to corresponding long-form videos, (b) improving thumbnail design for deep-dive titles.
What to Verify
1. Cross-Platform Traffic Attribution
The Jul 5–11 data window will be the first opportunity to measure whether Instagram Reels, Facebook Page posts, or Podcast episodes are generating YouTube referral traffic. Traffic source data in YouTube Analytics will be the key metric.
2. Weekly Review Format Effectiveness
The weekly review Short itself posted only 7 views and 6.9% retention — among the lowest of all new Shorts. Whether the format needs a fundamental redesign or simply better hook writing is worth testing next week.
Disclaimer: This article is for informational purposes only. All investment decisions are made solely at your own risk.