📺 Watch the Full Video Analysis
This article was automatically generated by the NFC Market Live AI analysis system. (Updated: 2026-06-30 09:00 JST)
📄 Primary Source
NFC Market Live
https://www.meti.go.jp/statistics/tyo/iip/result/pdf/press/b2020_202605sj.pdf, https://www.meti.go.jp/statistics/tyo/iip/result/pdf/reference/b2020_202605refsj.pdf, https://www.meti.go.jp/statistics/tyo/iip/result/pdf/real/b2020_202605figsj.pdf
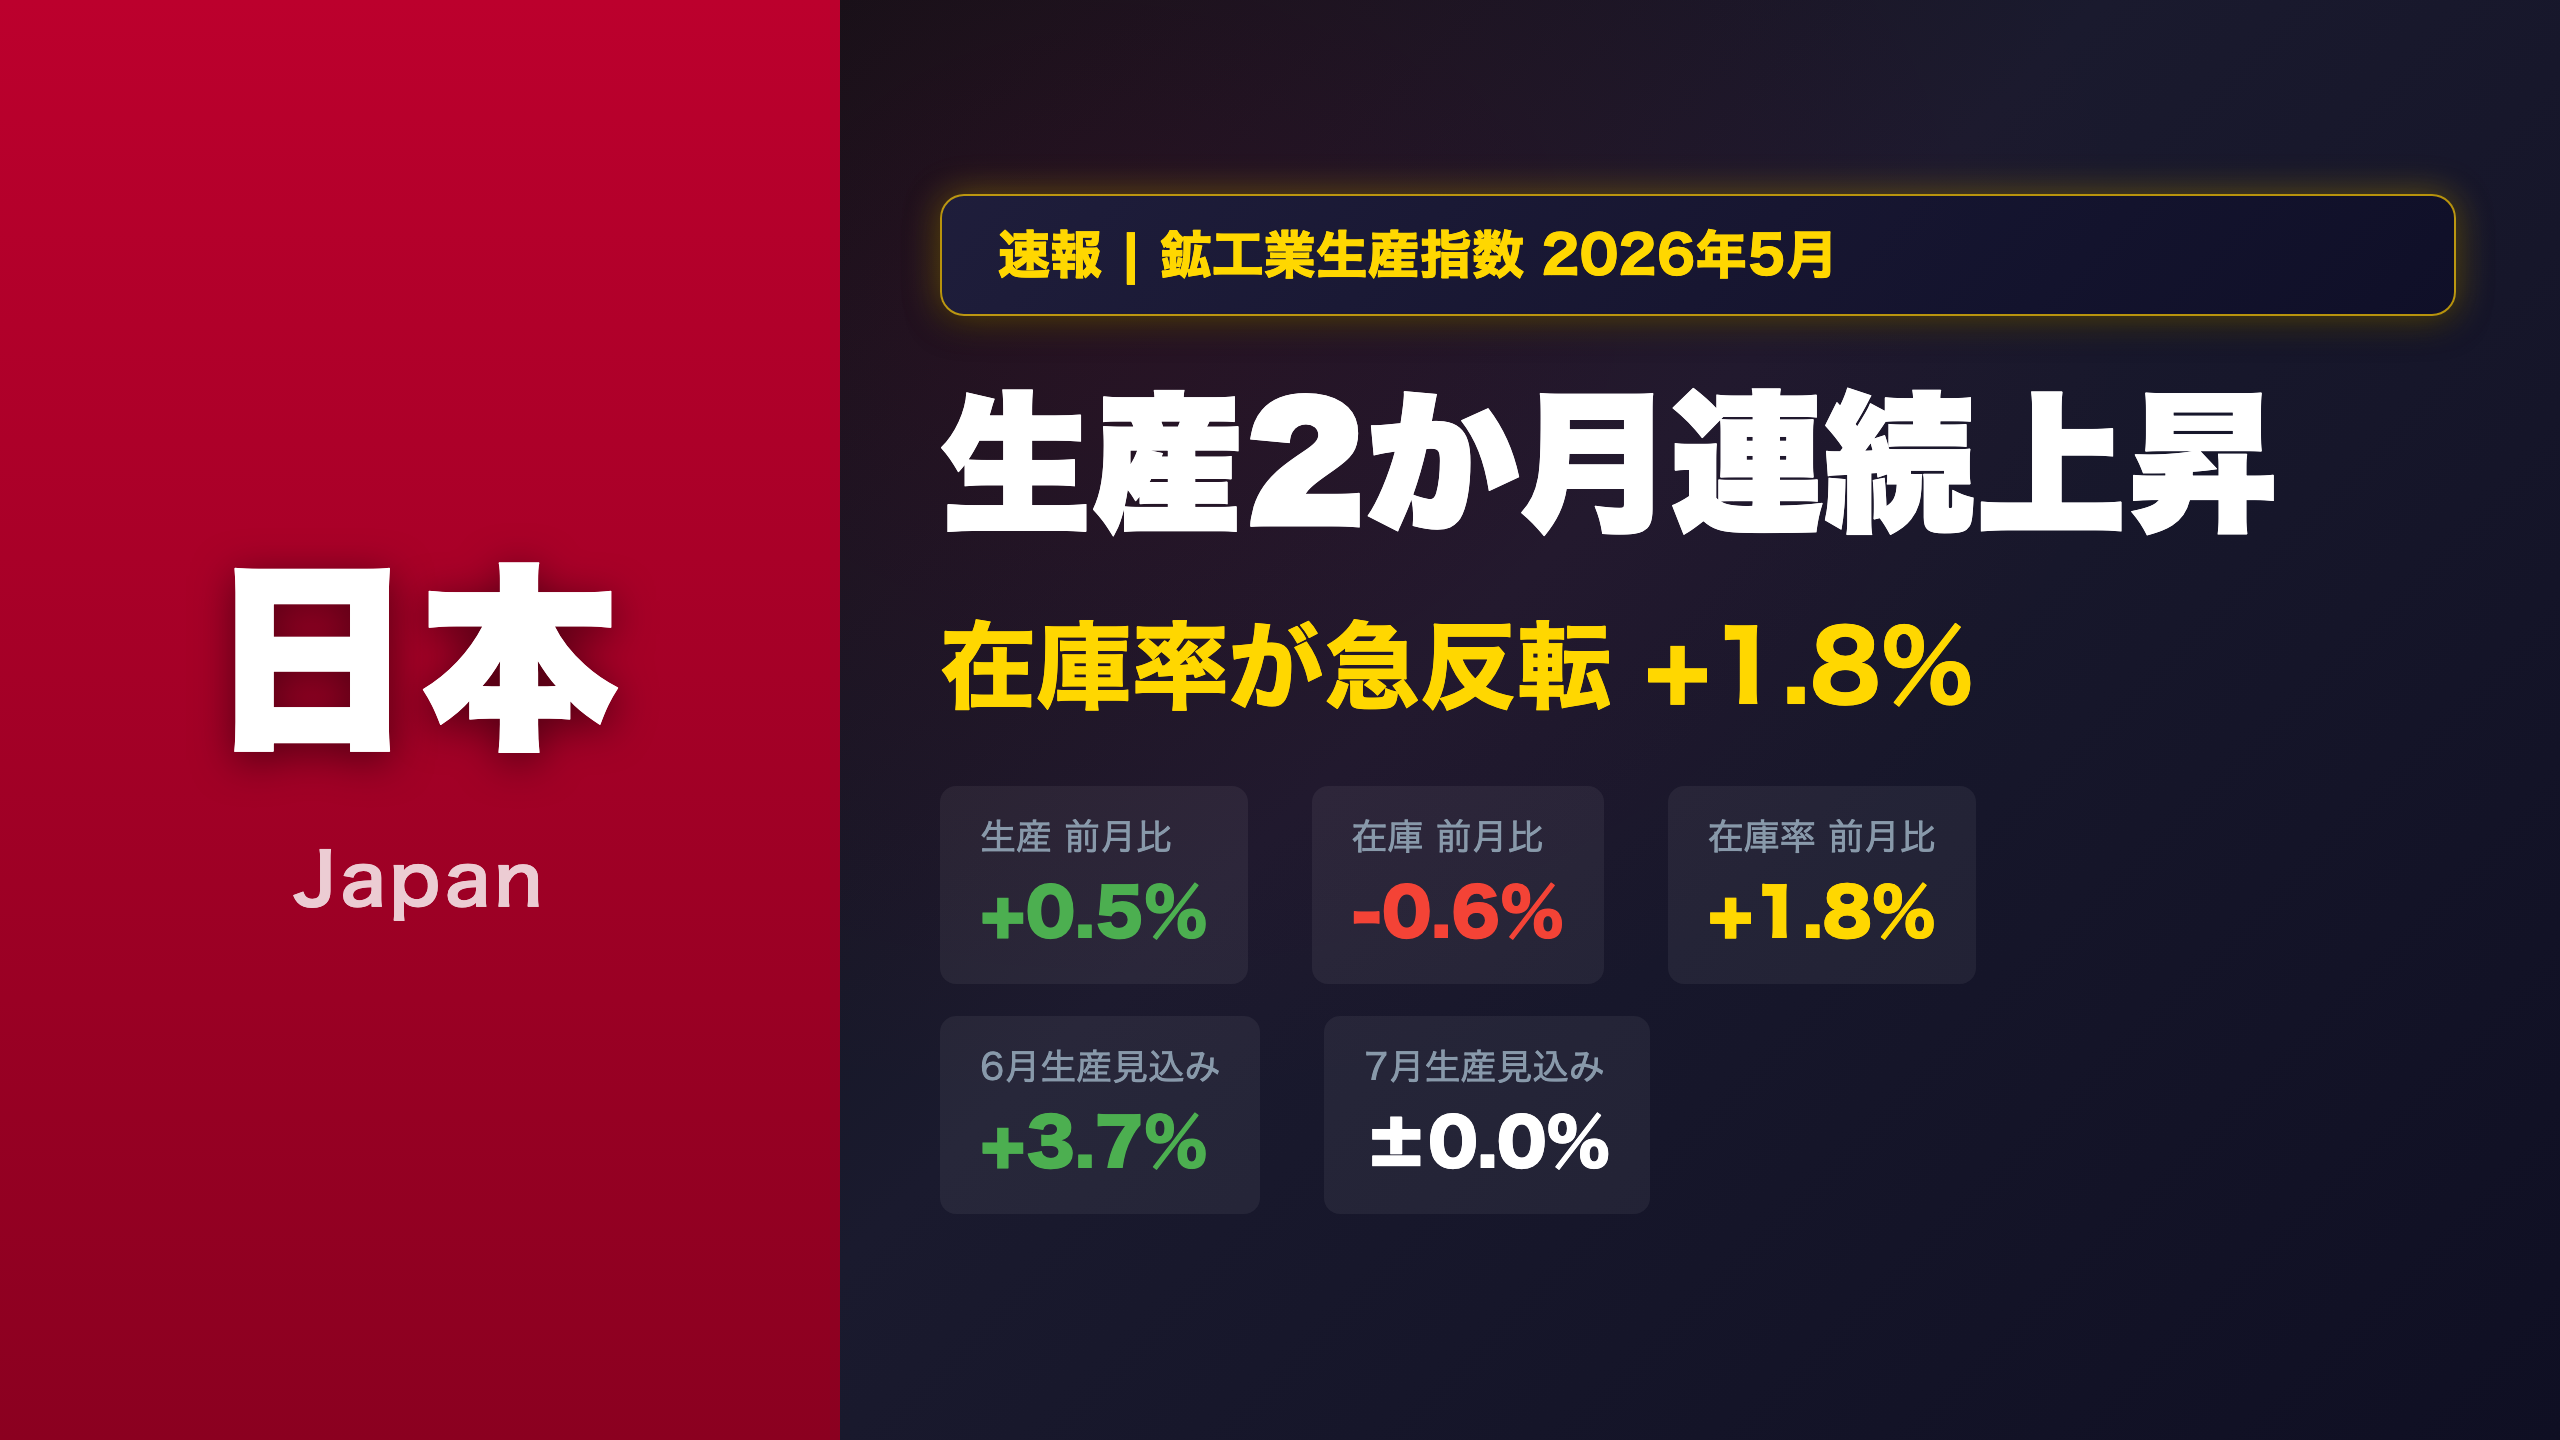
Deep dive into Japan’s May 2026 Industrial Production Index (preliminary). Production rose +0.5% MoM for a second consecutive month, but the inventory ratio surged +1.8% — its first rise in three months — signaling potential inventory accumulation. Transport equipment (excl. autos), petroleum, and chemicals led gains, while general-purpose machinery and electrical equipment dragged. We analyze the inventory cycle position and June/July production forecasts to assess the true resilience of Japanese manufacturing.
The Ultimate Summary:5月IIPが示す製造業の現在地
Japan IIP May 2026 Preliminary: A Turning Point in the Inventory Cycle?
What Is the IIP?
Japan’s Industrial Production Index (IIP), published monthly by the Ministry of Economy, Trade and Industry (METI), measures output across mining and manufacturing sectors. It is one of the most closely watched leading indicators for Japan’s GDP and corporate earnings cycle. The index uses 2020 as the base year (= 100).
Headline Numbers
| Indicator | MoM (SA) | YoY (Original) |
|---|---|---|
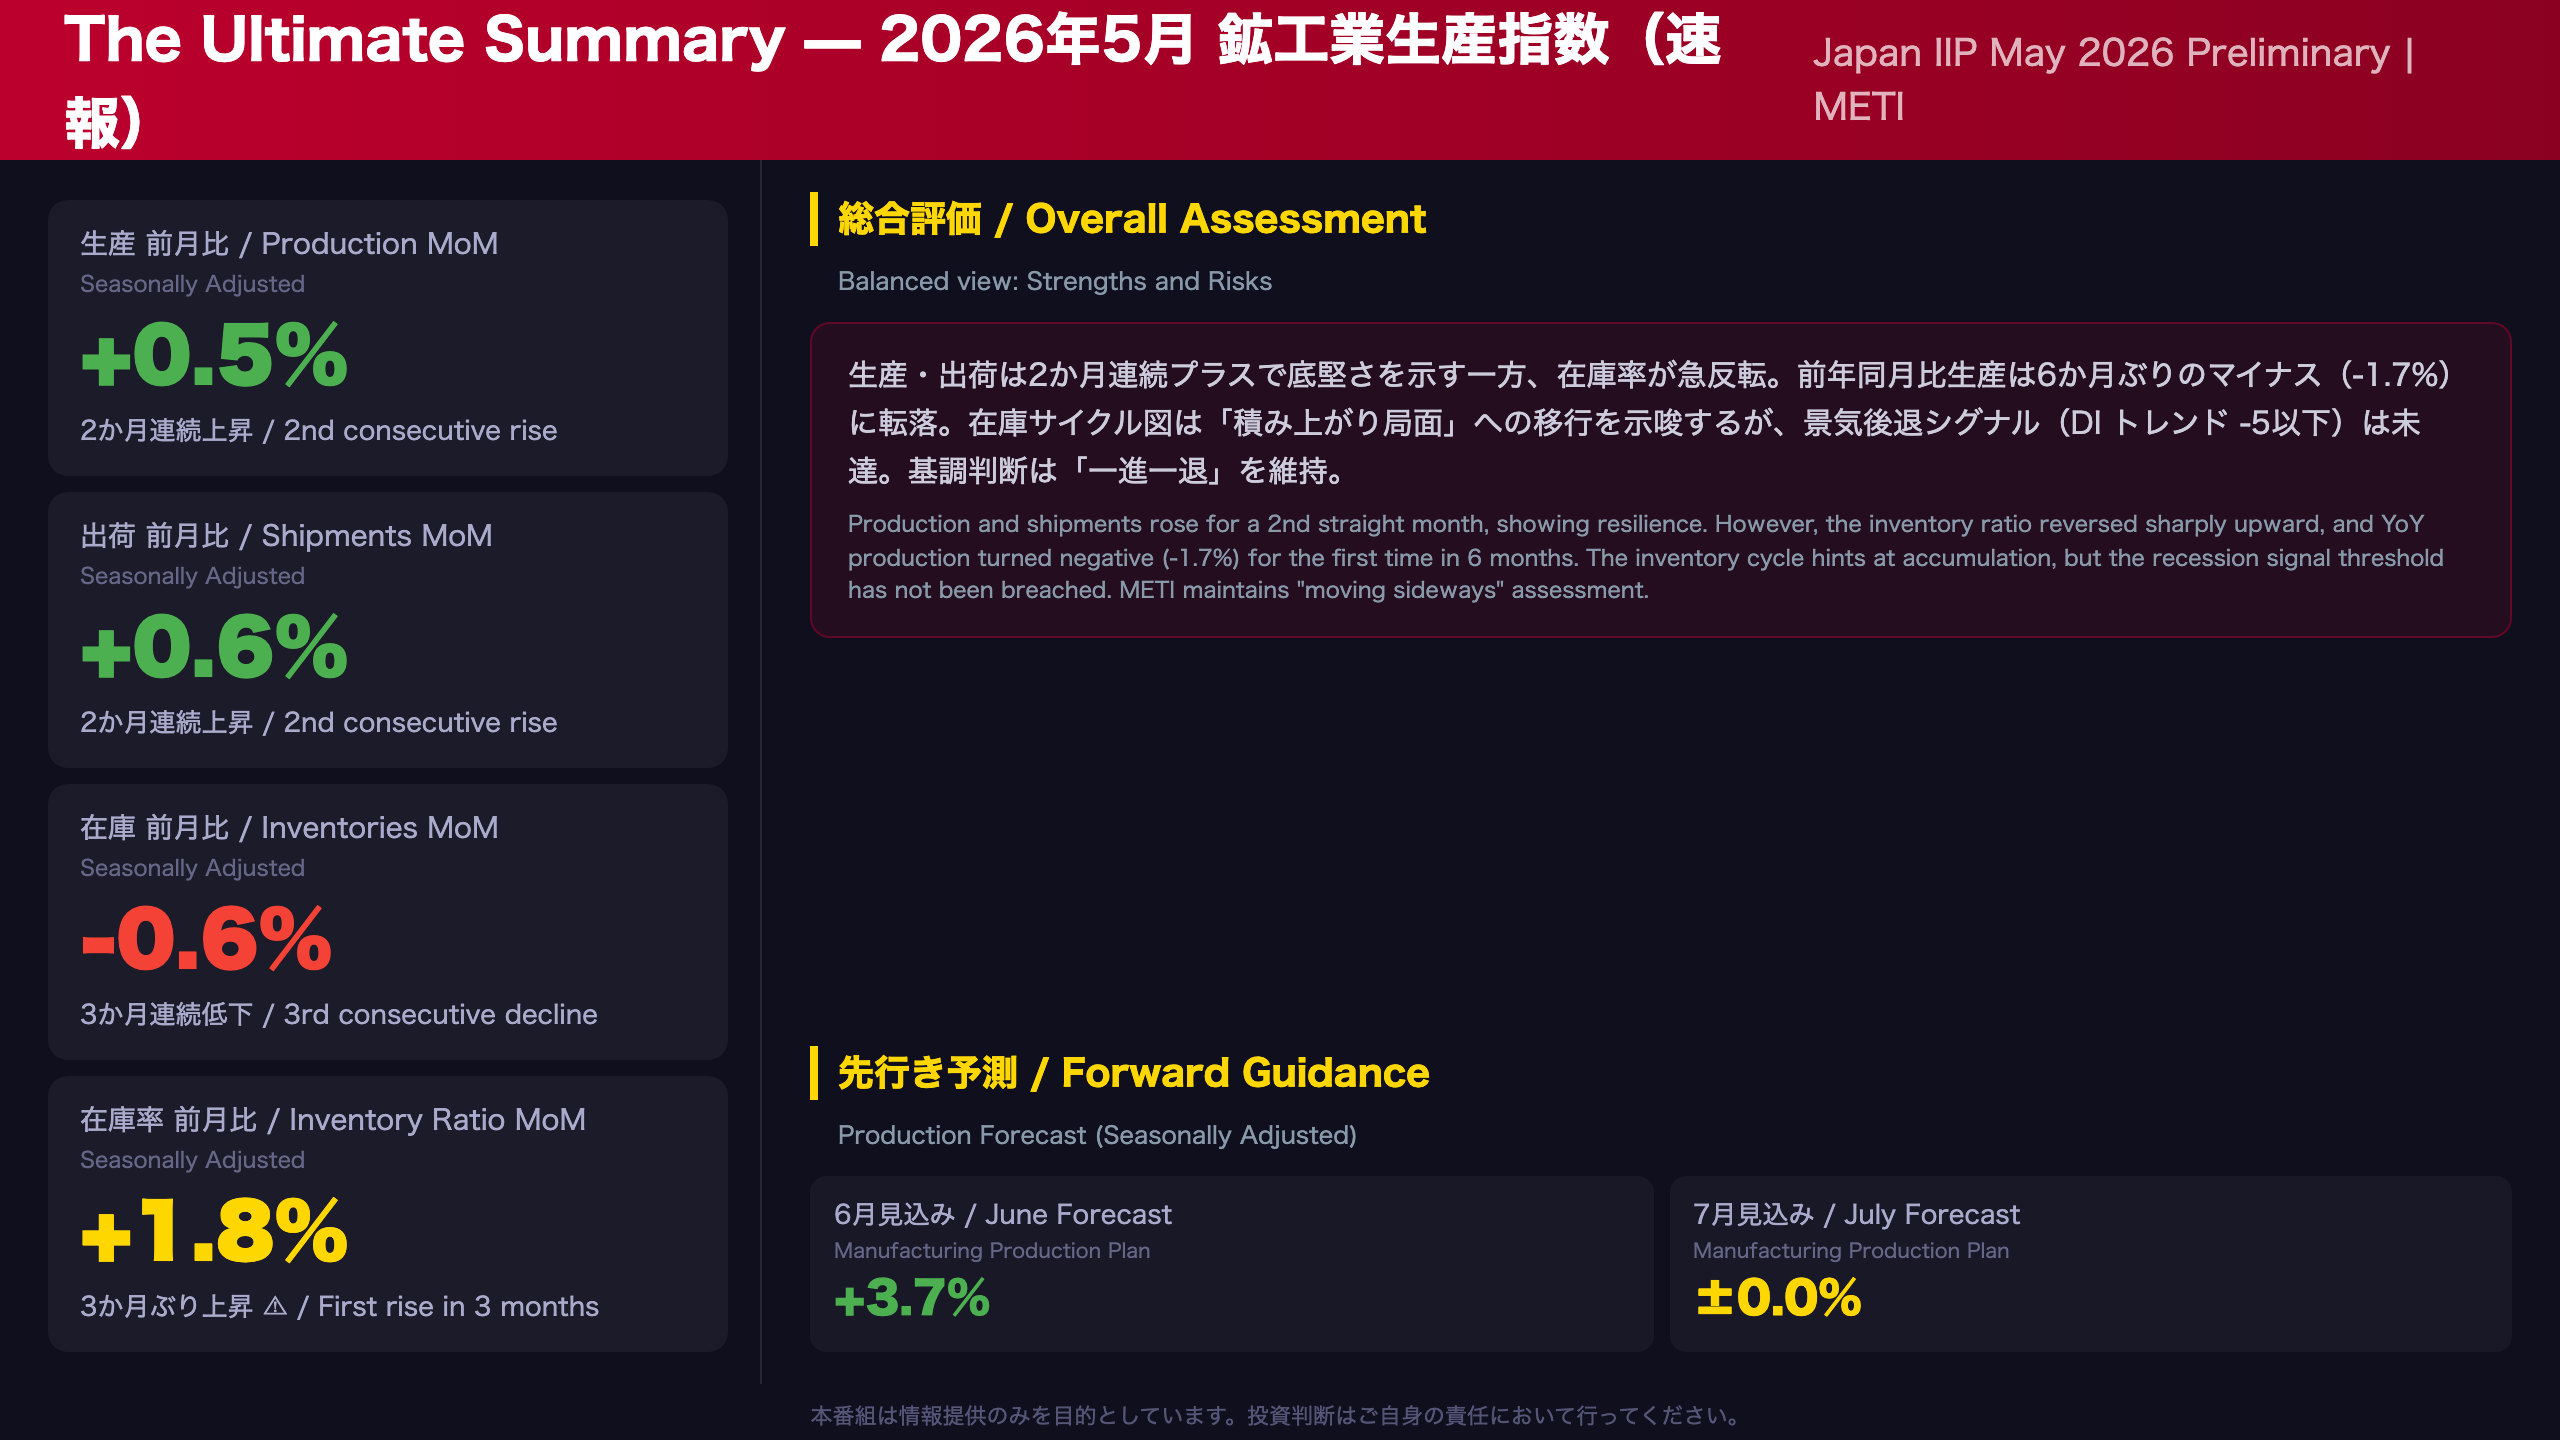
| Production | +0.5% (2nd consecutive rise) | -1.7% (first decline in 6 months) |
| Shipments | +0.6% (2nd consecutive rise) | -1.8% (first decline in 3 months) |
| Inventories | -0.6% (3rd consecutive decline) | -4.6% (16th consecutive decline) |
| Inventory Ratio | +1.8% (first rise in 3 months) | +0.3% (first rise in 9 months) |
The Inventory Ratio Paradox
The most counterintuitive signal in this report: inventories fell for a third straight month, yet the inventory ratio rose sharply. This is mathematically possible because the inventory ratio is calculated as inventories divided by shipments. When shipment growth lags production growth, the ratio rises even if absolute inventory levels are declining.
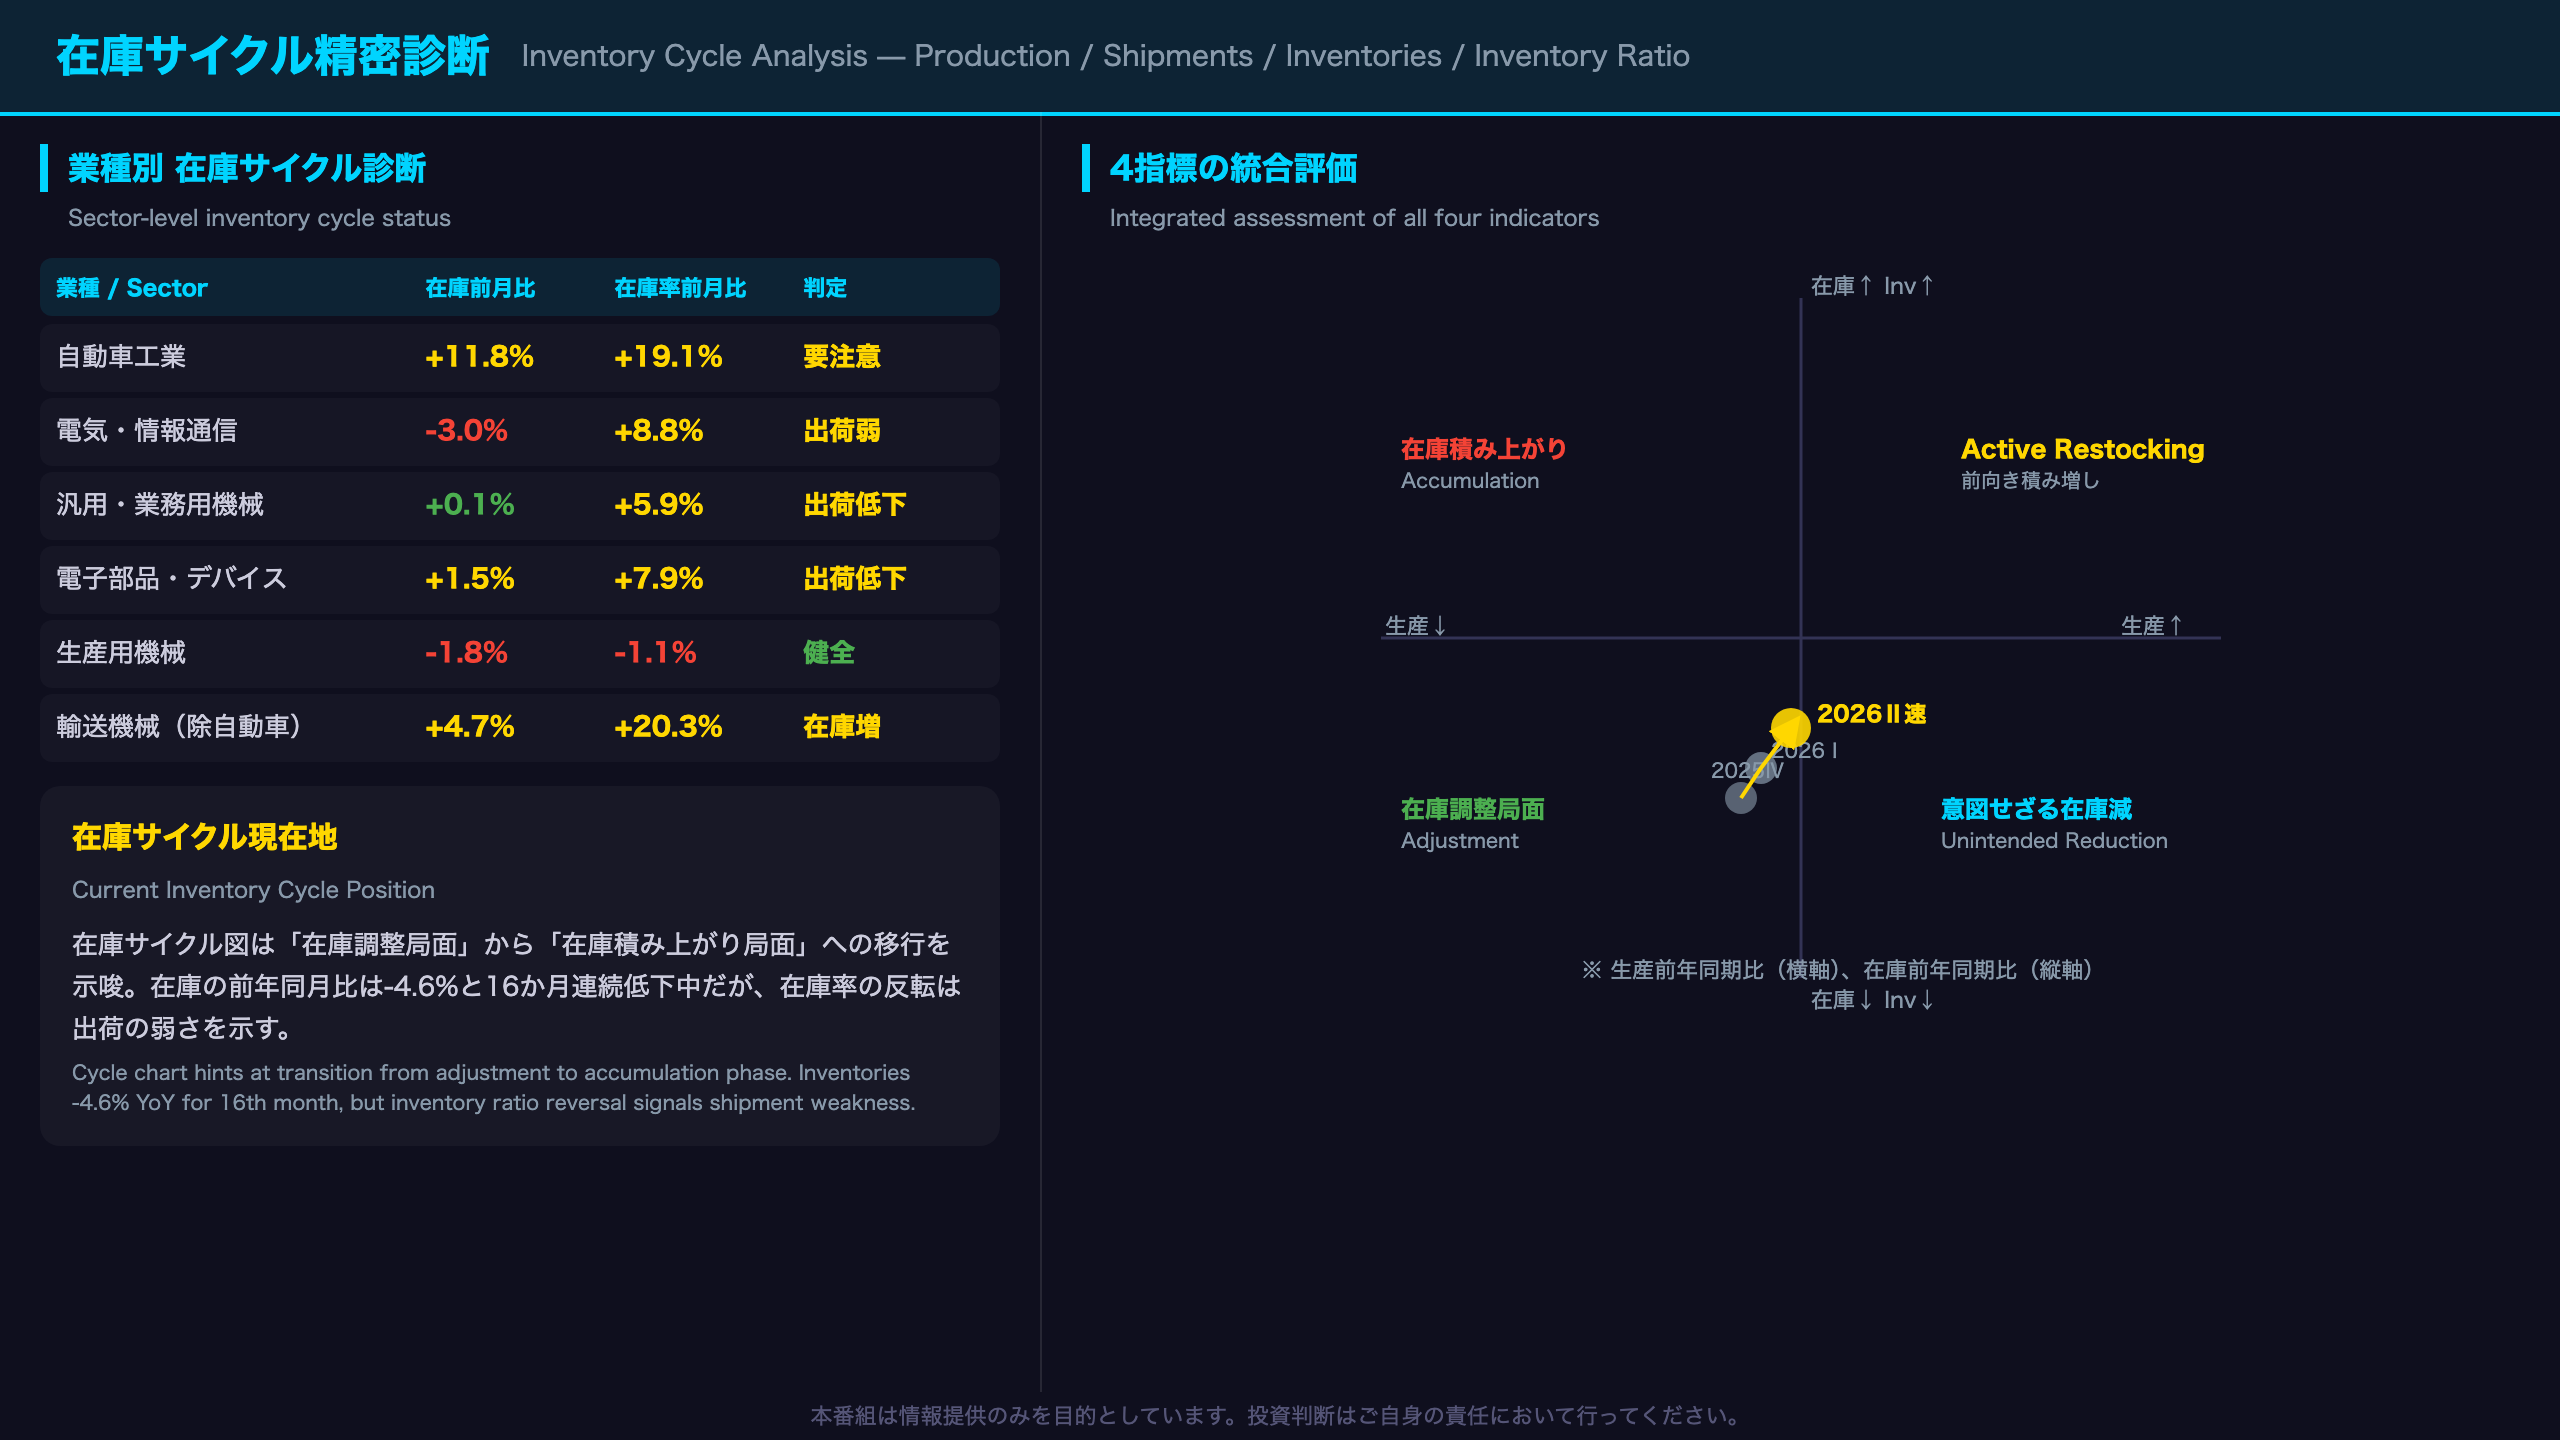
METI’s inventory cycle chart — which plots production YoY on the x-axis against inventory YoY on the y-axis — shows Q2 2026 (preliminary) transitioning from the “inventory adjustment phase” toward the “inventory accumulation phase.” This is a classic cyclical inflection point, though a single quarter’s data is insufficient to confirm a structural shift.
Sector Breakdown: Winners and Losers
Positive contributors:
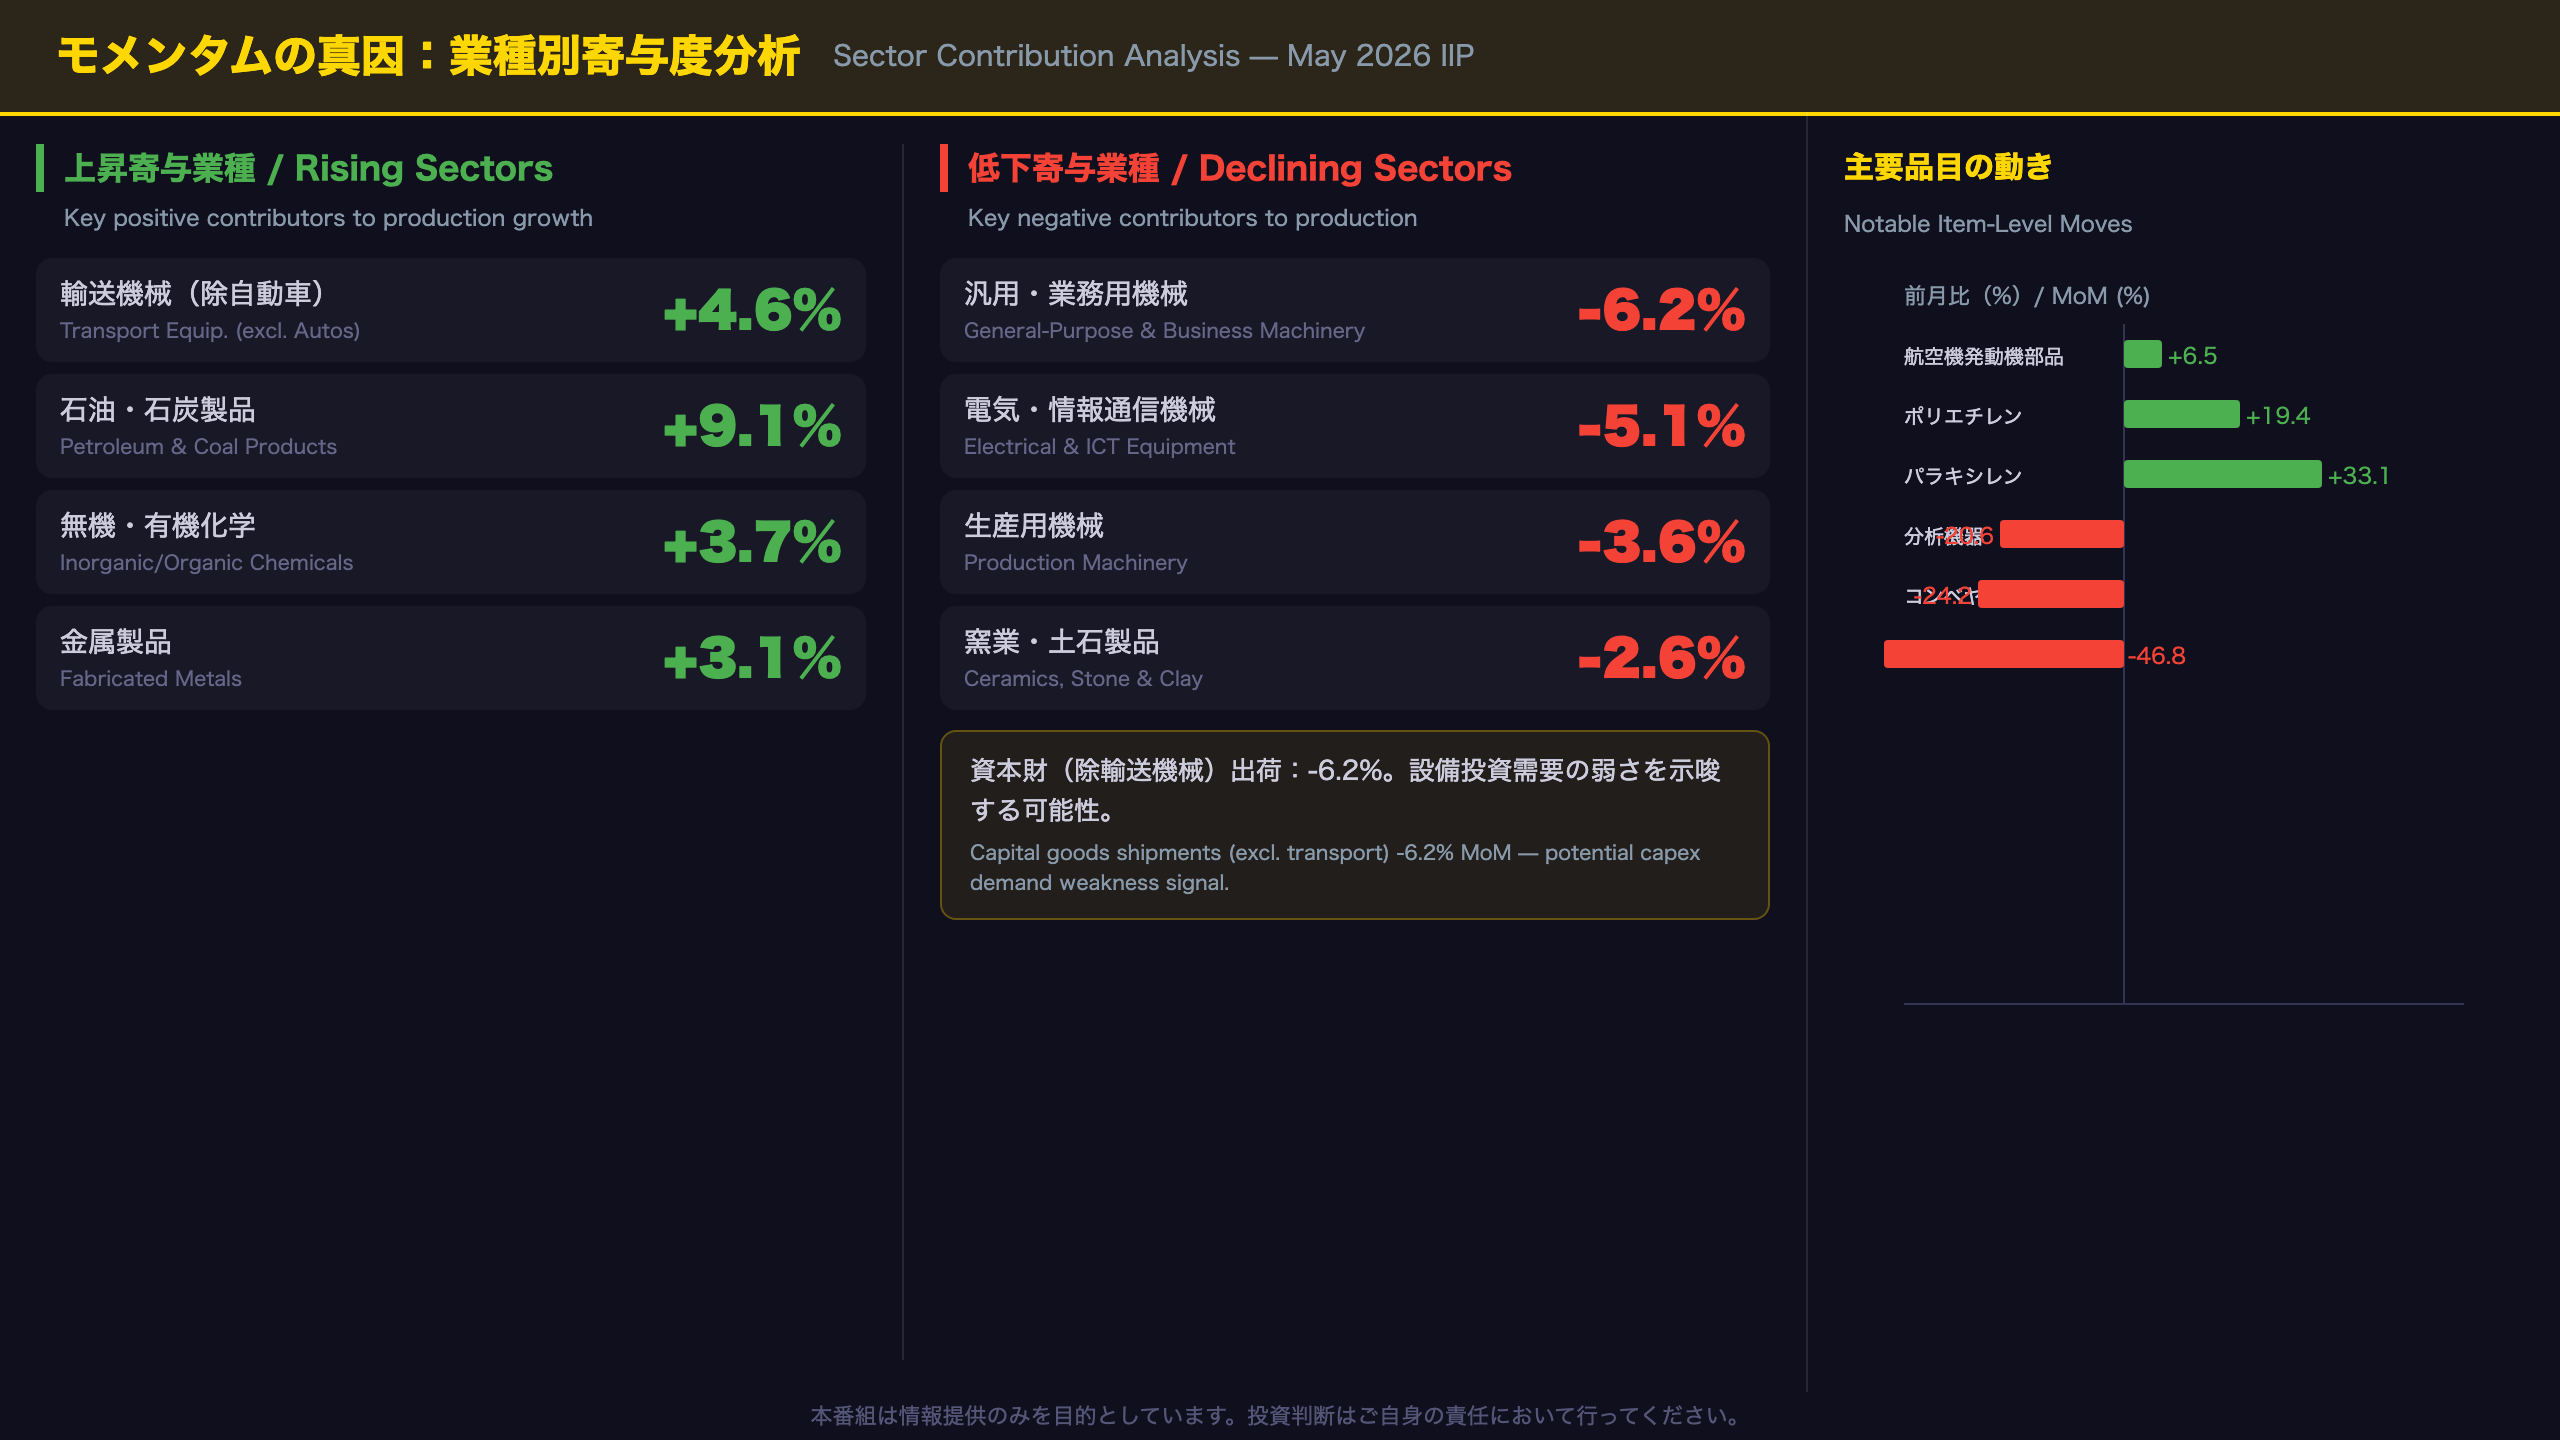
– Transport equipment (excl. motor vehicles): +4.6% — driven by aircraft engine parts (+6.5%)
– Petroleum and coal products: +9.1% — gasoline and kerosene recovery
– Inorganic/organic chemicals: +3.7% — polyethylene and para-xylene rebound
Negative contributors:
– General-purpose and business-oriented machinery: -6.2% — analyzers and conveyors fell sharply
– Electrical and ICT equipment: -5.1% — notebook PCs and semiconductor testers declined
– Production machinery: -3.6% — FPD manufacturing equipment and industrial robots fell
Forward Guidance: June +3.7%, July Flat
The June production forecast of +3.7% is notably bullish, led by production machinery (+12.1%), general-purpose machinery (+16.2%), and electrical/ICT equipment (+8.8%). However, July is forecast at ±0.0%, suggesting the June surge may be a one-month bounce rather than a sustained trend.
The production sentiment DI stands at 3.4 with a trend of -0.7 — well above the -5 threshold that historically signals recession entry. This suggests the current weakness is more consistent with a mid-cycle slowdown than a recessionary downturn.
Market Implications
For Japanese equities, the divergence between machinery sector weakness and the bullish June forecast creates uncertainty. The inventory ratio reversal is a mild negative for cyclical stocks in the near term. For the BOJ, this data is unlikely to accelerate rate hike expectations — the “moving sideways” assessment is consistent with a patient, data-dependent stance.
モメンタムの真因:牽引役と足手まといの解剖
Sector-Level Momentum Analysis: What Really Drove May’s Numbers
Top Positive Contributors
Transport Equipment (excl. Motor Vehicles): +4.6% MoM
– Aircraft engine parts surged +6.5% MoM (+13.8% YoY)
– Steel ship shipments also rose +10.9% MoM
– Defense and aerospace demand continues to provide a structural tailwind
– This sector has been one of the most consistent positive contributors in recent months
Petroleum and Coal Products: +9.1% MoM
– Gasoline: +9.3%, Kerosene: +37.8%
– Largely a rebound from April’s sharp -3.4% decline
– High seasonal volatility makes this sector a noisy signal
Inorganic and Organic Chemicals: +3.7% MoM
– Polyethylene: +19.4%, Para-xylene: +33.1%
– Bounce from April’s -1.8% drop
– However, YoY remains deeply negative at -11.5%, indicating structural weakness
Top Negative Contributors
General-Purpose and Business-Oriented Machinery: -6.2% MoM
– Analytical instruments: -20.6%, Conveyors: -24.2%
– Sharp reversal from April’s +4.4% gain
– Business-oriented machinery inventory ratio rose +13.9% MoM — a warning sign
– This sector is a key proxy for domestic corporate capex demand
Electrical and ICT Equipment: -5.1% MoM
– Notebook computers: -46.8% production, -27.8% shipments
– Semiconductor/IC testers: -16.1%
– ICT equipment inventory ratio surged +8.8% MoM
– The PC market appears to be experiencing a post-demand normalization
Capital Goods Shipments: A Capex Warning?
Shipments of capital goods excluding transport equipment fell 6.2 percent MoM — the largest single-month decline in recent months. In Japan’s economic framework, this category is a direct proxy for corporate capital expenditure. However, April’s +4.8% gain means some of May’s decline is mechanical reversal. The June forecast for this category is +12.7%, which would more than offset May’s drop if realized.
International Context
Japan’s machinery sector weakness mirrors trends seen in Germany’s industrial orders and South Korea’s semiconductor export data, suggesting global capex caution rather than Japan-specific factors. The aircraft/aerospace strength, by contrast, reflects global aviation recovery demand that is likely to persist.
在庫サイクルの精密診断:現在地と次のフェーズ
Inventory Cycle Deep Dive: Four-Indicator Integrated Analysis
Understanding Japan’s Inventory Cycle Framework
Japan’s IIP report includes an inventory cycle chart that plots production YoY (x-axis) against inventory YoY (y-axis). This framework, similar to the Kitchin cycle analysis used globally, identifies four phases:
1. Unintended inventory reduction (production rising, inventories falling) — typically early recovery
2. Active restocking (production rising, inventories rising) — mid-cycle expansion
3. Inventory accumulation (production falling, inventories rising) — late cycle / slowdown
4. Inventory adjustment (production falling, inventories falling) — contraction / trough
Current Position: Q2 2026 (Preliminary)
- Production YoY: approximately -1.7% (negative territory)
- Inventory YoY: approximately -4.6% (negative territory)
This places Japan in the transition zone between the inventory-adjustment phase and the unintended-inventory-reduction phase. The inventory cycle chart in METI’s reference materials shows Q2 2026 moving toward the upper-left quadrant, suggesting a potential shift toward inventory accumulation.
Sector-Level Divergence
The aggregate picture masks significant sector divergence:
Motor Vehicles — Inventory Ratio Surge:
Vehicle inventories rose 11.8% MoM while shipments fell 5.4% MoM, pushing the inventory ratio up 19.1% MoM. On a YoY basis, the vehicle inventory ratio is +20.3% — a structurally elevated level that warrants monitoring.
Electrical/ICT Equipment — Demand Weakness:
Inventories fell 3.0% MoM, but the inventory ratio still rose 8.8% MoM because shipments fell even faster. This pattern is consistent with demand-side weakness rather than supply-side overproduction.
Production Machinery — Healthy Adjustment:
Inventories fell 1.8% MoM and the inventory ratio declined 1.1% MoM — the healthiest dynamic in the report, consistent with ongoing inventory normalization.
Unintended Accumulation vs. Active Restocking?
The critical question is whether the inventory ratio reversal reflects unintended accumulation (demand disappointment) or active restocking (demand anticipation). The bullish June production forecast (+3.7%) and the upward revision to the production sentiment DI suggest the latter is possible. However, the flat July forecast and the weakness in capital goods shipments argue for caution. A definitive answer requires at least two more months of data.
未来へのシグナル:生産予測と設備投資サイクルへの含意
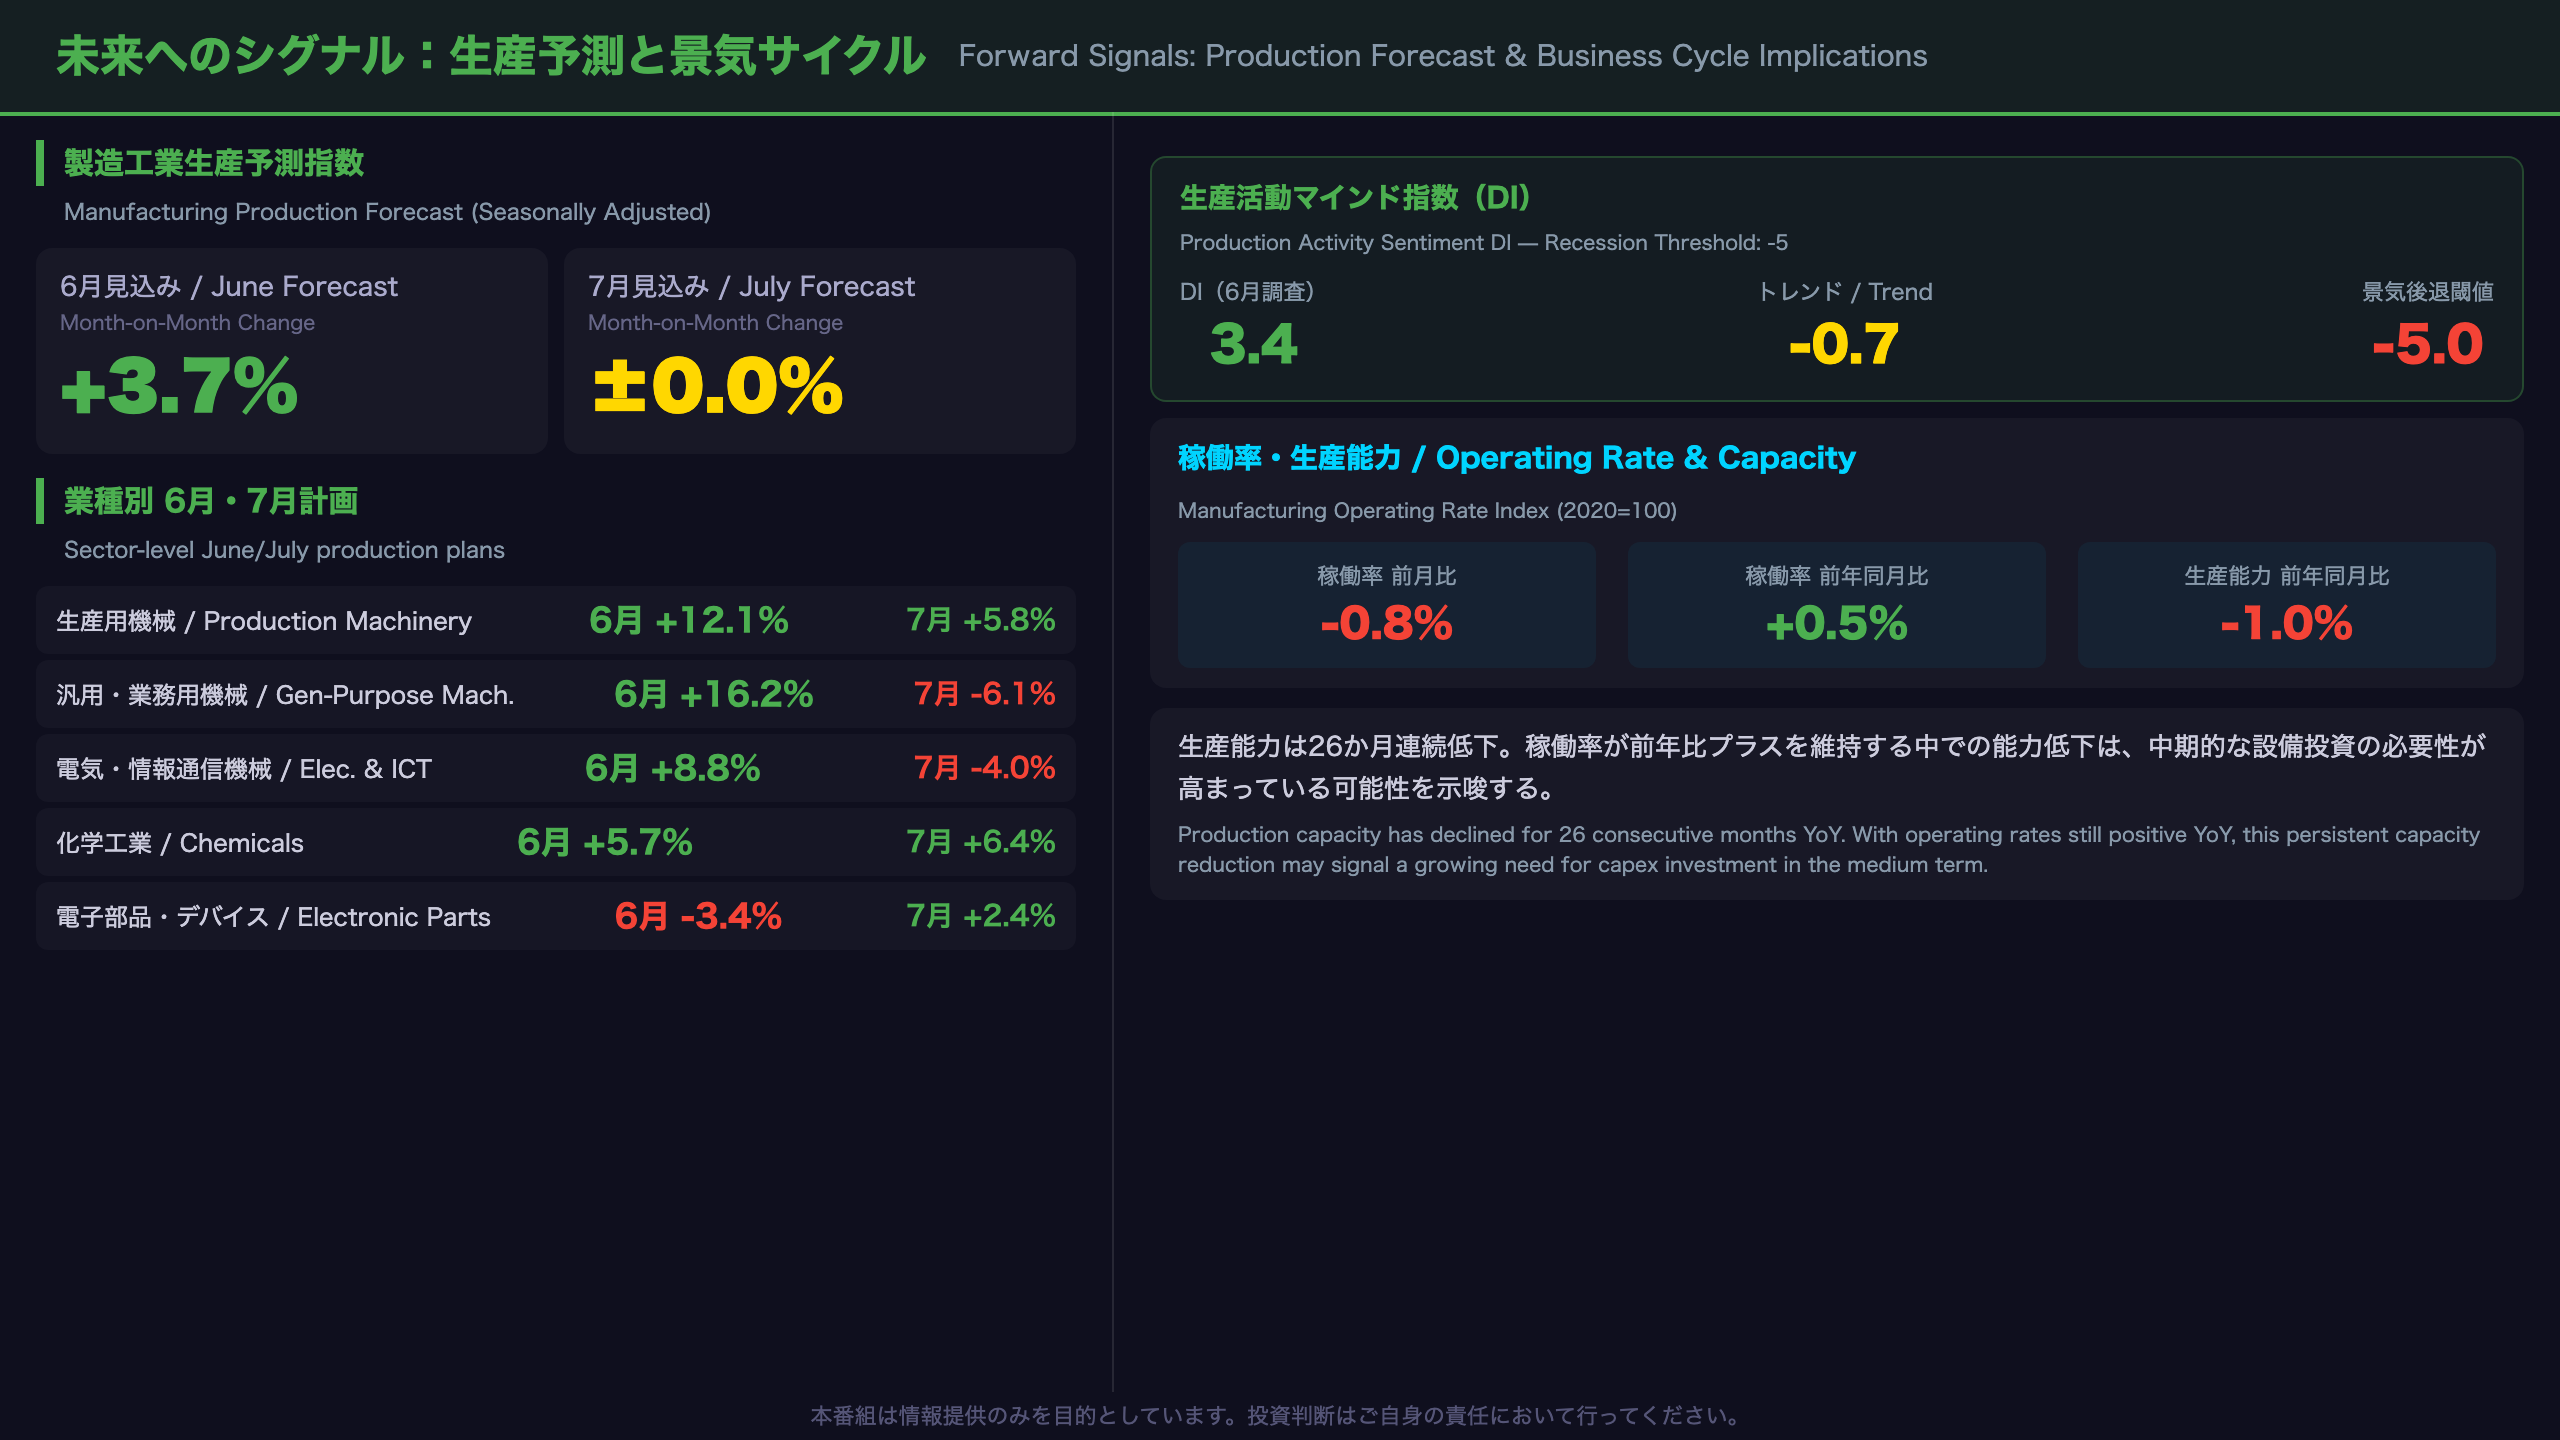
Forward-Looking Signals: Production Forecasts and Business Cycle Implications
June Production Plan: +3.7% — Bullish but Volatile
The June manufacturing production forecast of +3.7% is the strongest monthly plan since early 2026. The key drivers are sectors that fell sharply in May:
– General-purpose and business-oriented machinery: +16.2% (after -6.2% in May)
– Production machinery: +12.1% (after -3.6% in May)
– Electrical and ICT equipment: +8.8% (after -5.1% in May)
This pattern — sharp decline followed by sharp recovery — is characteristic of lumpy order-based industries where production is scheduled in batches. It does not necessarily indicate a structural recovery.
July Forecast: Flat — The Sustainability Question
The July production plan of ±0.0% is the critical data point. If June’s +3.7% were the beginning of a sustained recovery, July would be expected to show continued positive momentum. The flat July forecast suggests the June surge is more likely a catch-up from May’s weakness than the start of a new uptrend.
For capital goods (excl. transport), the July forecast is +3.4% — more encouraging, suggesting some underlying capex demand recovery.
Production Sentiment DI: Above Recession Threshold
METI’s production activity sentiment DI — calculated as the percentage of firms raising production plans minus those cutting plans — stands at 3.4 in the June survey, with a trend of -0.7. The critical threshold is -5: historically, when the trend falls below -5, Japan has been in or entering a recession. The current reading provides meaningful reassurance that the current slowdown is not recessionary.
Operating Rate and Capacity: A Structural Signal
The operating rate fell 0.8% MoM for a third consecutive month but remains +0.5% YoY. More structurally significant: production capacity has declined for 26 consecutive months on a YoY basis. This persistent capacity reduction reflects corporate Japan’s preference for efficiency over expansion — a rational response to demographic headwinds and uncertain demand. However, if demand recovers, the limited capacity buffer could create supply constraints and accelerate capex investment decisions.
BOJ Policy Implications
This IIP report is broadly neutral for BOJ policy. The “moving sideways” production trend is consistent with the BOJ’s patient, data-dependent approach. The inventory ratio reversal is a mild negative, but the recession signal threshold has not been breached. Markets should not expect this data to accelerate the BOJ’s rate normalization timeline.
市場インプリケーション:日本株・円・日銀政策への含意
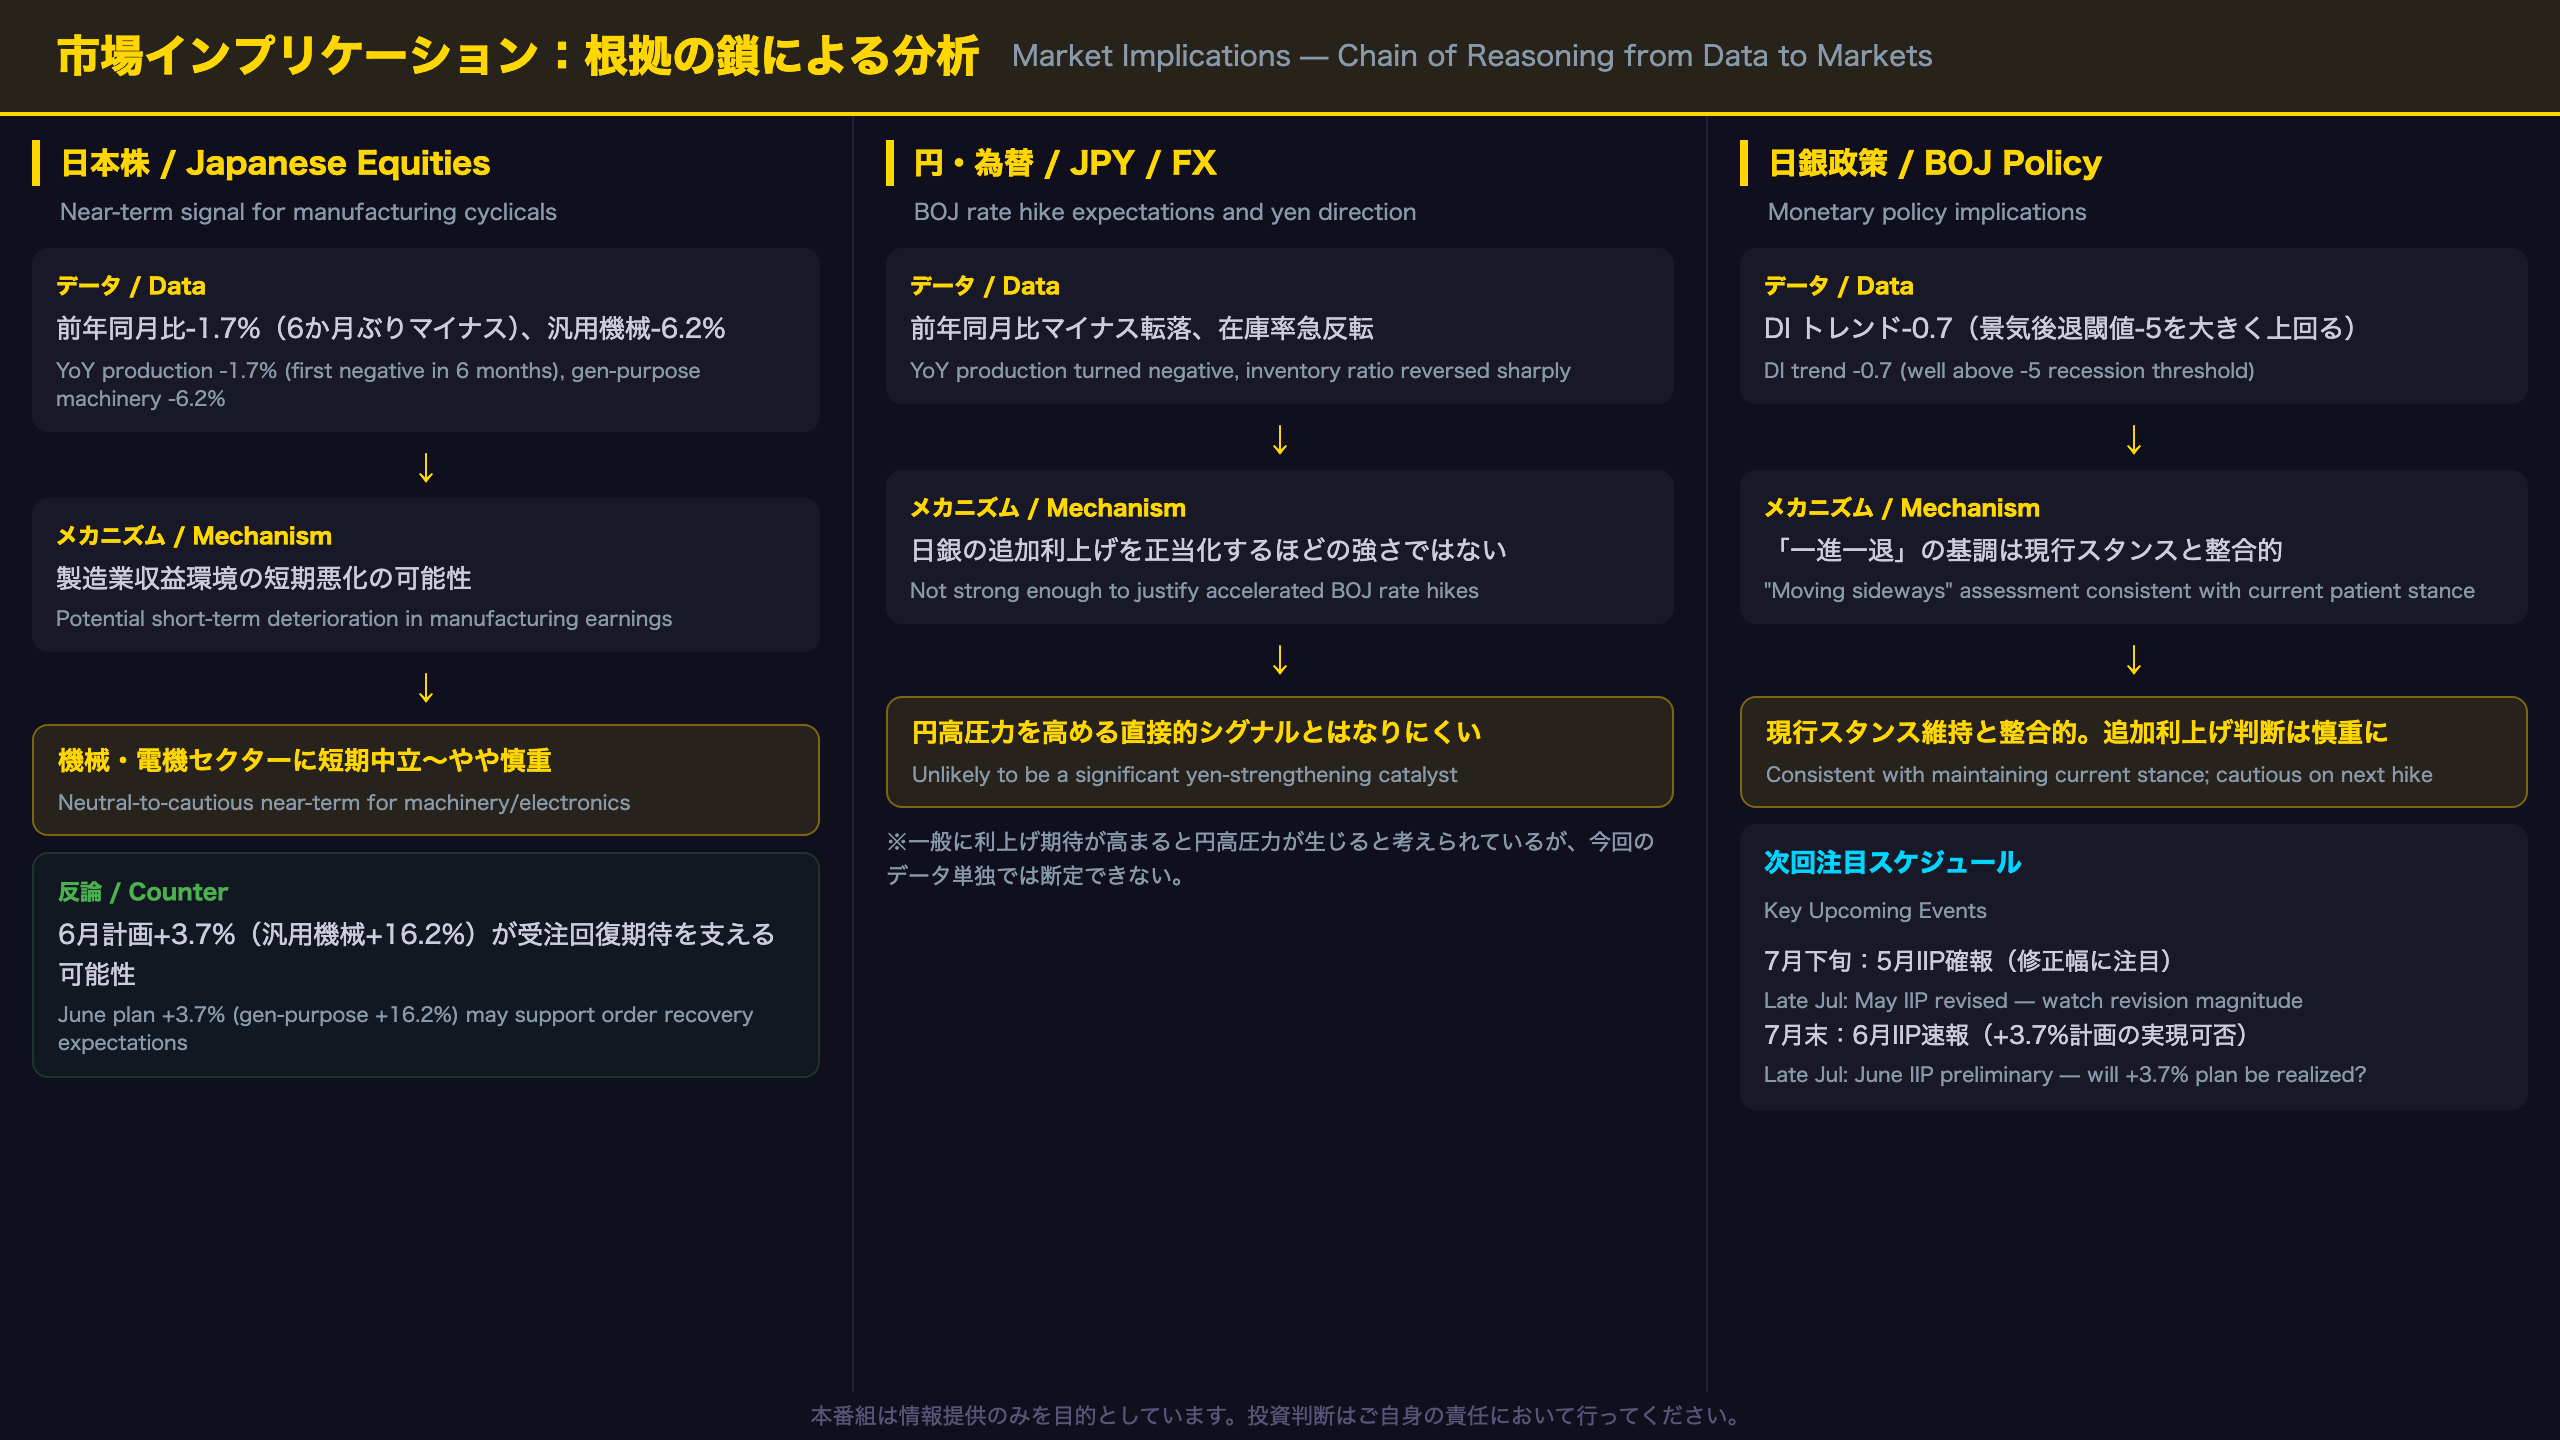
Market Implications: Logical Chain Analysis
Japanese Equities
Chain of reasoning:
“YoY production turned negative at -1.7% for the first time in 6 months, with general-purpose machinery down 6.2%” → “Short-term deterioration in manufacturing earnings environment” → “Neutral-to-cautious near-term signal for manufacturing cyclicals (machinery, electronics sectors)”
Counterbalancing factor:
“June production plan +3.7%, with general-purpose machinery planning +16.2% recovery” → “May’s decline may be temporary” → “Could support expectations of order recovery in machinery and electronics”
Note: It is generally believed that manufacturing production trends lead equity prices by 1-2 months, but this data alone is insufficient to make a definitive call on stock price direction.
Japanese Yen
Chain of reasoning:
“YoY production turning negative and inventory ratio reversal” → “Not strong enough to justify accelerated BOJ rate hikes” → “Unlikely to be a significant yen-strengthening catalyst in isolation”
It is generally believed that rising BOJ rate hike expectations strengthen the yen, but this data alone cannot determine the direction of USD/JPY.
BOJ Monetary Policy
Chain of reasoning:
“Recession signal threshold not breached, METI maintains ‘moving sideways’ assessment” → “Low need for BOJ to change its current patient stance” → “Next rate hike decision likely to remain data-dependent and cautious”
Risk factor:
“Inventory ratio reversal and YoY production turning negative” → “Could make the BOJ more cautious about near-term additional rate hikes”
Key Upcoming Events
- Late July 2026: May IIP revised report — watch for revision magnitude
- Late July 2026: June IIP preliminary — will the +3.7% plan be realized?
- July 2026: BOJ Monetary Policy Meeting — how will production trends factor into the decision?
Broader Context: Japan vs. Global Manufacturing
Japan’s “moving sideways” production trend is broadly consistent with the global manufacturing slowdown seen in PMI data across the US, Europe, and Asia. The relative strength in aerospace/defense and the weakness in consumer electronics and general machinery mirrors global sector trends. This suggests Japan’s current manufacturing softness is more cyclical than structural, which is a modestly positive medium-term signal.
Disclaimer: This article is for informational purposes only. All investment decisions are made solely at your own risk.







