📺 Watch the Full Video Analysis
This article was automatically generated by the NFC Market Live AI analysis system. (Updated: 2026-06-29 09:09 JST)
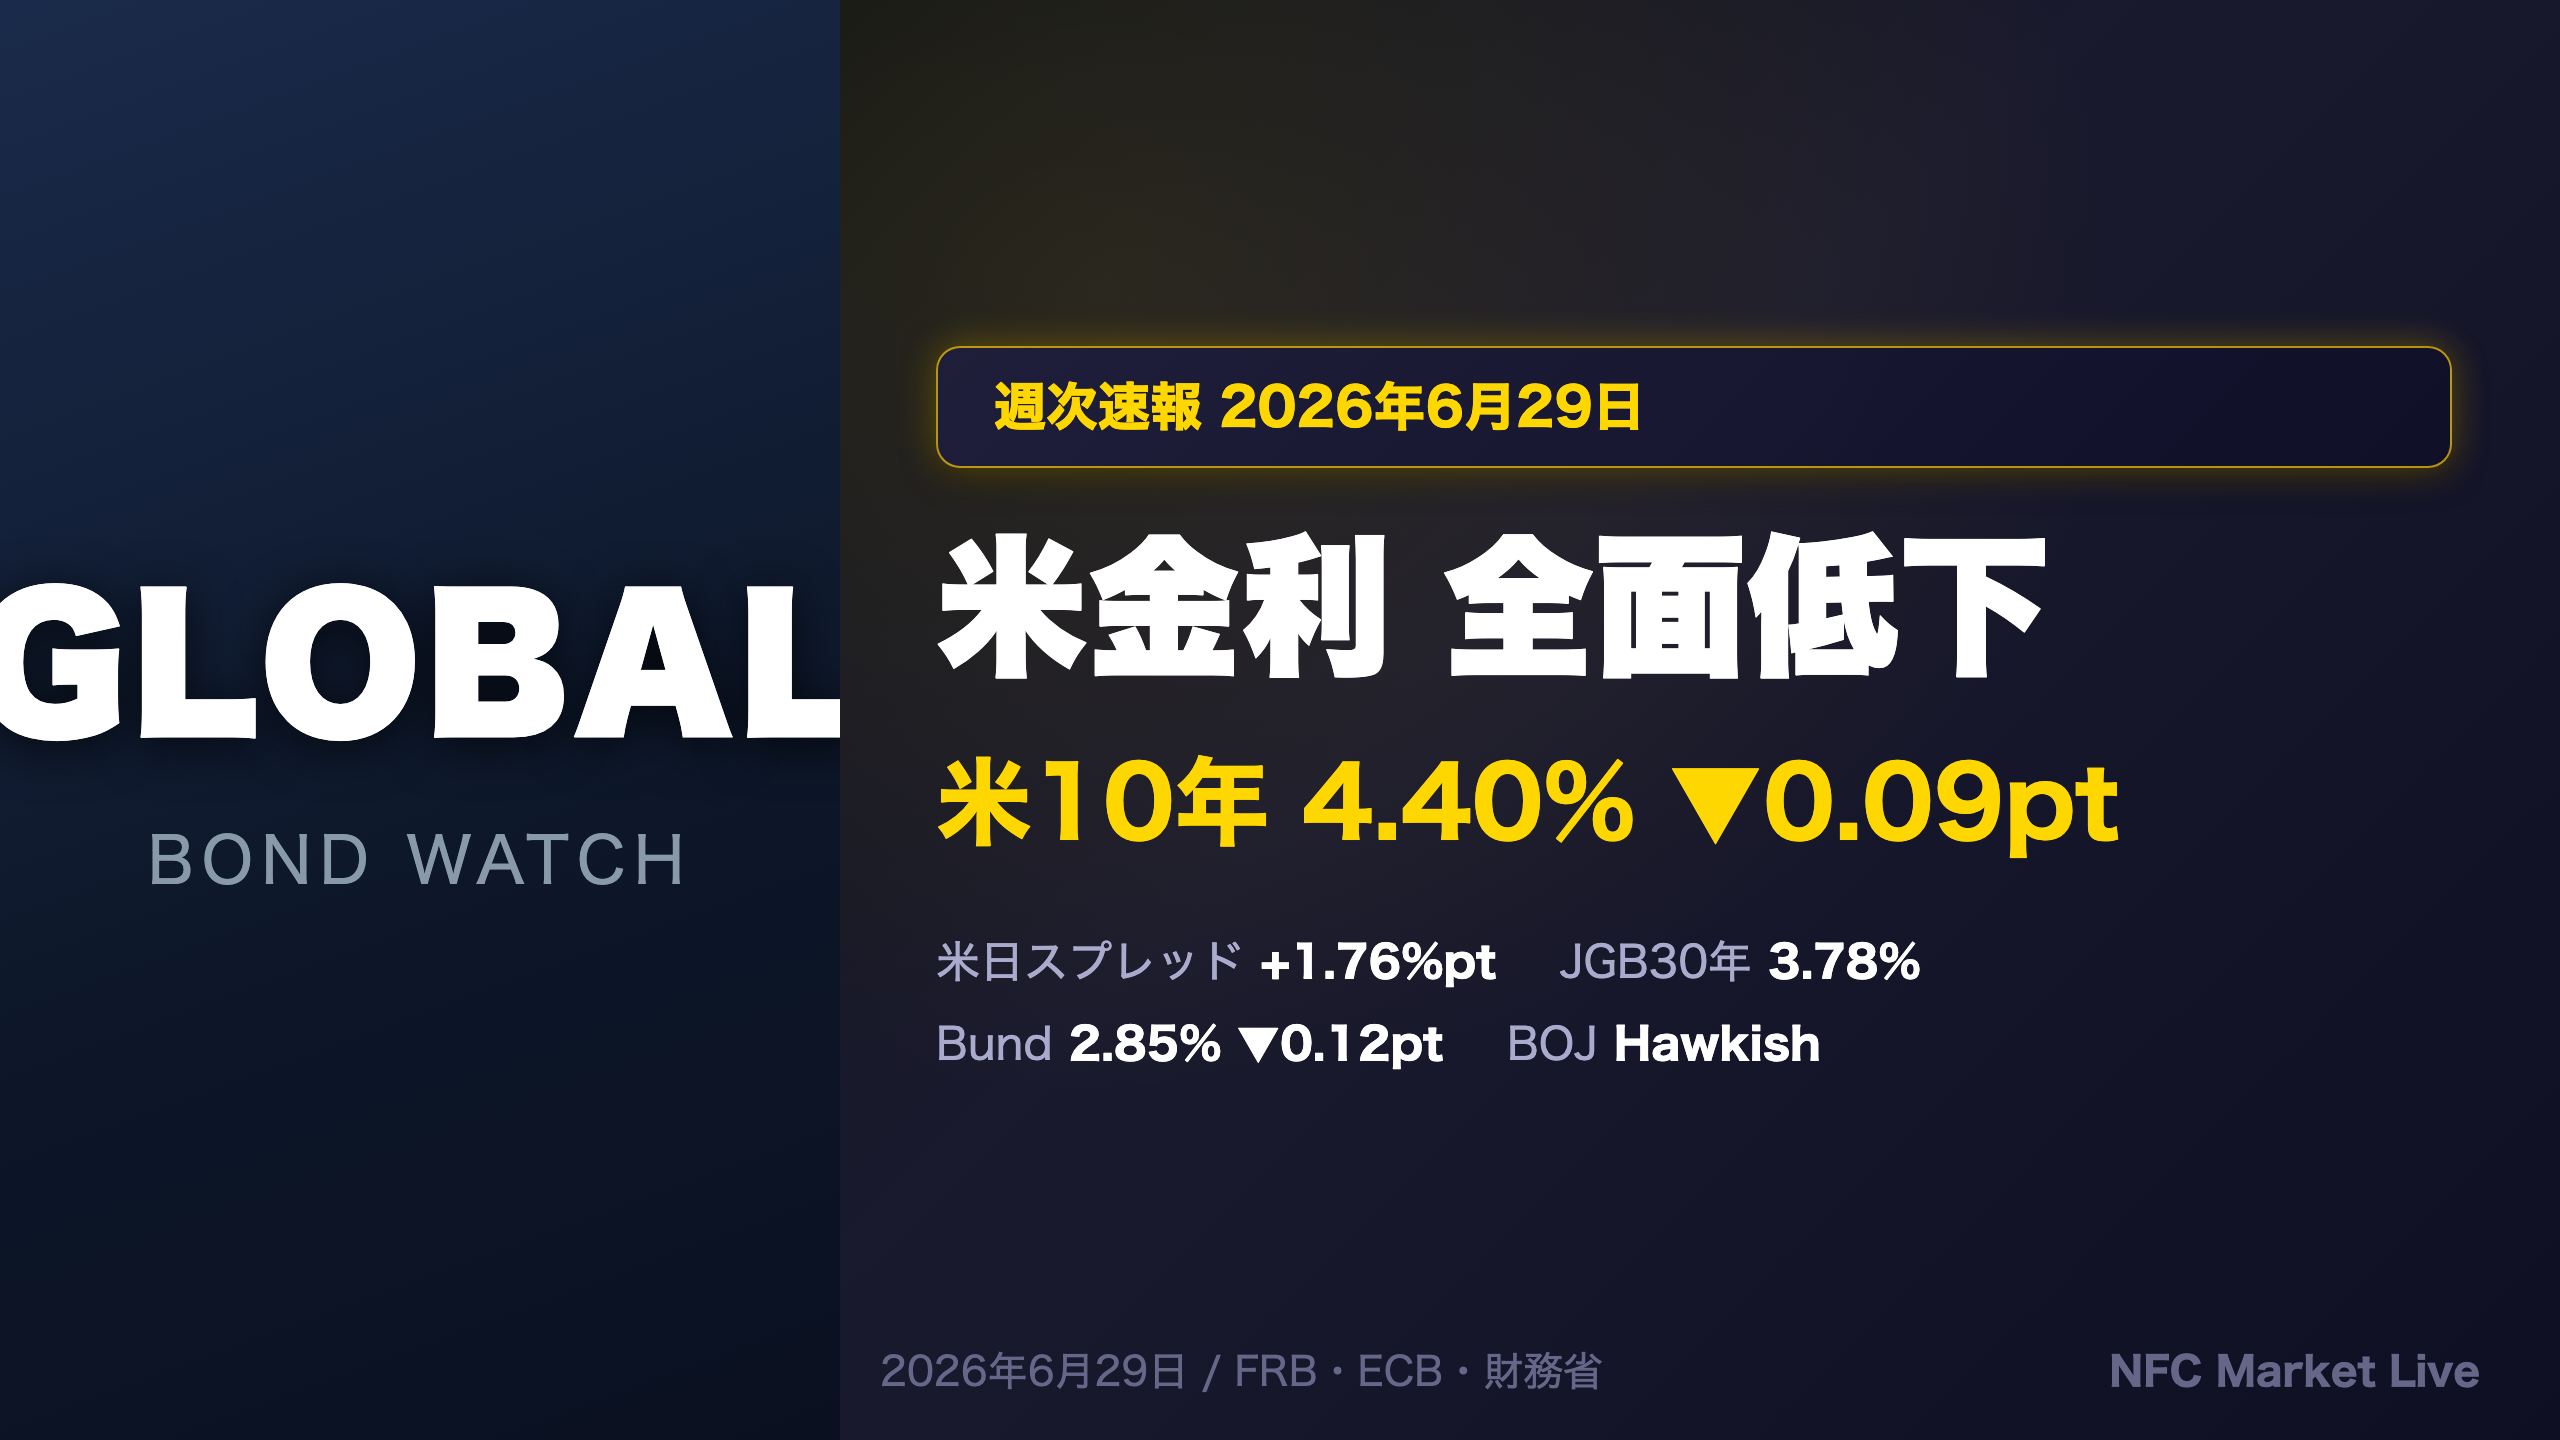
Weekly deep dive into global bond markets as of June 29, 2026. US 10Y yields fell to 4.40%, narrowing the USD/JPY carry spread to 1.76%pt. JGB ultra-long (30Y at 3.78%) remains elevated as BOJ stays in Hawkish regime. German Bund dropped sharply to 2.85%, widening OAT-Bund spread to 89bps. We also break down NFC HMM regime signals across USD, EUR, GBP, and JPY.
グローバル金利スナップショット(Global Rate Snapshot)
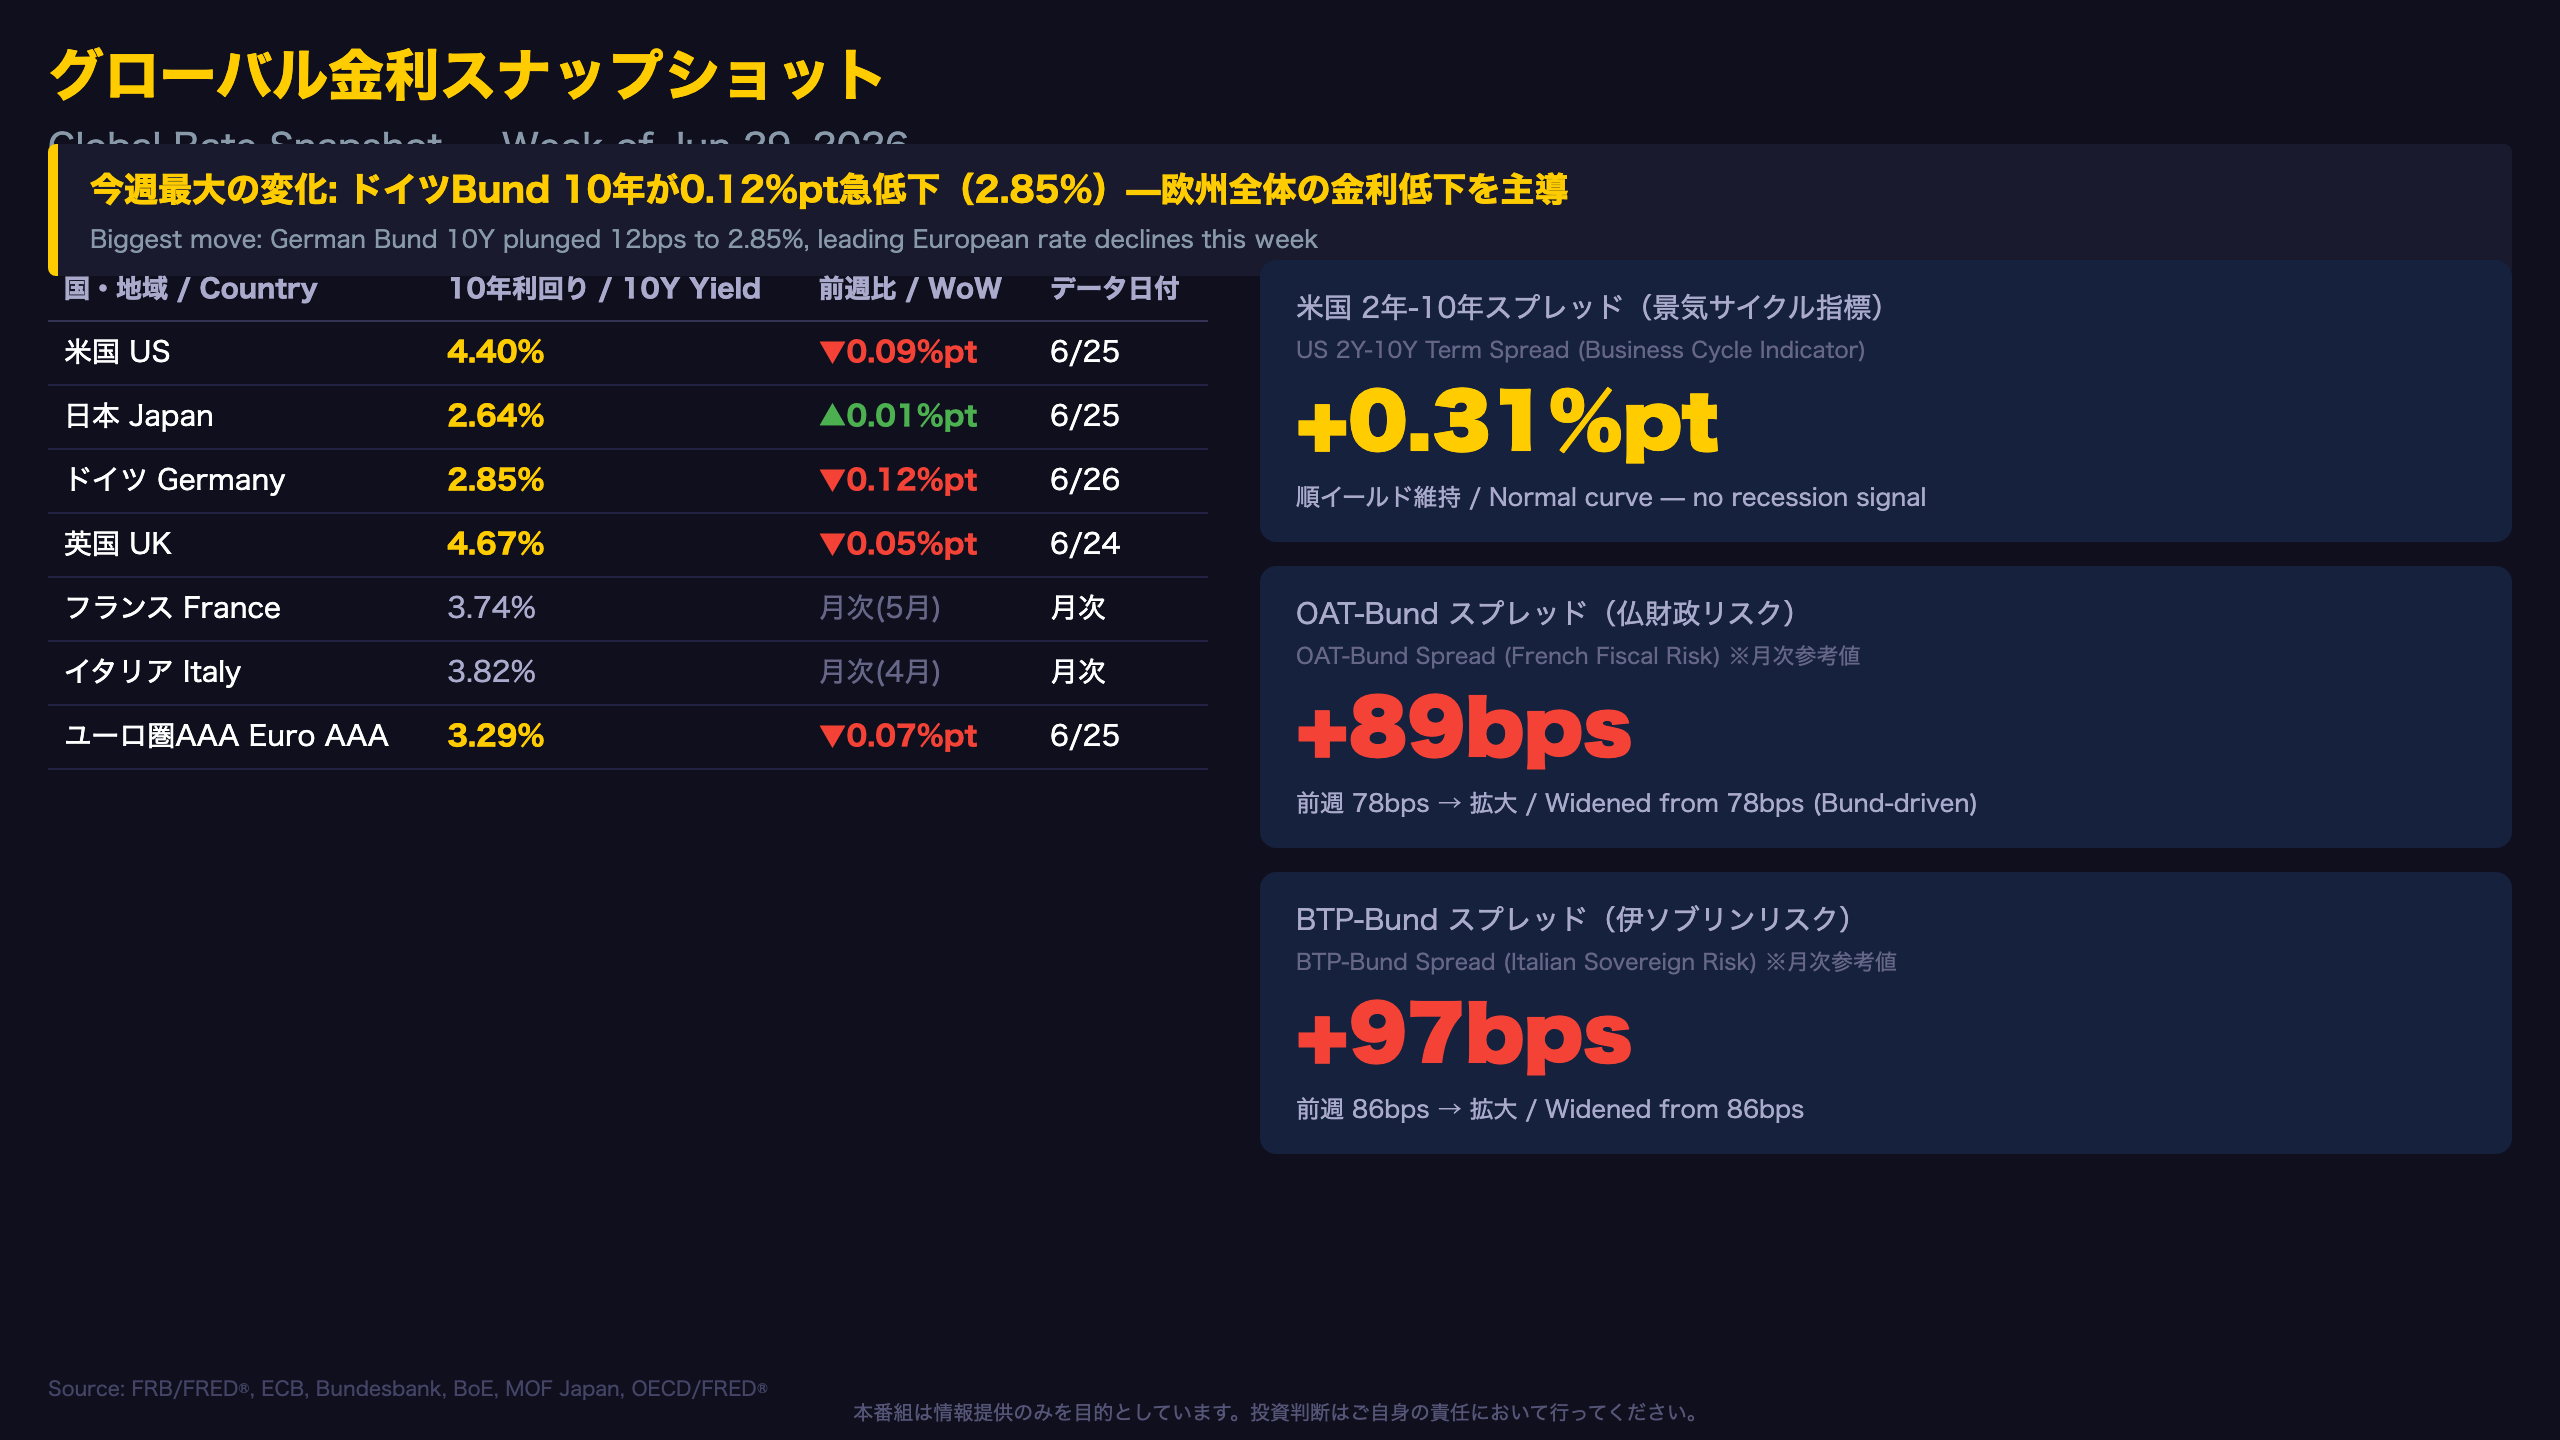
Global Rate Snapshot: Bund Plunges While JGB Ultra-Long Holds Firm
Key 10-Year Yields (as of June 25-26, 2026)
| Country | Yield | WoW Change |
|---|---|---|
| US | 4.40% | -0.09%pt |
| Japan | 2.64% | +0.01%pt |
| Germany | 2.85% | -0.12%pt |
| UK | 4.67% | -0.05%pt |
| France (May data) | 3.74% | — |
| Italy (Apr data) | 3.82% | — |
US Yield Curve: Still Upward Sloping
The US 2-to-10-year spread widened marginally from +0.29%pt to +0.31%pt, maintaining a normal upward slope. Historically, an inverted yield curve (2Y > 10Y) has been a reliable leading indicator of US recessions. The current positive spread suggests no immediate recession signal, though the level remains thin by historical standards.
OAT-Bund Spread Widening: A Bund-Driven Calculation
The OAT-Bund spread widened from 78bps to 89bps this week. However, it is important to note that French OAT data is monthly (latest: May 2026 at 3.74%), so this widening is primarily driven by the sharp decline in Bund yields rather than a rise in French yields. Investors should treat this spread with caution until daily OAT data confirms the move.
Japan’s Ultra-Long Divergence
While US and German yields fell, Japan’s 30-year JGB rose to 3.78% (+0.04%pt WoW). This divergence reflects the Bank of Japan’s ongoing normalization cycle. The US-Japan 10-year spread narrowed from 1.86%pt to 1.76%pt — a development that may gradually reduce the attractiveness of yen carry trades, though a single week’s data is insufficient to confirm a structural shift.
米国債入札 Deep Dive(US Treasury Auction)
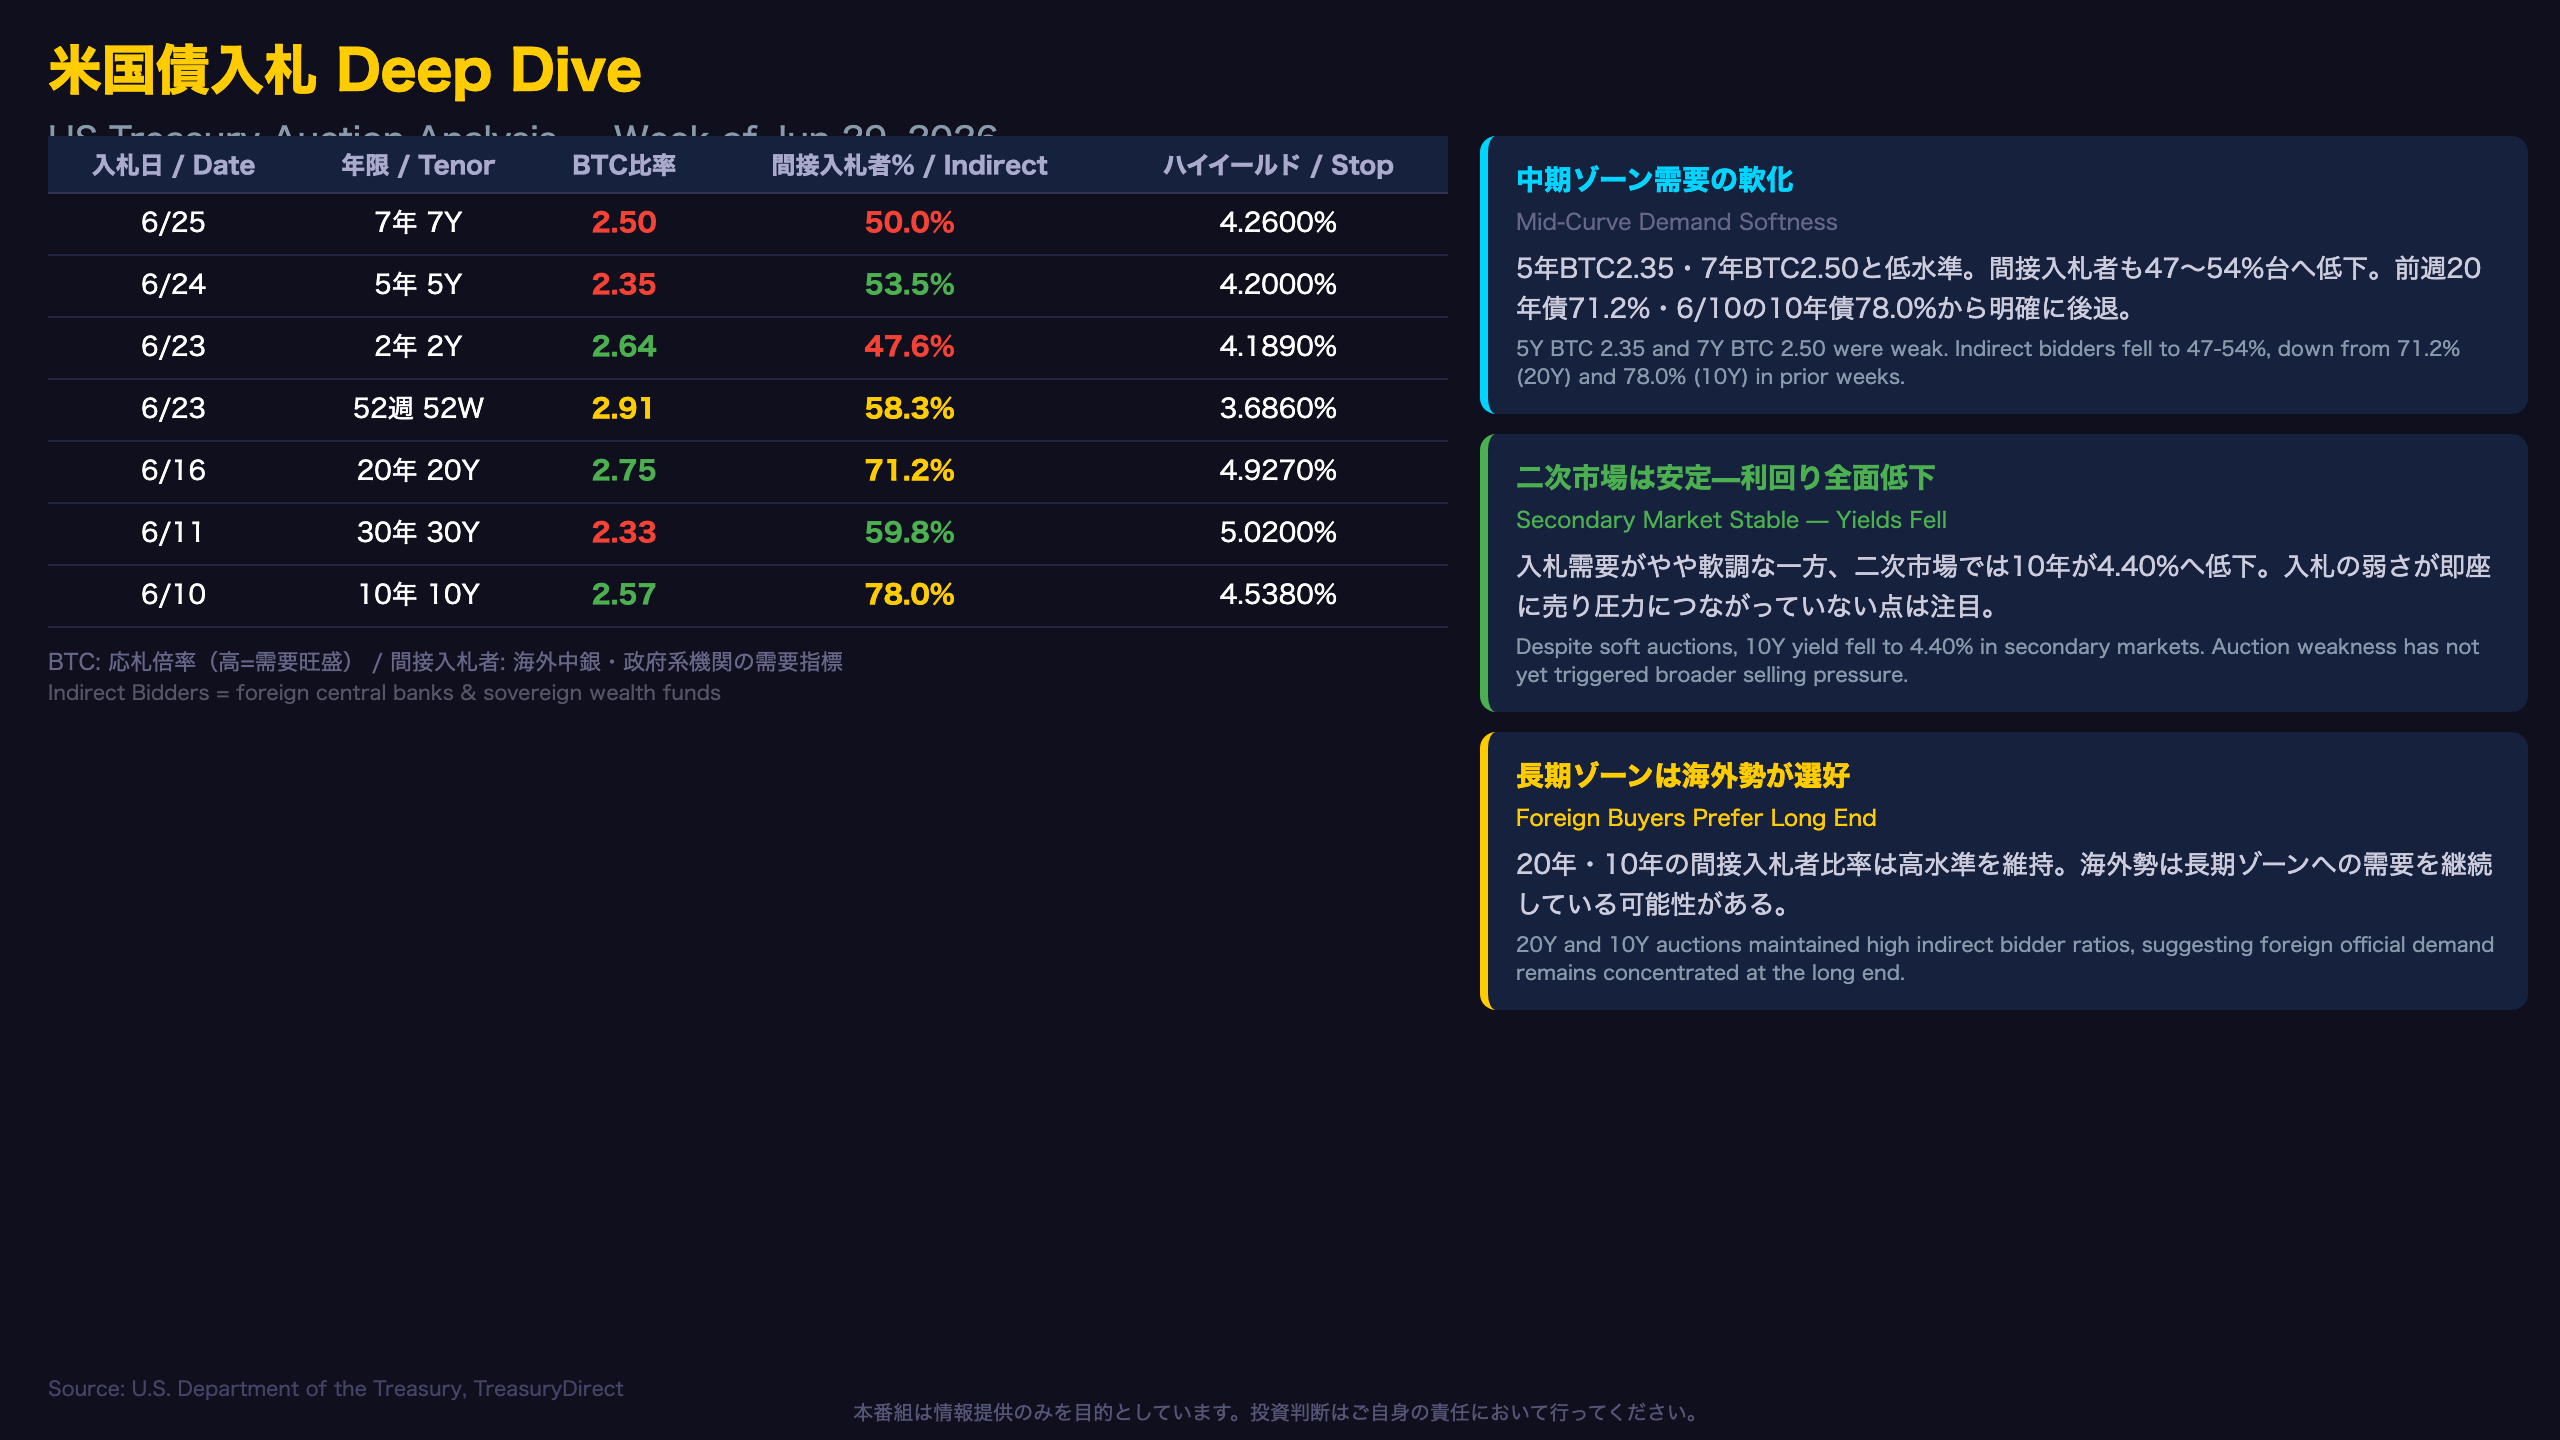
US Treasury Auction Deep Dive: Mid-Curve Demand Softens, Foreign Buyers Pull Back
Key Auction Results (Past 3 Weeks)
| Date | Tenor | BTC | Indirect % | Stop-Out Yield |
|---|---|---|---|---|
| Jun 25 | 7Y | 2.50 | 50.0% | 4.2600% |
| Jun 24 | 5Y | 2.35 | 53.5% | 4.2000% |
| Jun 23 | 2Y | 2.64 | 47.6% | 4.1890% |
| Jun 16 | 20Y | 2.75 | 71.2% | 4.9270% |
| Jun 11 | 30Y | 2.33 | 59.8% | 5.0200% |
| Jun 10 | 10Y | 2.57 | 78.0% | 4.5380% |
What Are Indirect Bidders?
In US Treasury auctions, “indirect bidders” is a category that primarily captures demand from foreign central banks and sovereign wealth funds, typically routed through primary dealers. A high indirect bidder percentage signals strong foreign official demand for US government debt — a key indicator of global confidence in US fiscal credibility.
Observation 1: 5-Year BTC at 2.35 — Weakest of the Week
The June 24th 5-year note auction posted a BTC of just 2.35, the lowest among this week’s coupon auctions. The 5-year sector is particularly sensitive to Federal Reserve rate expectations. Uncertainty around the timing of Fed rate cuts may be dampening demand in this maturity bucket. However, a single auction result is insufficient to confirm a structural demand shift.
Observation 2: Indirect Bidder Ratios Declined for Short-to-Mid Maturities
Indirect bidder participation fell to the 47-54% range for the 2Y, 5Y, and 7Y auctions — well below the 71.2% seen at the 20-year bond auction and the 78.0% at the 10-year note auction on June 10th. This pattern suggests foreign official buyers may be concentrating demand in longer maturities while reducing exposure to the short-to-mid curve.
Observation 3: Secondary Market Yields Fell Despite Soft Auctions
Despite the softer auction metrics, secondary market yields declined across all maturities. This divergence between auction demand and secondary market pricing suggests the auction weakness has not yet translated into broader selling pressure — though this warrants monitoring in upcoming auctions.
ヨーロッパ債券市場(European Bond Markets)
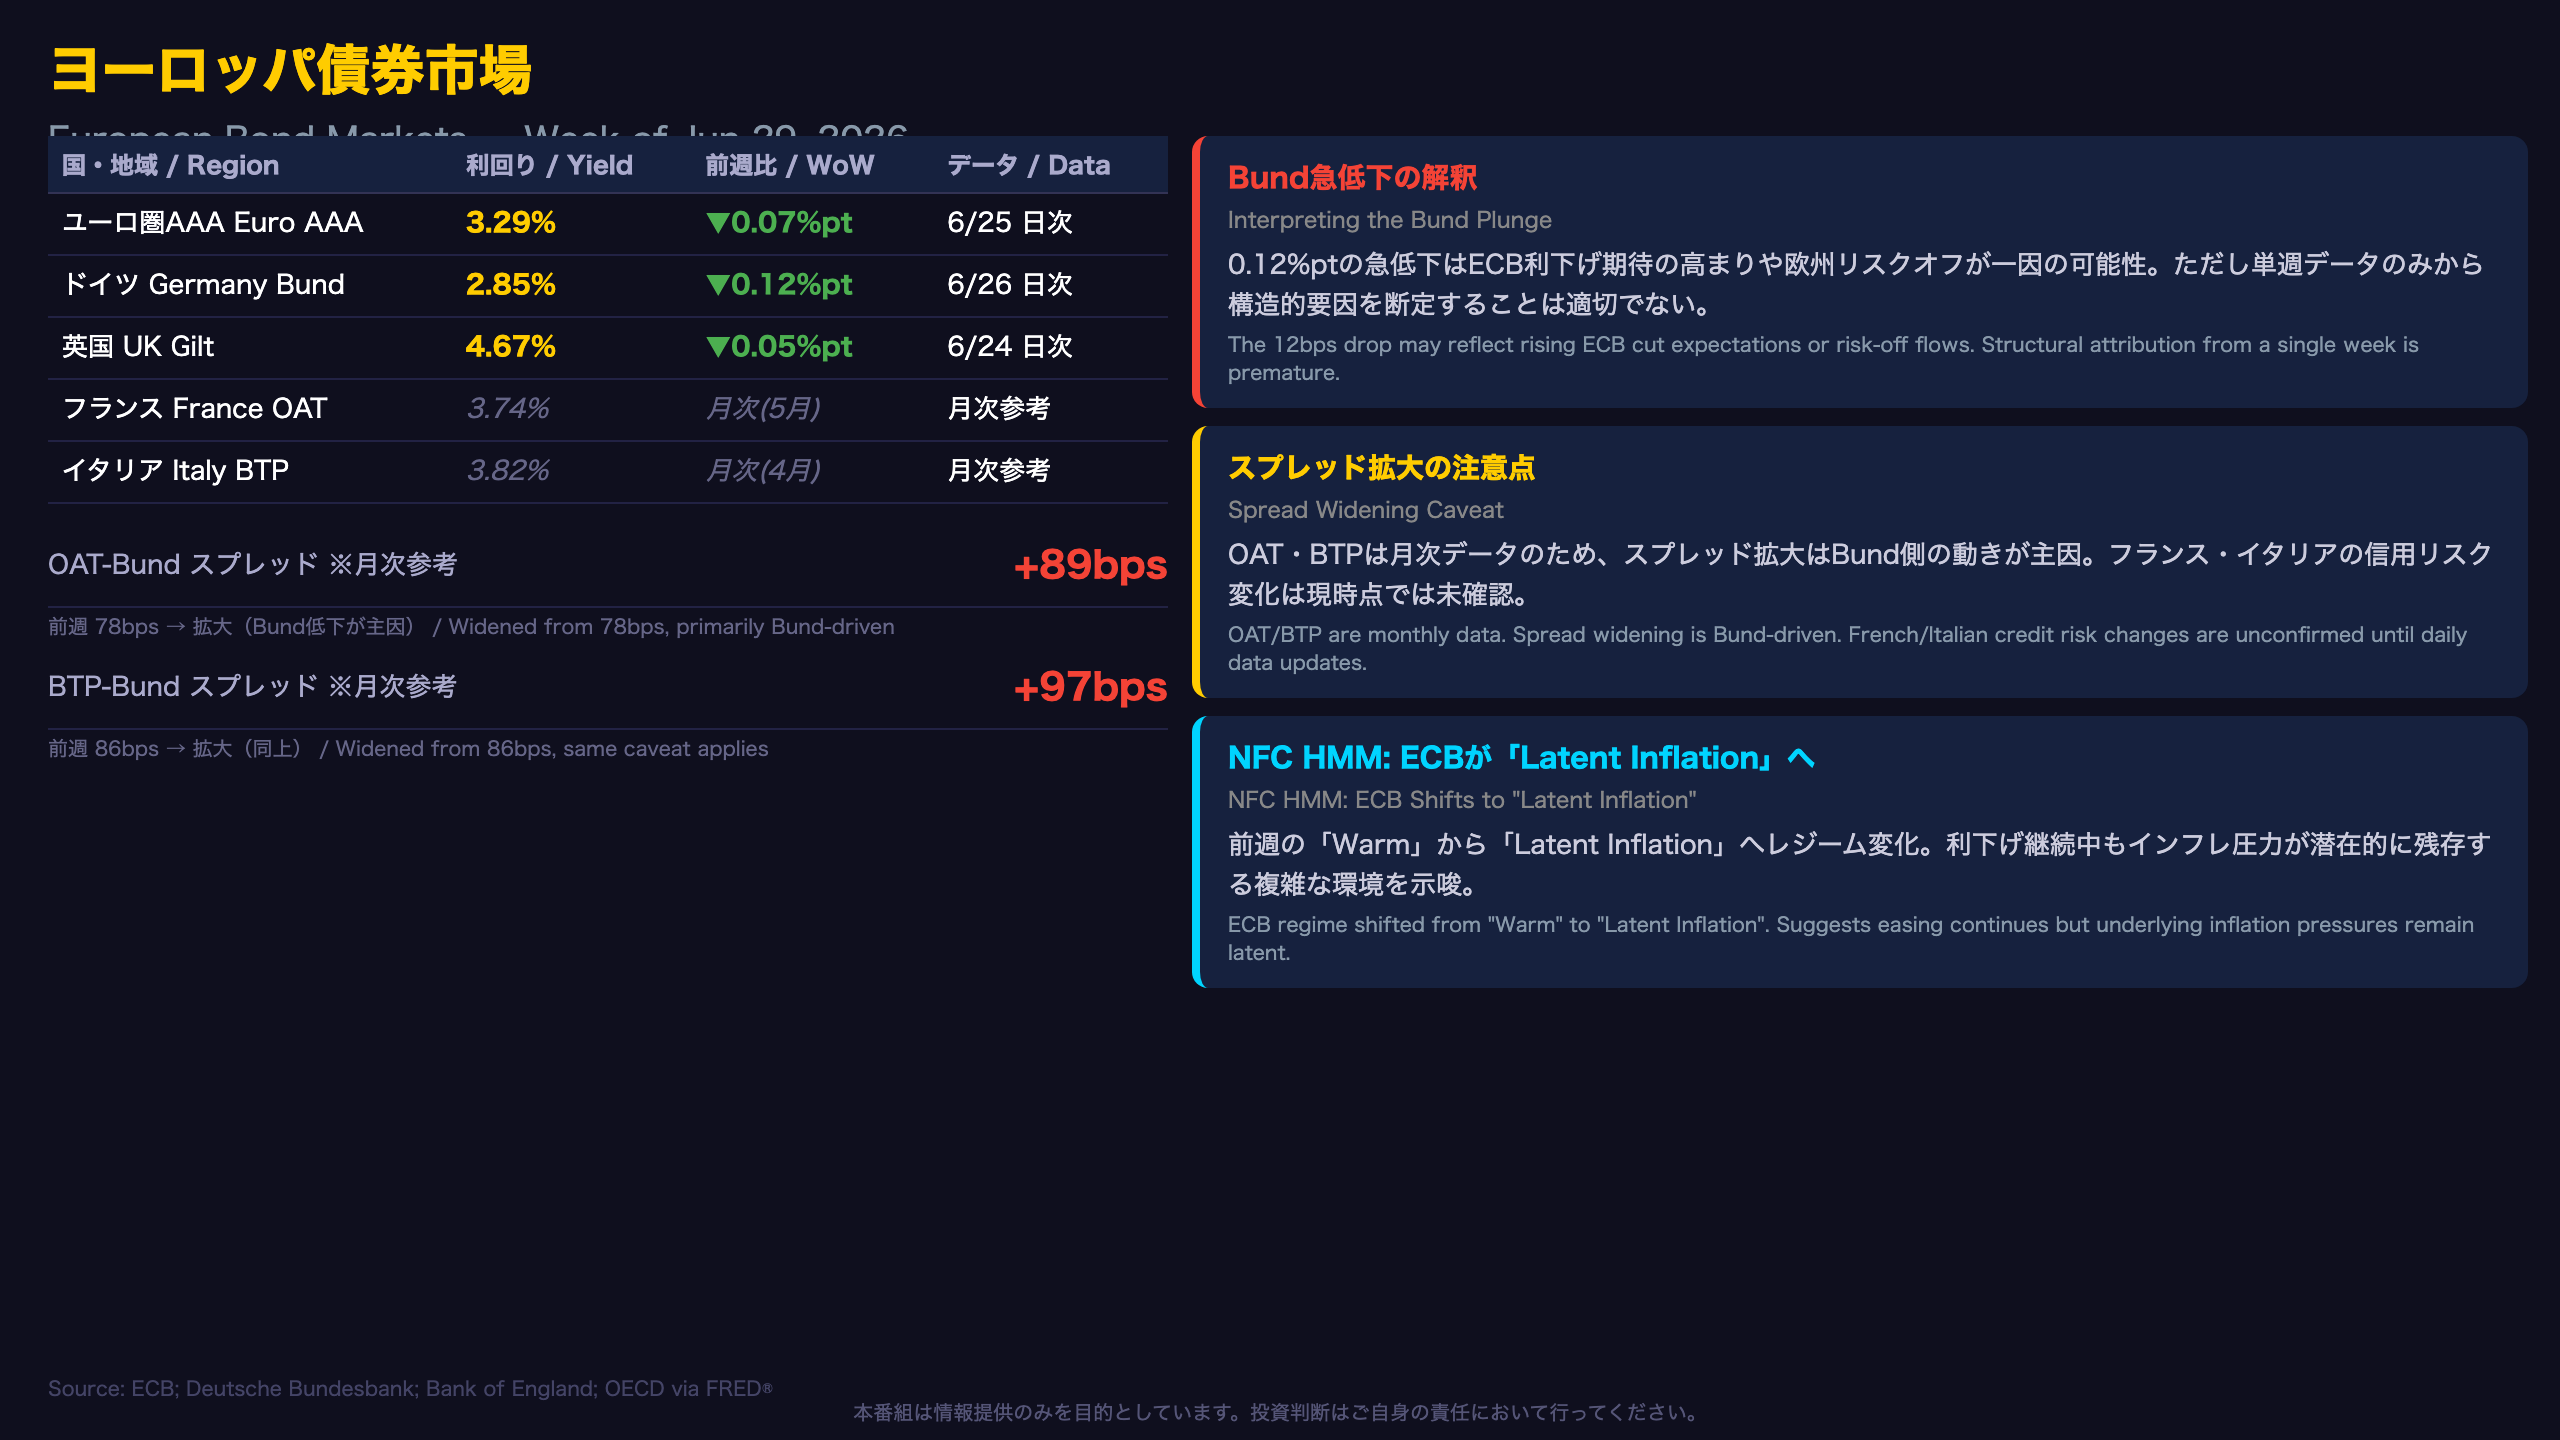
European Bond Markets: Bund Plunge and the Spread Widening Puzzle
Key European Yields
| Region | Yield | Date | WoW Change |
|---|---|---|---|
| Euro Area AAA 10Y | 3.29% | Jun 25 (daily) | -0.07%pt |
| Germany Bund 10Y | 2.85% | Jun 26 (daily) | -0.12%pt |
| UK Gilt 10Y | 4.67% | Jun 24 (daily) | -0.05%pt |
| France OAT 10Y | 3.74% | May (monthly) | — |
| Italy BTP 10Y | 3.82% | Apr (monthly) | — |
Understanding the Bund Drop
The German Bund’s 12 basis point decline was the largest single-week move among major European sovereigns. Possible contributing factors include a broader European risk-off sentiment and rising expectations for additional ECB rate cuts. However, attributing this move to a single structural cause based on one week of data would be premature.
The OAT-Bund Spread: A Bund-Driven Widening
The OAT-Bund spread widened from 78bps to 89bps, but this is primarily a mechanical result of the Bund yield falling sharply while OAT data remains frozen at May’s monthly reading of 3.74%. Investors should not interpret this week’s spread widening as a direct signal of increased French credit risk without confirmation from updated daily OAT data.
NFC HMM Regime Shift: ECB Moves to “Latent Inflation”
A notable development this week is the NFC HMM model’s ECB regime shifting from “Warm” (prior week) to “Latent Inflation” (current week). This regime change is consistent with the Bund yield decline — the model may be capturing a scenario where the ECB continues its easing cycle while underlying inflation pressures remain latent. This is a more nuanced signal than a simple “dovish” or “hawkish” classification.
UK Gilts: Elevated but Easing
UK Gilts at 4.67% remain among the highest 10-year yields in the developed world. The Bank of England’s “Hawkish Pause” regime (confirmed by NFC HMM) reflects the BOE’s cautious stance — acknowledging that inflation has moderated but not yet committing to aggressive rate cuts.
日本国債・日銀政策金利(JGB & BOJ)
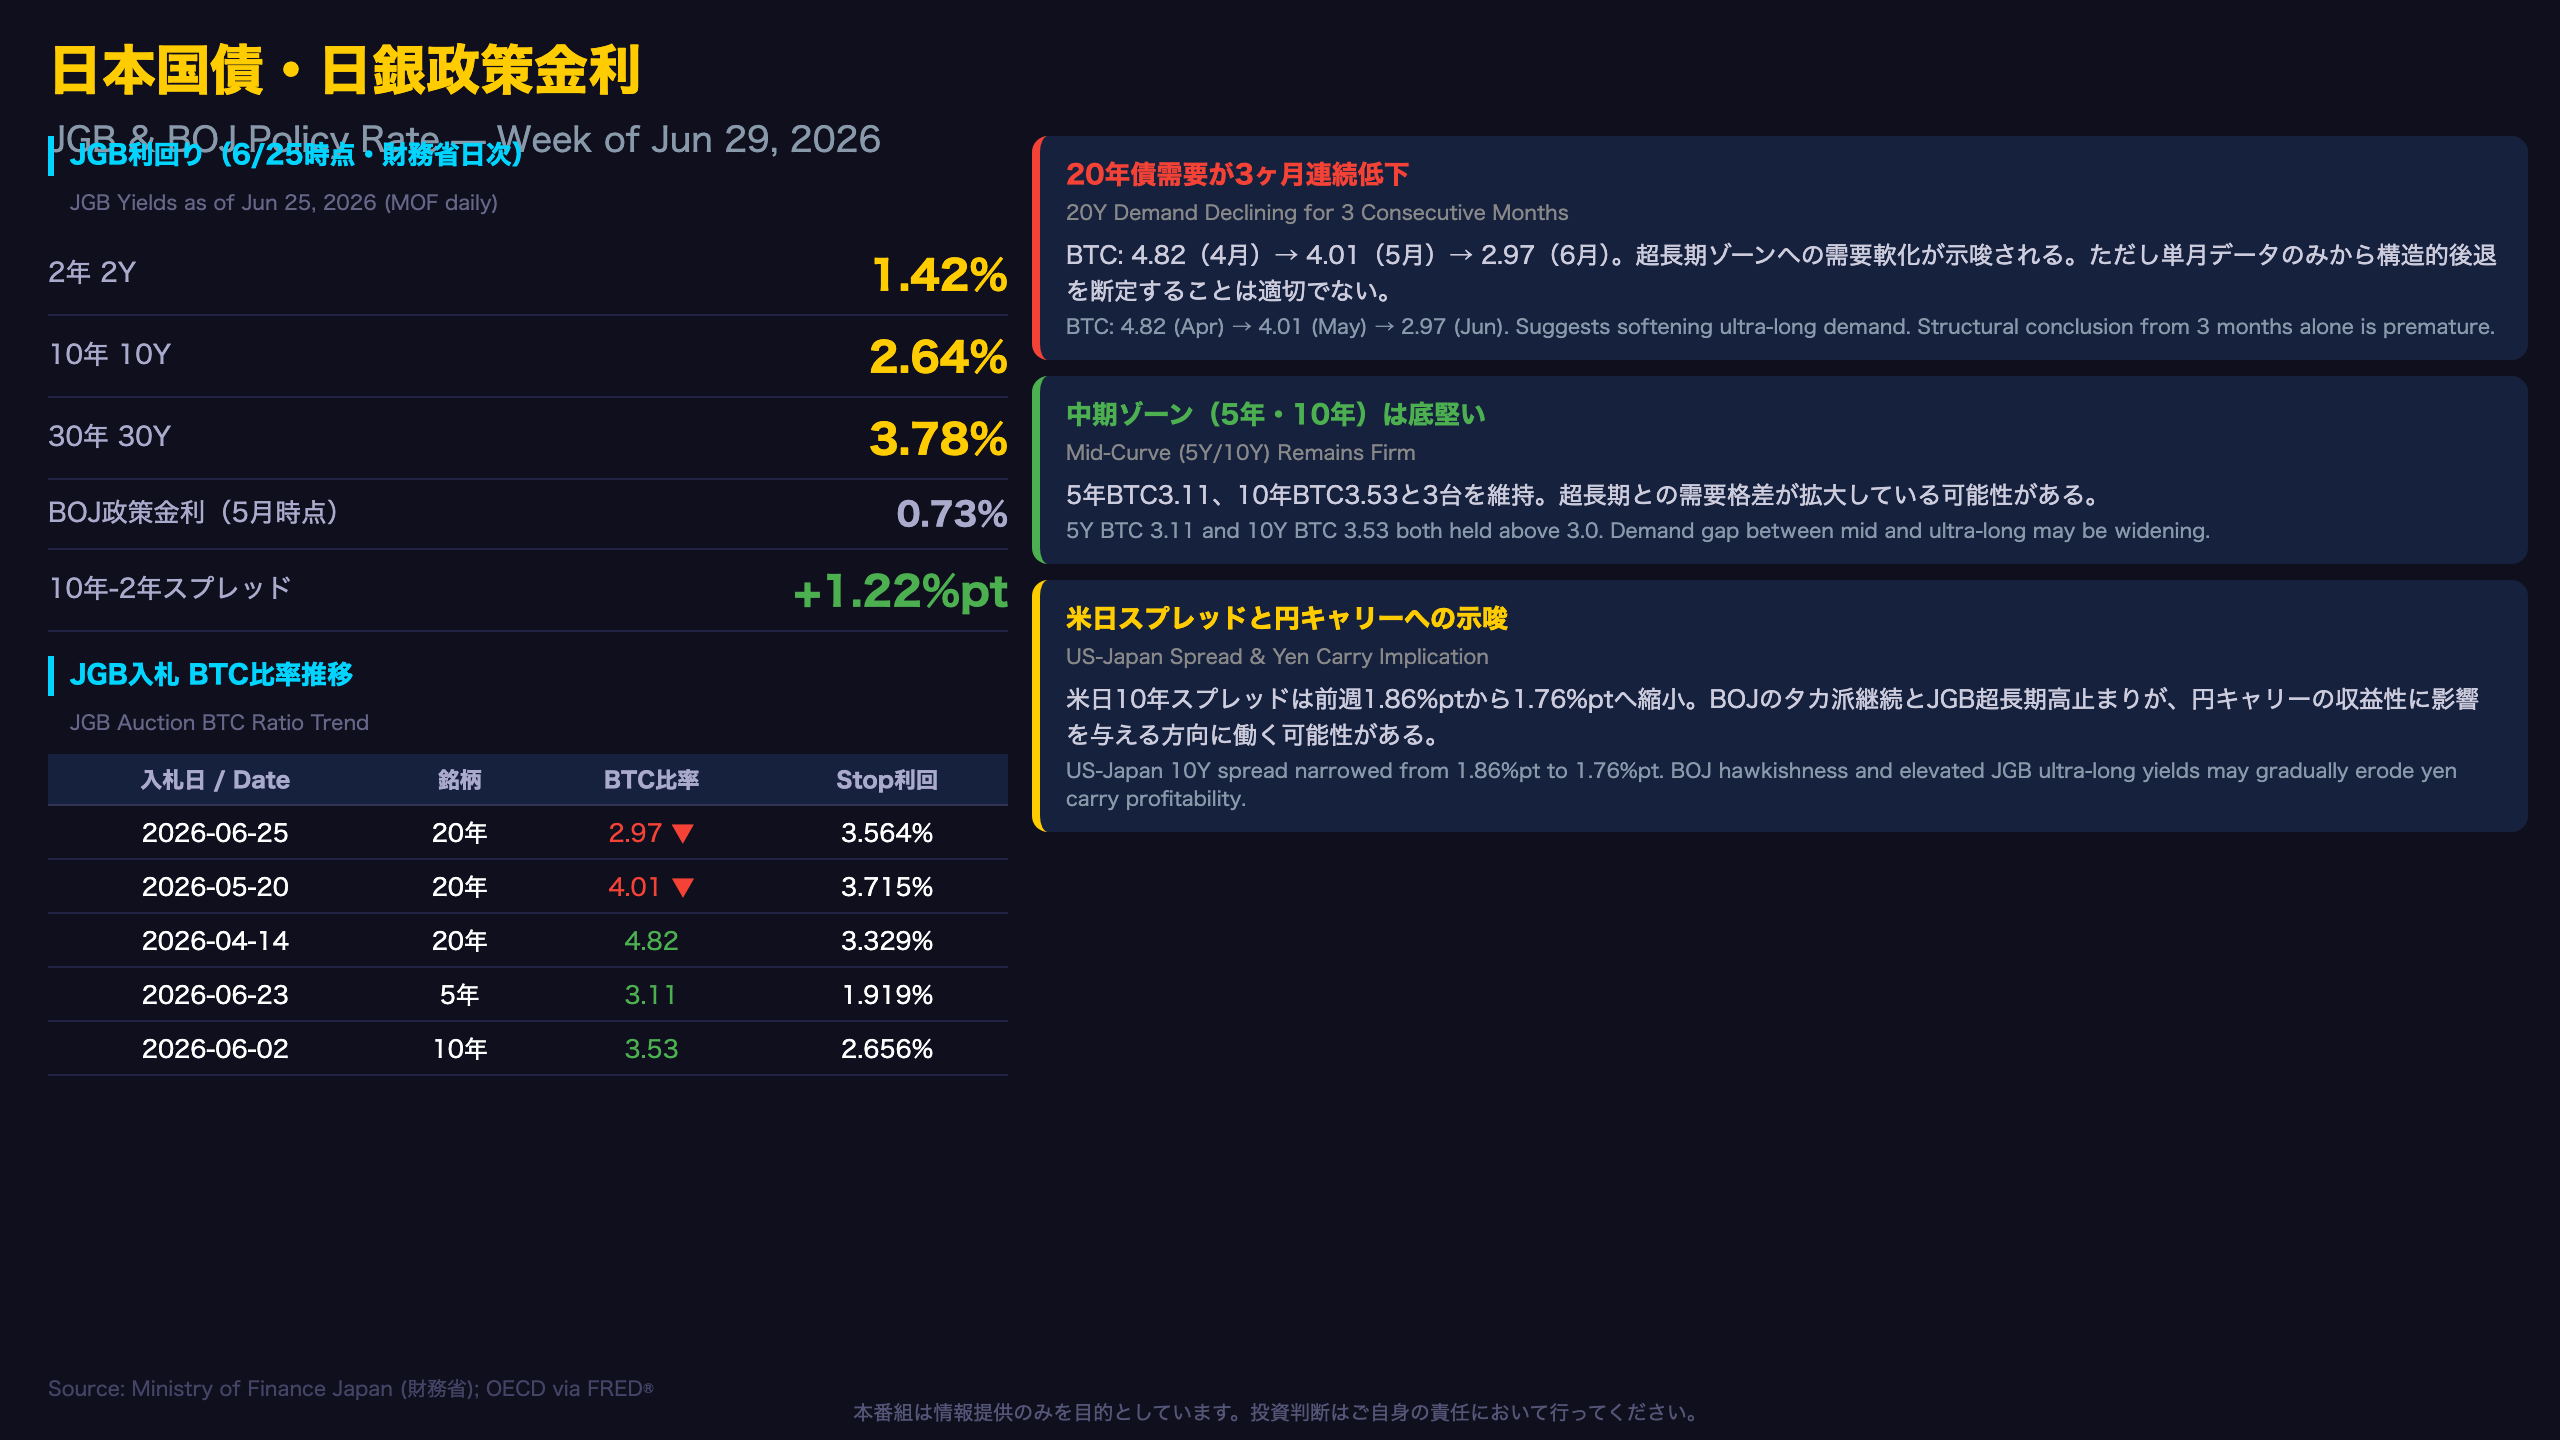
JGB & BOJ: Ultra-Long Demand Softening Amid Ongoing Tightening Cycle
JGB Yields (as of June 25, 2026 — Ministry of Finance daily data)
| Tenor | Yield | WoW Change |
|---|---|---|
| 2Y | 1.42% | +0.02%pt |
| 10Y | 2.64% | +0.01%pt |
| 30Y | 3.78% | +0.04%pt |
| BOJ Policy Rate | 0.73% | May 2026 (OECD monthly) |
JGB Auction Demand: 20-Year Bond Demand Drops Sharply
| Date | Bond | BTC | Avg Yield | Stop Yield |
|---|---|---|---|---|
| Jun 25, 2026 | 20Y | 2.97 | 3.542% | 3.564% |
| May 20, 2026 | 20Y | 4.01 | 3.711% | 3.715% |
| Apr 14, 2026 | 20Y | 4.82 | 3.327% | 3.329% |
| Jun 23, 2026 | 5Y | 3.11 | 1.905% | 1.919% |
| May 18, 2026 | 5Y | 3.22 | 2.024% | 2.034% |
| Jun 2, 2026 | 10Y | 3.53 | 2.649% | 2.656% |
| May 12, 2026 | 10Y | 3.90 | 2.540% | 2.544% |
The 20-year JGB bid-to-cover ratio has declined for three consecutive months: 4.82 in April, 4.01 in May, and 2.97 in June. This trend may suggest gradually softening demand in the ultra-long zone. In contrast, the 5-year and 10-year sectors maintained BTC ratios above 3.0, indicating relatively firm mid-curve demand.
What Is the JGB Auction? (Context for International Readers)
The Japanese Ministry of Finance (MOF) conducts regular competitive auctions for Japanese Government Bonds (JGBs) across various maturities. The bid-to-cover (BTC) ratio measures total bids divided by the amount sold — a higher ratio indicates stronger demand. The “tail” (Stop yield minus average yield) measures demand dispersion; a wider tail signals uneven demand and potential supply-demand imbalance.
Term Spread and BOJ Tightening
The JGB 10Y-2Y term spread stands at +1.22%pt, nearly unchanged from last week’s +1.23%pt. With the BOJ policy rate at 0.73% (May 2026) and the 2-year yield at 1.42%, the market is pricing in approximately 69 basis points of additional tightening beyond the current policy rate — suggesting the market expects further BOJ rate hikes.
FX・CFDへの含意(Trade Implications)
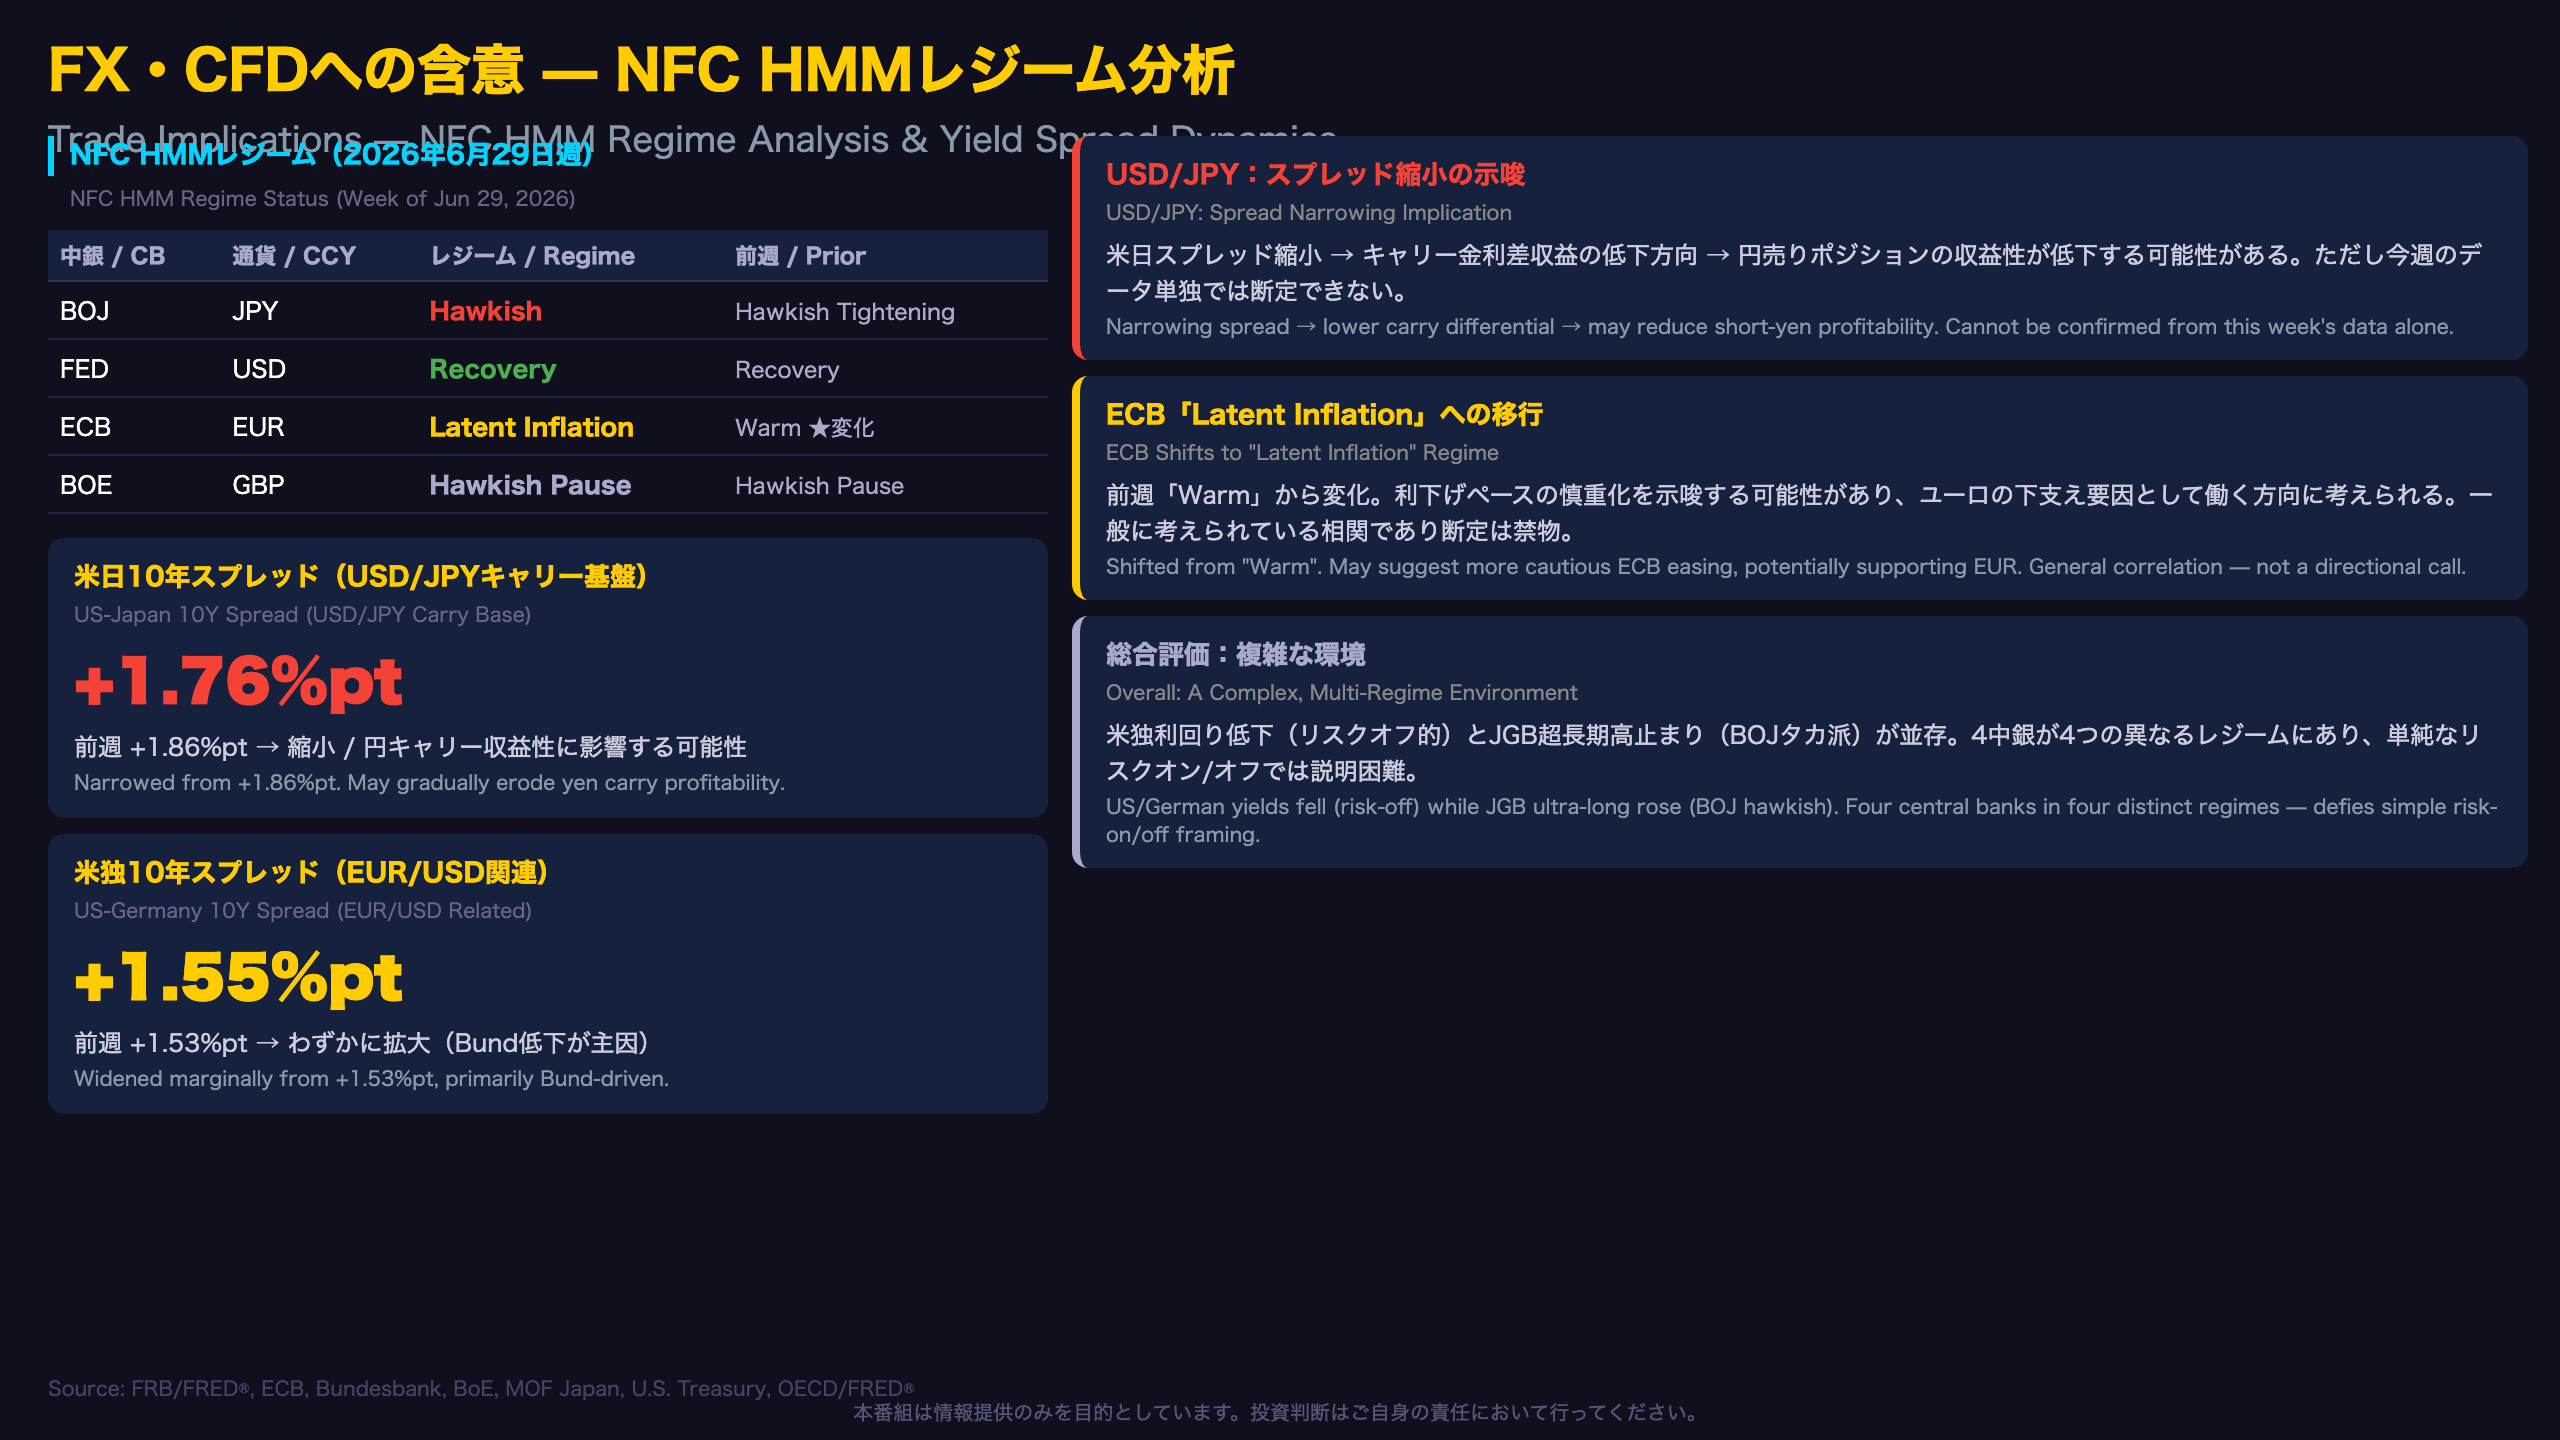
FX & CFD Implications: NFC HMM Regime Analysis and Yield Spread Dynamics
NFC HMM Regime Summary (Week of Jun 29, 2026)
| Central Bank | Currency | Current Regime | Prior Week | Change |
|---|---|---|---|---|
| BOJ | JPY | Hawkish | Hawkish Tightening | Name change |
| Fed | USD | Recovery | Recovery | No change |
| ECB | EUR | Latent Inflation | Warm | Regime shift |
| BOE | GBP | Hawkish Pause | Hawkish Pause | No change |
USD/JPY: The Carry Trade Squeeze
Chain of reasoning: US-Japan 10Y spread narrowed from 1.86%pt to 1.76%pt → reduces the interest rate differential that underpins yen carry trades → may gradually erode the profitability of short-yen, long-dollar positions
This is a general correlation that is widely recognized in FX markets. However, this week’s data alone is insufficient to make a directional call. The BOJ’s HMM regime label changed from “Hawkish Tightening” to “Hawkish” — while the confidence level remains at 100%, this label change may reflect a subtle shift in the model’s characterization of the tightening cycle’s phase.
EUR/USD: ECB Regime Shift to “Latent Inflation”
Chain of reasoning: ECB regime shifted from “Warm” to “Latent Inflation” → may suggest a more cautious pace of ECB rate cuts → could provide some support for the euro against the dollar
The US-Germany 10Y spread widened marginally from 1.53%pt to 1.55%pt, primarily driven by the sharp Bund decline. This is a relatively small move and should not be over-interpreted.
European Risk Sentiment: OAT/BTP-Bund Spreads
OAT-Bund spread at 89bps and BTP-Bund spread at 97bps are both wider than last week. As noted throughout this report, this widening is primarily Bund-driven and does not necessarily reflect a direct increase in French or Italian credit risk. Monthly OAT and BTP data updates will be needed to confirm whether peripheral spreads have genuinely widened.
Overall Risk Balance
This week’s bond market presents a complex picture: US and German yields fell (risk-off signal), while JGB ultra-long yields rose (BOJ hawkishness). This coexistence of risk-off in developed markets and tightening in Japan makes a simple risk-on/risk-off characterization inadequate. The NFC HMM system’s multi-regime framework — with four central banks in four distinct regimes — captures this complexity more accurately than a single-axis risk assessment.
Disclaimer: This article is for informational purposes only. All investment decisions are made solely at your own risk.