📺 Watch the Full Video Analysis
This article was automatically generated by the NFC Market Live AI analysis system. (Updated: 2026-06-28 09:43 JST)
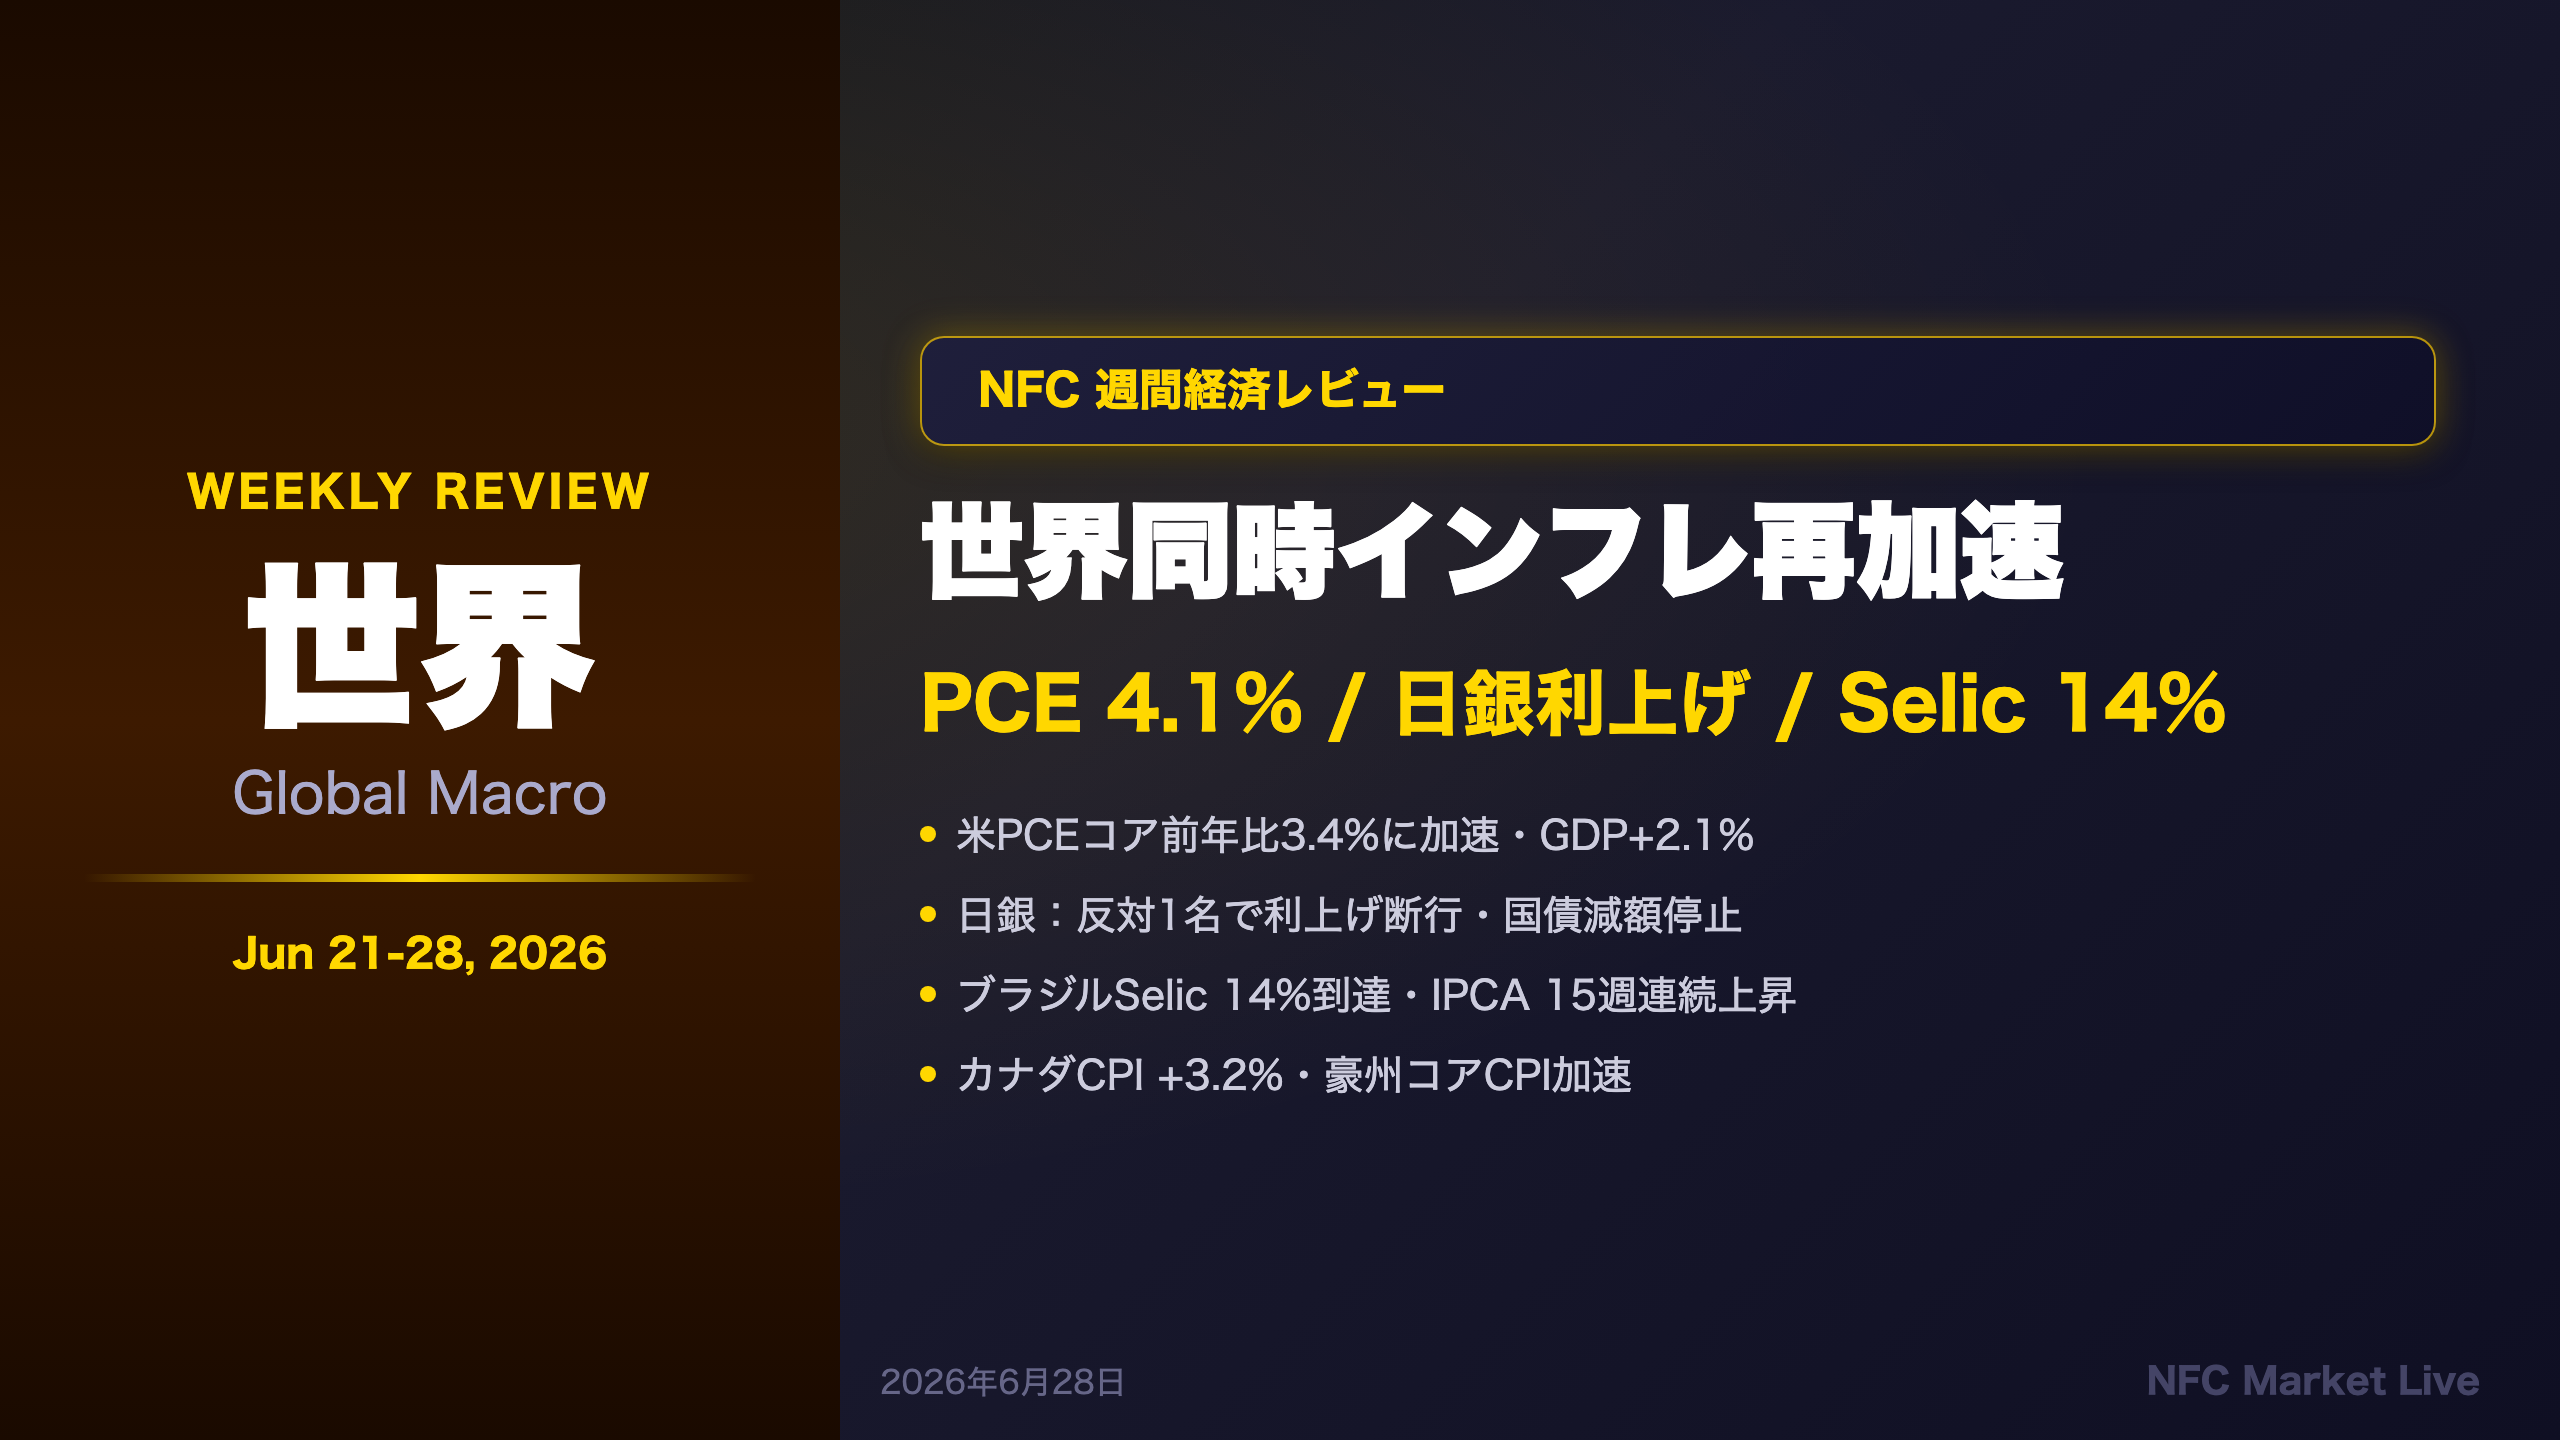
Weekly macro digest for June 21-28, 2026. US PCE accelerated to 4.1%, BOJ hiked rates with one dissent, Brazil’s Selic reached 14%, and Canada CPI surged to 3.2%. We break down the global inflation resurgence, central bank responses, and key events to watch next week.
オープニング:2026年6月第4週 週間経済レビュー
NFC Market Live — Weekly Macro Digest: June 21–28, 2026
Program Overview
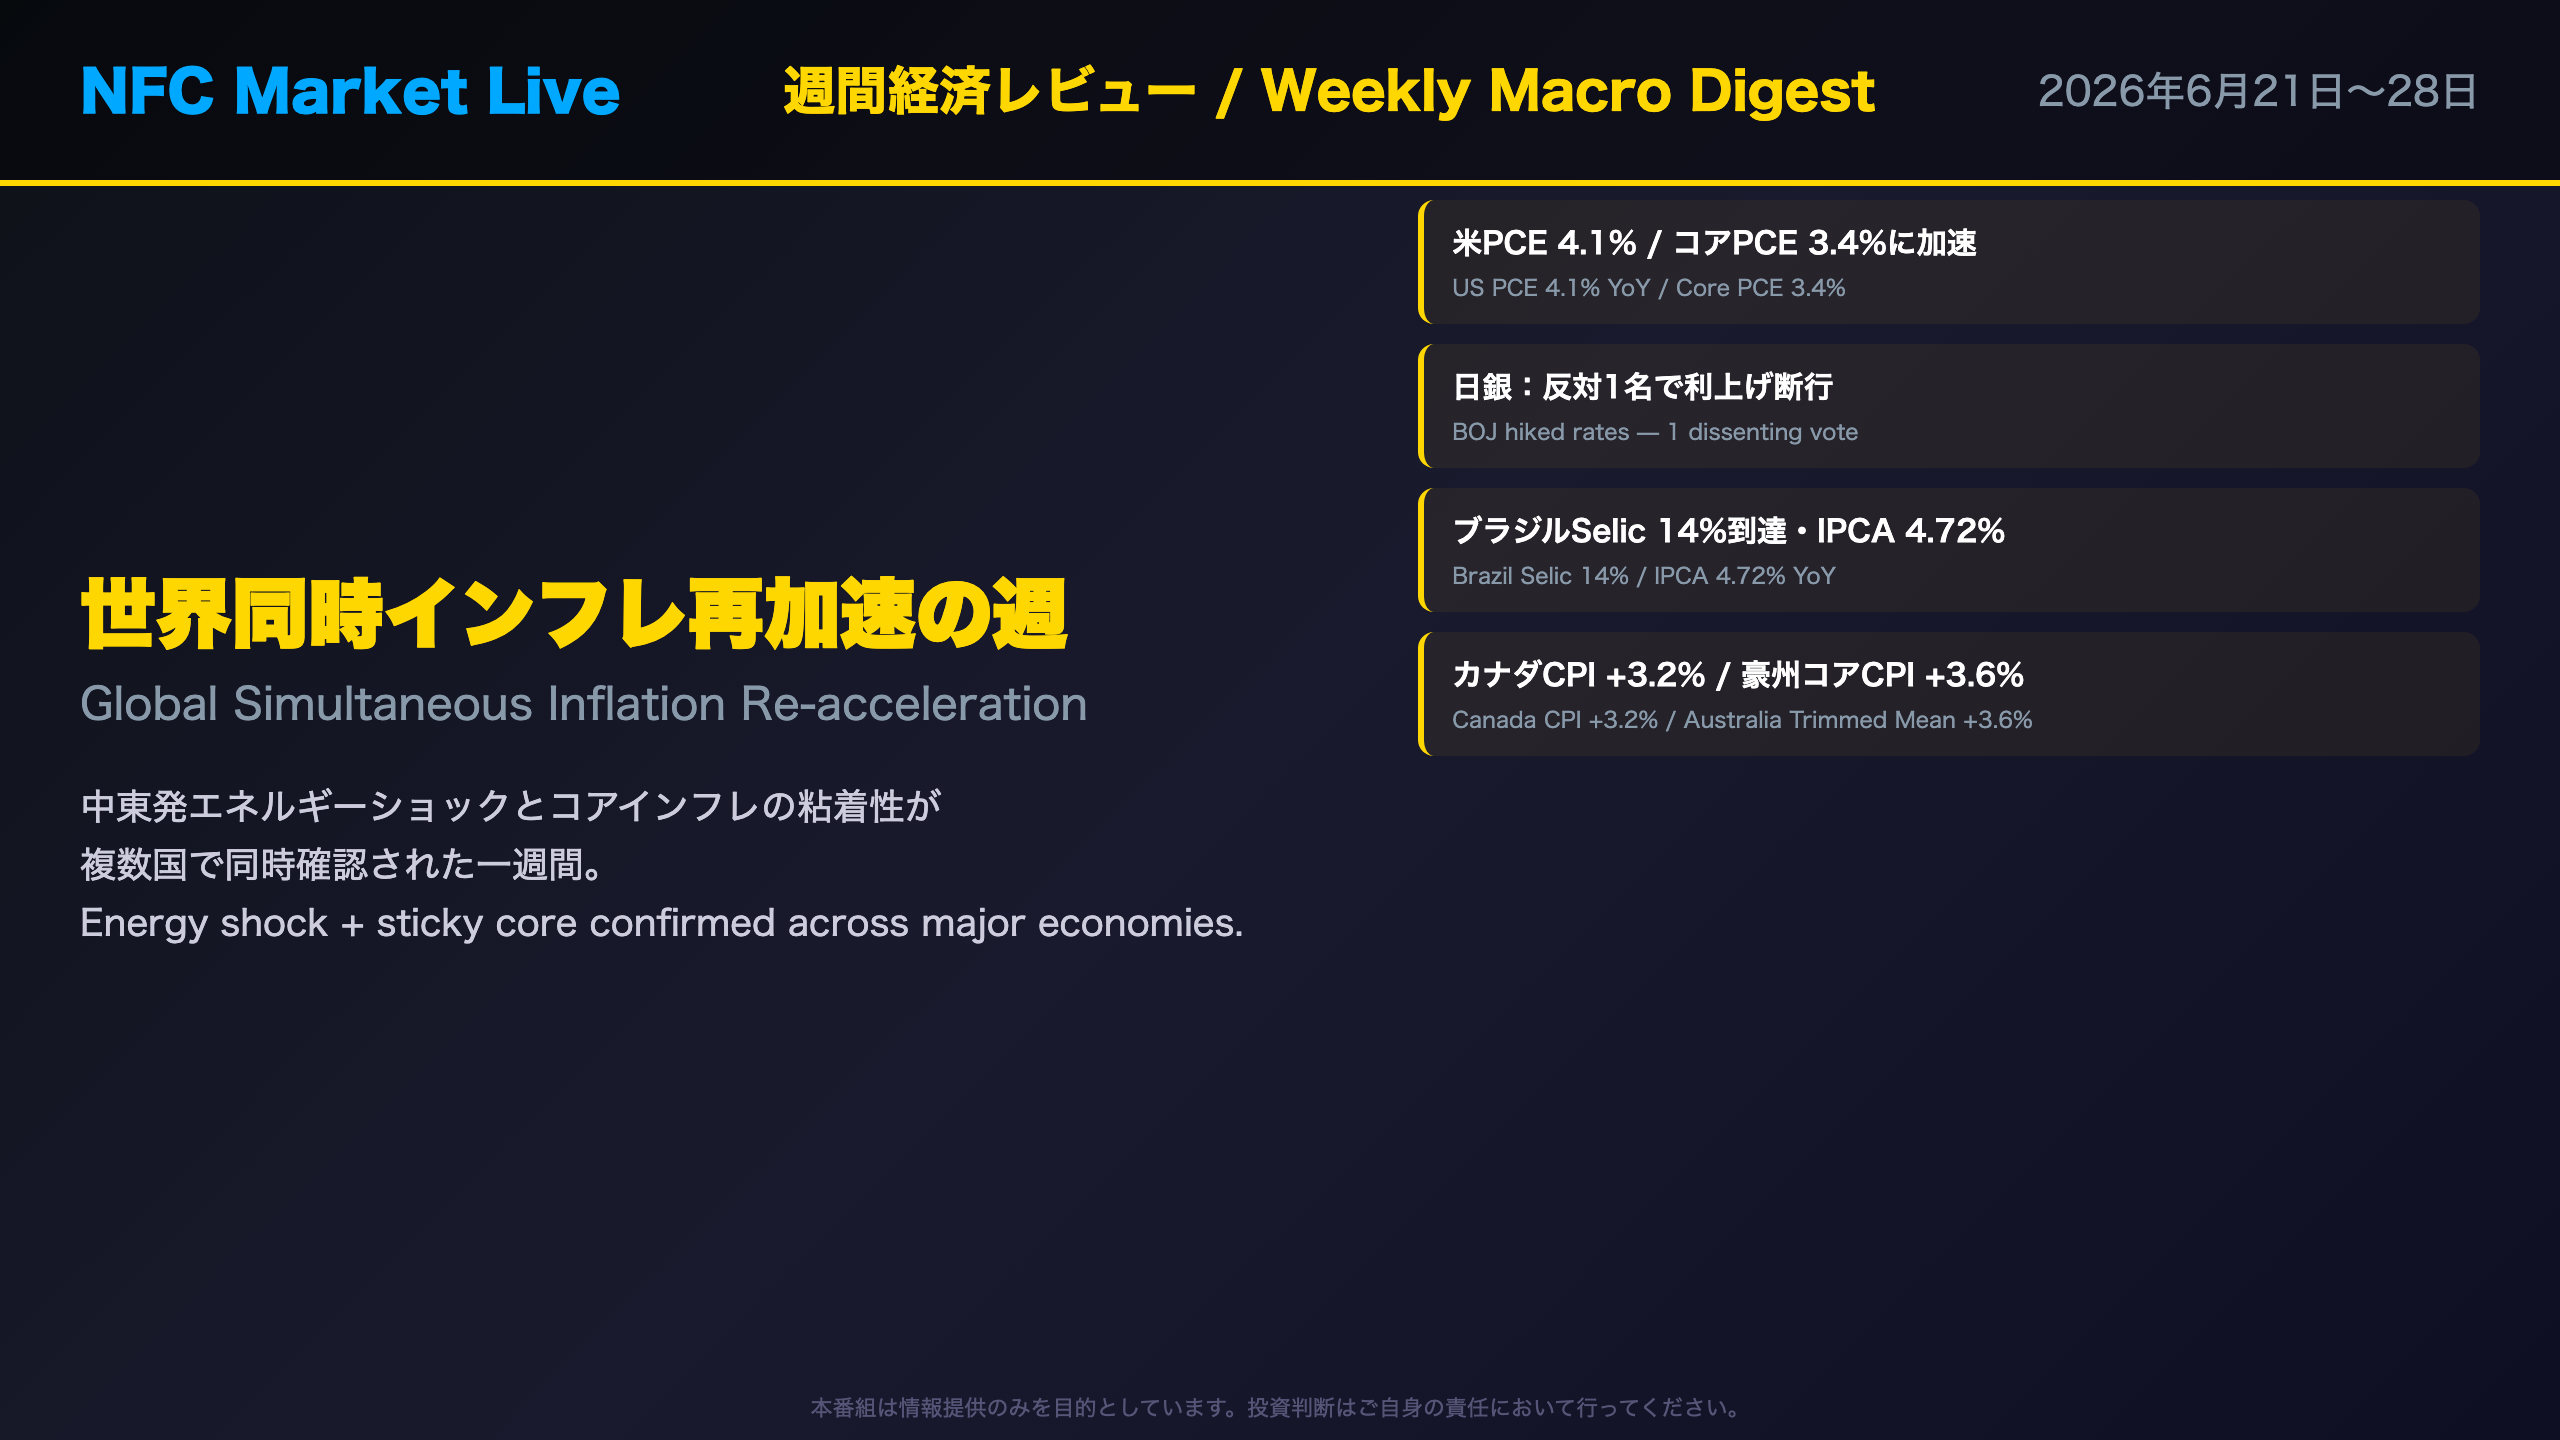
This week’s digest centers on a single dominant theme: simultaneous global inflation re-acceleration. Across the US, Japan, Brazil, Canada, and Australia, inflation data released this week surprised to the upside — and in several cases, core measures accelerated alongside headline figures, suggesting the pressure is not purely energy-driven.
Key Stories This Week
- United States: PCE deflator hit 4.1% YoY, the highest in recent months. GDP was revised up to +2.1% in the third estimate, but private domestic final demand was revised down to +1.7% — a split signal.
- Japan: The Bank of Japan (BOJ) hiked its policy rate with just one dissenting vote. Tokyo CPI for June accelerated to 1.9% on a core-core basis, reinforcing the hike decision.
- Brazil: The Selic rate reached 14% as the Copom (Brazil’s monetary policy committee) continued its calibration cycle. The IPCA 12-month cumulative rate hit 4.72%, breaching the 4.5% upper tolerance band.
- Canada & Australia: Canada CPI surged to 3.2% YoY, driven by gasoline (+33.2%) but also by food and services. Australia’s trimmed mean CPI accelerated to 3.6%, above the RBA’s 2–3% target band.
The Common Thread: Middle East Energy Shock + Sticky Core
A key structural observation this week: the Middle East conflict (Strait of Hormuz closure risk) is a common upstream driver of energy price increases across all these economies. However, the fact that core inflation is also accelerating in multiple countries suggests demand-side pressures remain intact — a more concerning signal for central banks than a pure supply shock.
今週の総括:The Weekly Verdict
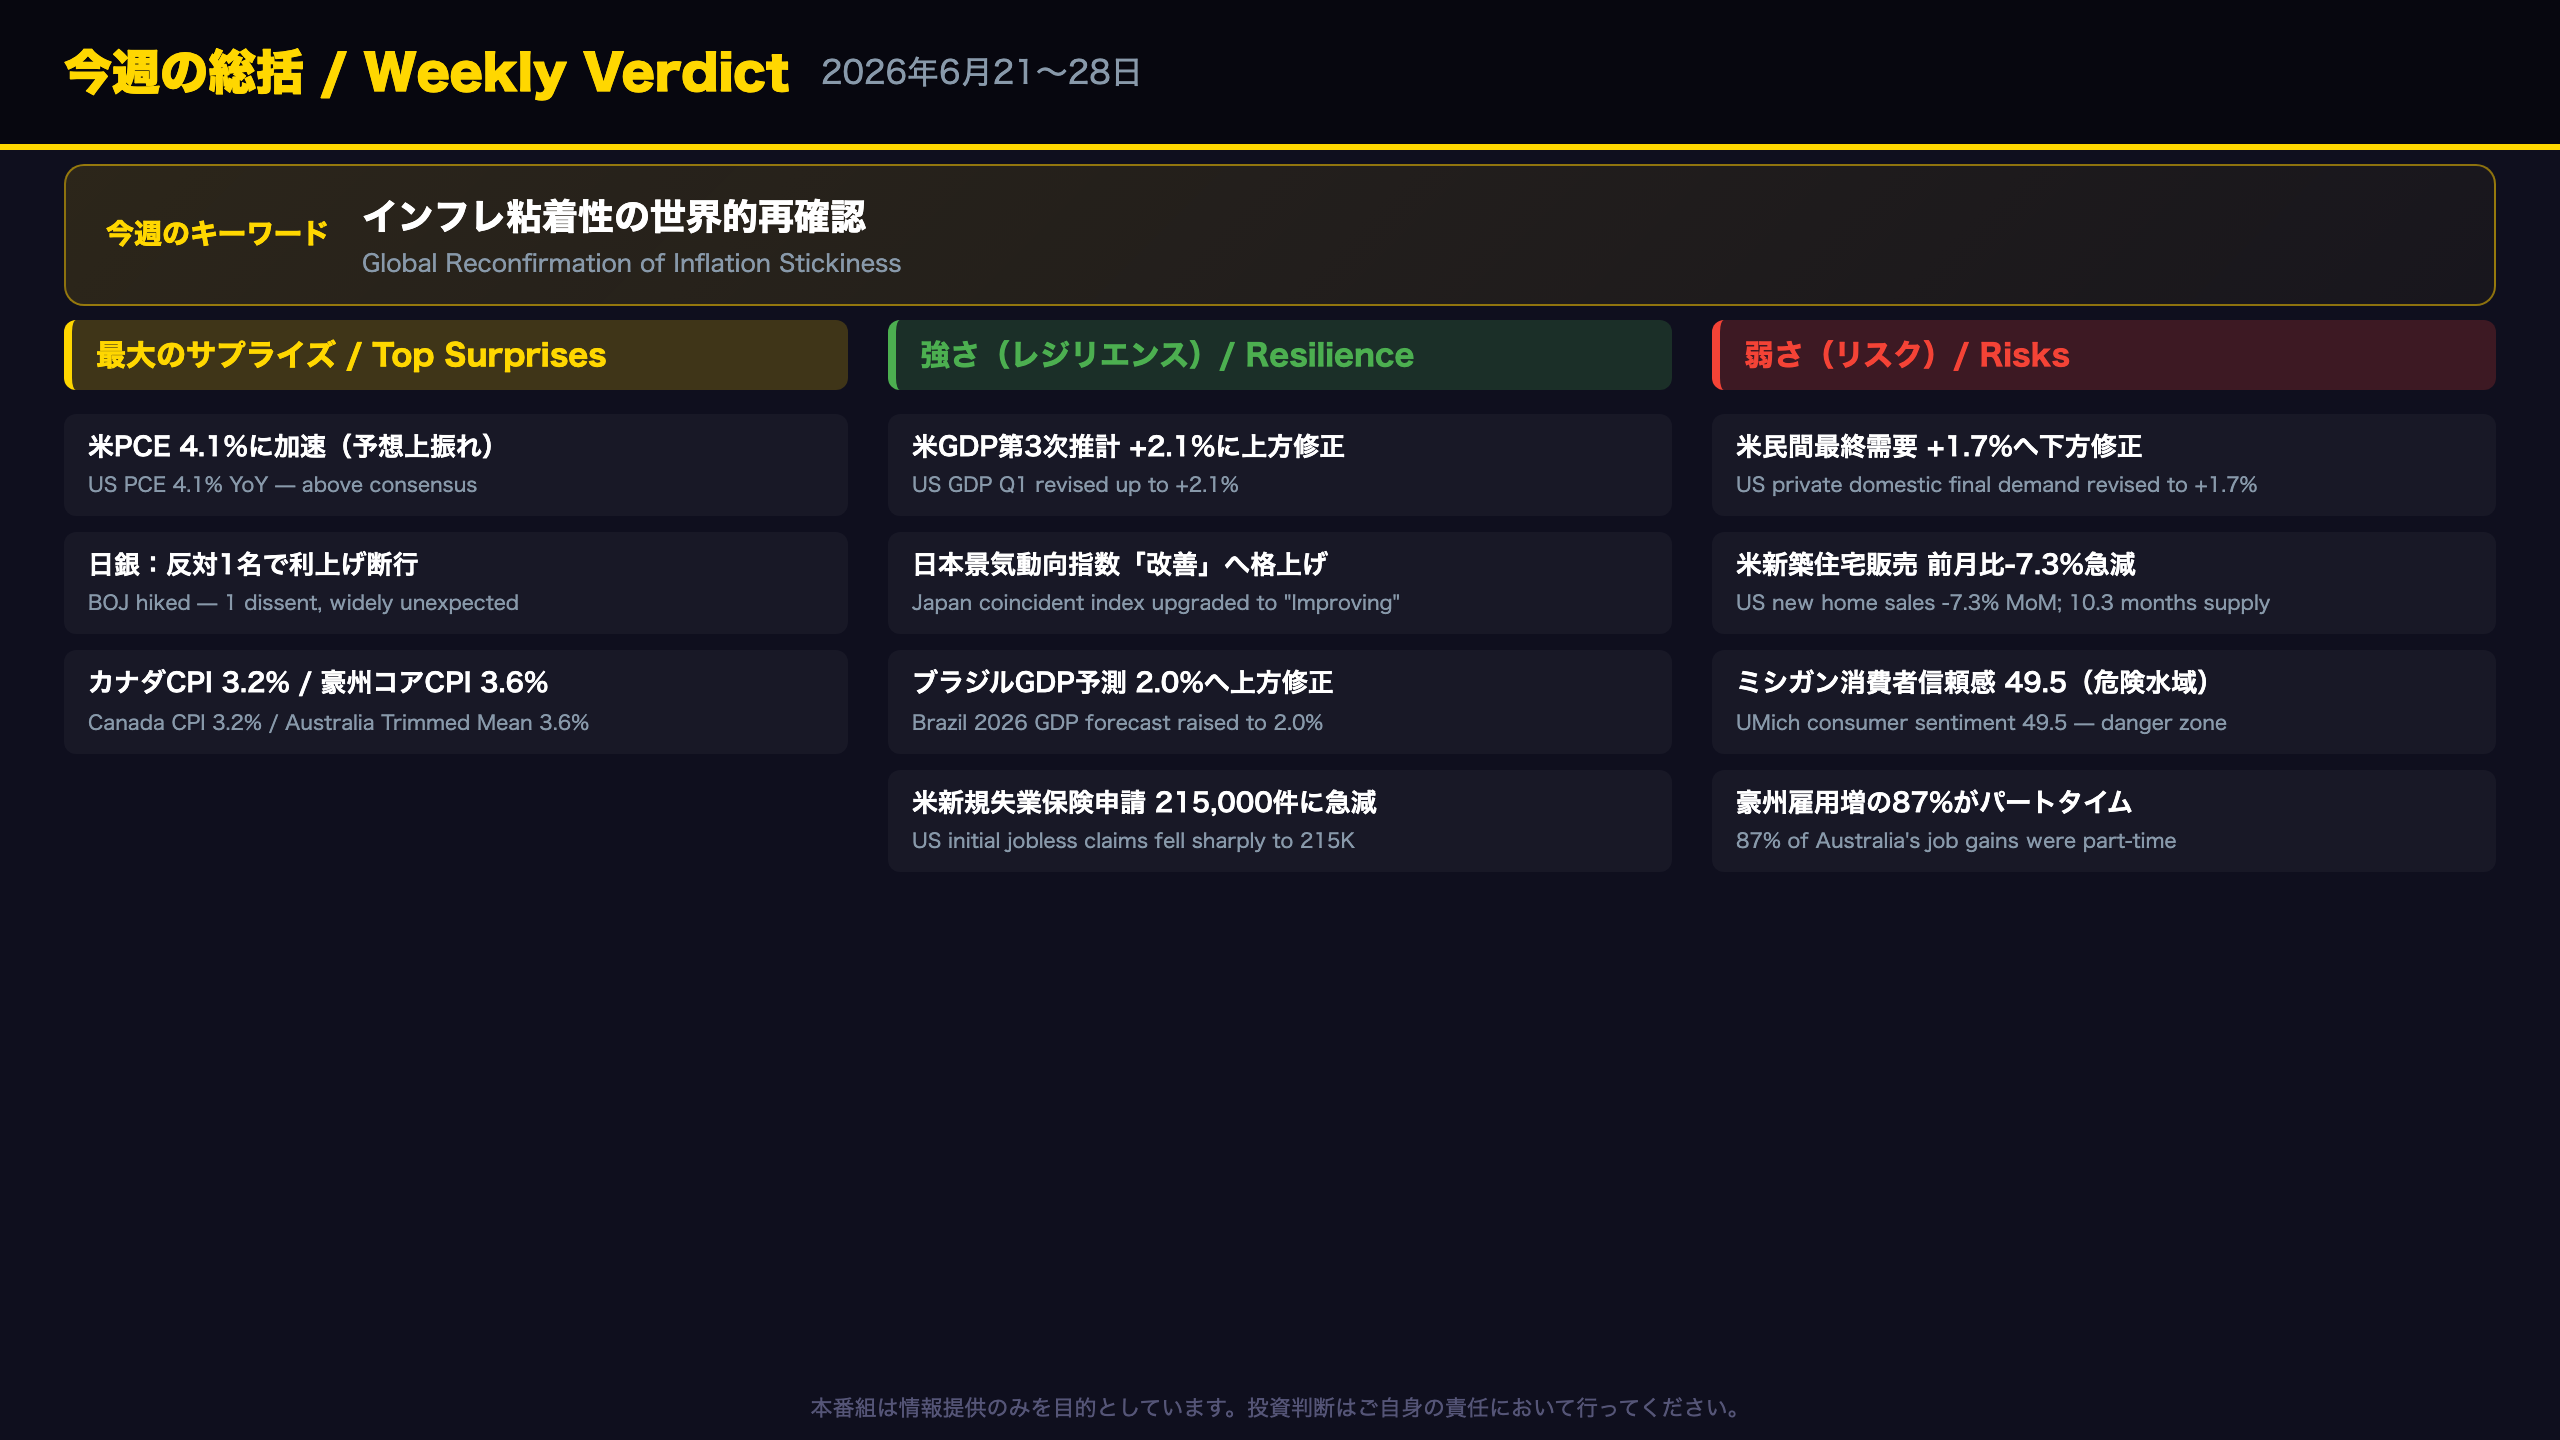
Weekly Verdict: The Global Inflation Stickiness Reconfirmation
This Week’s Keyword: “Sticky Inflation — Confirmed Globally”
Across the data released this week, one message was consistent: inflation is proving more persistent than expected, and this is a global phenomenon, not isolated to one country.
Biggest Upside Surprises
| Indicator | Consensus | Actual | Assessment |
|---|---|---|---|
| US PCE Deflator (YoY) | ~3.8% | 4.1% | Upside surprise |
| BOJ June Meeting | Hold expected | Rate hike | Major surprise |
| Canada CPI (YoY) | ~2.9% | 3.2% | Upside surprise |
| Australia Trimmed Mean CPI | ~3.3% | 3.6% | Upside surprise |
In Line with Expectations
- Brazil Copom: 25bp cut (continuing calibration cycle)
- Bank of Canada: Hold at 2.25%
- Banxico (Mexico): Hold at 6.50%
Resilience (Positive Side)
- US GDP Q1 third estimate revised up to +2.1% annualized
- Japan’s coincident index upgraded to “improving” — the highest assessment
- Brazil’s 2026 GDP forecast raised to 2.0%
- US initial jobless claims fell sharply to 215,000
Risks (Negative Side)
- US private domestic final demand revised down to +1.7% (from +2.5% in the advance estimate) — three consecutive downward revisions
- US new home sales fell 7.3% MoM; months’ supply at 10.3 months
- University of Michigan consumer sentiment at 49.5 — still in “danger zone” territory
- Australia employment quality: 87% of job gains were part-time
- Foreign investors sold ¥1.057 trillion in Japanese medium/long-term bonds in a single week
主要指標ハイライト①:米国・日本のインフレと成長
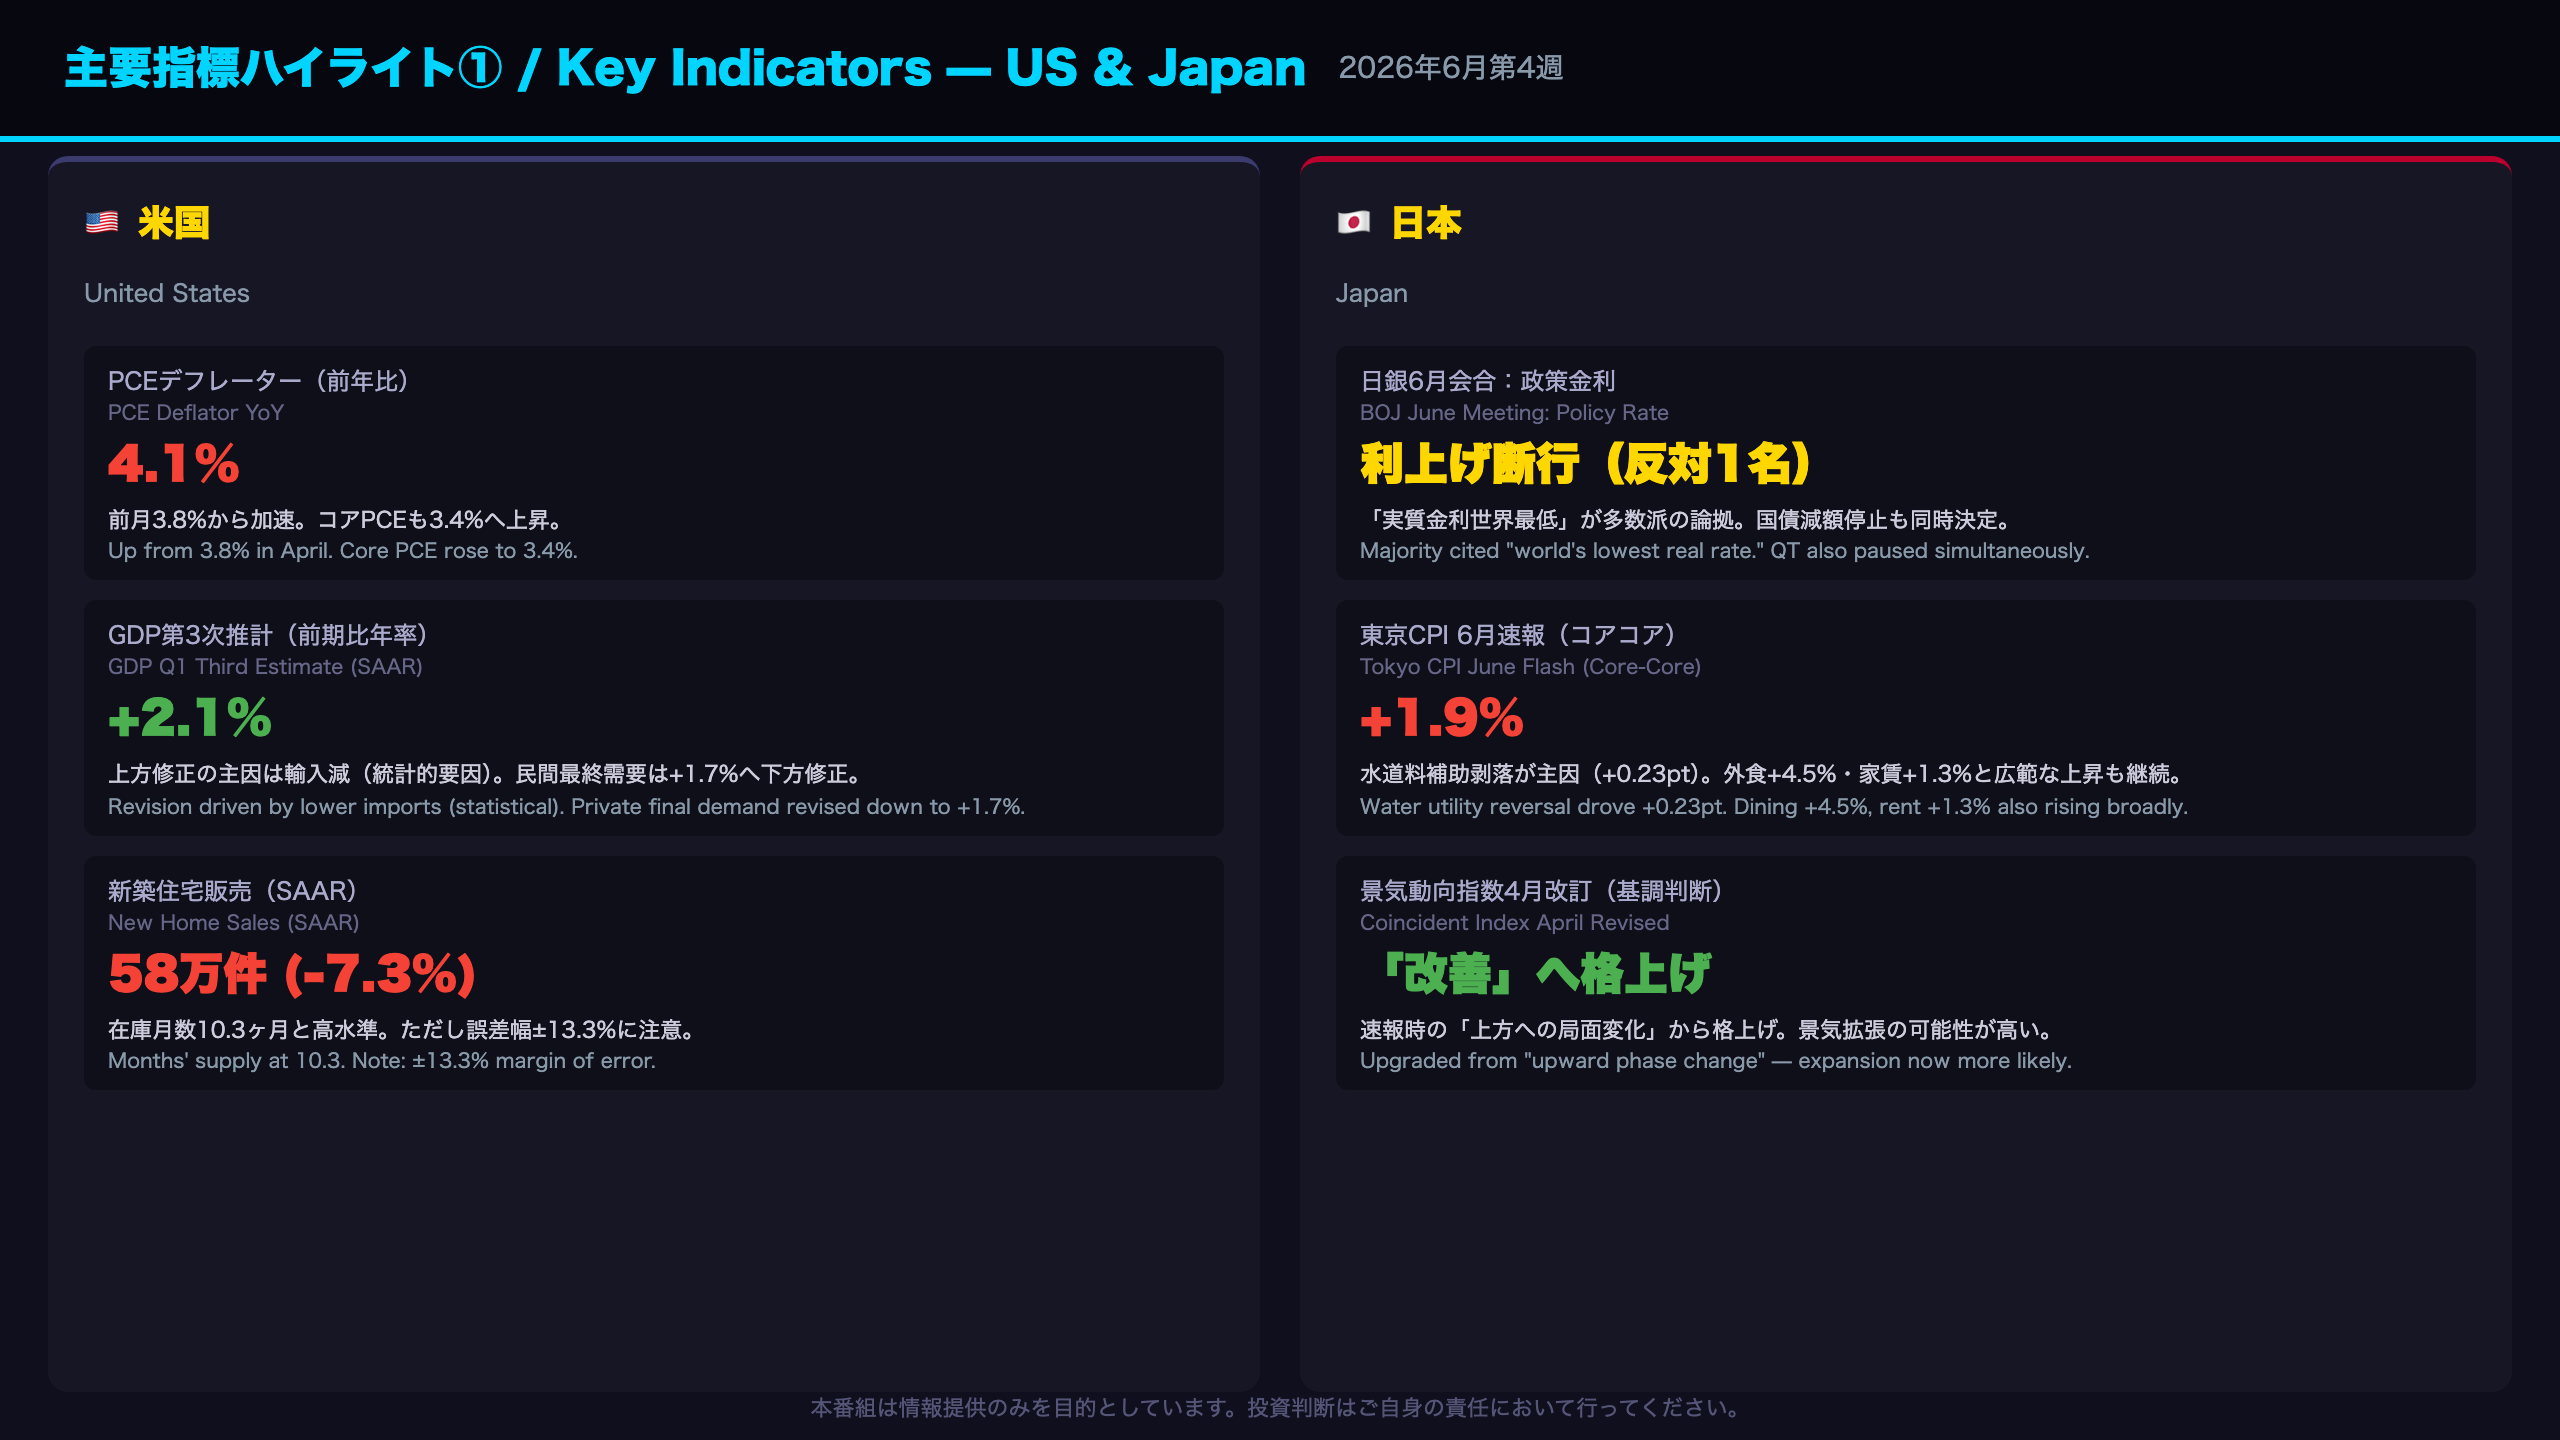
United States: PCE 4.1% and the “Twisted GDP”
PCE Acceleration
The May PCE deflator came in at 4.1% YoY (up from 3.8% in April), with core PCE at 3.4% (up from 3.3%). On a monthly basis, core PCE re-accelerated from 0.2% to 0.3%, suggesting April’s deceleration may have been noise rather than a trend.
Within consumption, services (+$94.3B) outpaced goods (+$61.8B). The largest contributors were financial services & insurance (+$28.4B), healthcare (+$22.3B), and housing & utilities (+$22.3B) — all categories with high price stickiness that are slow to respond to monetary tightening.
The GDP “Twist”: Statistical Upward Revision vs. Underlying Downward Revision
According to BEA’s technical note, the upward revision from +1.6% to +2.1% in the third estimate was “primarily driven by a downward revision to imports” — a mechanical statistical effect, not a sign of stronger economic activity. Meanwhile, private domestic final demand (consumption + private fixed investment) was revised down to +1.7% from the advance estimate of +2.5%, with three consecutive downward revisions across the three estimates.
Japan: The Logic Behind the Rate Hike and Tokyo CPI
BOJ June Meeting Structure
The one dissenting vote (warning of deflation re-emergence risk) is significant — it represents a minority but important concern within the committee. The majority’s case rested on three pillars: Japan’s real policy rate remains the world’s lowest; inflation expectations are showing signs of movement; and corporate pricing behavior is becoming more aggressive.
Tokyo CPI: Water Utility Reversal vs. Core-Core Acceleration
Tokyo’s June core-core CPI (ex-fresh food and energy) accelerated to 1.9%. While the water utility subsidy reversal explains nearly all of the 0.3pt headline increase, the underlying picture shows broad-based price increases: dining out +4.5%, rent +1.3%, household durable goods +2.8%. This breadth suggests structural inflation pressure, not just a statistical artifact.
主要指標ハイライト②:ブラジル・カナダ・豪州のインフレ構造
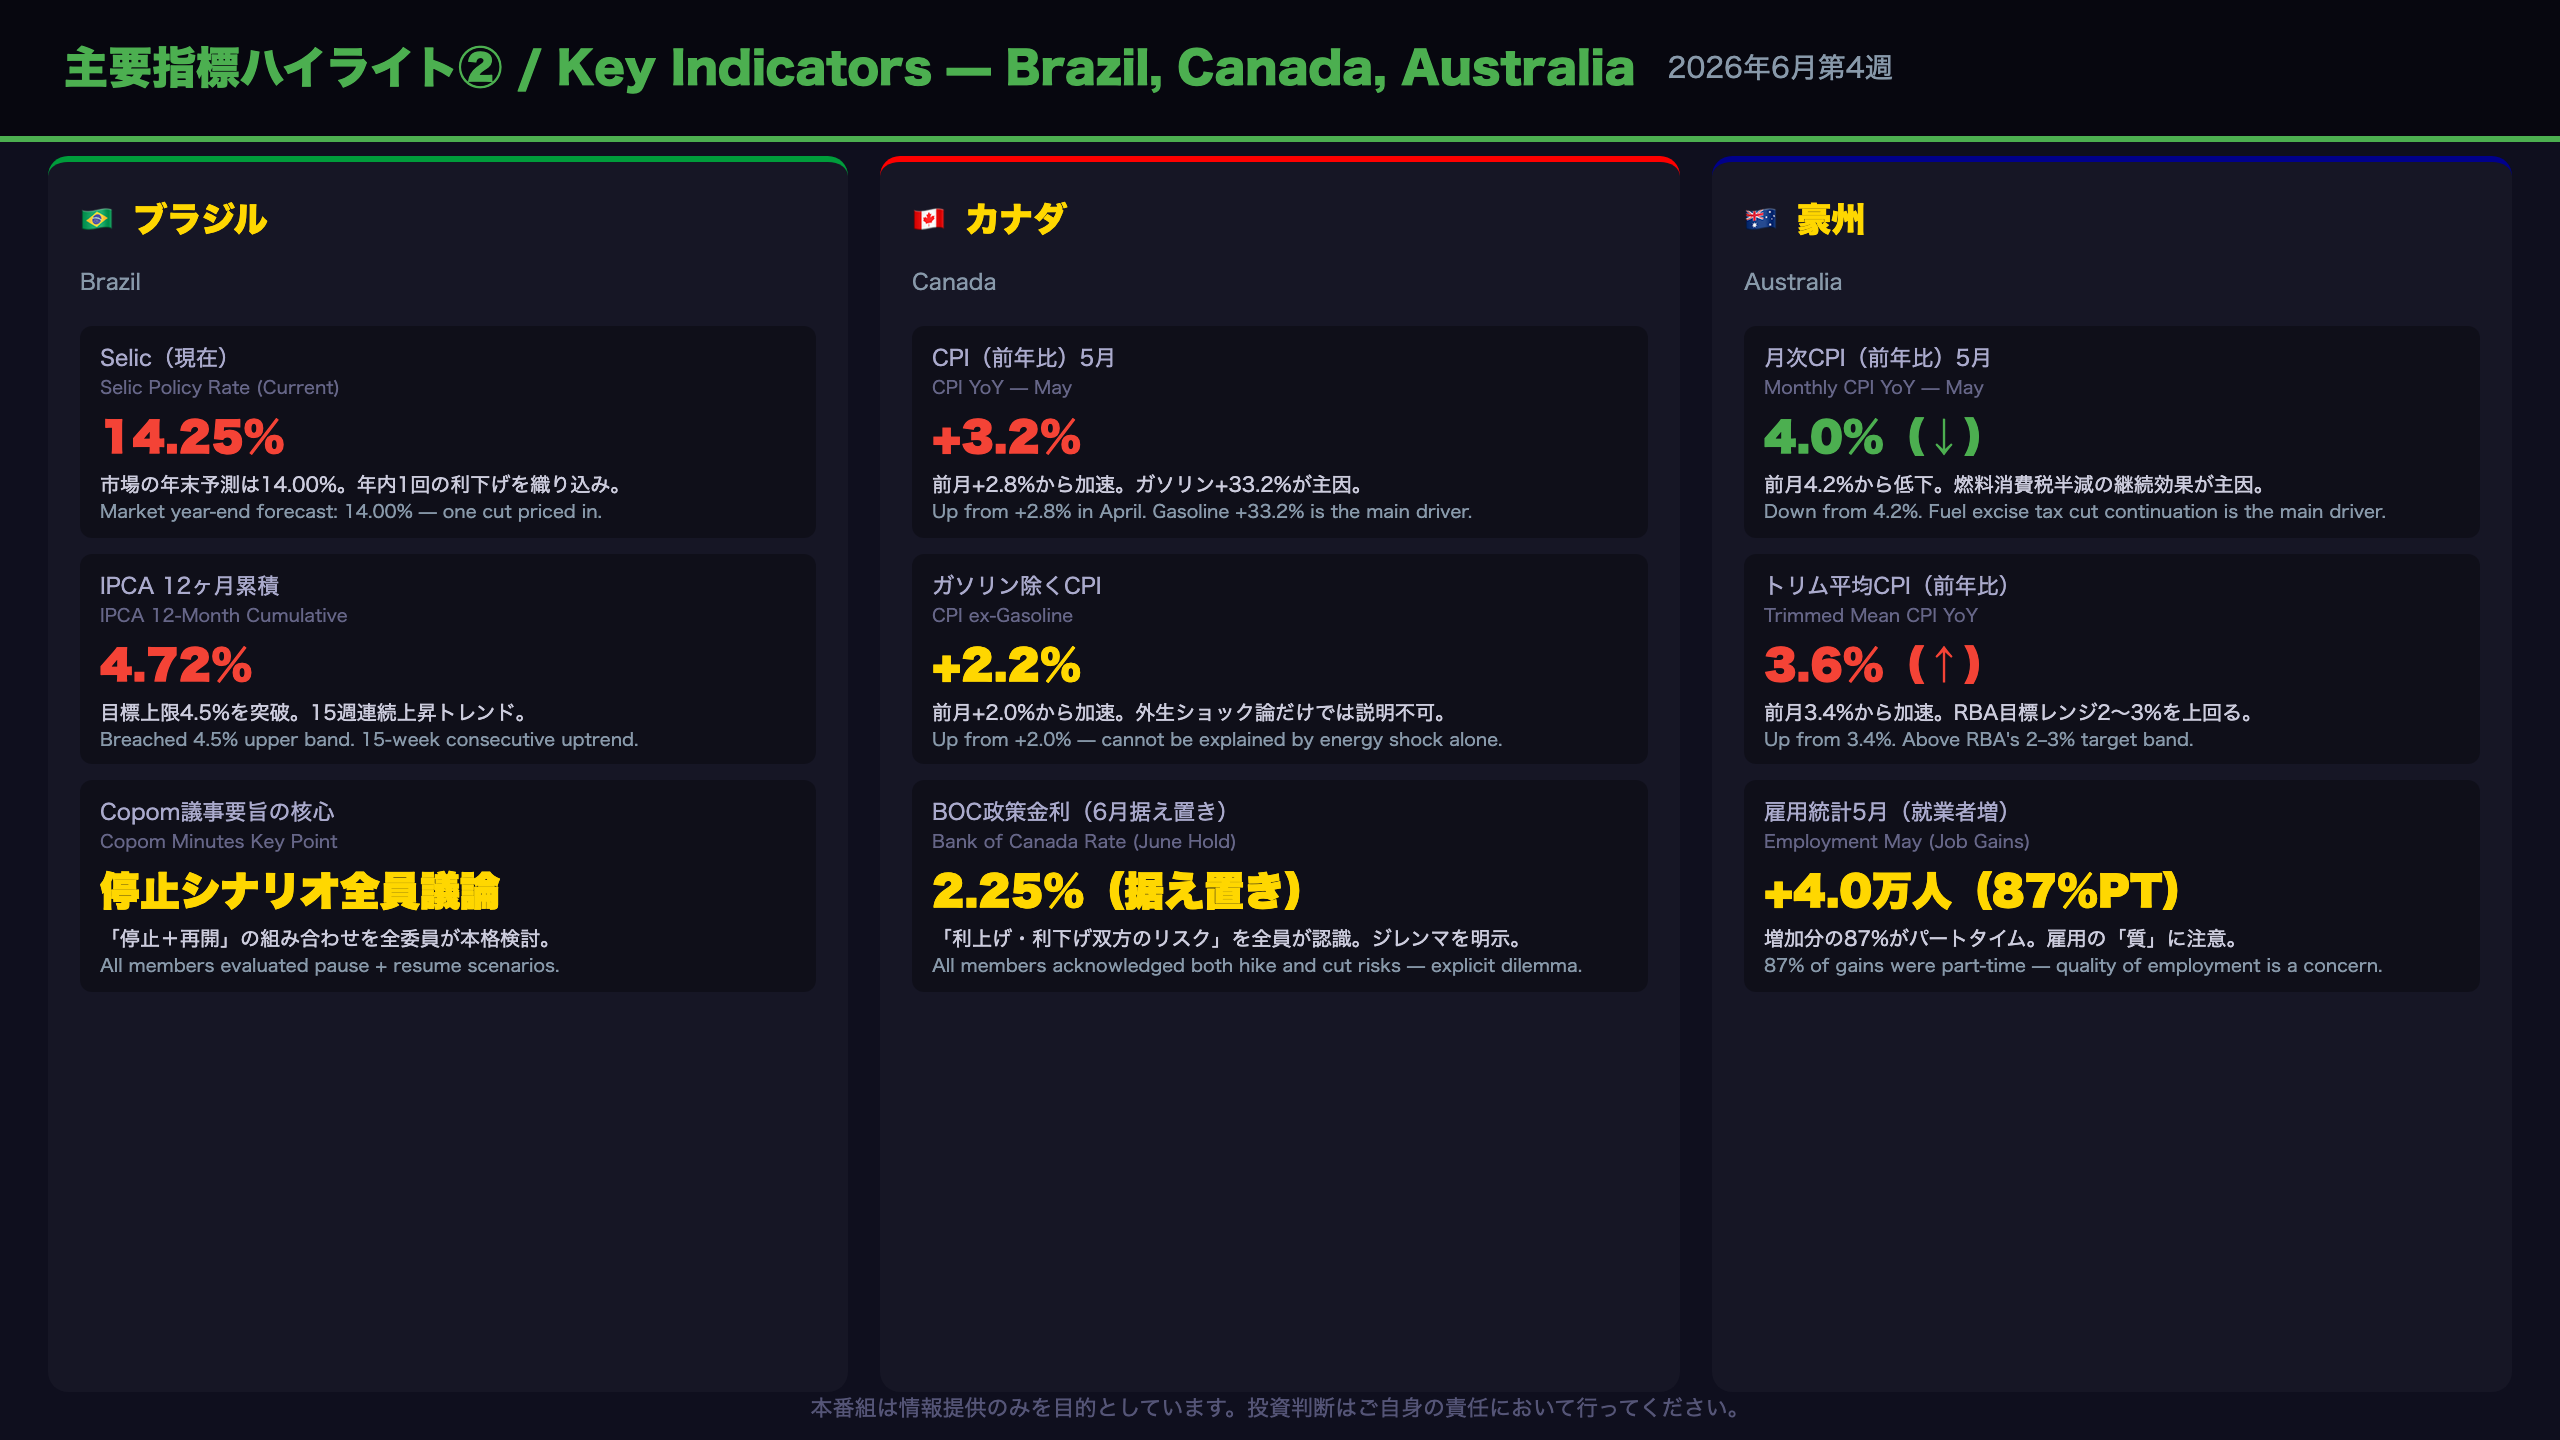
Brazil: The “Pause + Resume” Dilemma and Dual Contradictions
Copom Minutes: The Core Message
The 279th Copom minutes (released June 23) revealed that all committee members seriously evaluated scenarios involving different combinations of pause and resume timings for the rate calibration cycle. This is not merely a debate about the size of the next cut — it signals that the committee is genuinely considering halting the cycle altogether.
Brazil’s Inflation Reality
May IPCA came in at +0.58% MoM (down from +0.67% in April), but the 12-month cumulative rate hit 4.72% — breaching the 4.5% upper tolerance band of the 3.0% target. Core IPCA rose to 0.64% from 0.55%, suggesting demand-side stickiness. Food & beverages accounted for half of the monthly increase (0.29pp), and electricity tariffs rose 3.67%.
Canada: Gasoline-Led vs. Core Acceleration — A Dual Structure
May CPI +3.2% Breakdown
Gasoline at +33.2% is the headline driver, caused by Middle East conflict and Strait of Hormuz closure risk. However, as StatCan explicitly noted, “excluding gasoline, the CPI still rose at a faster pace year over year in May (+2.2%) compared with April (+2.0%).” Food (store-bought) +4.3%, fresh vegetables +9.0% (tomatoes +45.2% due to Mexico supply constraints from US tariffs), and food inflation has now exceeded headline CPI for 16 consecutive months.
Australia: Headline Down, Core Up — The Divergence Story
May Monthly CPI: Fuel as Noise
Automobile fuel fell 11.9% MoM (continuing the April 1 fuel excise tax cut effect), suppressing the headline. But the trimmed mean accelerated from 3.4% to 3.6%, and the weighted median from 3.5% to 3.6%. All four core measures rose simultaneously — a Level B inference that underlying inflation pressure remains strong. Housing group at 6.5% and electricity +21.1% (base effect from subsidy expiry) are structural contributors.
中央銀行・政策スタンスの現在地
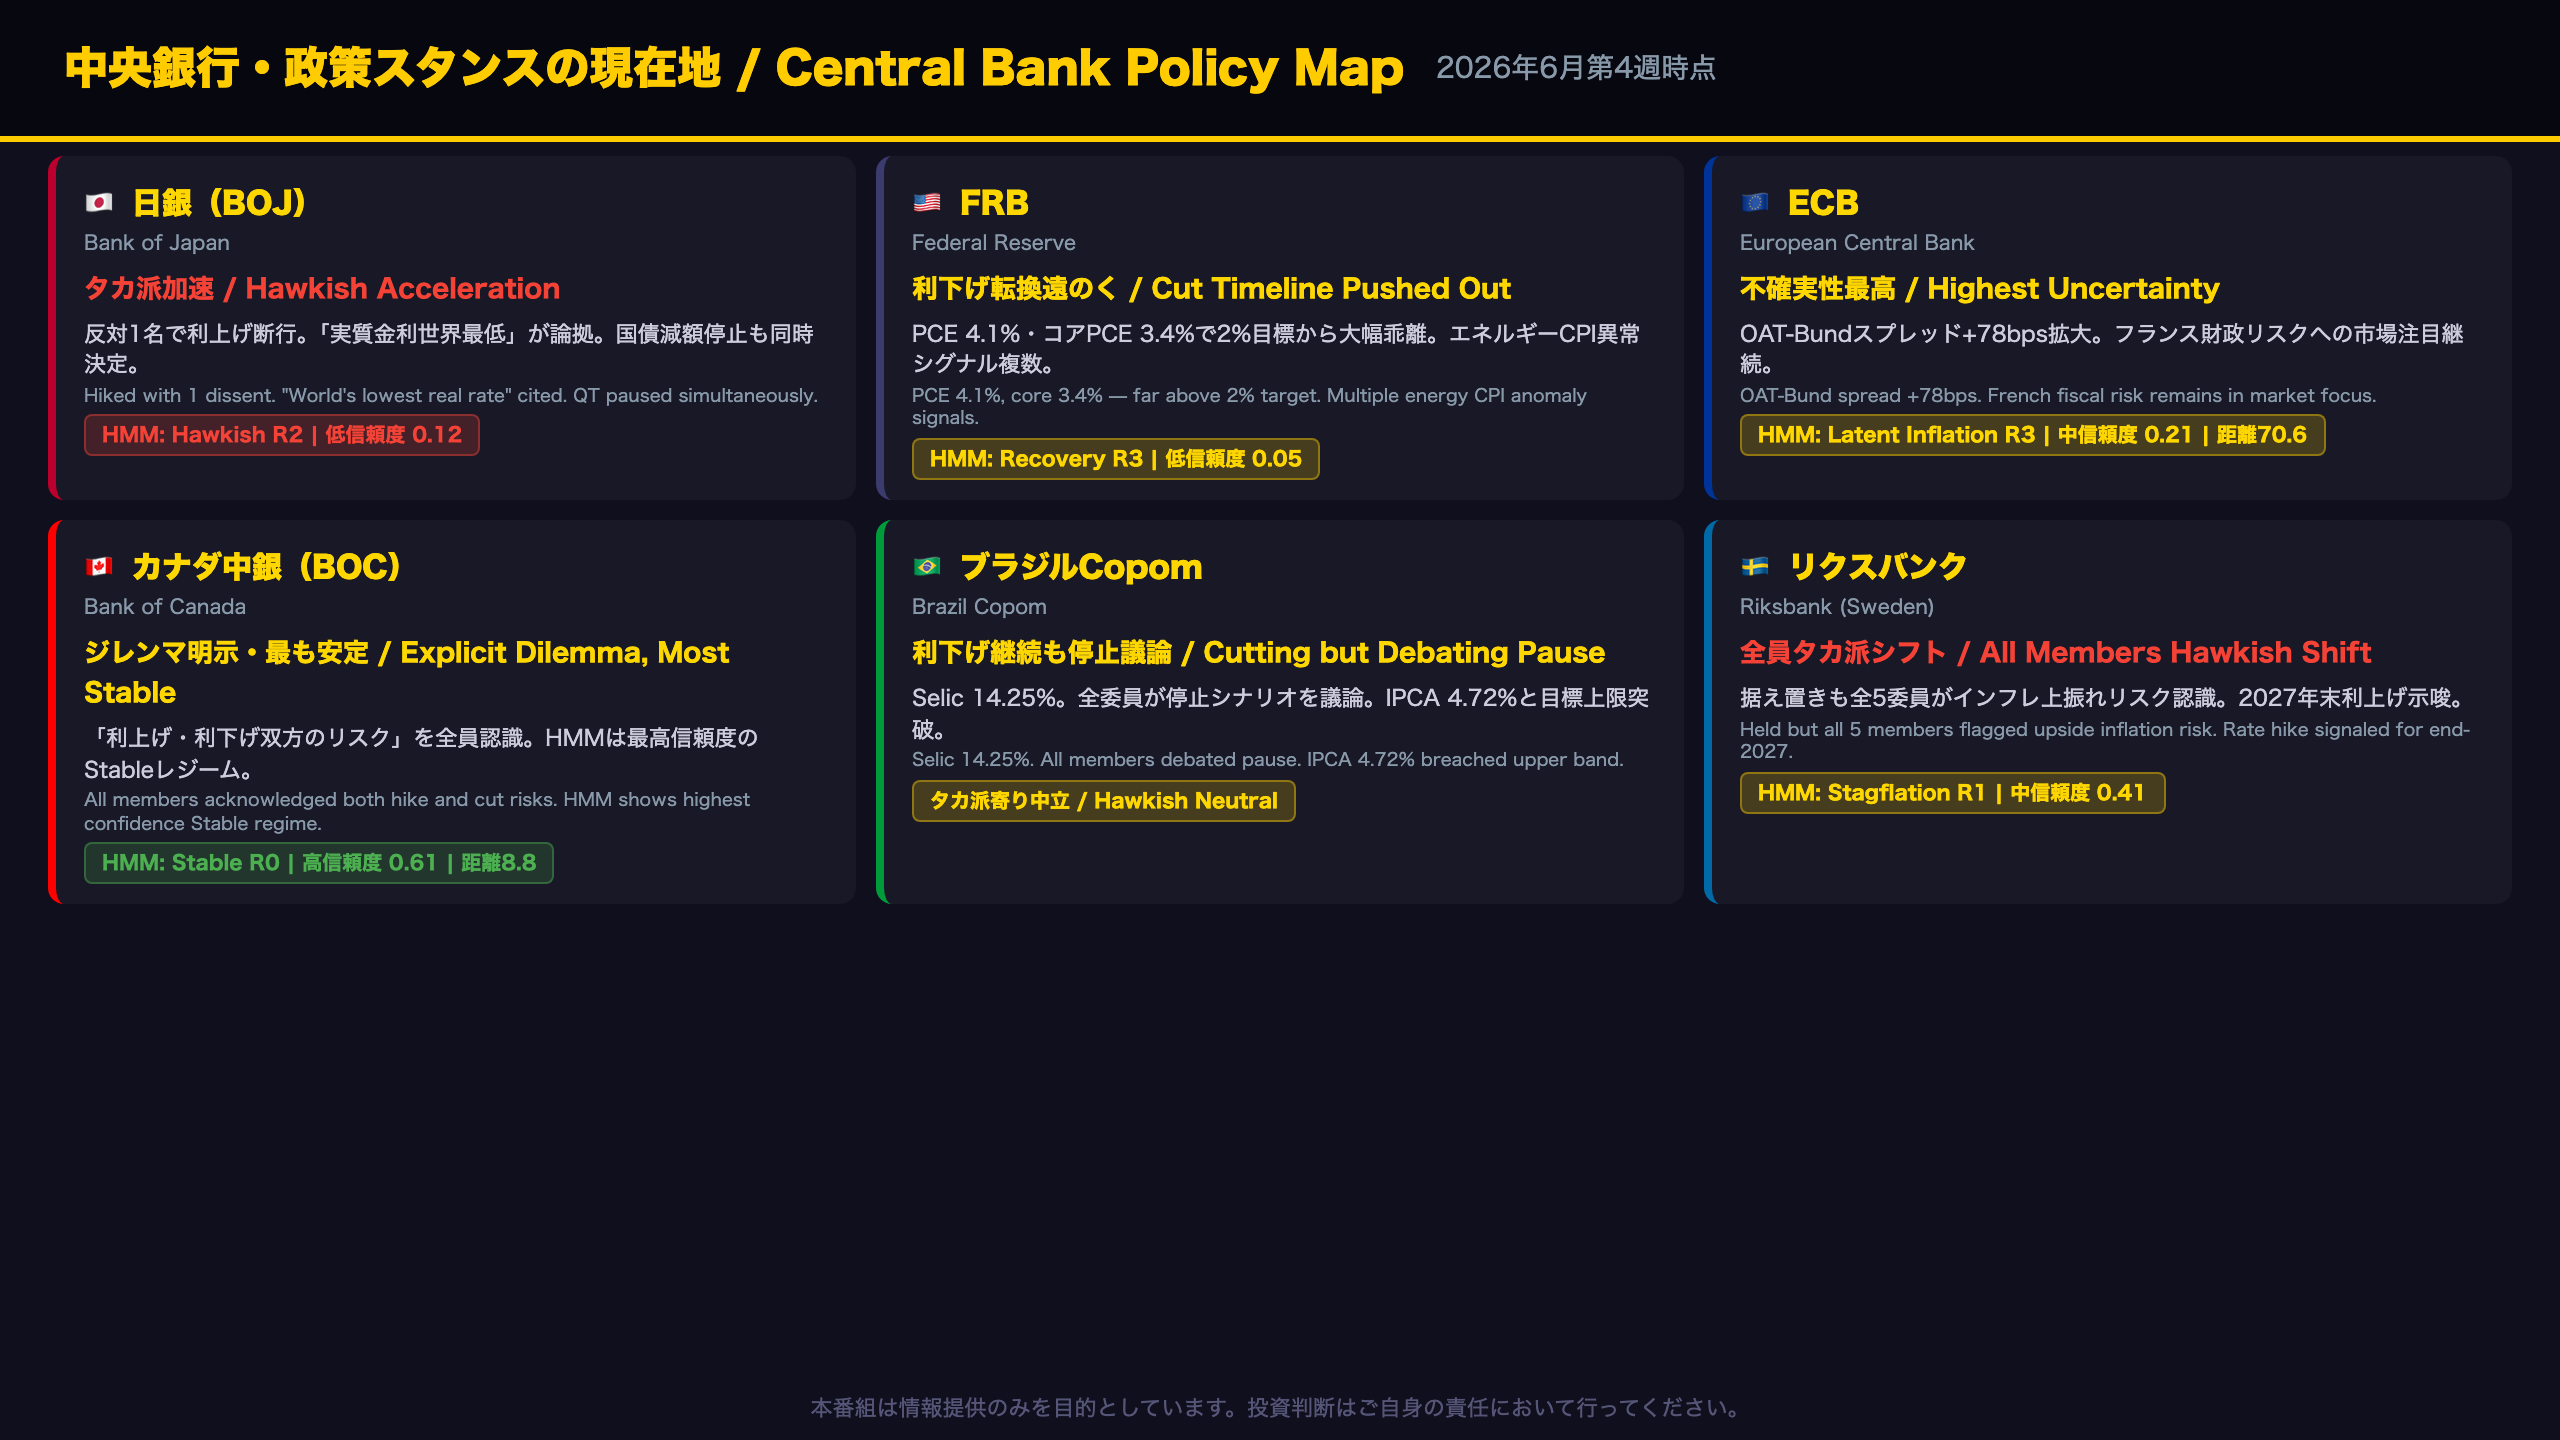
Central Bank Policy Stance Map: This Week’s Shifts
Bank of Japan (BOJ): Hawkish Acceleration
Hiked rates with one dissent at the June meeting. The HMM model classifies BOJ as ‘Hawkish’ (R2), but with a Mahalanobis distance of 35.7 and low confidence (0.12), suggesting the current state is an outlier from historical Hawkish patterns.
Federal Reserve: Rate Cut Timeline Pushed Out
PCE at 4.1% and core PCE at 3.4% are far above the Fed’s 2% target. The HMM model classifies the US as ‘Recovery’ (R3) with low confidence (0.05). This week’s HMM anomaly signals showed multiple inflation indicators (gasoline CPI YoY +28.4% at Z=2.86, energy CPI YoY +17.9% at Z=2.70) deviating significantly from the current regime’s typical pattern.
ECB: Highest Uncertainty
Classified as ‘Latent Inflation’ (R3) with a Mahalanobis distance of 70.6 — the highest of all models — and medium confidence (0.21). The OAT-Bund spread has widened to +78bps, reflecting ongoing market attention to French fiscal and political risks.
Bank of Canada (BOC): Most Stable
Classified as ‘Stable’ (R0) with a Mahalanobis distance of just 8.8 — the lowest of all models — and high confidence (0.61). The Mahalanobis distance moved -42.4 this week, a dramatic stabilization. However, the June minutes explicitly acknowledged a policy dilemma, so the direction of the next move remains open.
Riksbank (Sweden): Hawkish Shift in Progress
Classified as ‘Stagflation’ (R1) with medium confidence (0.41). The June minutes showed all five board members acknowledging upside inflation risks, with the rate path revised upward to signal one hike by end-2027 (1.75% → 2.00%).
今週の番組制作費コーナー
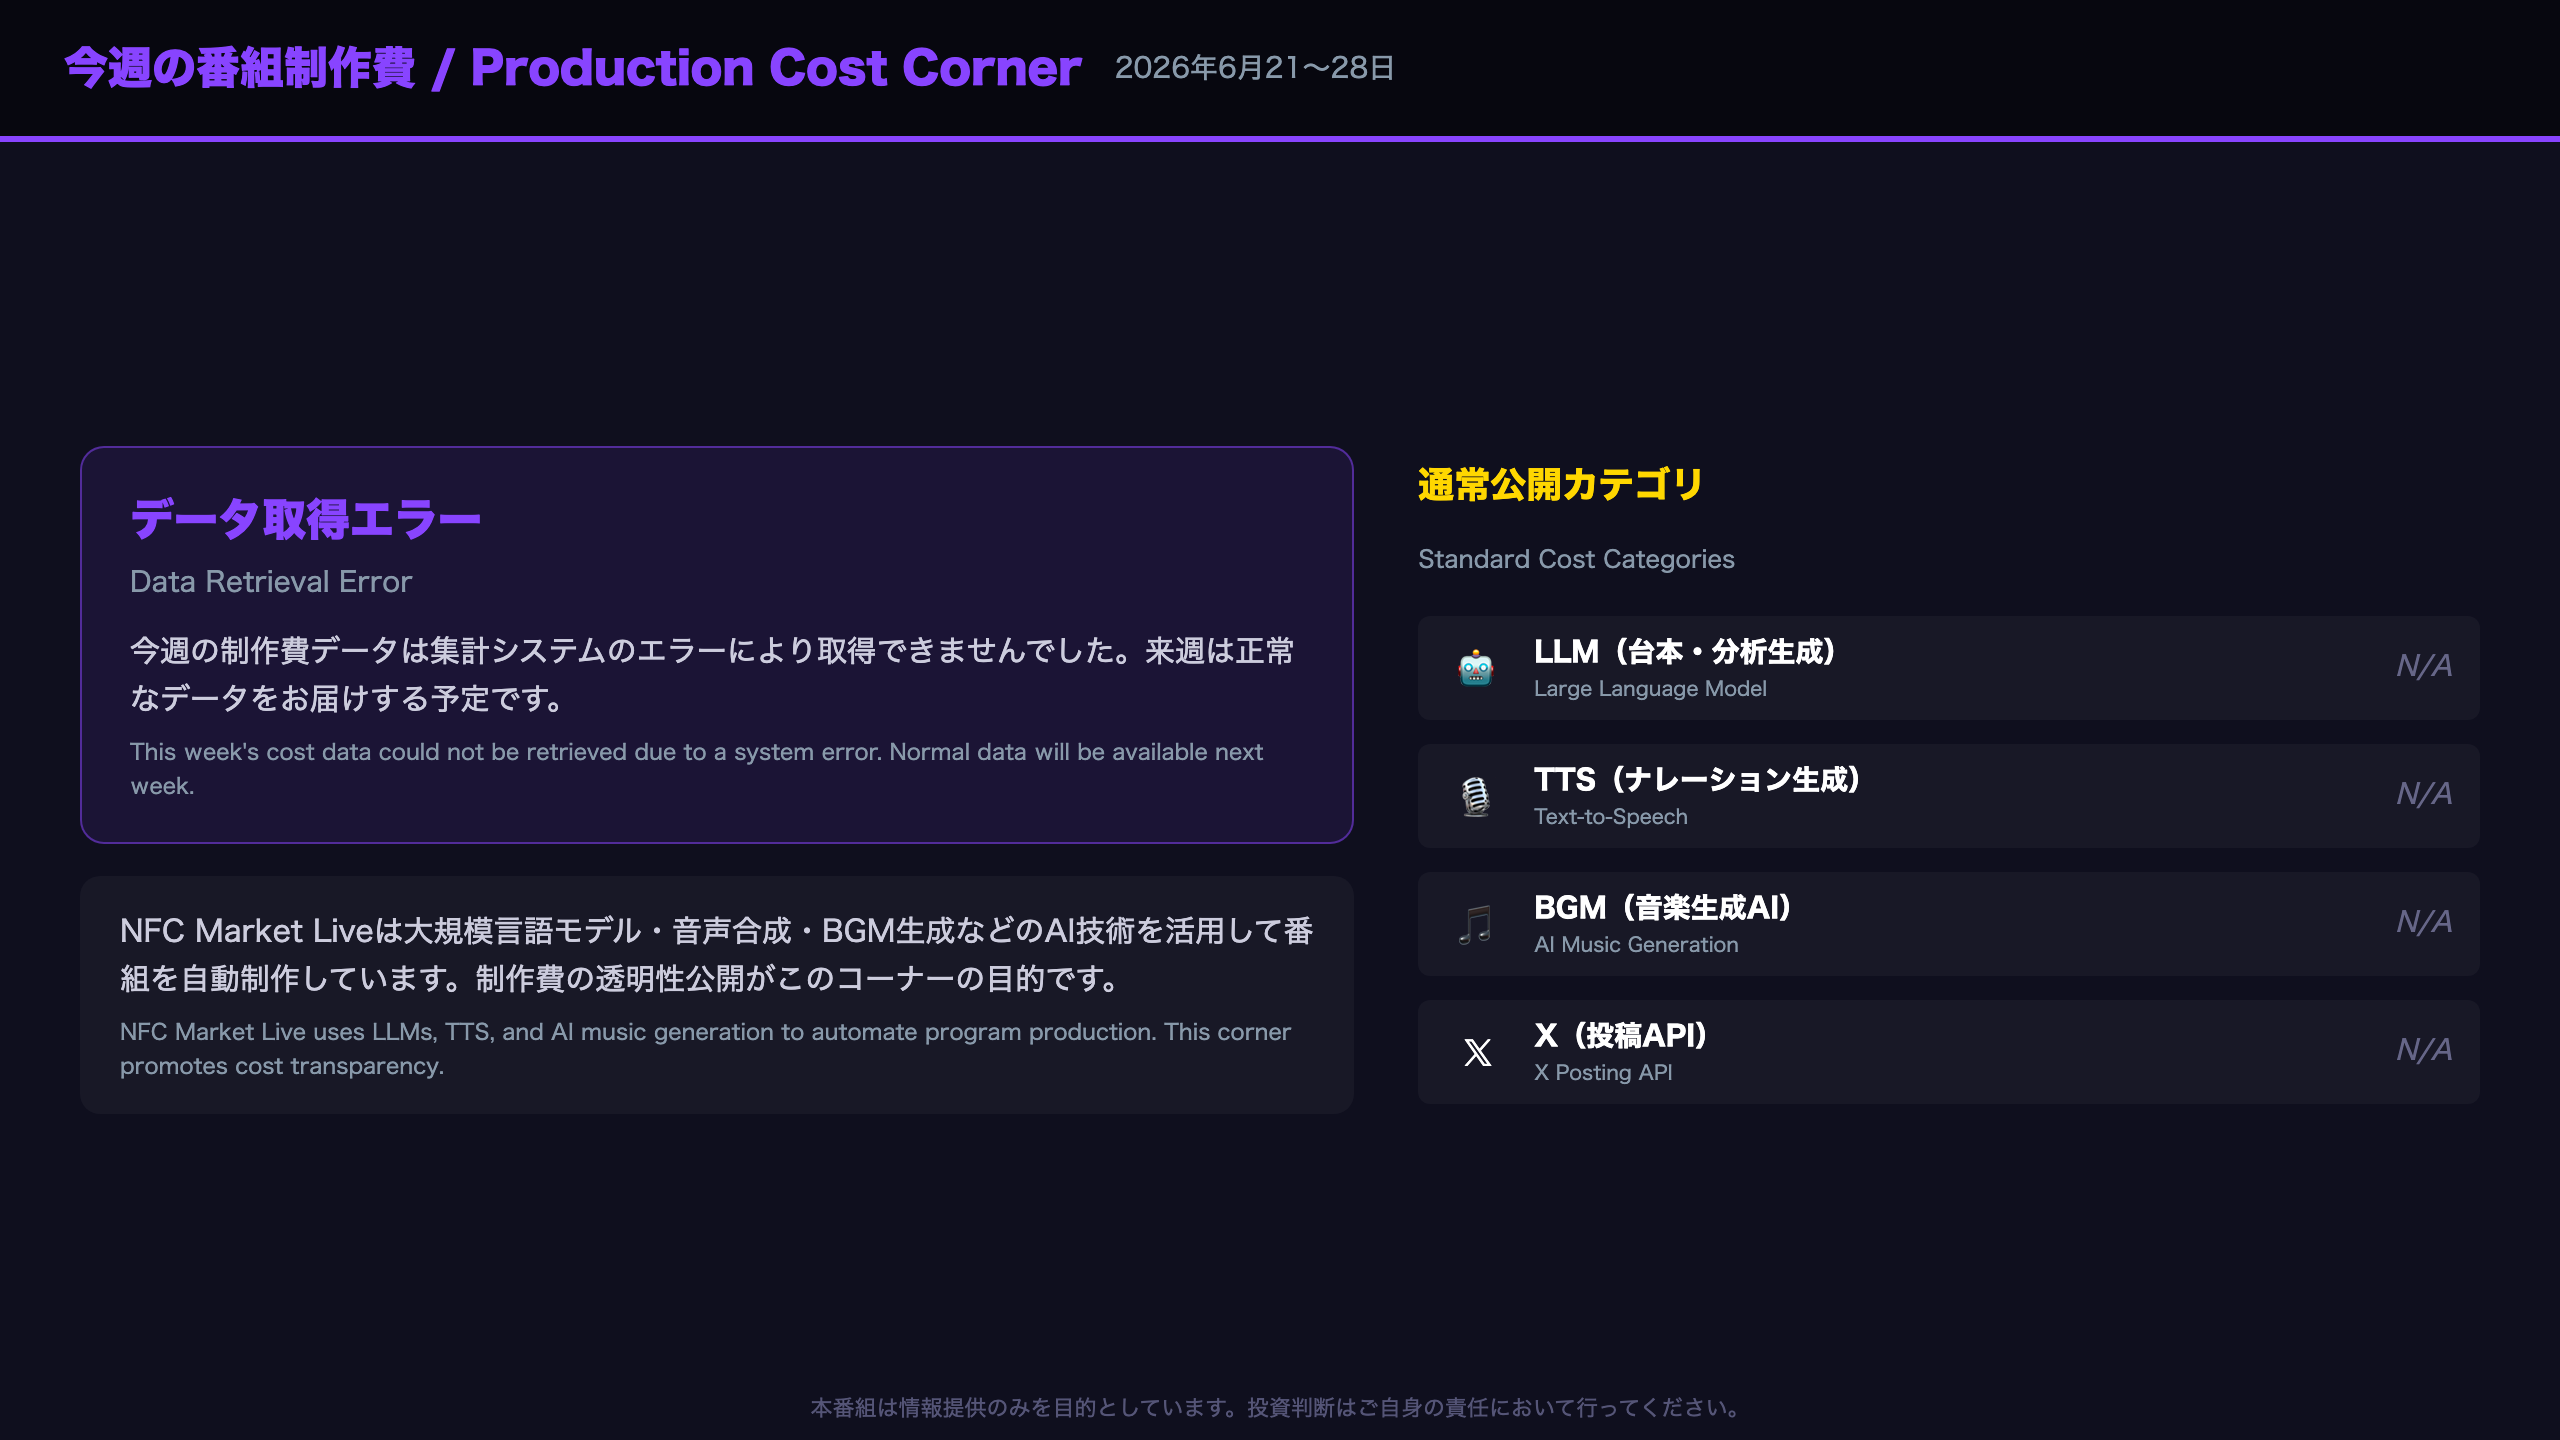
Production Cost Corner: Data Retrieval Error Notice
This week’s (June 21–28, 2026) production cost data could not be retrieved due to a system error (format_weekly_summary() got an unexpected keyword argument 'days').
About the Production Cost Corner
NFC Market Live publishes weekly API costs across four categories:
| Category | Description |
|---|---|
| LLM | Large Language Model costs (script & analysis generation) |
| TTS | Text-to-Speech synthesis (narration generation) |
| BGM | AI music generation (program background music) |
| X | X (formerly Twitter) posting API |
Purpose of Cost Transparency
By sharing the actual costs of AI-driven automated news production, NFC Market Live aims to contribute to the democratization of AI technology and promote transparency in automated media production.
Next Week
We expect to have normal production cost data available for the weekly review covering June 29 – July 5, 2026.
来週の注目イベントカレンダー
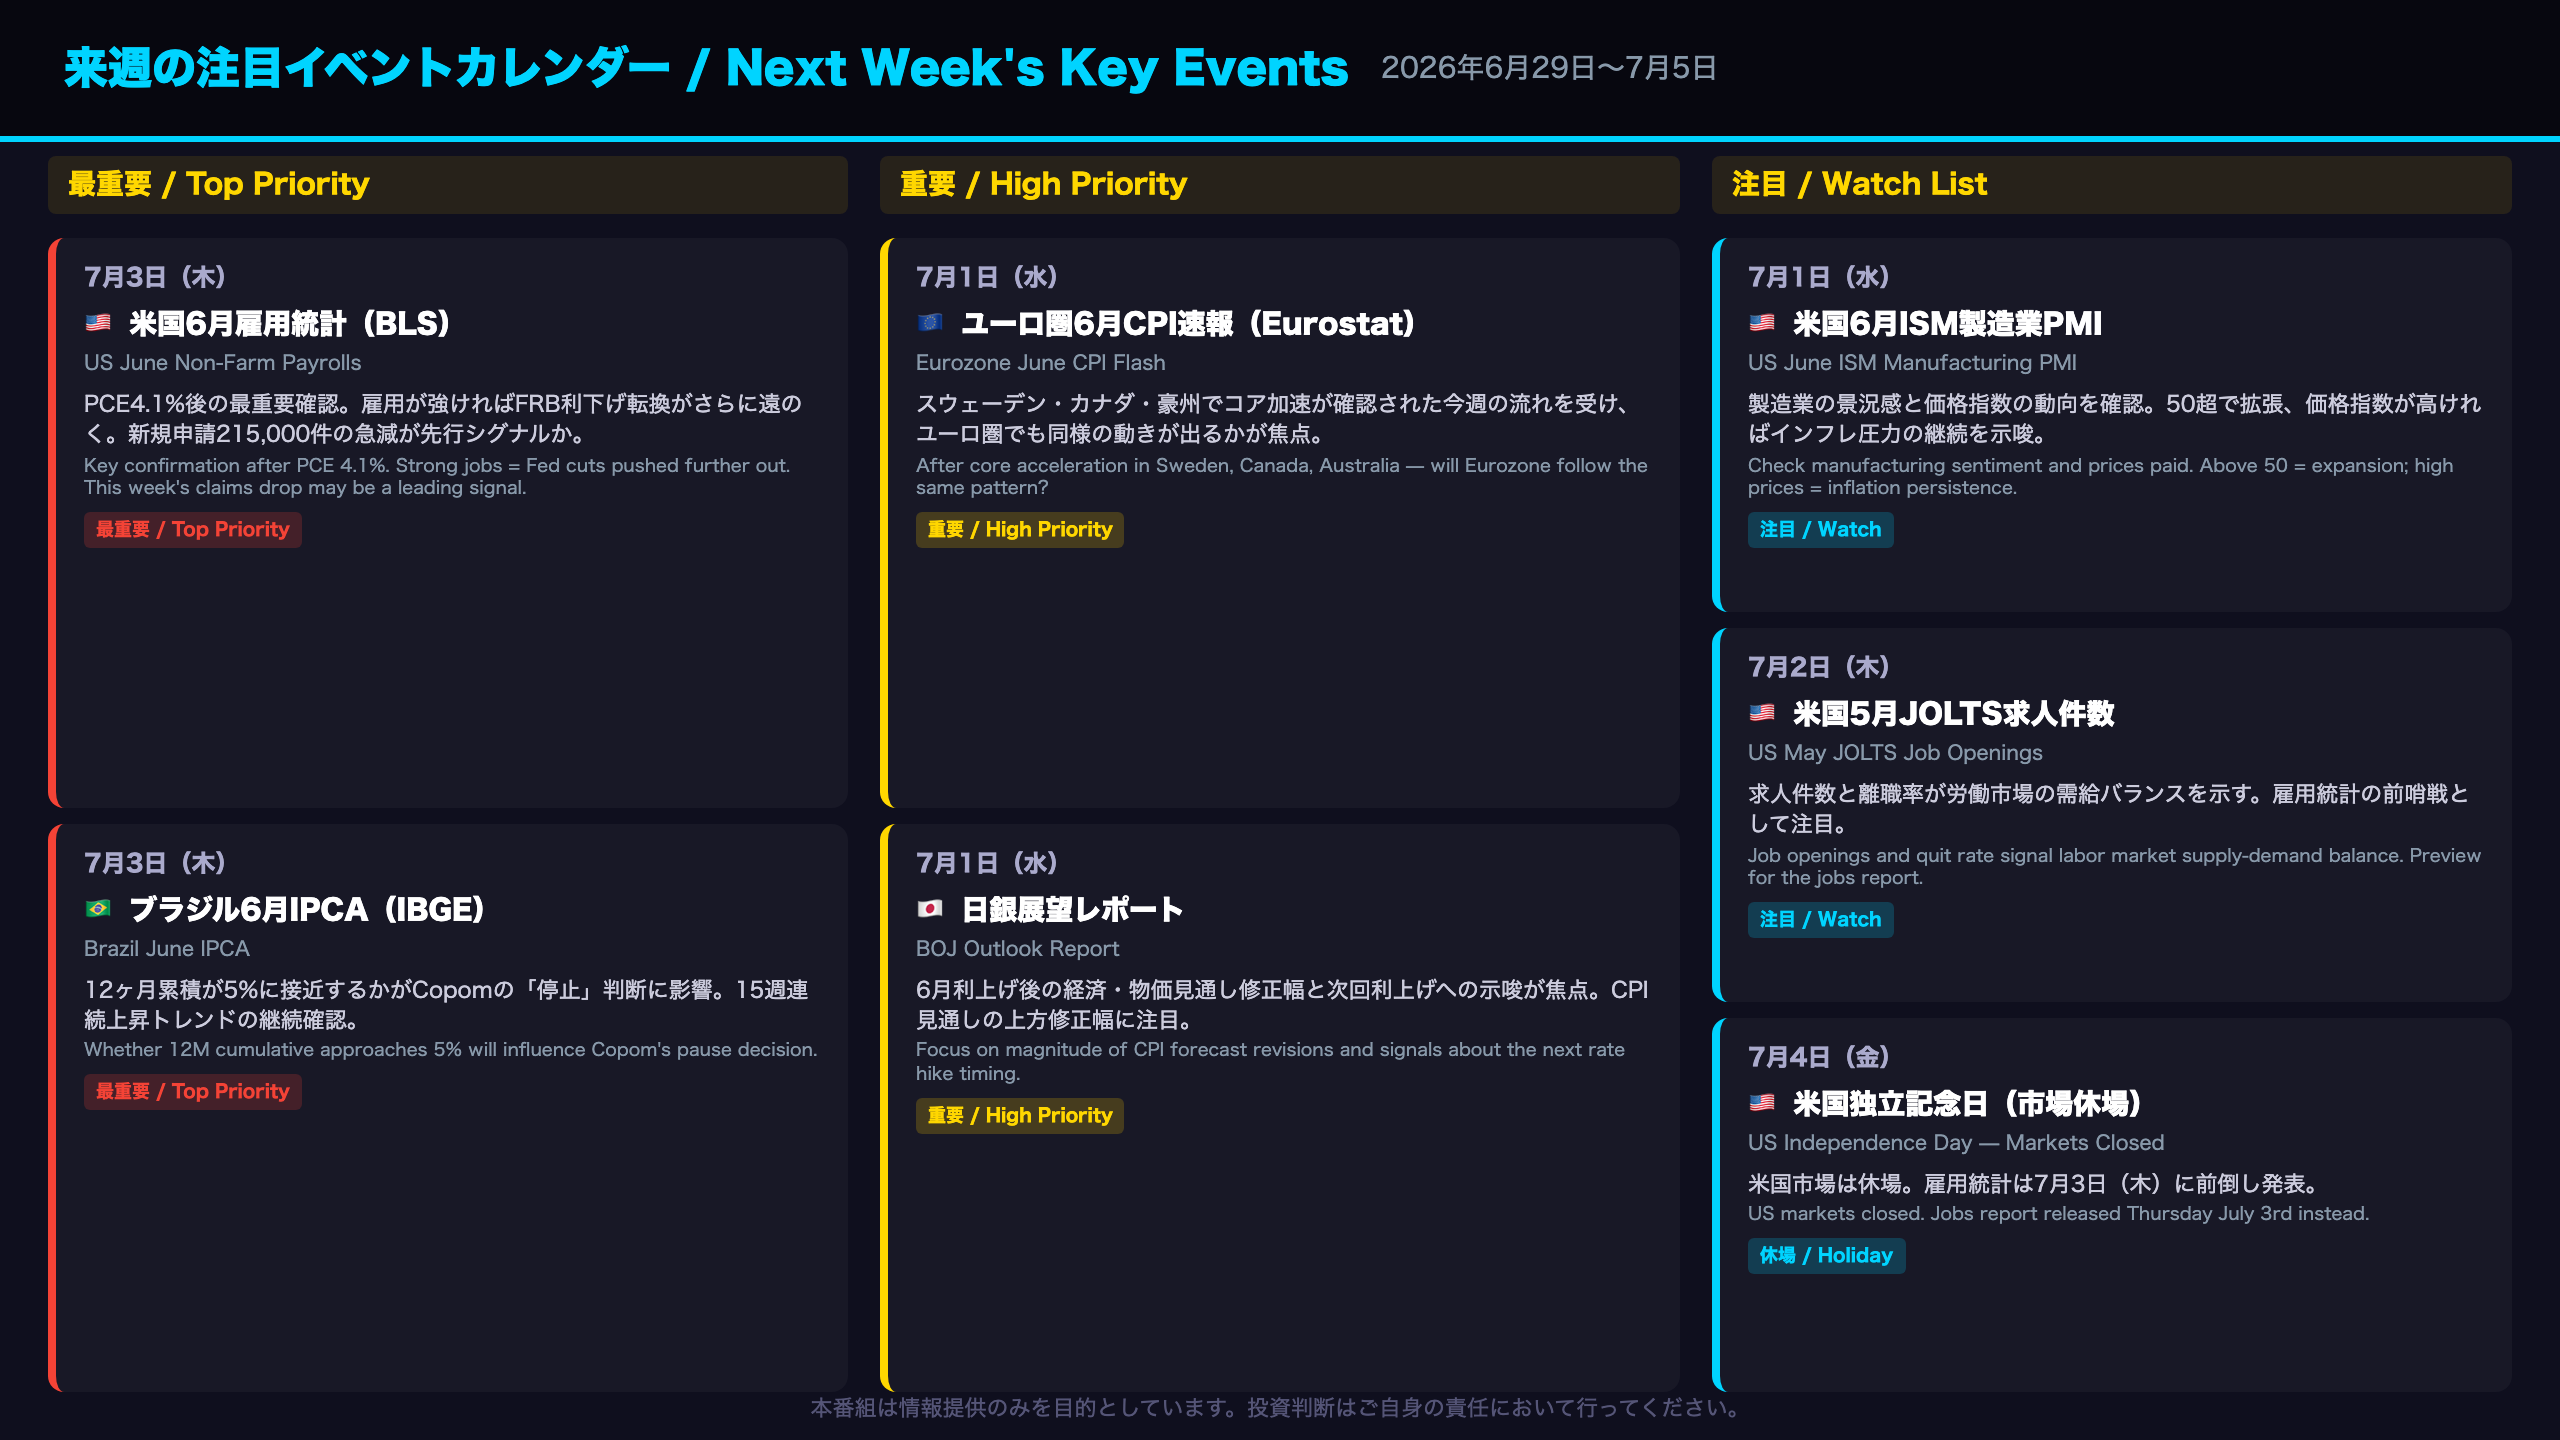
Next Week’s Key Event Calendar (June 29 – July 5, 2026)
Top Priority Events
Thursday, July 3: US June Jobs Report (BLS)
Why it matters: Following this week’s PCE at 4.1% and core PCE at 3.4%, the jobs report will determine whether labor market strength is sustaining inflation pressure.
Chain of reasoning: [Non-farm payrolls beat expectations] → [Strong labor market sustains inflation pressure] → [Fed rate cut expectations pushed further out, upward pressure on Treasury yields]
Key thresholds: NFP above +200K and unemployment rate at or below 4.0% would reinforce the hawkish interpretation.
Wednesday, July 1: Eurozone June CPI Flash (Eurostat)
Why it matters: Following core inflation acceleration in Sweden, Canada, and Australia this week, the question is whether the Eurozone shows a similar pattern. The ECB’s HMM model is already in ‘Latent Inflation’ regime — an upside surprise could push back ECB rate cut expectations.
Wednesday, July 1: BOJ Outlook Report
Why it matters: Following the June rate hike, the BOJ’s revised economic and price forecasts will be closely watched. Key focus: the magnitude of upward revisions to FY2026 and FY2027 CPI forecasts, and any signals about the next rate hike timing.
Thursday, July 3: Brazil June IPCA (IBGE)
Why it matters: With the 12-month cumulative rate at 4.72% in May, whether June approaches 5% will be a critical input for Copom’s ‘pause’ decision at the next meeting.
Other Key Indicators
- July 1 (Wed): US June ISM Manufacturing PMI
- July 2 (Thu): US May JOLTS Job Openings
- July 3 (Thu): US June ADP Employment Report
- July 4 (Fri): US Independence Day (markets closed)
Disclaimer: This article is for informational purposes only. All investment decisions are made solely at your own risk.