📺 Watch the Full Video Analysis
This article was automatically generated by the NFC Market Live AI analysis system. (Updated: 2026-06-25 14:10 JST)
📄 Primary Source
内閣府経済社会総合研究所
https://www.esri.cao.go.jp/jp/stat/di/202604psummary.pdf
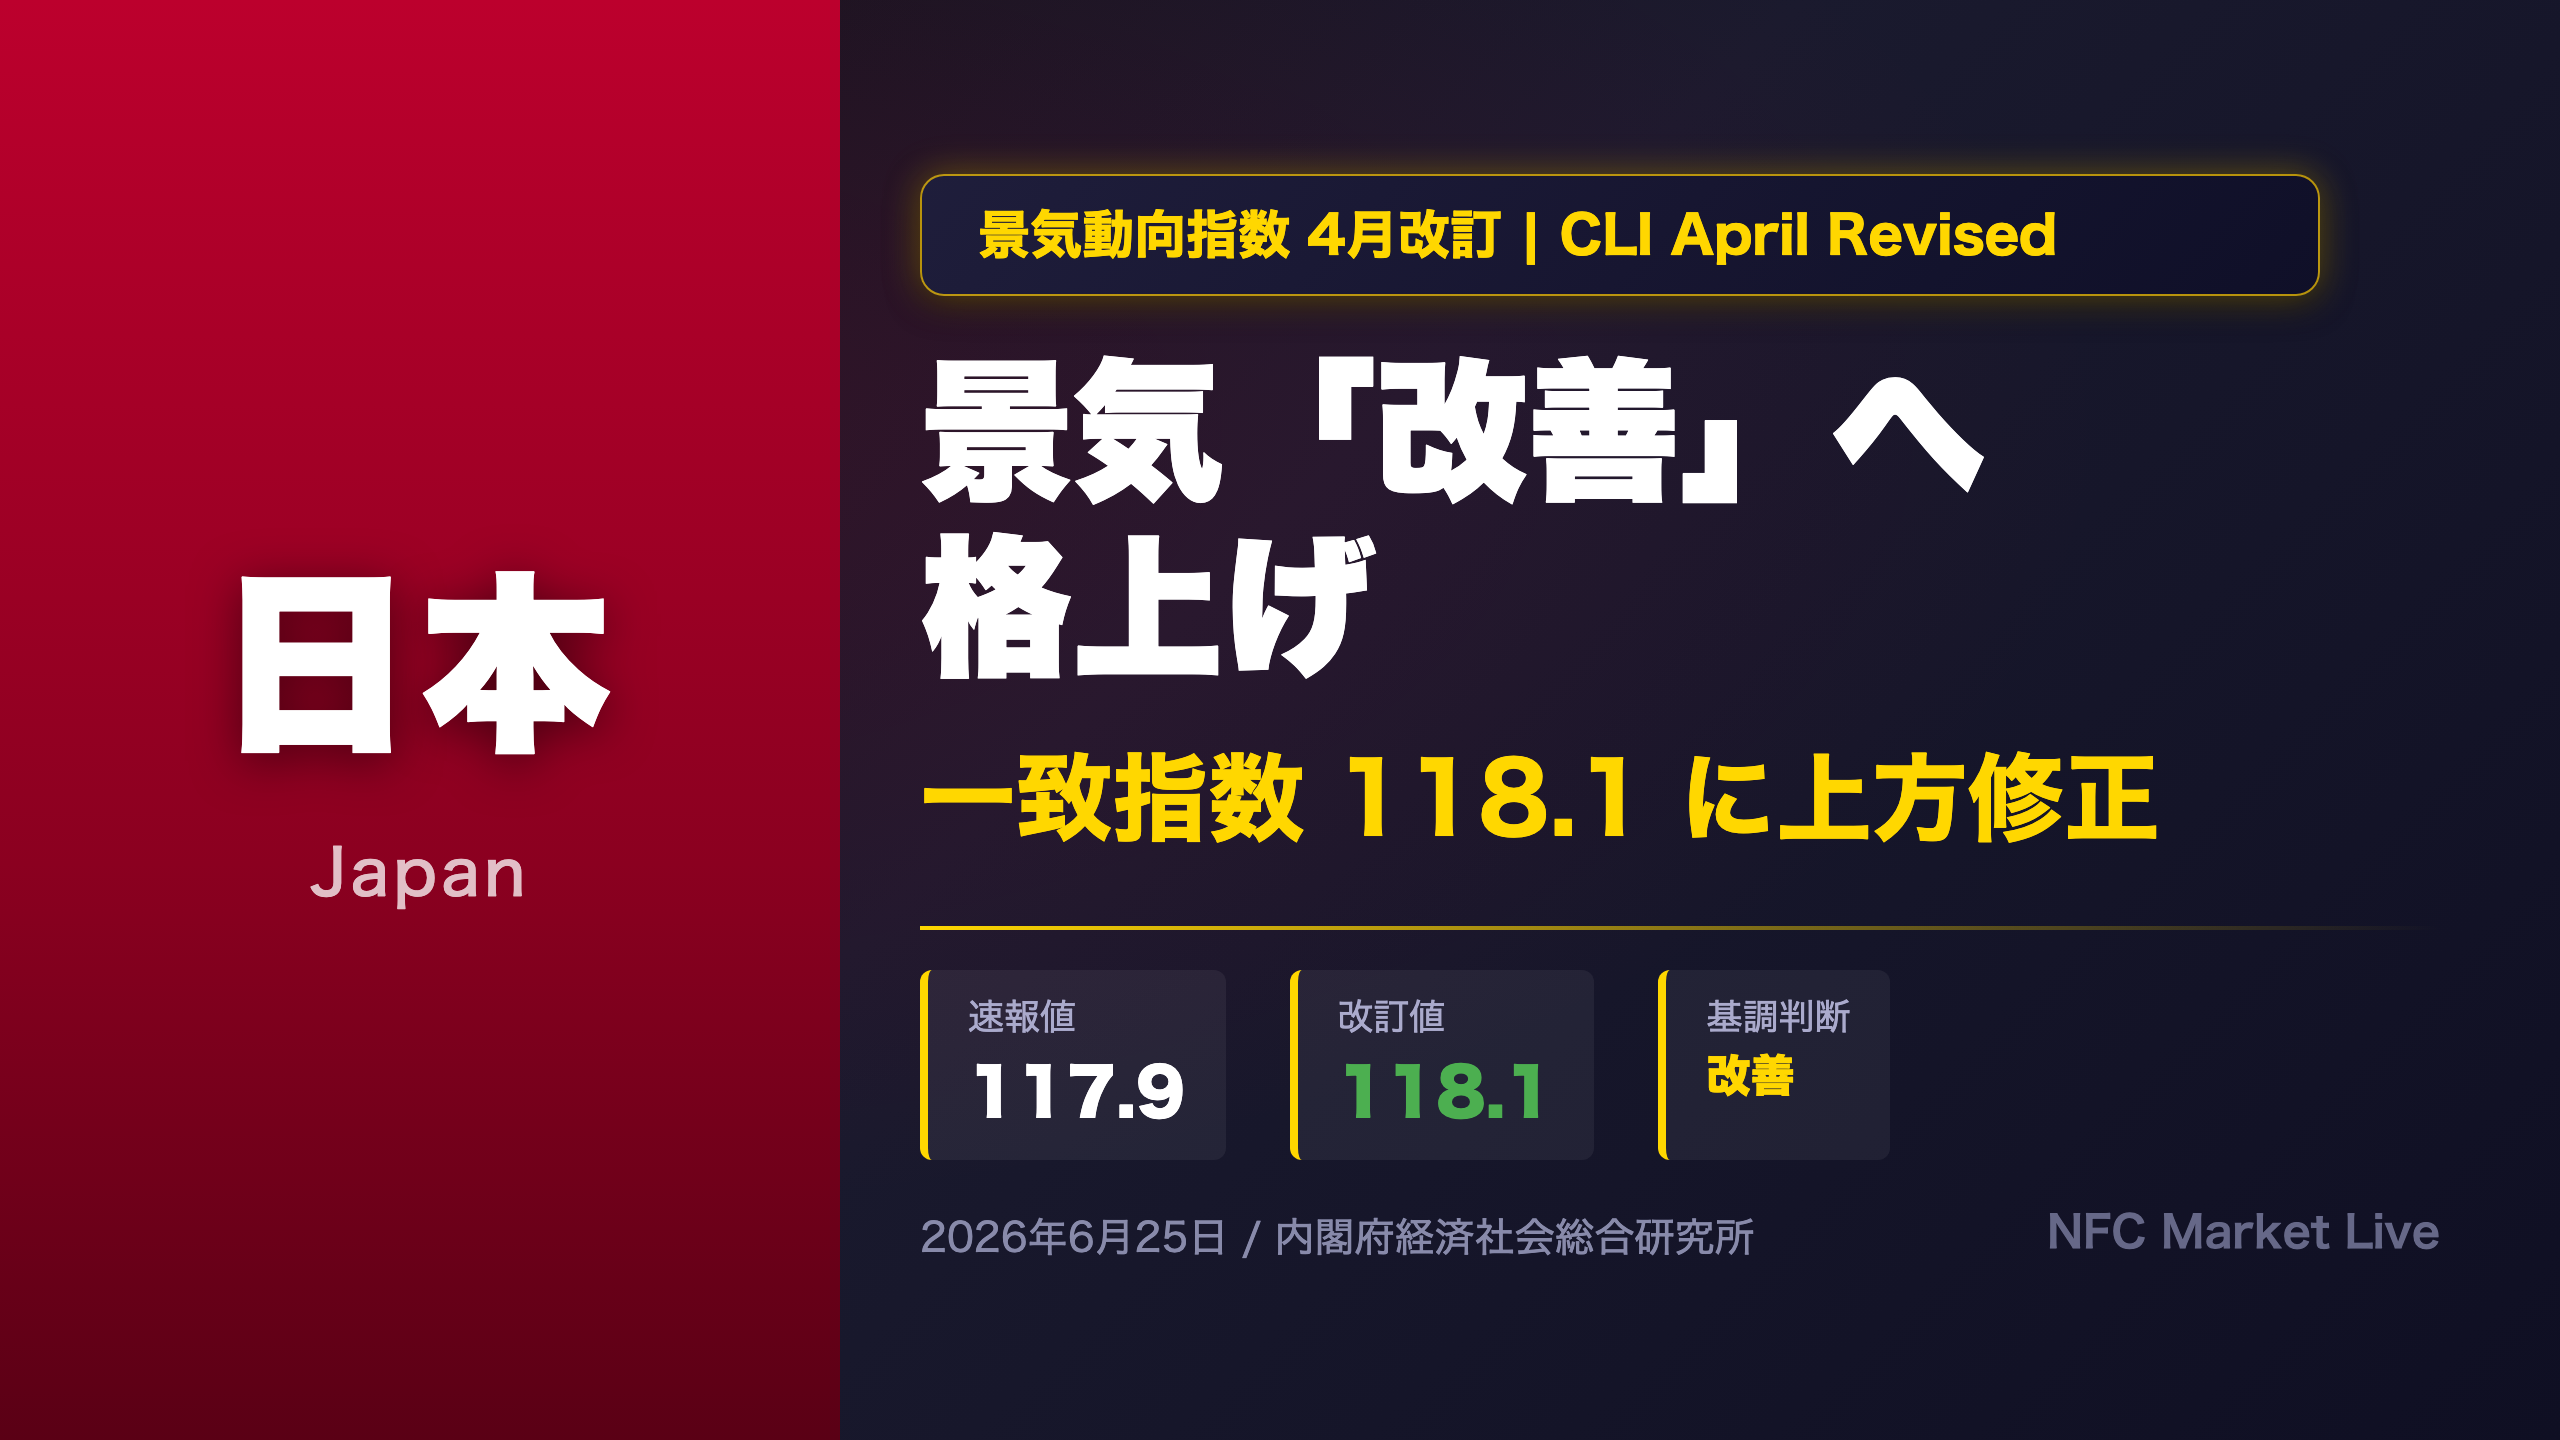
Deep dive into Japan’s April 2026 Composite Index of Business Conditions (CLI) revised data, released June 25 by Cabinet Office ESRI. The coincident index was revised up from 117.9 to 118.1, and the official assessment was upgraded from ‘Upward Phase Change’ to ‘Improving’ — signaling Japan may have passed a cyclical trough. We analyze the leading, coincident, and lagging indices, key contributors, and what this means for BOJ policy and Japanese equities.
The Ultimate Summary:基調判断「改善」へ格上げ、日本景気の現在地
From Flash to Revised: What the Assessment Upgrade Really Means
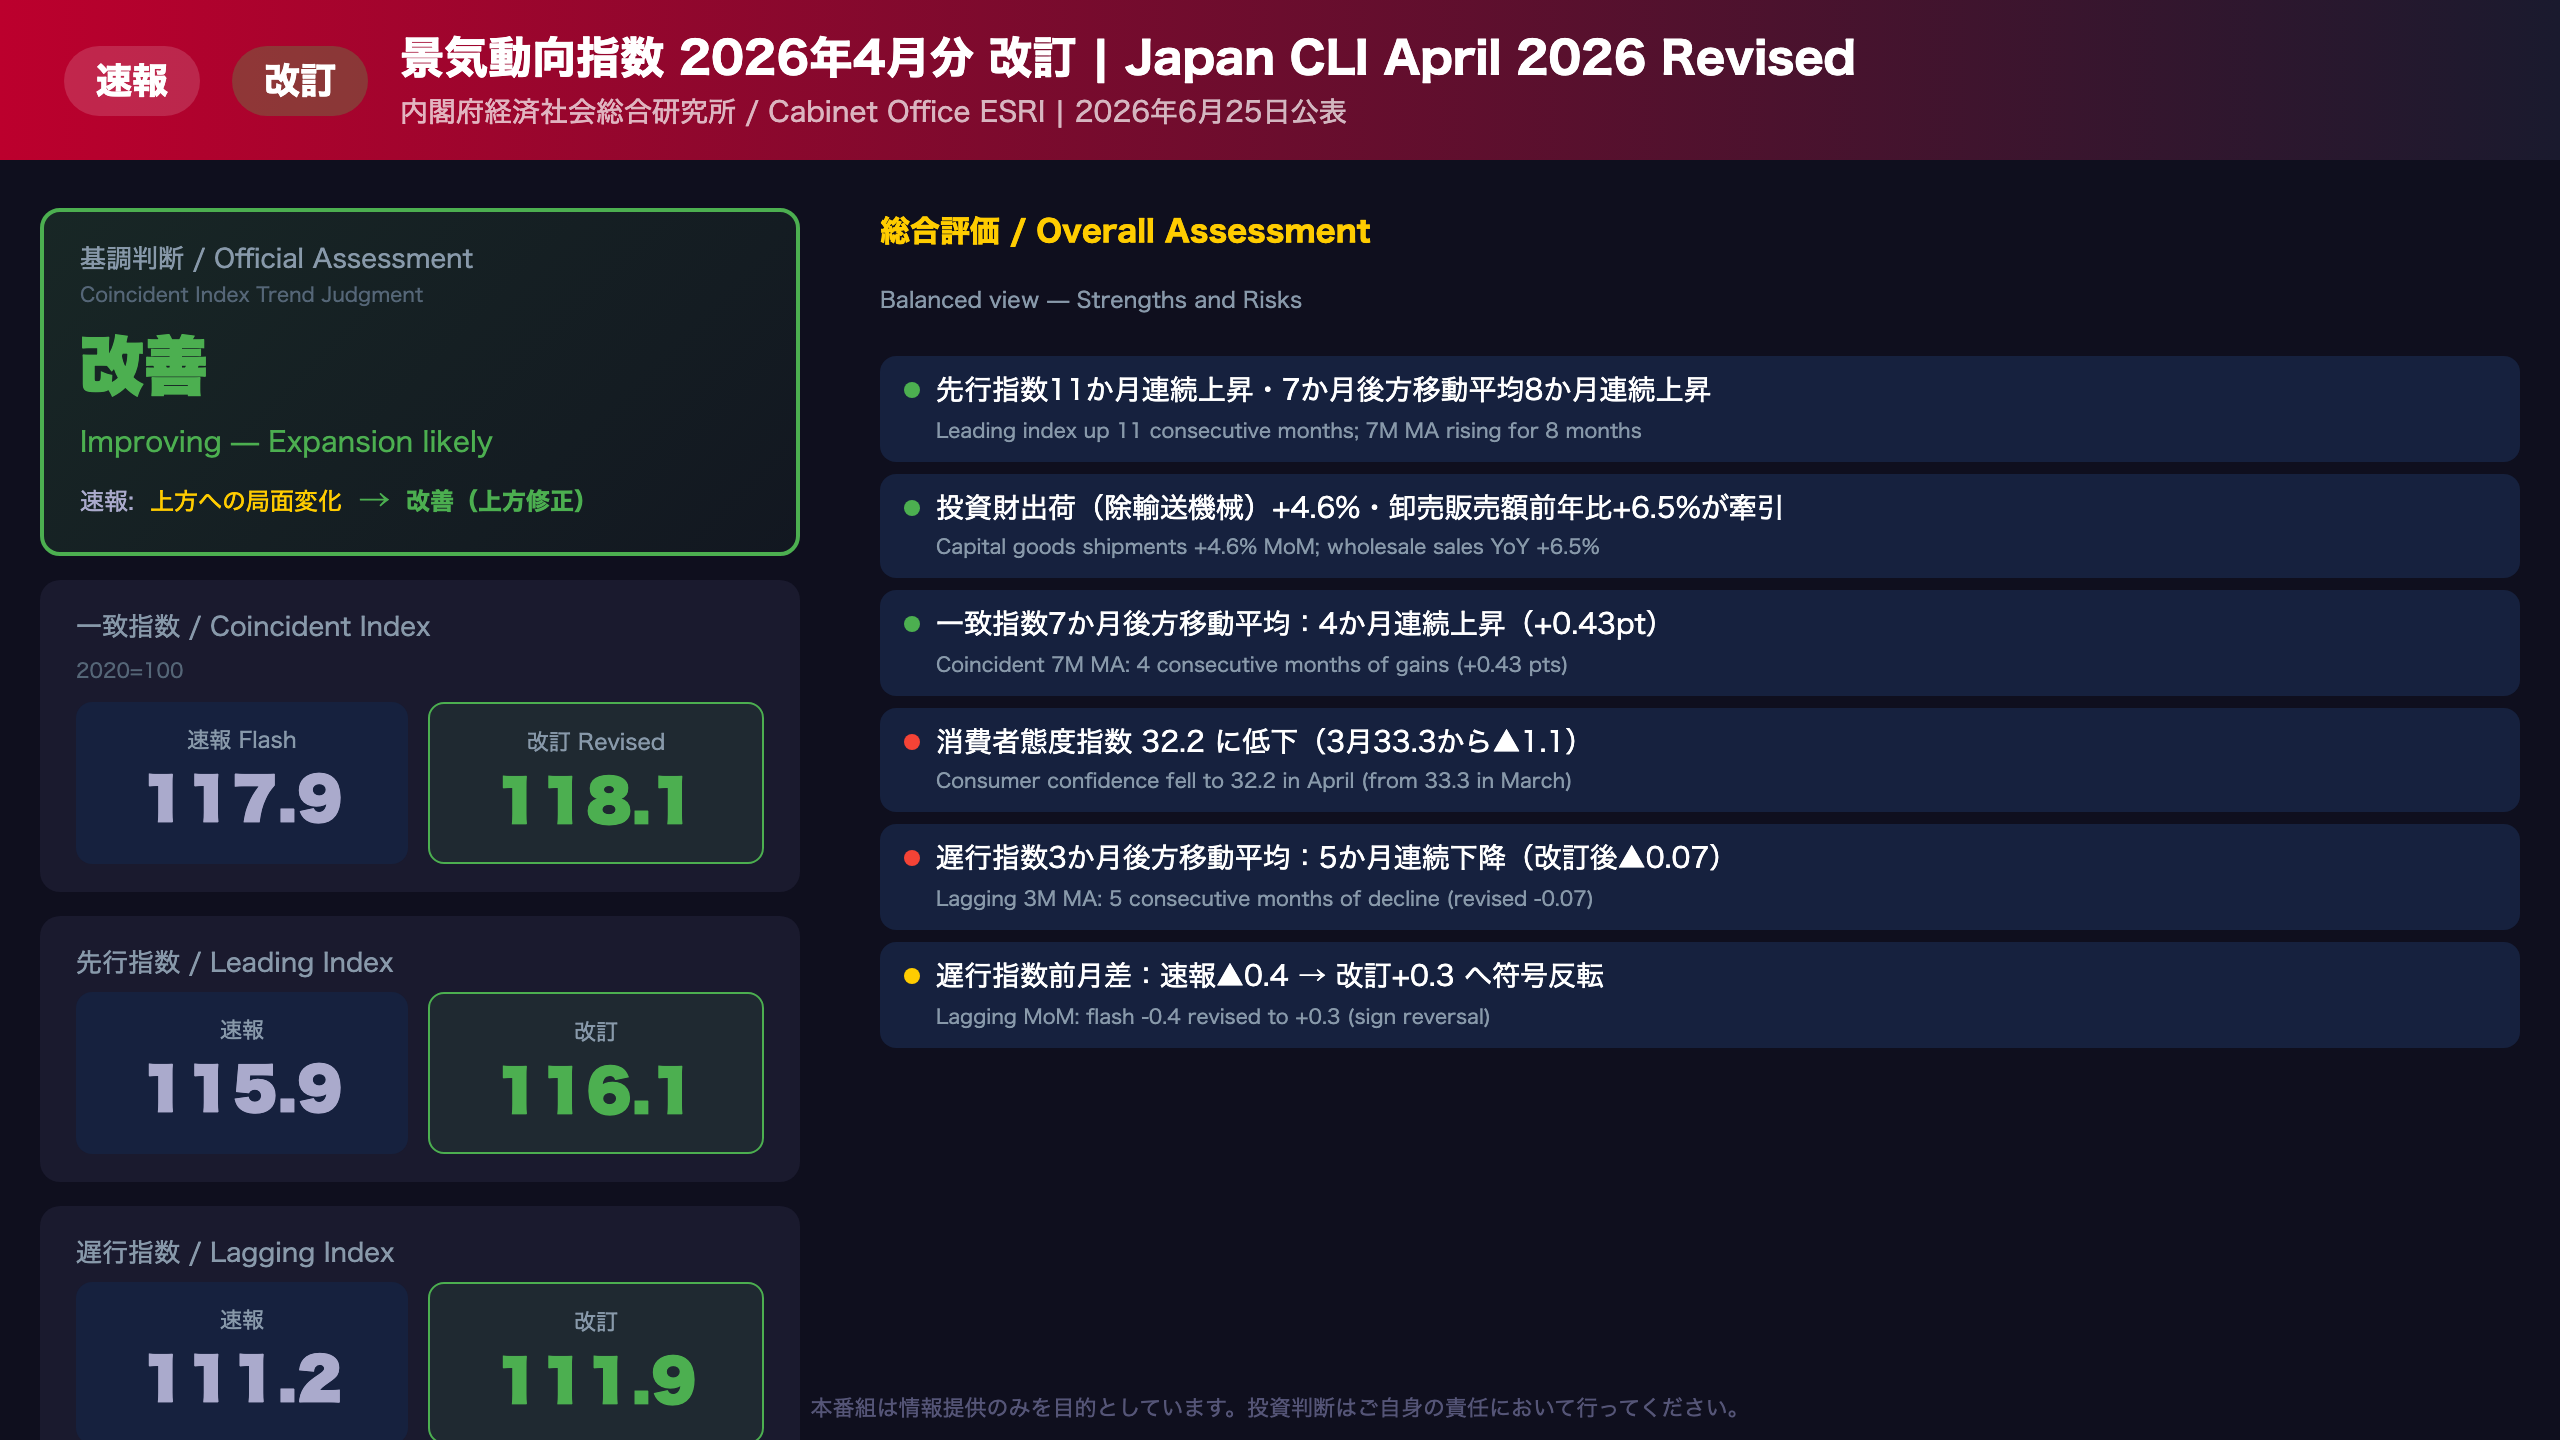
The headline from Japan’s April 2026 CLI revised data, released June 25 by the Cabinet Office’s Economic and Social Research Institute (ESRI), is the upgrade of the official business cycle assessment from ‘Upward Phase Change’ to ‘Improving.’
Understanding Japan’s CLI Framework
For international investors unfamiliar with Japan’s system: the Cabinet Office publishes a Composite Index of Business Conditions (景気動向指数, CLI) monthly, comprising three sub-indices — Leading (先行), Coincident (一致), and Lagging (遅行). The coincident index is used to determine the official business cycle phase, assessed through a five-tier framework:
- Improving (改善) — expansion likely
- Pause (足踏み) — expansion stalling
- Phase Change (局面変化) — upward or downward turning point
- Deteriorating (悪化) — contraction likely
- Bottoming Out (下げ止まり) — contraction stabilizing
The upgrade from ‘Upward Phase Change’ to ‘Improving’ is significant: it moves from a tentative signal that a trough was passed, to a higher-confidence assessment that an expansionary phase is underway.
Revision Summary
| Index | Flash | Revised | Change |
|---|---|---|---|
| Leading | 115.9 | 116.1 | +0.2 |
| Coincident | 117.9 | 118.1 | +0.2 |
| Lagging | 111.2 | 111.9 | +0.7 |
The lagging index revision (+0.7 pts) is notable — the month-on-month change flipped from -0.4 (flash) to +0.3 (revised), driven by newly added series including manufacturing wages and household consumption expenditure.
Key Drivers and Risks
Bullish factors: Capital goods shipments (ex-transport) rose +4.6% MoM in April, contributing +0.51 pts to the coincident index. Wholesale sales YoY hit +6.5%, the strongest reading in recent months. The leading index’s 7-month moving average has risen for eight consecutive months.
Risk factors: Consumer confidence (L6) fell to 32.2 in April from 33.3 in March. Core CPI (ex-fresh food) decelerated to +1.4% YoY — below the BOJ’s 2% target — suggesting real purchasing power recovery has yet to fully reach households.
Market Implications
The ‘Improving’ assessment, combined with the leading index’s sustained uptrend, provides incremental support for the BOJ’s case for further policy normalization. However, the deceleration in core CPI and softening consumer sentiment suggest the pace of any additional rate hikes is likely to remain gradual. Japanese cyclical equities (industrials, materials) may benefit from the confirmed expansion signal, while the yen’s reaction will depend on how markets weigh the growth upgrade against the CPI deceleration.
一致指数の深掘り:何が景気を動かしているか
Dissecting the Coincident Index: Component-Level Analysis
What Drove the April Gain?
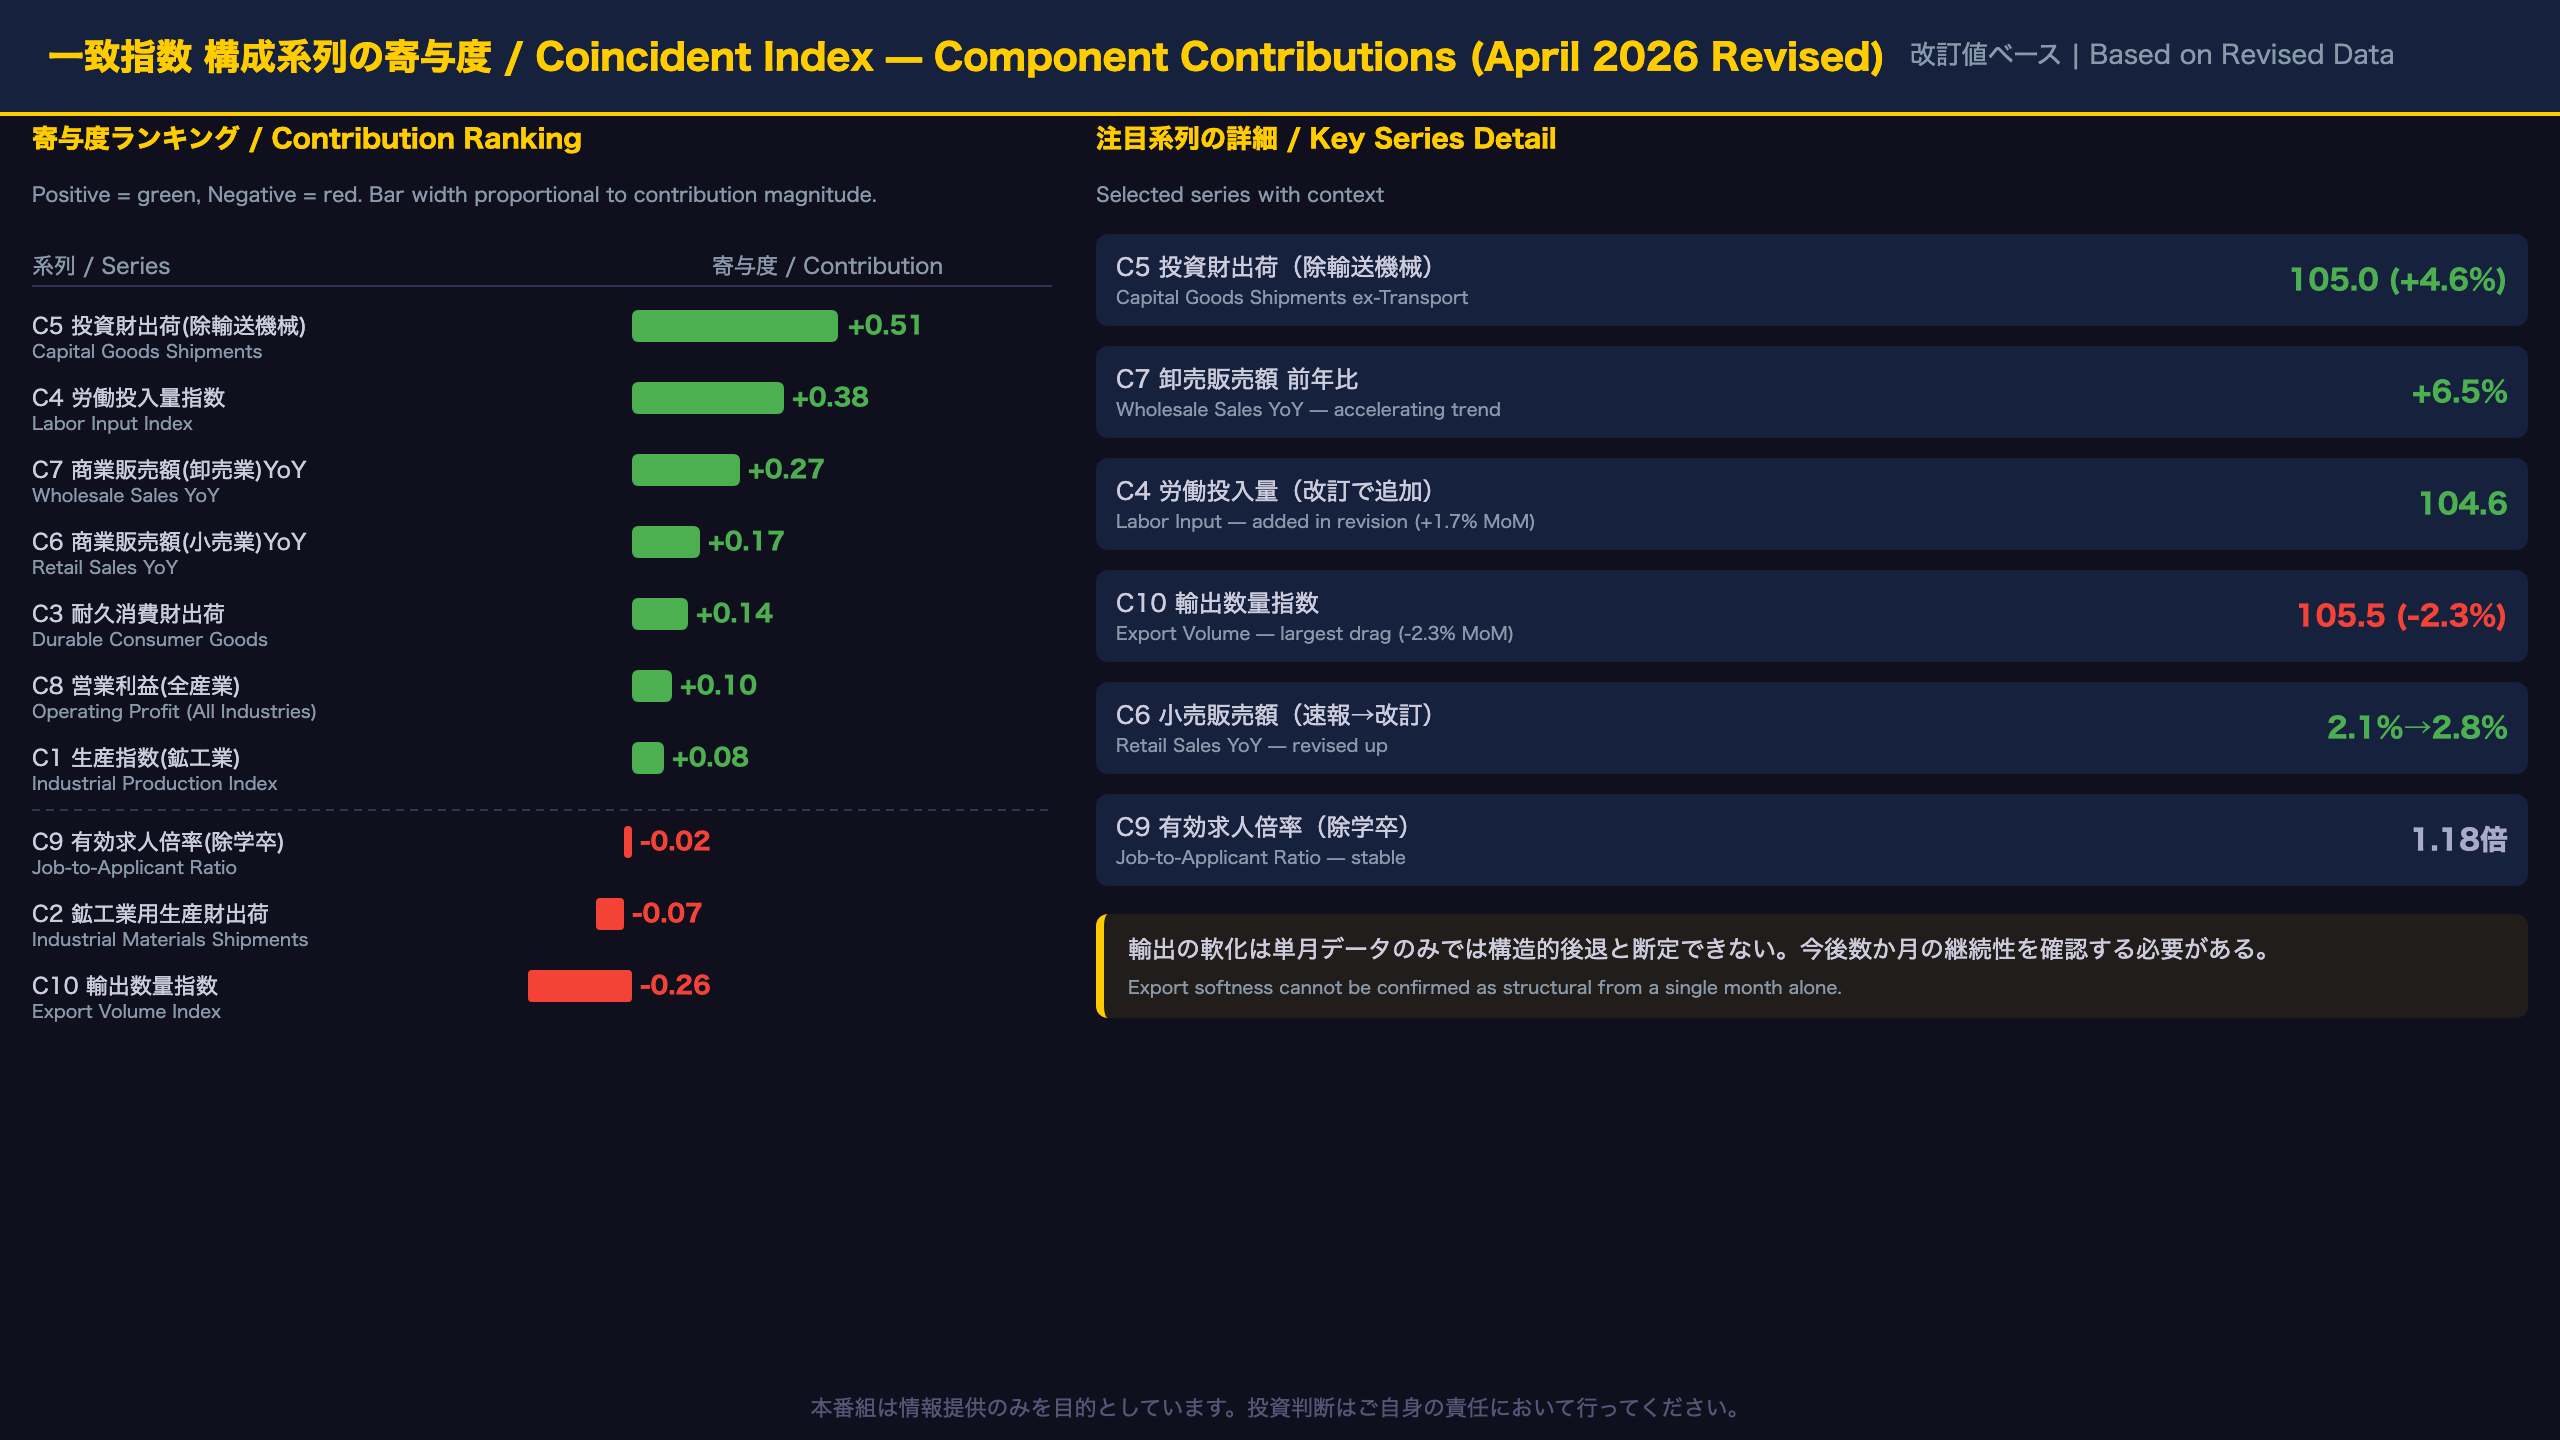
The revised coincident index of 118.1 reflects a net monthly gain of +1.3 points (revised from +1.1 in the flash). The key contributors, ranked by impact:
| Series | Change | Contribution |
|---|---|---|
| C5 Capital Goods Shipments (ex-transport) | +4.6% MoM | +0.51 pts |
| C4 Labor Input Index | +1.7% MoM | +0.38 pts |
| C7 Wholesale Sales (YoY) | +6.5% | +0.27 pts |
| C6 Retail Sales (YoY) | +2.8% | +0.17 pts |
| C3 Durable Consumer Goods Shipments | +1.7% MoM | +0.14 pts |
| C10 Export Volume Index | -2.3% MoM | -0.26 pts |
Capital Goods Shipments: Recovery or Noise?
C5 (capital goods shipments, excluding transport equipment) rebounded sharply from 100.4 in March to 105.0 in April (revised). This series is known for high month-to-month volatility — the January reading was 106.2, followed by a two-month dip. A single month’s rebound is consistent with a recovery trend but cannot confirm a sustained capex upswing on its own. Multiple months of data will be needed to validate the signal.
Wholesale Sales Acceleration: Broad-Based or Price-Driven?
The YoY growth rate of wholesale sales has accelerated markedly: +1.5% (Jan) → +1.6% (Feb) → +3.3% (Mar) → +6.5% (Apr). This could reflect genuine broadening of business activity, inventory restocking, or raw material procurement. However, yen depreciation and commodity price effects may be inflating nominal figures — a caveat worth noting when interpreting the magnitude.
Export Volume: A Tariff Warning Sign?
C10 (export volume index) fell from 108.0 in March to 105.5 in April. While still above the 2020 base of 100, the month-on-month decline of -2.3% is the largest drag on the coincident index. Whether this reflects the early impact of U.S. tariff policy on Japanese exports cannot be determined from a single data point, but it is the series most worth watching in coming months.
The Revision Effect: Labor Input Added
The most impactful revision was the addition of C4 (labor input index) at 104.6, which was unavailable in the flash release. Its +1.7% MoM gain contributed +0.38 points — the second-largest positive contributor. This addition, combined with the upward revision to retail sales (from 2.1% to 2.8% YoY), explains most of the 0.2-point upward revision to the headline coincident index.
先行指数の読み解き:11か月連続上昇が示す数か月先の景気
Leading Index 116.1: Sustained Trend vs. Household Sentiment Divergence
The Leading Index in Context
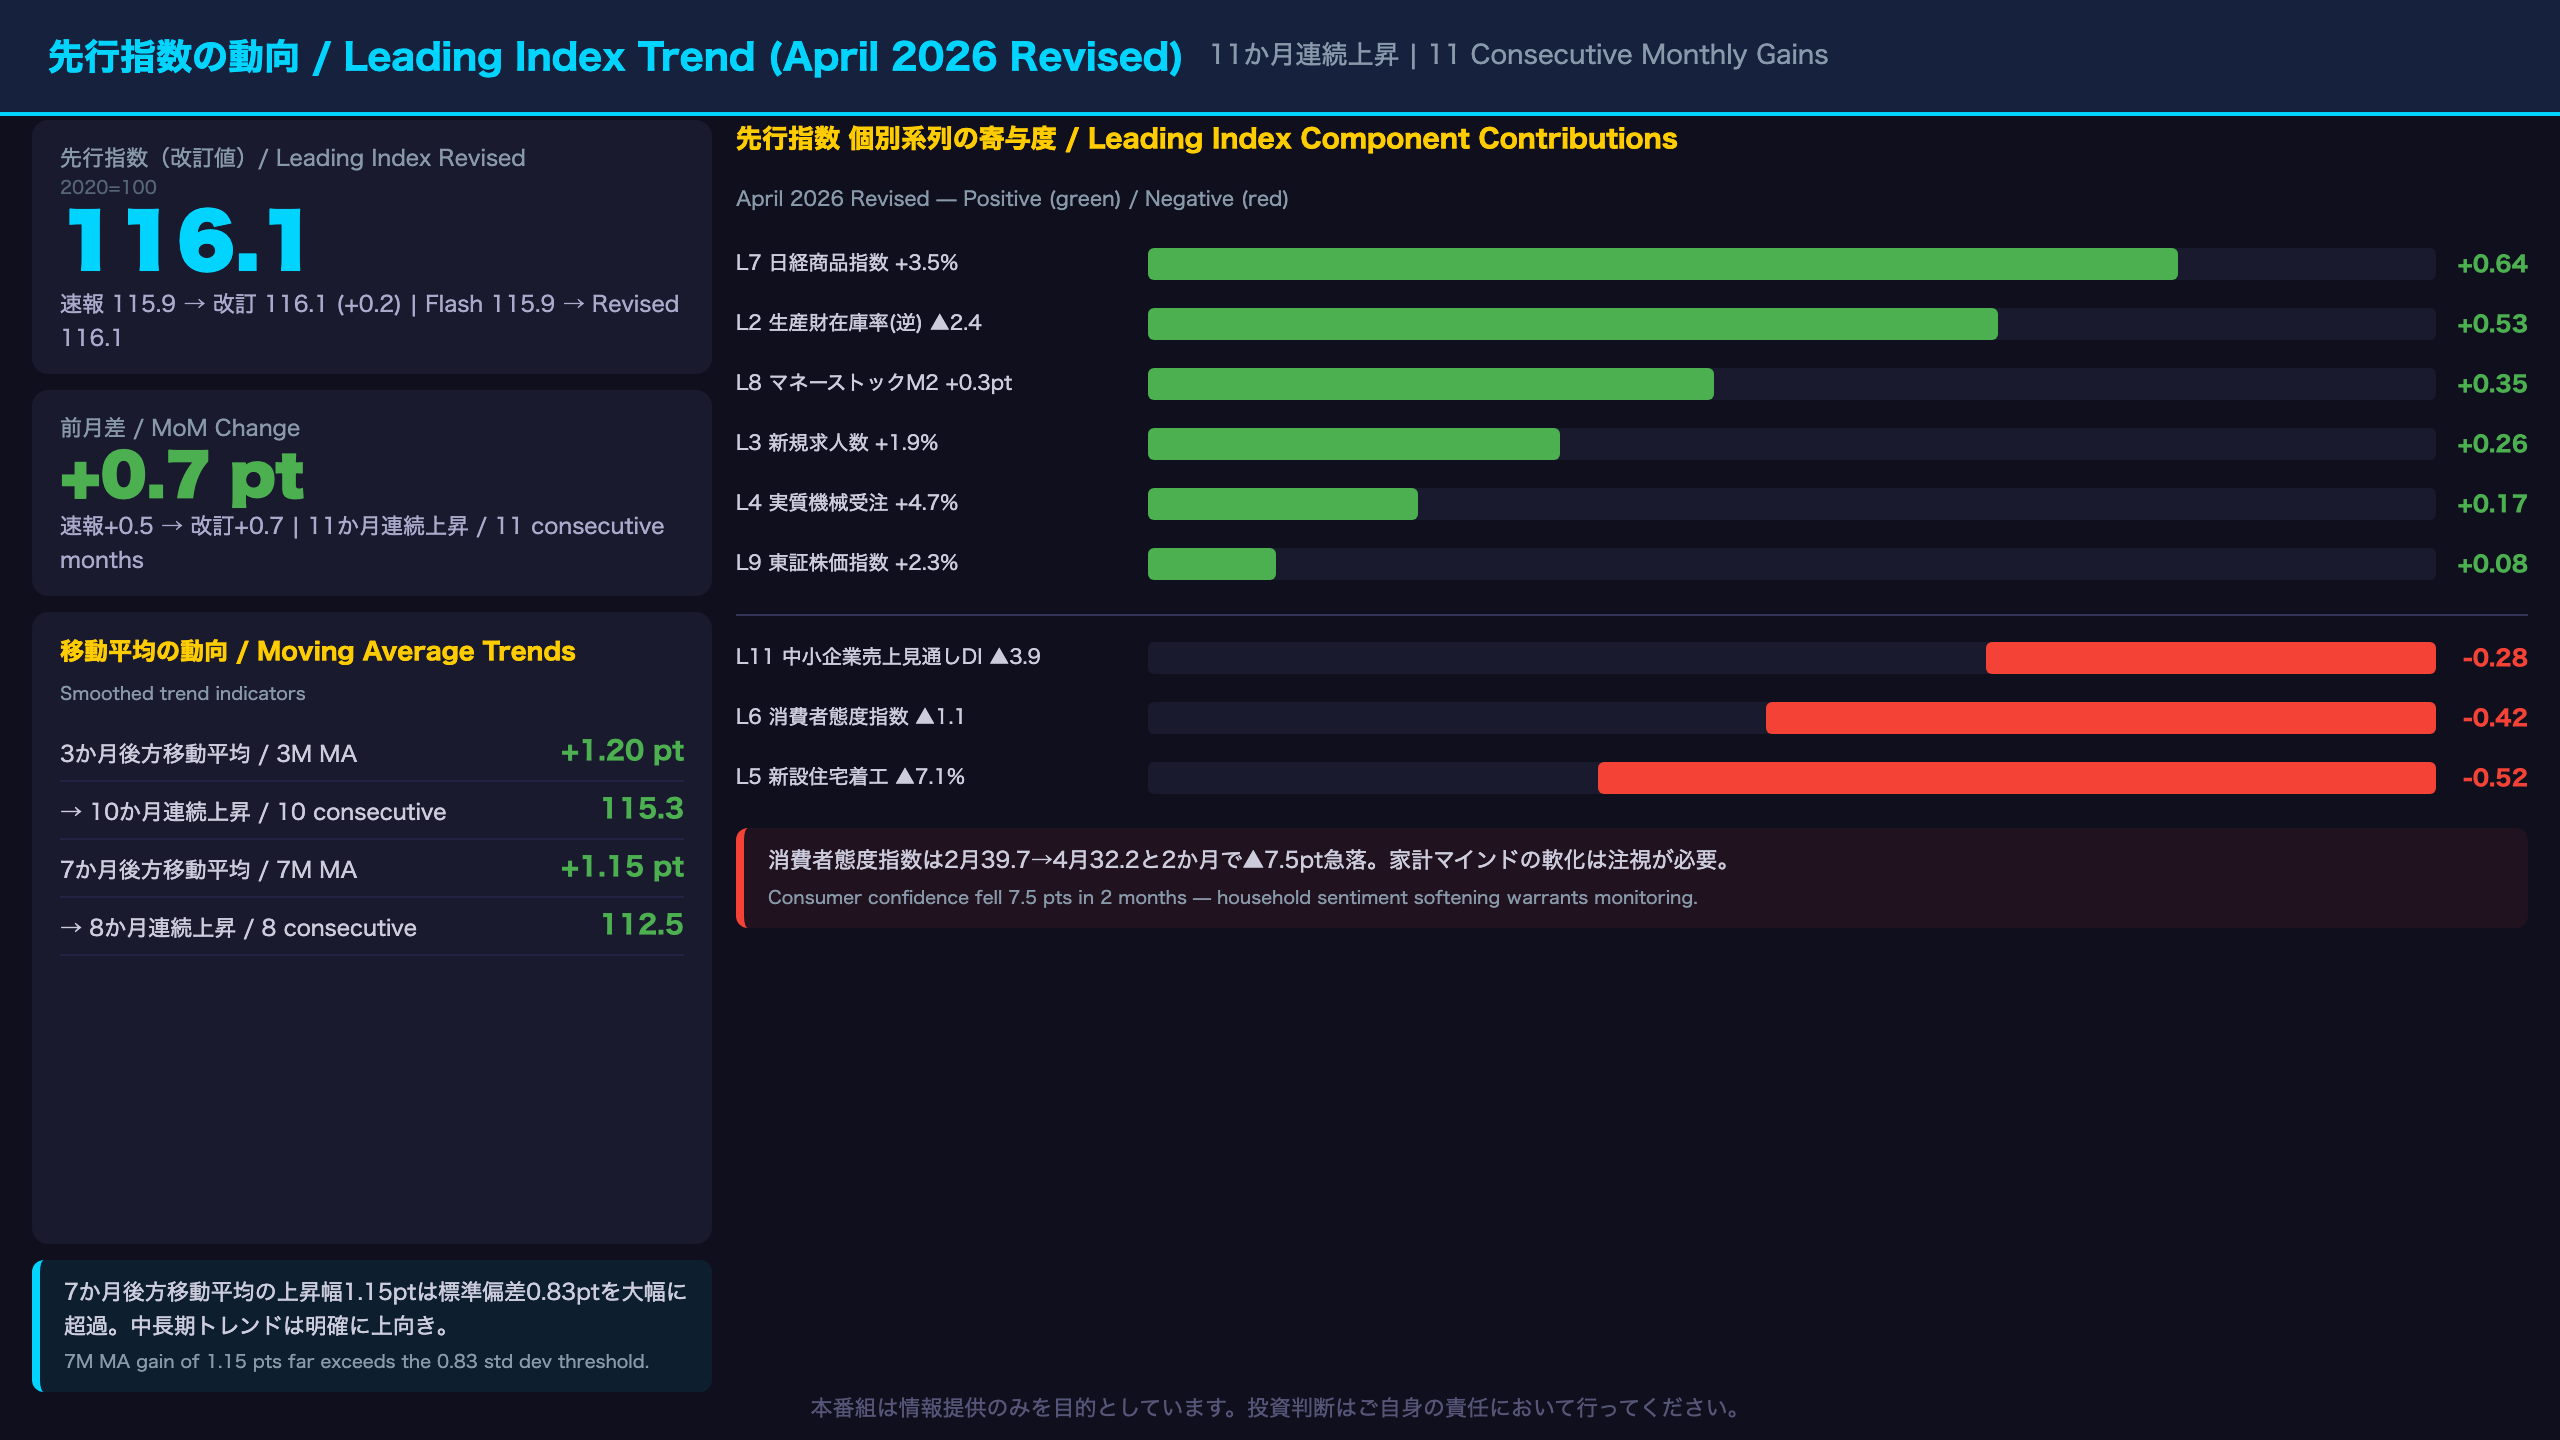
Japan’s leading index (先行指数) is a composite of 11 forward-looking indicators designed to anticipate economic conditions 3-6 months ahead. It is analogous to the Conference Board’s Leading Economic Index (LEI) in the U.S. The revised April reading of 116.1 extends the consecutive monthly gain streak to eleven months — a notably sustained uptrend that, in historical context, is associated with continued economic expansion.
Top Contributors: Commodities and Money Supply
The Nikkei Commodity Index (L7, 42-commodity composite) rose 3.5% MoM to 294.2 in April, contributing +0.64 points — the largest single positive contributor. The index has risen approximately 11% over the past seven months (from 265.2 in September 2025), reflecting broad commodity demand strength. However, yen depreciation may be inflating the yen-denominated index, so the real demand signal should be interpreted with some caution.
M2 money stock growth (L8) accelerated to +2.3% YoY in April (from +2.0% in March), contributing +0.35 points. This suggests financial conditions remain accommodative, consistent with the BOJ’s gradual normalization stance.
Key Drag: Consumer Confidence and Housing
The consumer confidence index (L6) fell sharply from a peak of 39.7 in February to 33.3 in March and 32.2 in April — a cumulative decline of 7.5 points in two months. This is the largest drag on the leading index (-0.42 pts). The decline likely reflects ongoing cost-of-living pressures and uncertainty around trade policy. That said, this series is volatile month-to-month, and a two-month decline alone does not confirm a structural deterioration in household sentiment.
New housing starts floor area (L5) fell 7.1% MoM in April, contributing -0.52 points. Housing starts have been volatile in recent months, and the April decline follows a +2.0% gain in March.
SME Outlook Turns Negative
The SME sales outlook DI (L11) turned negative in April at -1.8, down from +2.1 in March and a peak of +4.5 in February. This divergence between large-cap optimism (reflected in the TOPIX’s continued rise) and SME caution is a structural feature of Japan’s dual economy worth monitoring.
Bottom Line on the Leading Index
The 7-month moving average of the leading index has risen for eight consecutive months — a signal that, by the Cabinet Office’s own criteria, is well above the 0.83 standard deviation threshold for a phase change. The sustained uptrend in the leading index is the single most important forward-looking signal in this report.
遅行指数と三指数の構造:景気サイクルの全体像
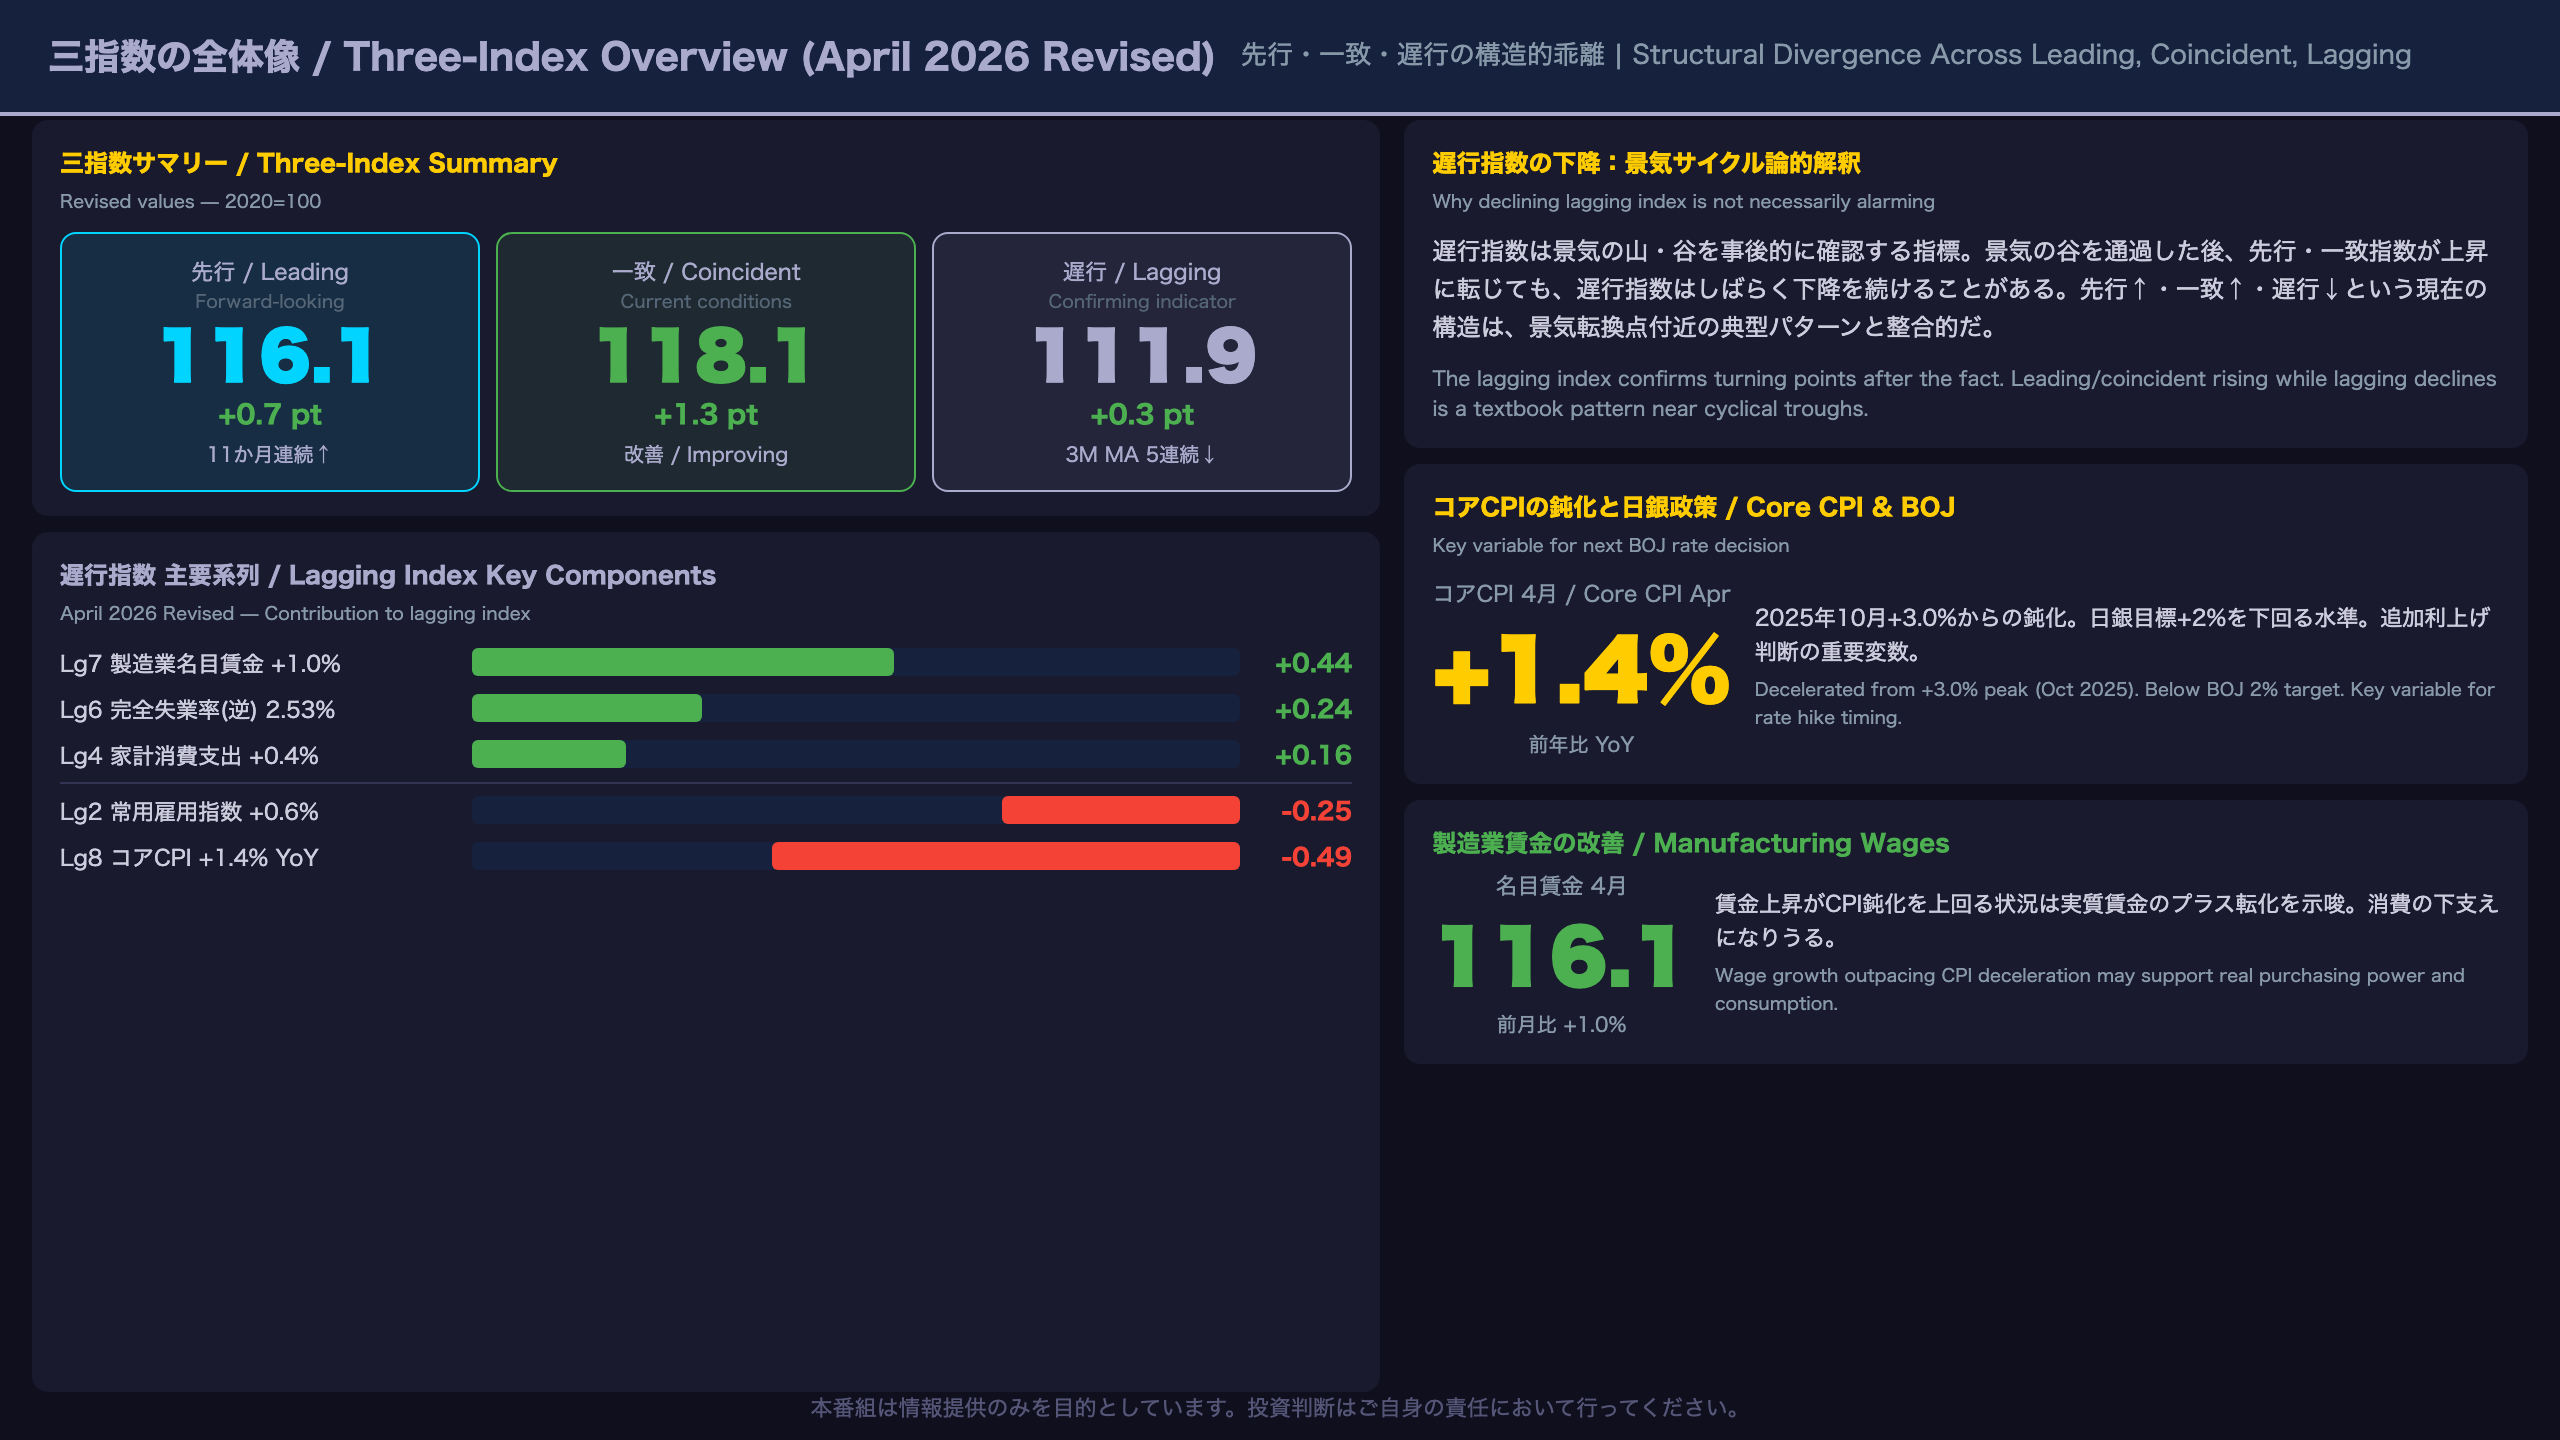
The Three-Index Divergence: What a Declining Lagging Index Really Means
Three-Index Summary (Revised)
| Index | Revised | MoM | 3M MA MoM | 7M MA MoM | Trend |
|---|---|---|---|---|---|
| Leading | 116.1 | +0.7 | +1.20 (10 consec.) | +1.15 (8 consec.) | Strong up |
| Coincident | 118.1 | +1.3 | +0.06 | +0.43 (4 consec.) | Improving |
| Lagging | 111.9 | +0.3 | -0.07 (5 consec.) | -0.14 (6 consec.) | Declining |
Why the Lagging Index Declining Is Not Necessarily Alarming
In business cycle theory, the lagging index serves to confirm turning points after the fact — it is expected to continue declining for some time after a cyclical trough has been passed. The current configuration (leading and coincident rising, lagging declining) is a textbook pattern observed near cyclical turning points. The Cabinet Office’s own upgrade of the coincident assessment to ‘Improving’ is consistent with this interpretation.
The primary driver of the lagging index decline is Lg8, core CPI (ex-fresh food) YoY, which decelerated from a peak of +3.0% in October 2025 to +1.4% in April 2026. This is below the BOJ’s 2% target and represents a significant disinflationary move over six months.
BOJ Policy Implications
The deceleration in core CPI is the most important variable for the BOJ’s next rate decision. The BOJ has been pursuing gradual policy normalization, and the ‘Improving’ business cycle assessment provides support for continued normalization. However, core CPI falling to +1.4% — below the 2% target — may give the BOJ reason to proceed cautiously with any additional rate hikes.
On the positive side, manufacturing wages (Lg7) rose 1.0% MoM in April to 116.1, and the unemployment rate (Lg6) fell to 2.53% — both supportive of the wage-price virtuous cycle narrative. The key question is whether nominal wage growth can sustain real purchasing power as CPI decelerates.
International Context
Japan’s core CPI at +1.4% YoY contrasts with the U.S. Fed’s ongoing battle with inflation above 3%. For international investors, Japan’s disinflationary trend may appear benign relative to other major economies, but it complicates the BOJ’s path toward policy normalization. The divergence between the Fed (higher for longer) and BOJ (gradual normalization) remains a key driver of USD/JPY dynamics.
インプリケーション:市場・政策・次回注目点
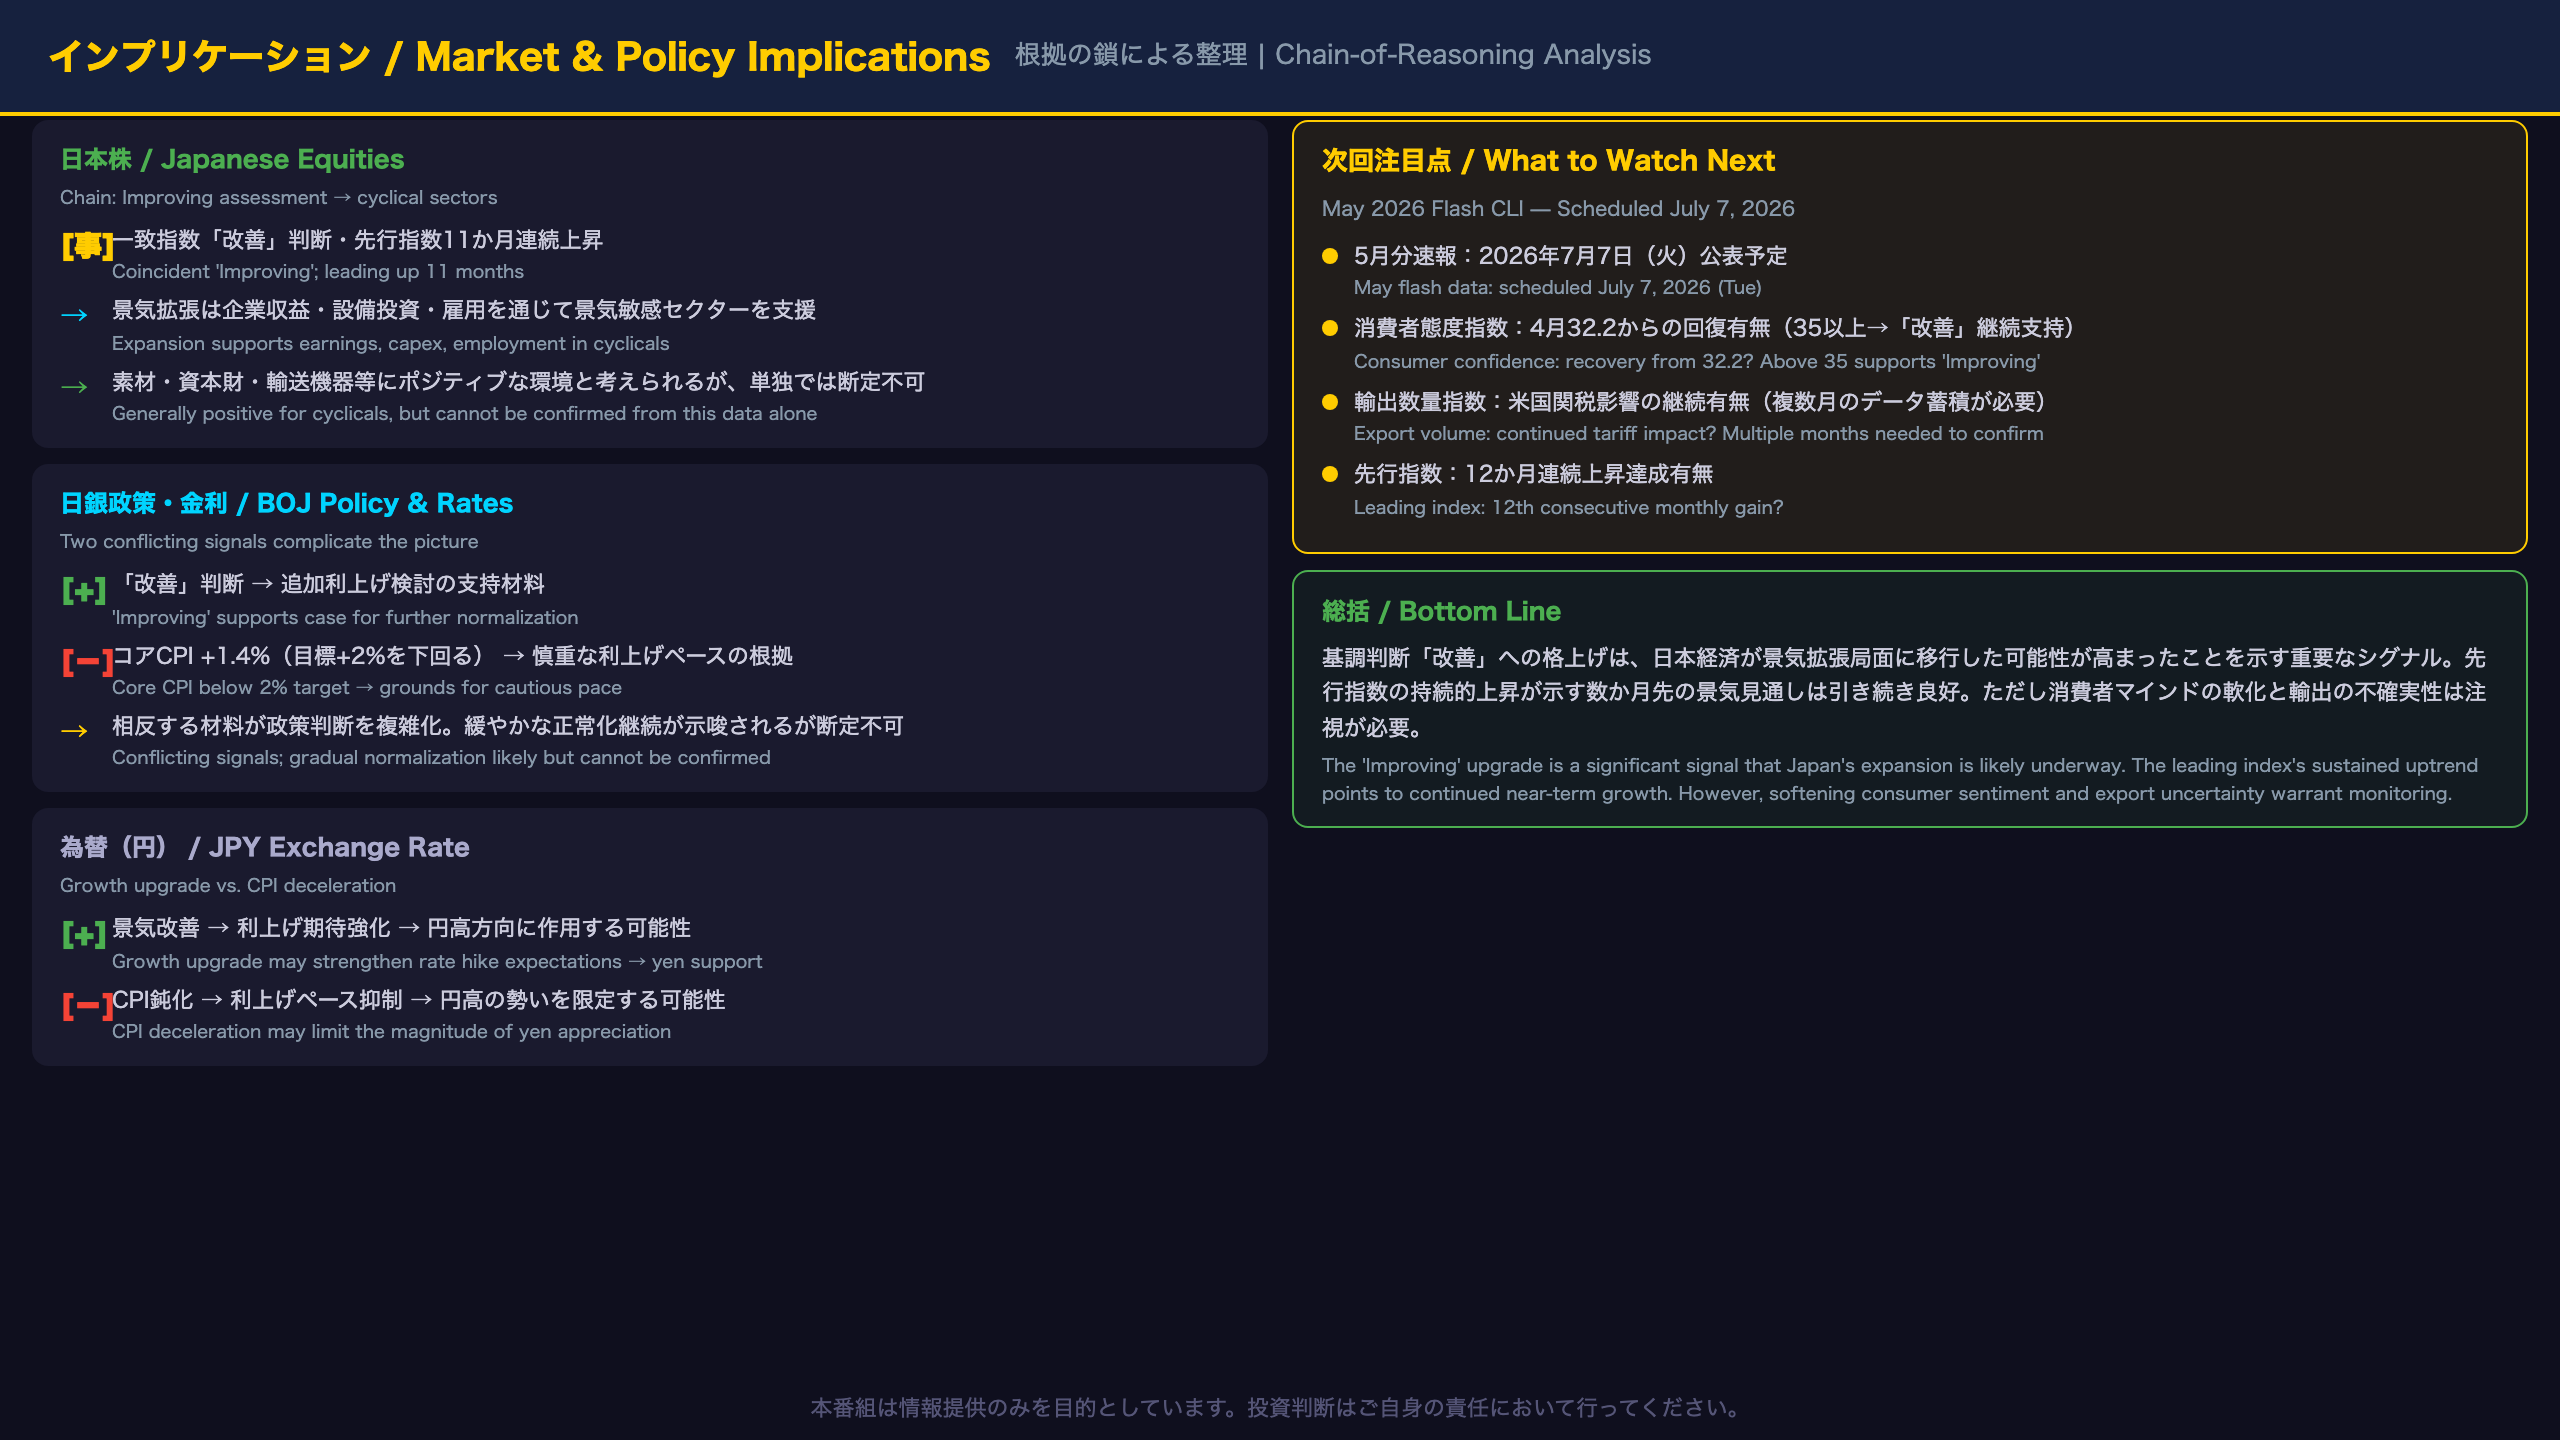
Market Implications, BOJ Policy, and What to Watch Next
Chain of Reasoning: Japanese Equities
[Fact] Coincident index upgraded to ‘Improving’; leading index up 11 consecutive months; 7-month MA rising for 8 months
→ [Mechanism] Transition to expansion typically supports corporate earnings improvement, capex expansion, and employment growth — historically positive for cyclical sectors
→ [Market Implication] Generally considered positive for cyclical sectors (materials, capital goods, industrials), but this data alone cannot determine stock price direction. The export volume decline (-2.3% MoM) is a risk factor for export-oriented names.
Chain of Reasoning: BOJ Policy and JGB Yields
[Fact 1] ‘Improving’ assessment + sustained leading index uptrend
→ [Mechanism] Confirmed expansion supports the case for continued BOJ policy normalization
[Fact 2] Core CPI (ex-fresh food) decelerated to +1.4% YoY — below BOJ’s 2% target
→ [Mechanism] Below-target inflation provides grounds for the BOJ to maintain a cautious pace of normalization
→ [Combined Implication] The combination of improving growth and decelerating inflation creates a complex policy environment. It is generally thought that this combination supports gradual rate hikes rather than accelerated normalization, but this data alone cannot determine the BOJ’s next move. The next BOJ meeting and subsequent CPI data will be critical.
Chain of Reasoning: USD/JPY
[Fact] ‘Improving’ business cycle + strong leading index trend
→ [Mechanism] Improved Japan growth outlook may strengthen rate hike expectations, supporting yen appreciation
→ [Implication] However, CPI deceleration limits the magnitude of any yen strengthening. The net effect on USD/JPY depends on the relative pace of Fed vs. BOJ policy divergence — which cannot be determined from this data alone.
Key Dates and Watchpoints
- May 2026 Flash CLI: Scheduled July 7, 2026 (Tuesday)
- Watch 1: Consumer confidence index — recovery from April’s 32.2 low?
- Watch 2: Export volume index — continued softness from U.S. tariff impact?
- Watch 3: Leading index — 12th consecutive monthly gain?
- Scenario threshold: Consumer confidence recovering above 35 would support continued ‘Improving’ assessment; falling below 30 would raise questions about the leading index uptrend.
Disclaimer: This article is for informational purposes only. All investment decisions are made solely at your own risk.







