📺 Watch the Full Video Analysis
This article was automatically generated by the NFC Market Live AI analysis system. (Updated: 2026-06-30 23:09 JST)
📄 Primary Source
U.S. Bureau of Labor Statistics
https://www.bls.gov/news.release/pdf/jolts.pdf
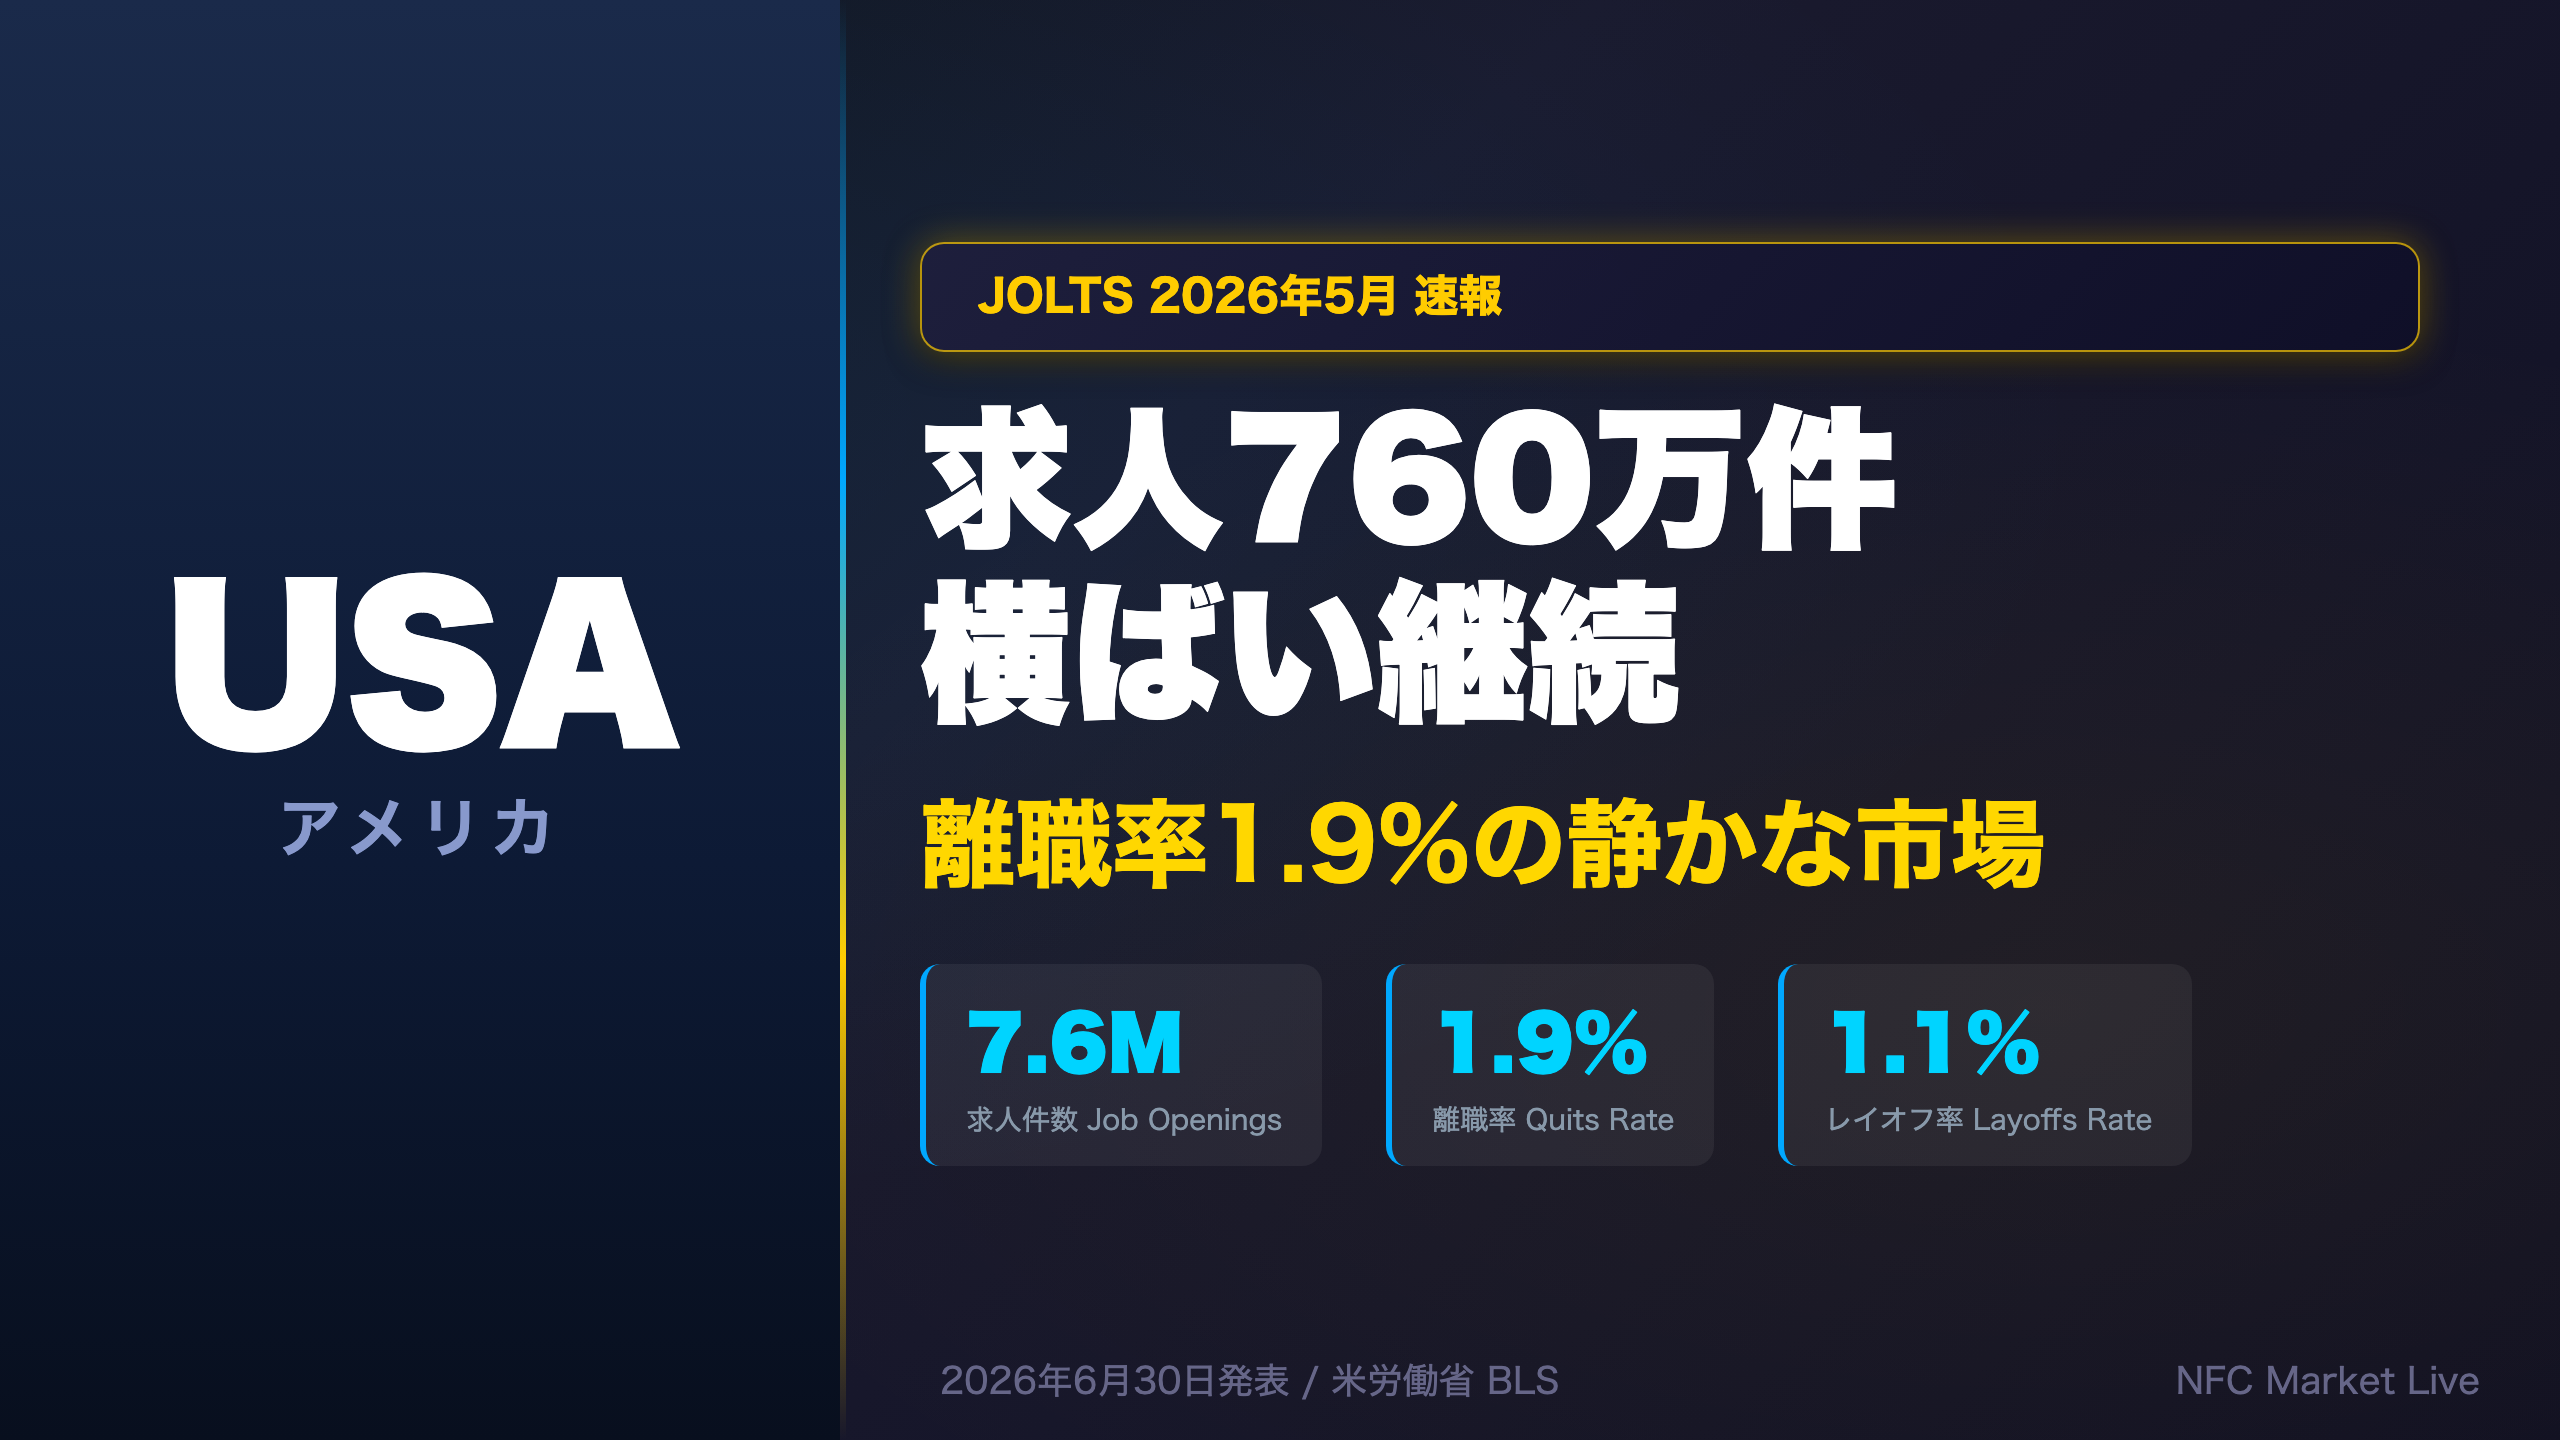
Deep dive into the BLS JOLTS report for May 2026, released June 30, 2026. Job openings held at 7.6M (unchanged), quits rate stayed at 1.9% — signaling a labor market that is cooling but not collapsing. We unpack the construction layoff surge (+47K MoM), the healthcare layoff spike (+53K), wholesale trade’s job openings jump (+71K), and what the V/U ratio near 1.1x means for Fed policy. Essential viewing for macro investors tracking the US rate path.
The Ultimate Summary:2026年5月JOLTS総合評価
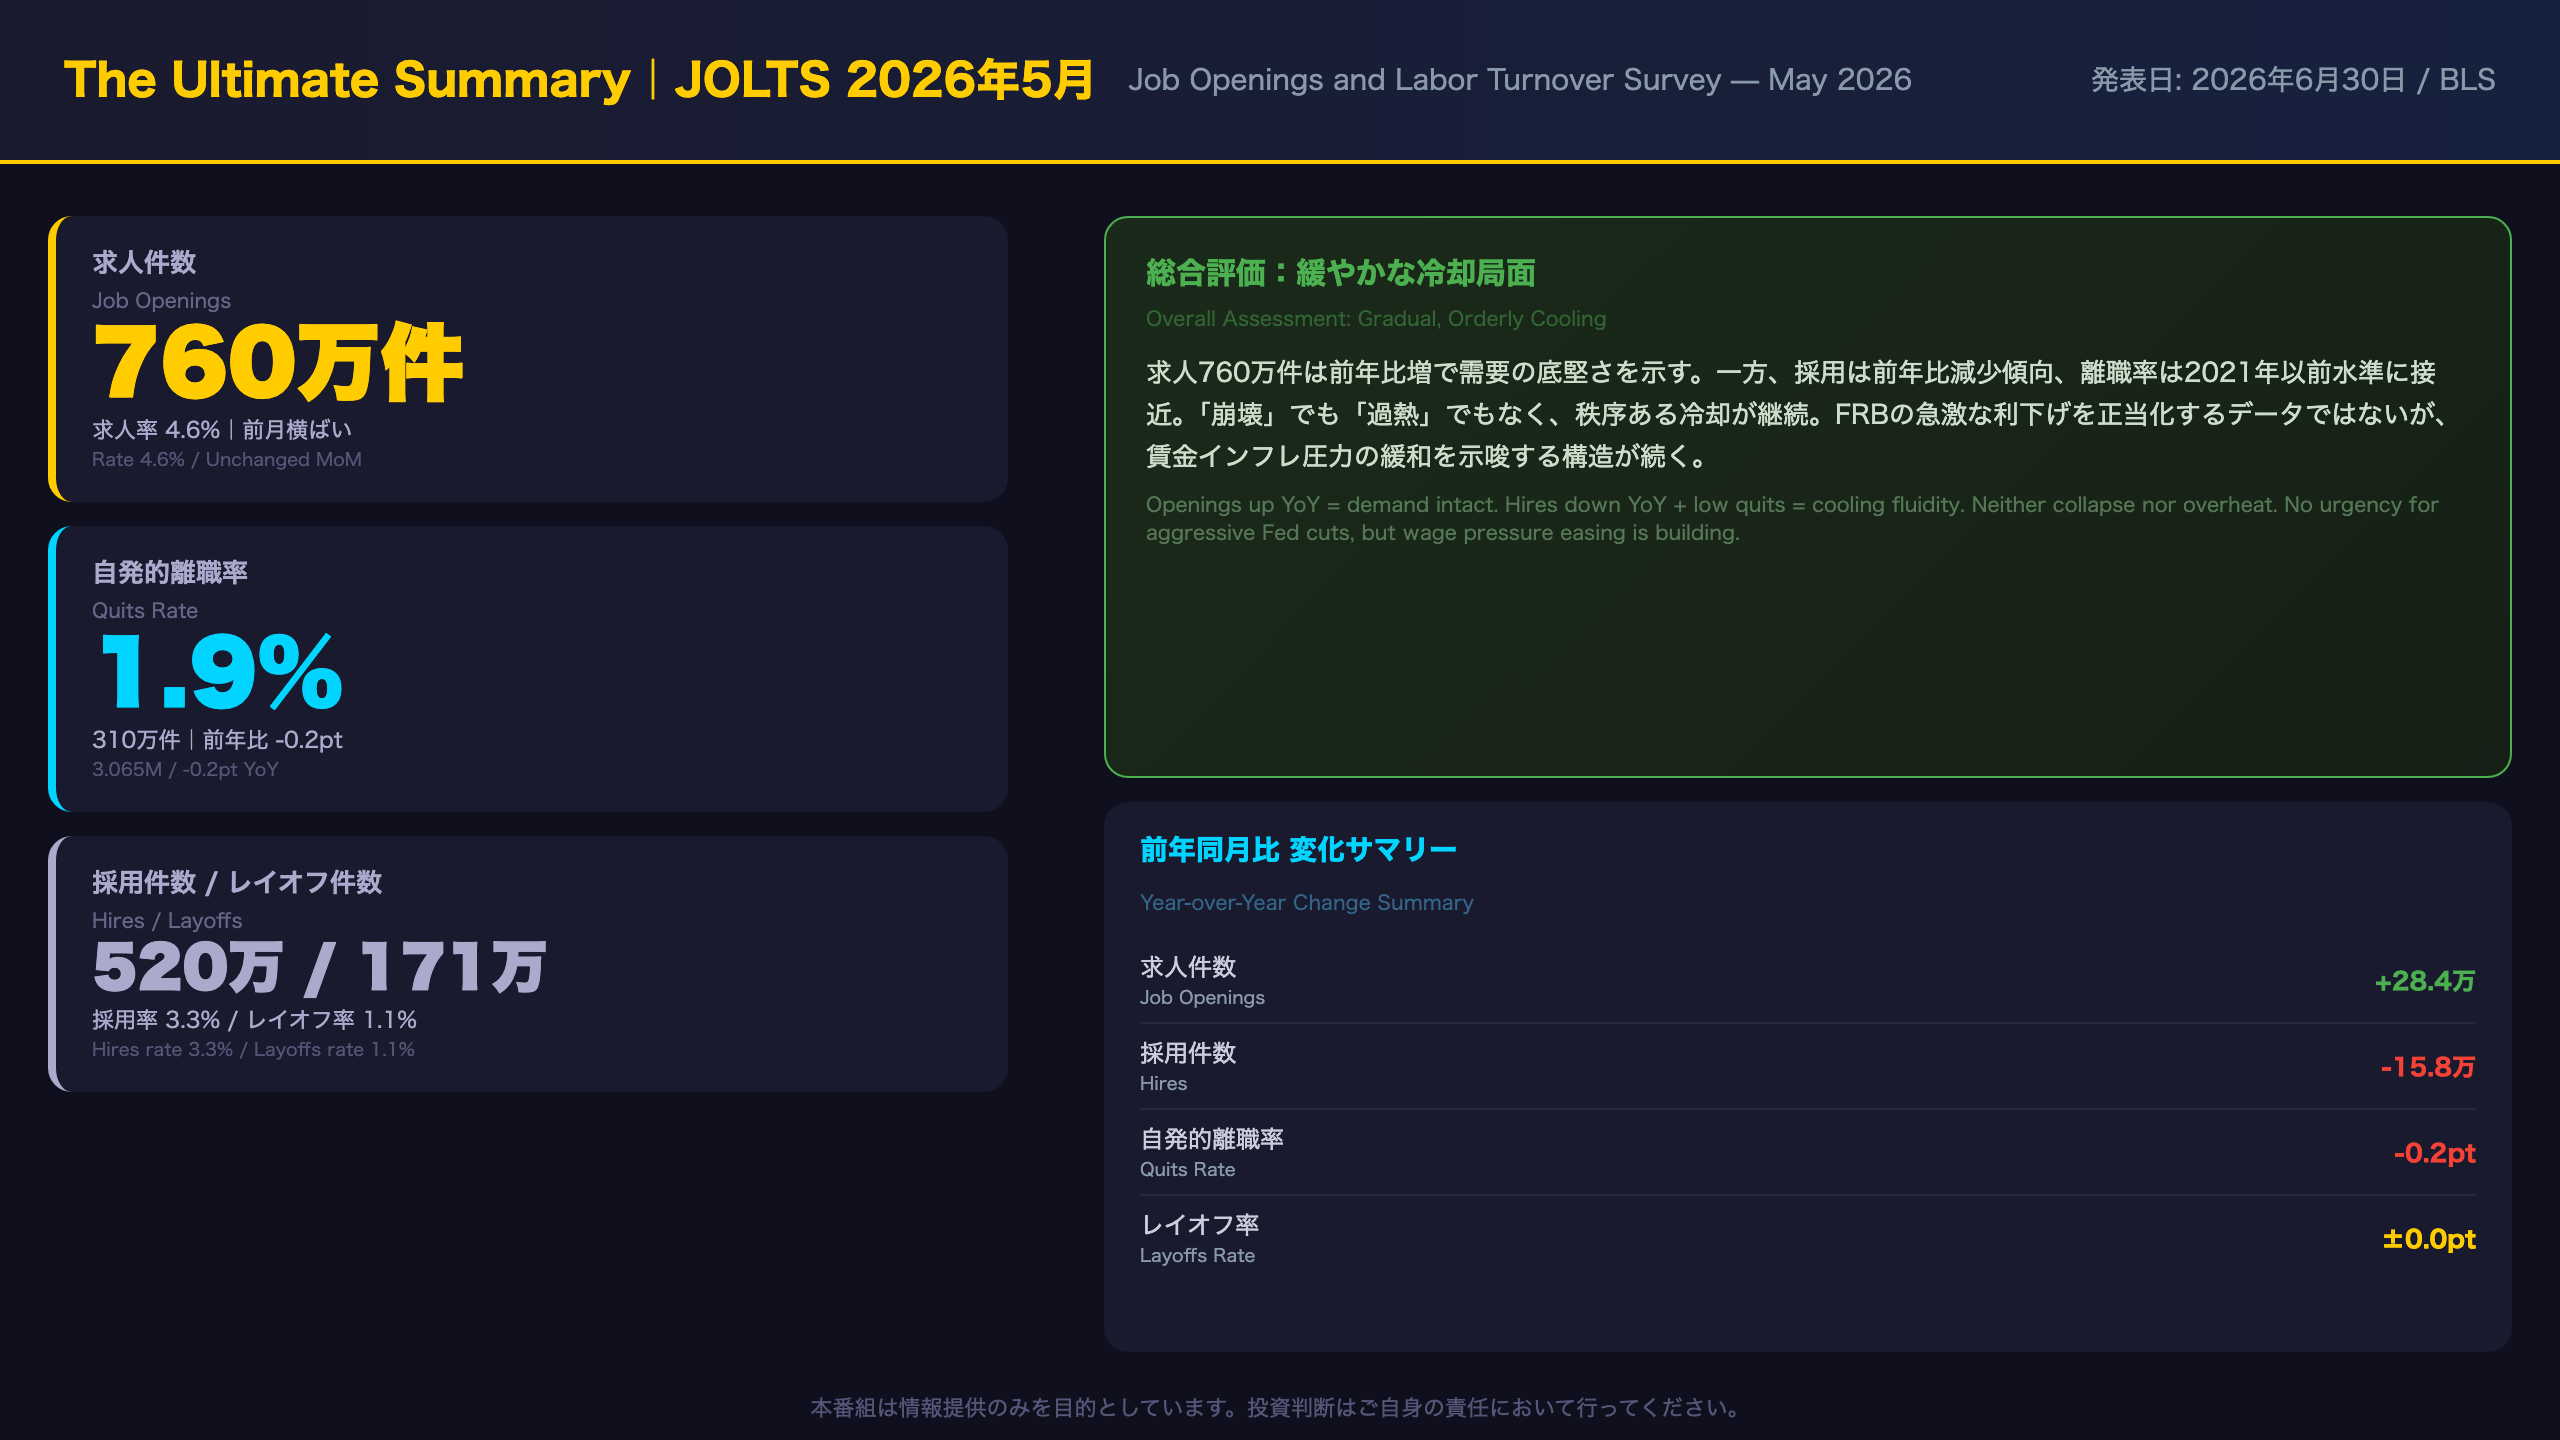
JOLTS May 2026: Executive Summary for Global Investors
What is JOLTS?
The Job Openings and Labor Turnover Survey (JOLTS), published monthly by the U.S. Bureau of Labor Statistics (BLS), is one of the Federal Reserve’s most closely watched labor market indicators. Unlike the monthly nonfarm payrolls report, JOLTS measures the flow of labor demand — how many positions are open, how many workers are being hired, and crucially, how many are voluntarily quitting. The quits rate in particular is viewed as a real-time proxy for worker confidence and wage bargaining power.
Headline Numbers (Seasonally Adjusted)
| Metric | May 2026 | Apr 2026 | May 2025 |
|---|---|---|---|
| Job Openings | 7.594M | 7.585M | 7.310M |
| Openings Rate | 4.6% | 4.6% | 4.4% |
| Hires | 5.170M | 5.215M | 5.328M |
| Hires Rate | 3.3% | 3.3% | 3.4% |
| Quits | 3.065M | 3.043M | 3.287M |
| Quits Rate | 1.9% | 1.9% | 2.1% |
| Layoffs | 1.708M | 1.667M | 1.671M |
| Layoffs Rate | 1.1% | 1.0% | 1.1% |
Bull Case
Job openings at 7.6 million remain well above the pre-pandemic average of roughly 6–7 million, suggesting that underlying labor demand has not collapsed. The year-over-year increase of approximately 284,000 openings confirms that employers are still actively recruiting. Gains in wholesale trade (+71K MoM), construction (+32K), and manufacturing (+33K) point to resilience in cyclically sensitive sectors.
Bear Case
Hires have been trending lower year-over-year, falling from 5.328M in May 2025 to 5.170M in May 2026 — a decline of roughly 158,000. The quits rate at 1.9% is near its lowest level since 2020, suggesting workers feel “locked in” to their current jobs. This dynamic typically precedes a softening in wage growth, as workers with fewer outside options have less bargaining power.
Fed Policy Implications
With openings still at 7.6M, the labor market is not providing the Fed with a clear signal to accelerate rate cuts. However, the sustained decline in the quits rate — from 2.1% a year ago to 1.9% today — is consistent with a gradual easing of wage inflation pressures. This is a necessary (though not sufficient) condition for the Fed to gain confidence that inflation is durably returning to its 2% target.
Next release: JOLTS June 2026 data is scheduled for August 4, 2026.
求人件数の深掘り:V/U比率と需給バランス
Job Openings Deep Dive: V/U Ratio and Structural Demand
The V/U Ratio: A Key Fed Metric
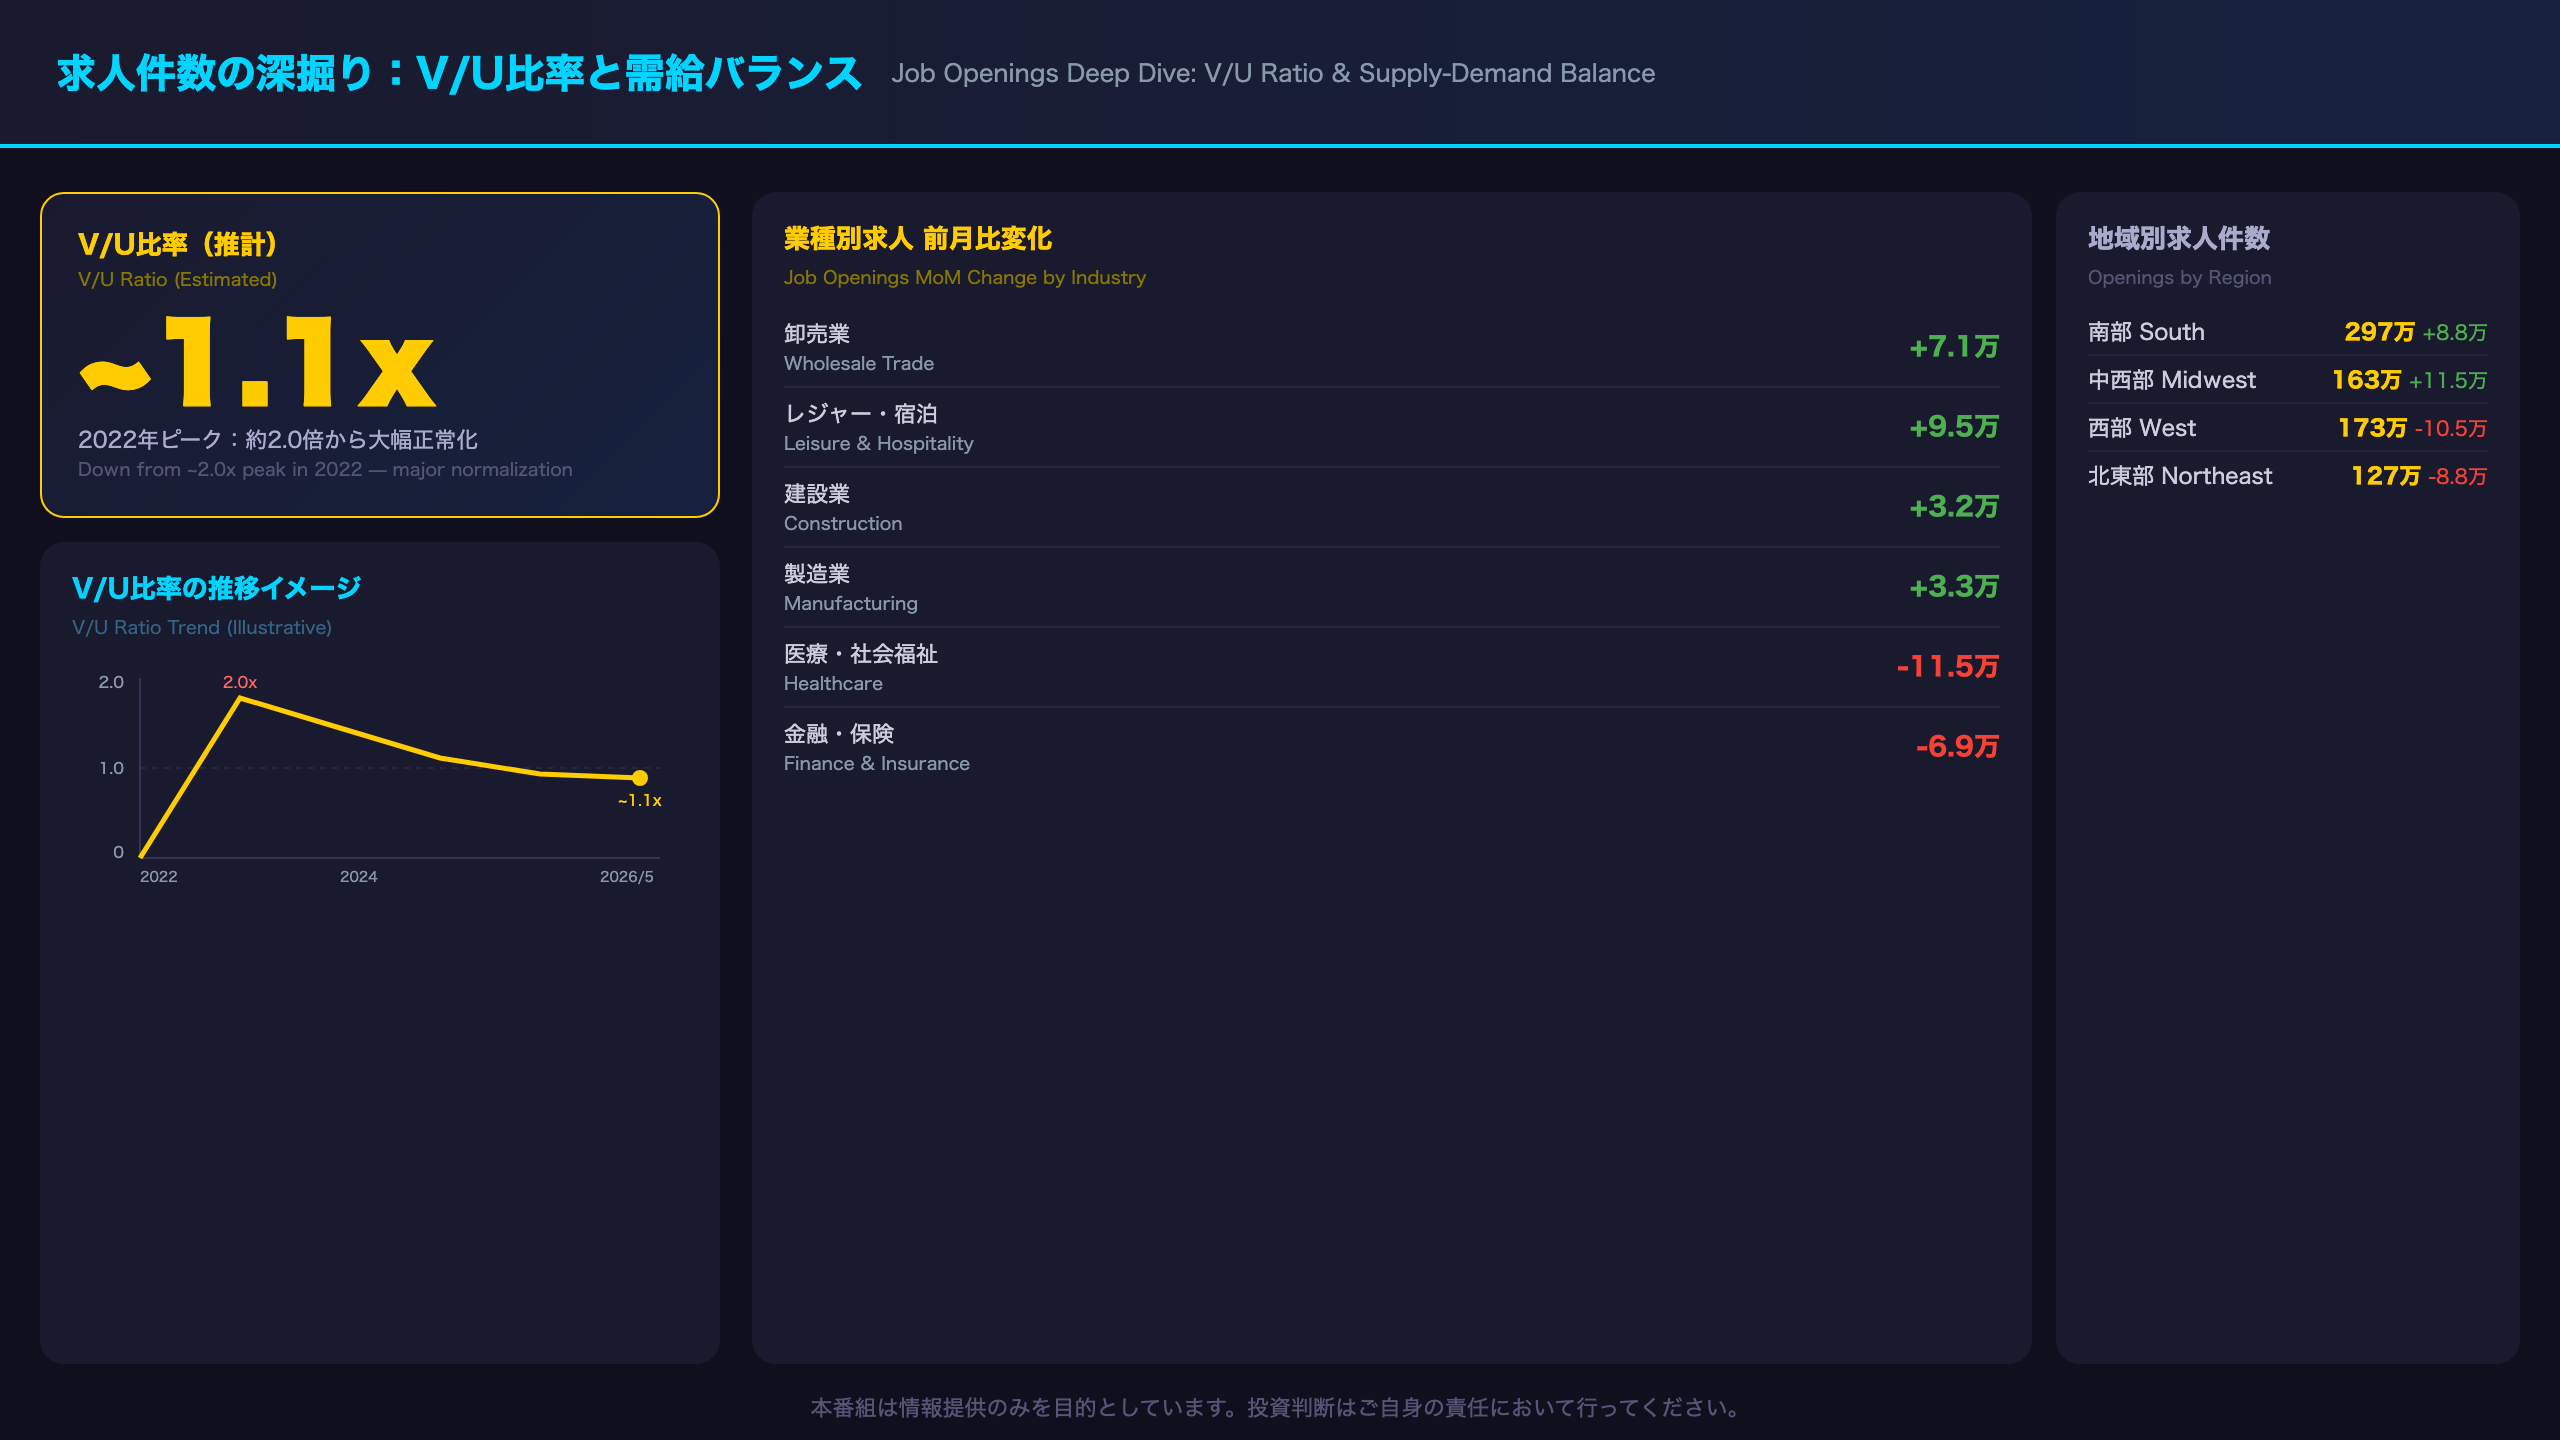
The vacancy-to-unemployment (V/U) ratio — job openings divided by the number of unemployed workers — is one of the Federal Reserve’s preferred measures of labor market tightness. At the post-pandemic peak in spring 2022, this ratio reached approximately 2.0, meaning there were two job openings for every unemployed person. As of May 2026, with JOLTS openings at 7.594 million and unemployment estimated in the 7 million range, the V/U ratio has normalized to approximately 1.0–1.1x.
This normalization is significant: it suggests the labor market has largely rebalanced from its post-pandemic extremes, reducing the structural upward pressure on wages that characterized 2021–2022.
Industry-Level Openings: Winners and Losers
Notable increases (MoM):
– Wholesale Trade: +71,000 (rate jumped from 2.9% to 4.0%) — the largest single-industry MoM gain
– Leisure & Hospitality: +95,000 (rate 4.7% → 5.2%) — recovery from April’s dip
– Construction: +32,000 (rate 3.1% → 3.5%)
– Manufacturing: +33,000 (rate 3.8% → 4.0%)
Notable decreases (MoM):
– Health Care & Social Assistance: -115,000 (rate 6.1% → 5.6%) — largest single-industry MoM decline
– Finance & Insurance: -69,000 (rate 4.8% → 3.8%)
– Transportation, Warehousing & Utilities: -43,000
The healthcare decline is particularly noteworthy given that this sector has been one of the most consistent sources of job openings in recent years. Combined with the layoff increase in the same sector (discussed in Slide 4), this warrants close monitoring.
Establishment Size Class
Small businesses (1–9 employees) showed a job openings rate of 5.2%, down sharply from 6.3% in April. This size class tends to exhibit high volatility due to smaller sample sizes. Mid-sized firms (10–49 employees) held steady at 4.7%. Large enterprises (5,000+ employees) rose to 5.2% from 4.8%.
Regional Breakdown
| Region | May 2026 | Apr 2026 | MoM Change |
|---|---|---|---|
| South | 2.971M | 2.883M | +88K |
| Midwest | 1.630M | 1.515M | +115K |
| Northeast | 1.266M | 1.354M | -88K |
| West | 1.728M | 1.833M | -105K |
The West’s April spike to 1.833M followed by a May pullback to 1.728M suggests potential volatility in that region’s data.
Quits Rate(自発的離職率)の深掘り:賃金インフレ圧力の行方
Quits Rate Deep Dive: The End of the Great Resignation and Wage Implications
Historical Context
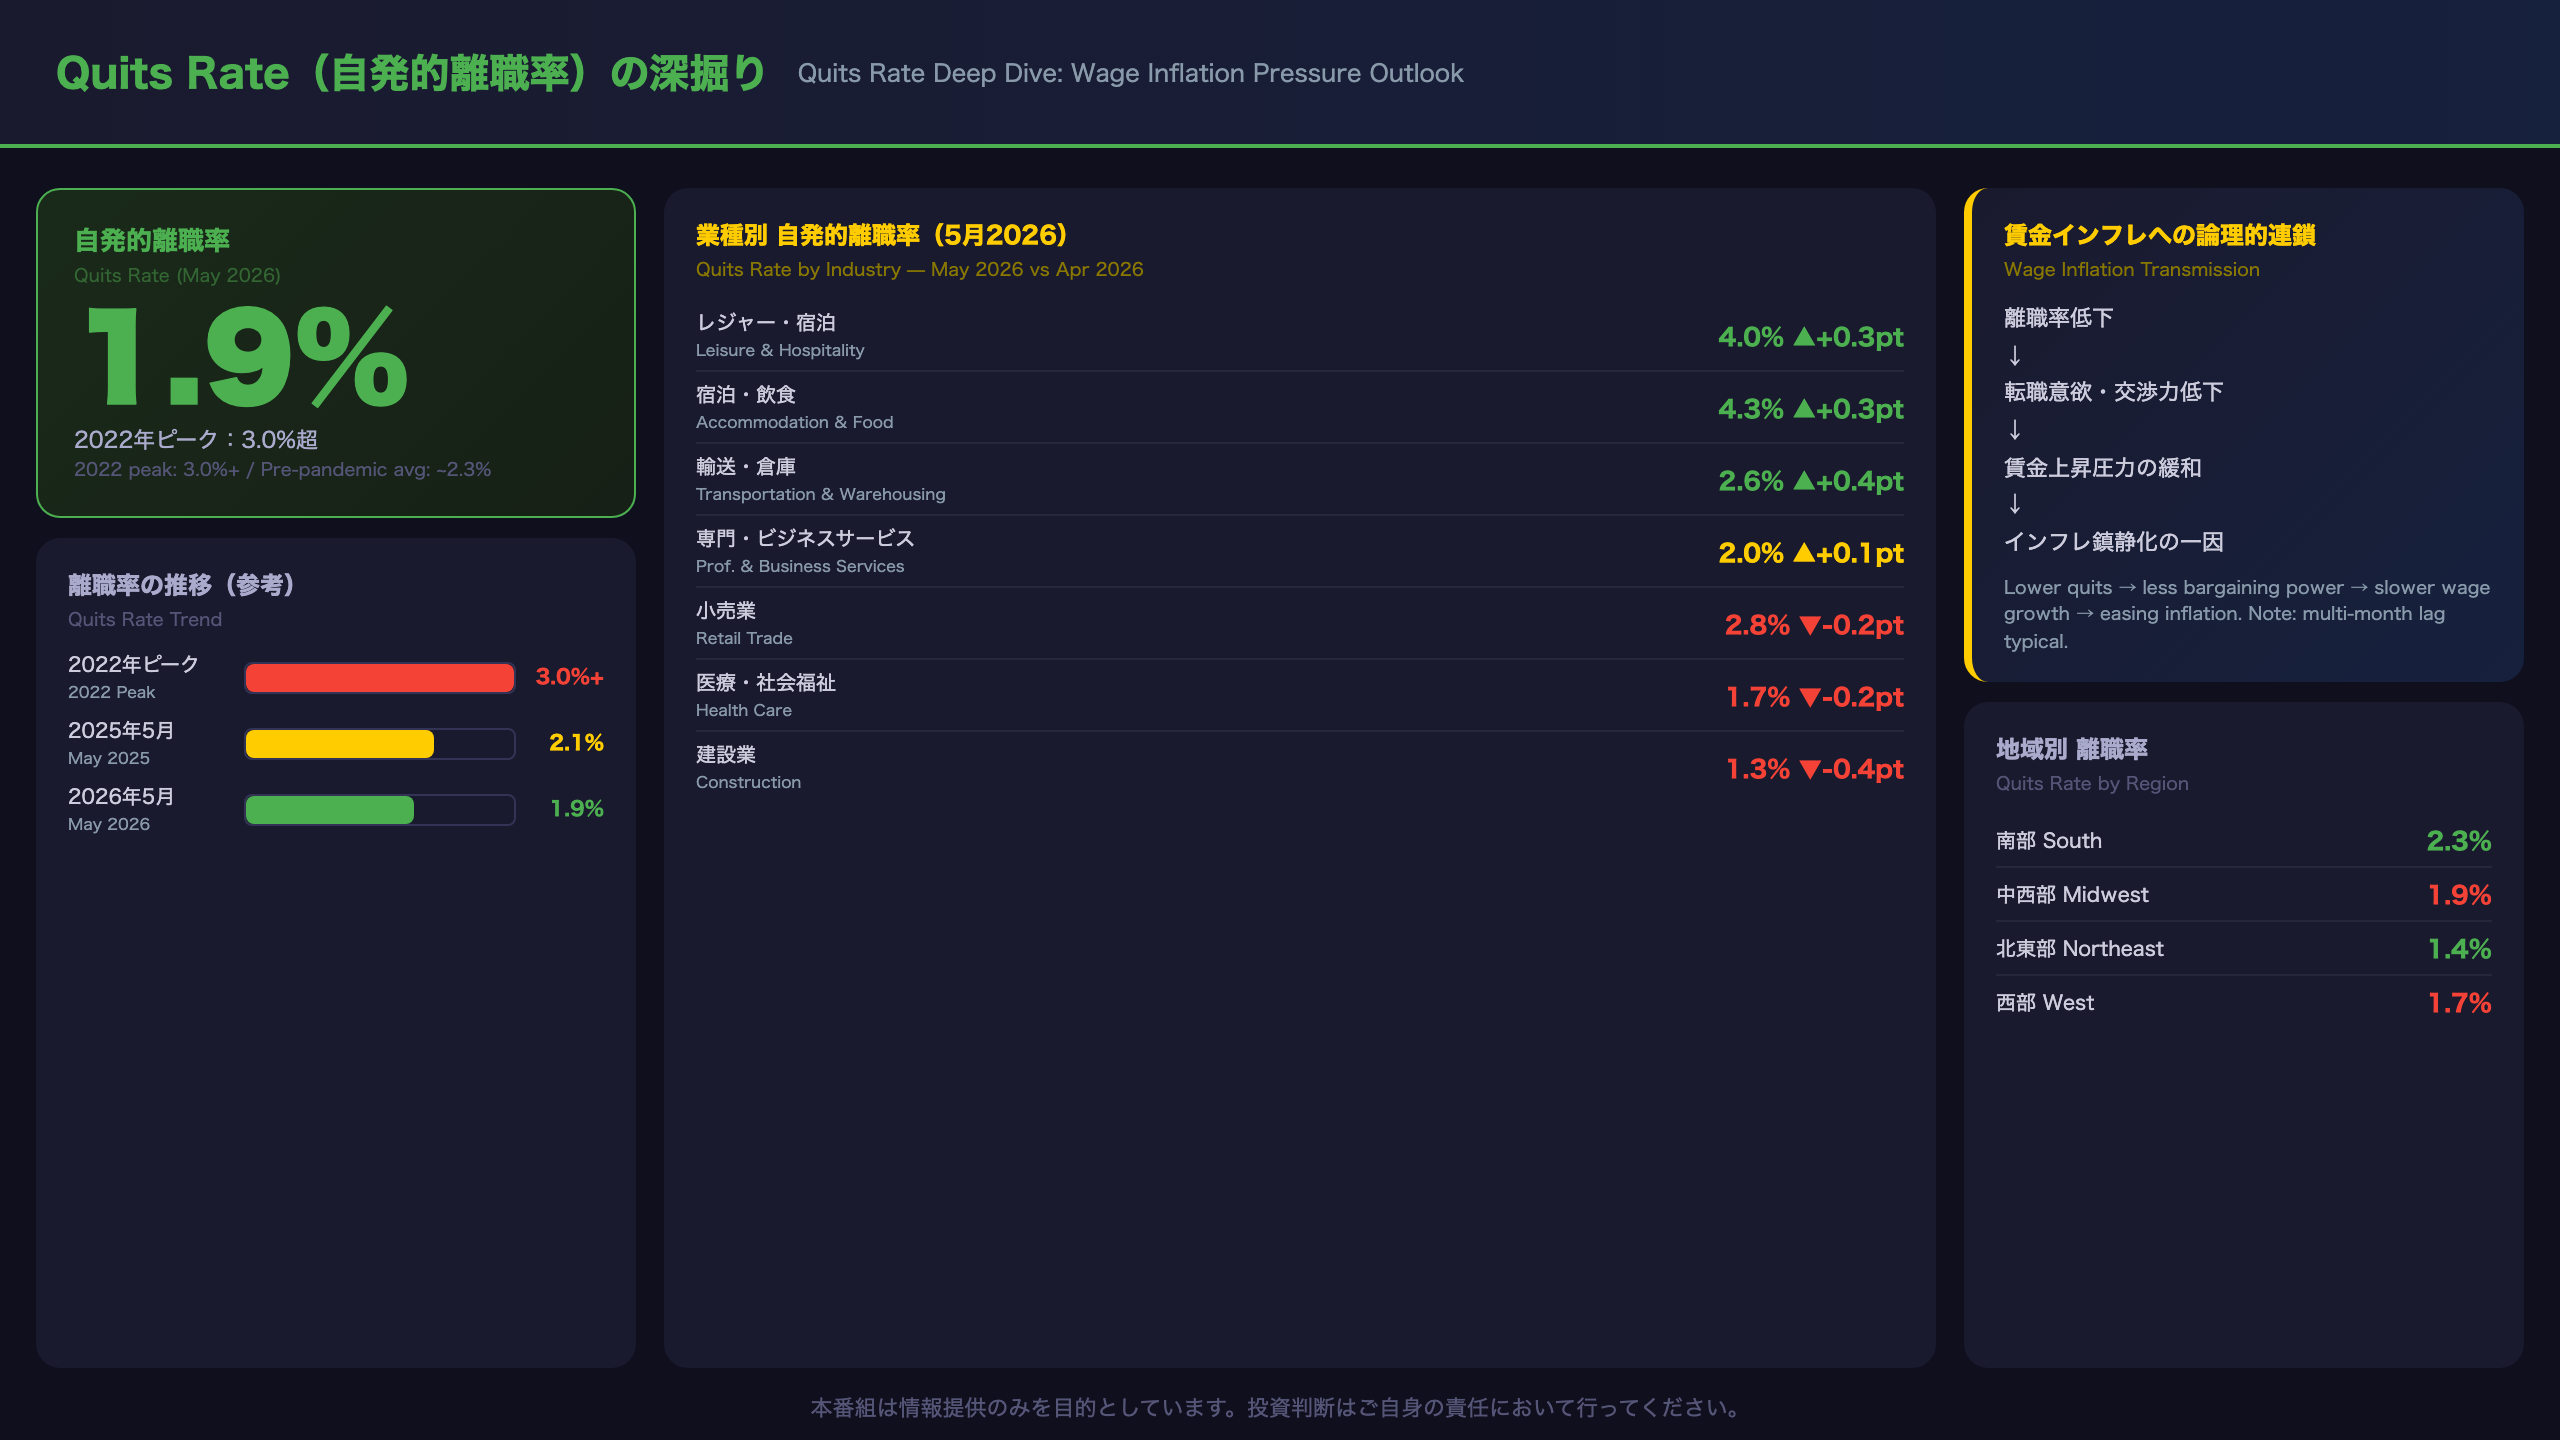
The U.S. quits rate peaked above 3.0% during the 2021–2022 “Great Resignation” — a period when workers voluntarily left jobs at record rates, driving wage growth to multi-decade highs. The current reading of 1.9% represents a near-complete reversal of that dynamic. For context, the pre-pandemic (2018–2019) average quits rate was approximately 2.3%, meaning today’s 1.9% is actually below the pre-pandemic norm.
Industry-Level Quits Rates (May 2026)
| Industry | May 2026 | Apr 2026 | MoM Change |
|---|---|---|---|
| Leisure & Hospitality | 4.0% | 3.7% | +0.3pt |
| Accommodation & Food | 4.3% | 4.0% | +0.3pt |
| Transportation & Warehousing | 2.6% | 2.2% | +0.4pt |
| Prof. & Business Services | 2.0% | 1.9% | +0.1pt |
| Construction | 1.3% | 1.7% | -0.4pt |
| Health Care | 1.7% | 1.9% | -0.2pt |
| Retail Trade | 2.8% | 3.0% | -0.2pt |
The sharp drop in construction quits (1.7% → 1.3%) is notable. When read alongside the construction layoff surge discussed in the next slide, it suggests a rapidly softening labor market in that sector — though a single month of data is insufficient to confirm a structural shift.
The Wage Inflation Transmission Mechanism
The standard economic logic runs as follows:
– Lower quits rate → reduced worker bargaining power → slower wage growth → easing inflation pressure
This mechanism is well-established in labor economics. However, the transmission from quits data to actual wage outcomes (measured by the Employment Cost Index or Average Hourly Earnings) typically involves a lag of several months. The current quits rate of 1.9% is consistent with — but does not alone confirm — a continued easing of wage inflation.
Regional Quits Rates
| Region | May 2026 | Apr 2026 |
|---|---|---|
| South | 2.3% | 2.2% |
| Midwest | 1.9% | 2.0% |
| Northeast | 1.4% | 1.3% |
| West | 1.7% | 1.9% |
The West’s decline from 1.9% to 1.7% may reflect ongoing restructuring in the technology sector, which is heavily concentrated in California and Washington state.
業種別の顕著な特徴:建設業・医療・卸売業の異変
Industry Deep Dive: Construction, Healthcare, and Wholesale Trade
Construction: Layoff Surge — The Most Alarming Data Point
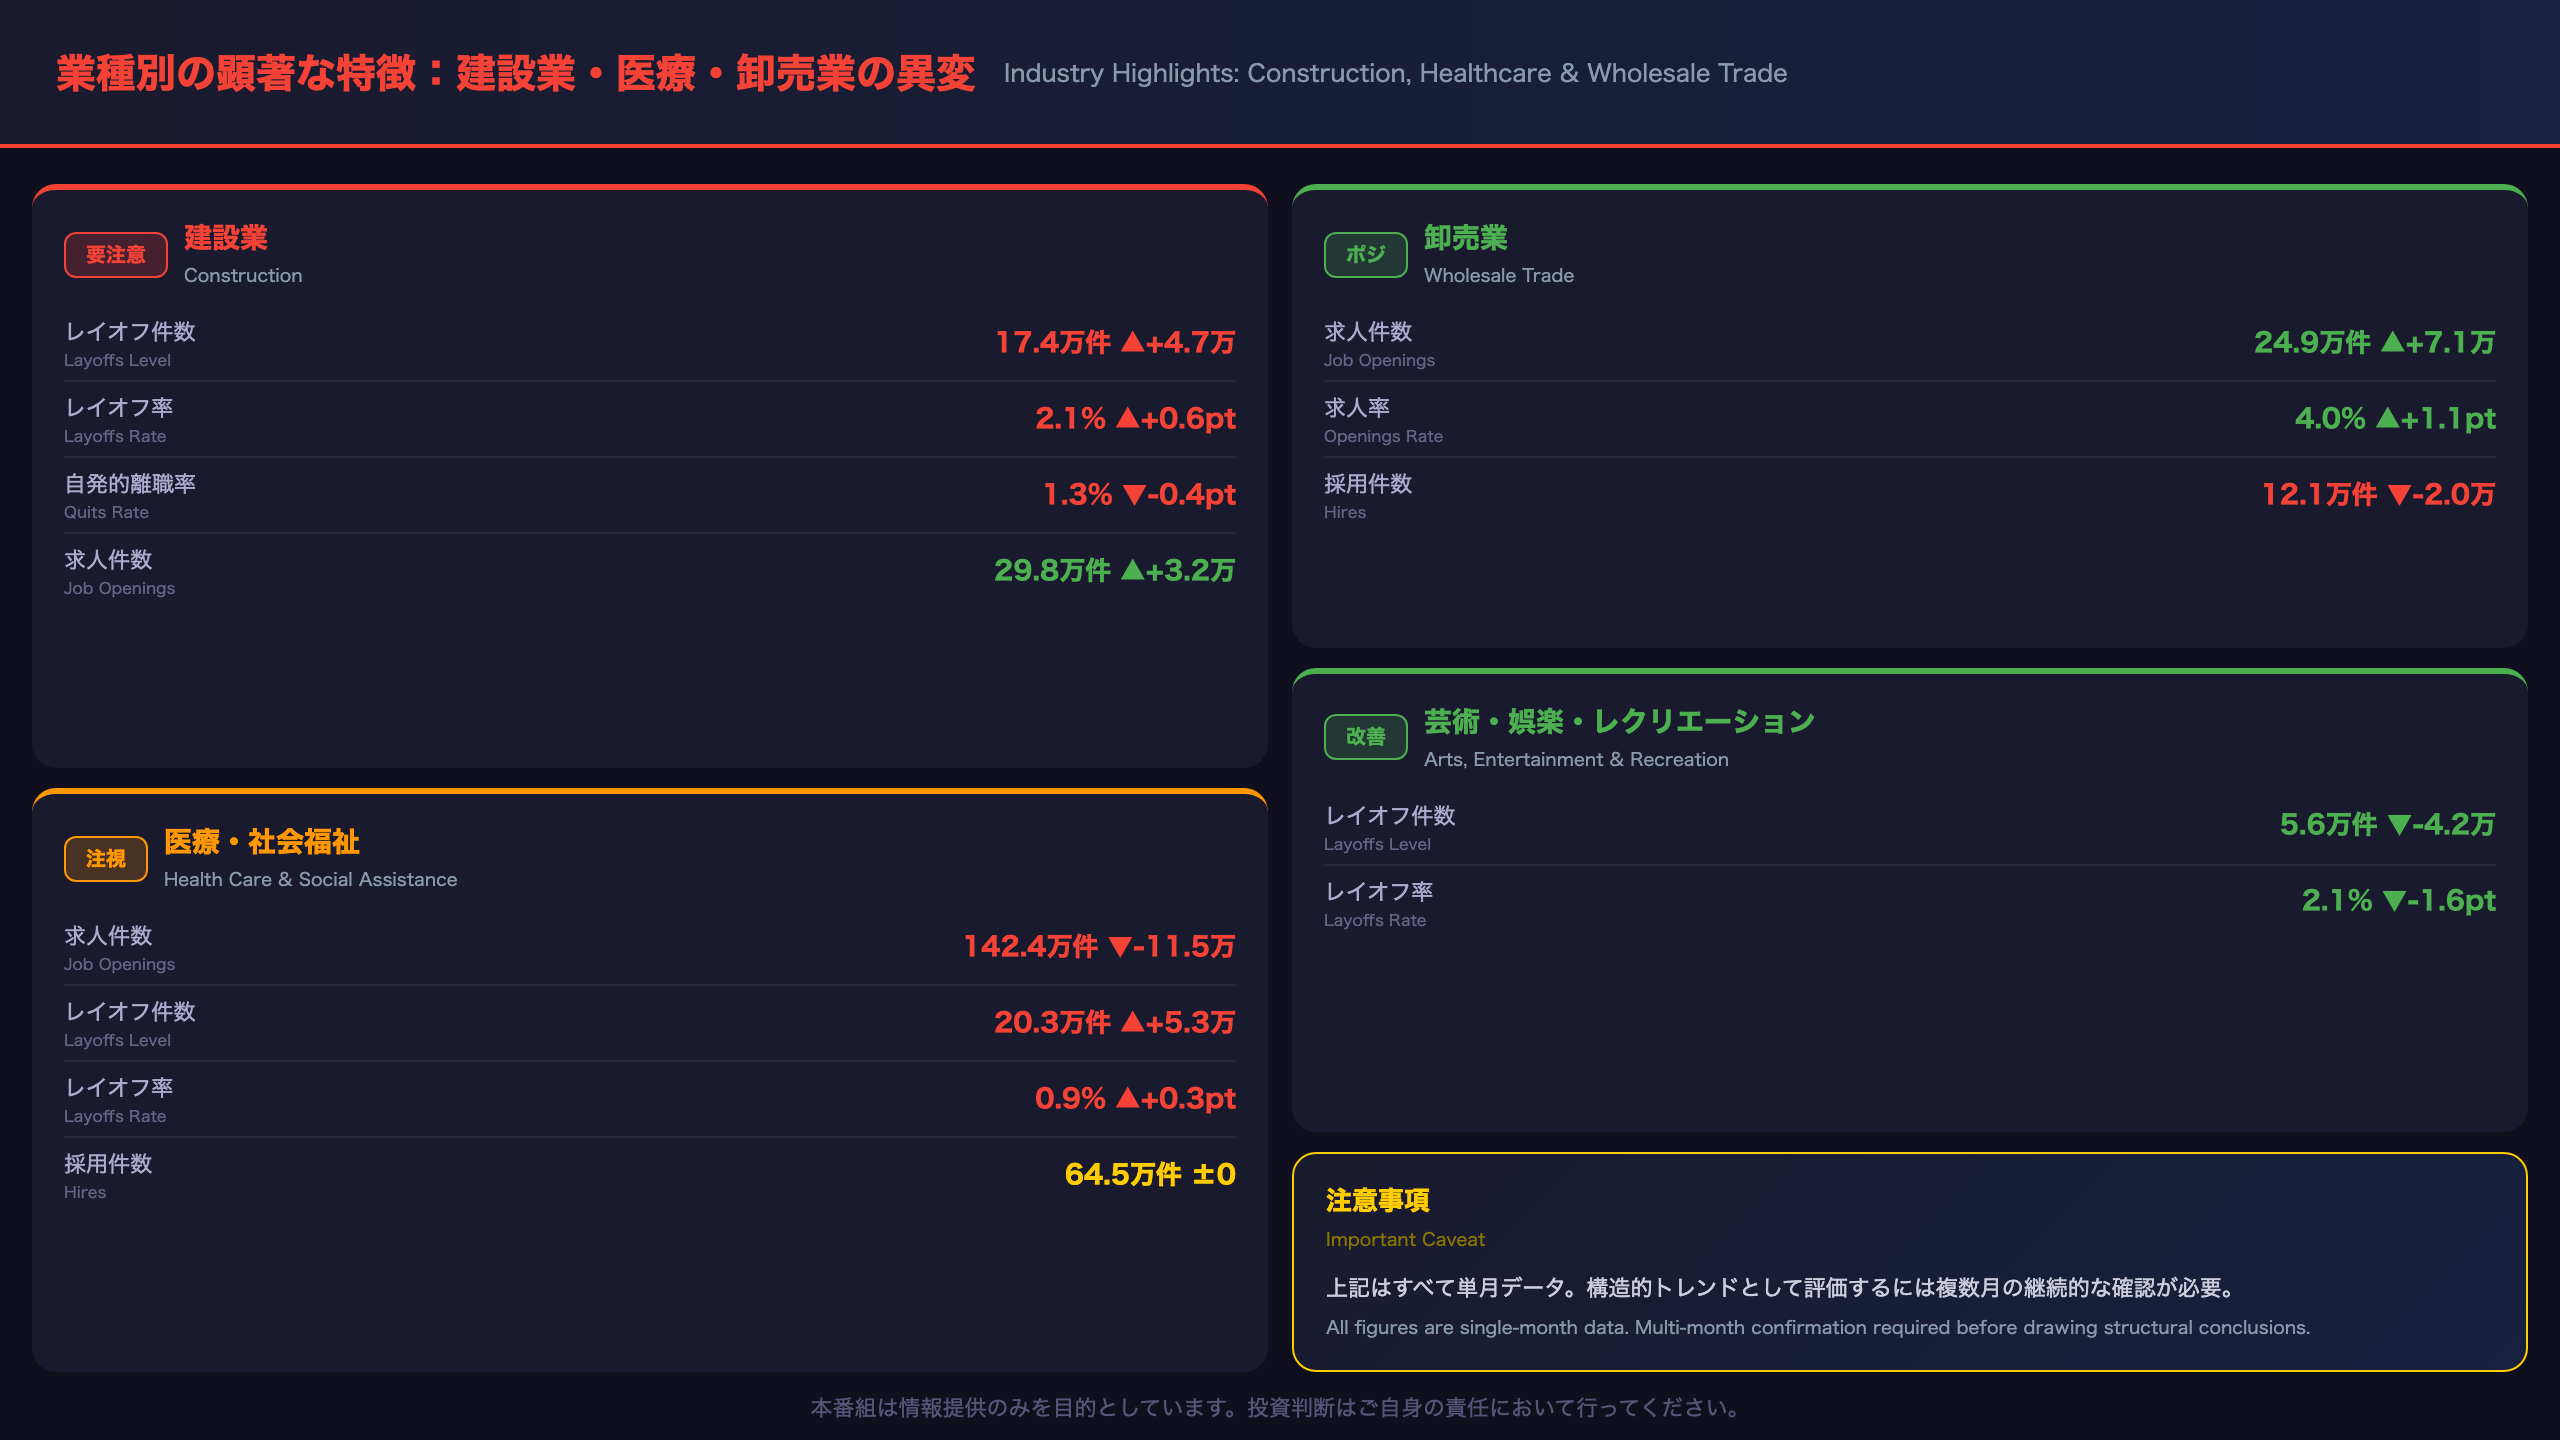
Construction layoffs jumped from 127,000 in April to 174,000 in May — a month-over-month increase of 47,000, the largest single-industry MoM layoff increase in the May 2026 JOLTS report. The layoffs rate rose from 1.5% to 2.1%.
This is compounded by the sharp drop in construction quits (1.7% → 1.3%), creating a pattern of “rising layoffs + falling quits” that is consistent with a rapidly softening labor market in this sector. Workers are being let go at an accelerating rate while simultaneously becoming less willing to voluntarily leave — a combination that suggests growing job insecurity.
Potential drivers (speculative, outside the scope of this report):
– Persistent high mortgage rates dampening residential construction
– Continued adjustment in commercial real estate
– These hypotheses require corroboration from housing starts, permits, and construction spending data
Healthcare: A Dual Warning Signal
Healthcare and social assistance showed two simultaneous negative signals:
1. Job openings fell -115,000 MoM (rate: 6.1% → 5.6%)
2. Layoffs rose +53,000 MoM (rate: 0.6% → 0.9%)
This is notable because healthcare has been one of the most consistently strong sectors for job openings throughout the post-pandemic period. The sector’s openings rate of 5.6% still exceeds the overall average of 4.6%, so structural labor shortages remain. However, the simultaneous decline in openings and rise in layoffs warrants monitoring.
Wholesale Trade: Openings Surge
Wholesale trade job openings surged +71,000 MoM (rate: 2.9% → 4.0%). This was the largest single-industry MoM openings increase. However, hires in wholesale trade actually fell from 141,000 to 121,000, suggesting that the new openings have not yet translated into actual hiring activity.
Arts, Entertainment & Recreation: Layoff Plunge
Layoffs in arts, entertainment, and recreation fell sharply from 98,000 to 56,000 (-42,000 MoM), with the rate dropping from 3.7% to 2.1%. This sector is known for high volatility in monthly data, so this improvement should be interpreted cautiously pending confirmation in subsequent months.
市場インプリケーション:FRB・為替・株式への含意
Market Implications: Causal Chain Analysis
Fed Policy
Chain 1 (Hawkish / Cautious on Cuts):
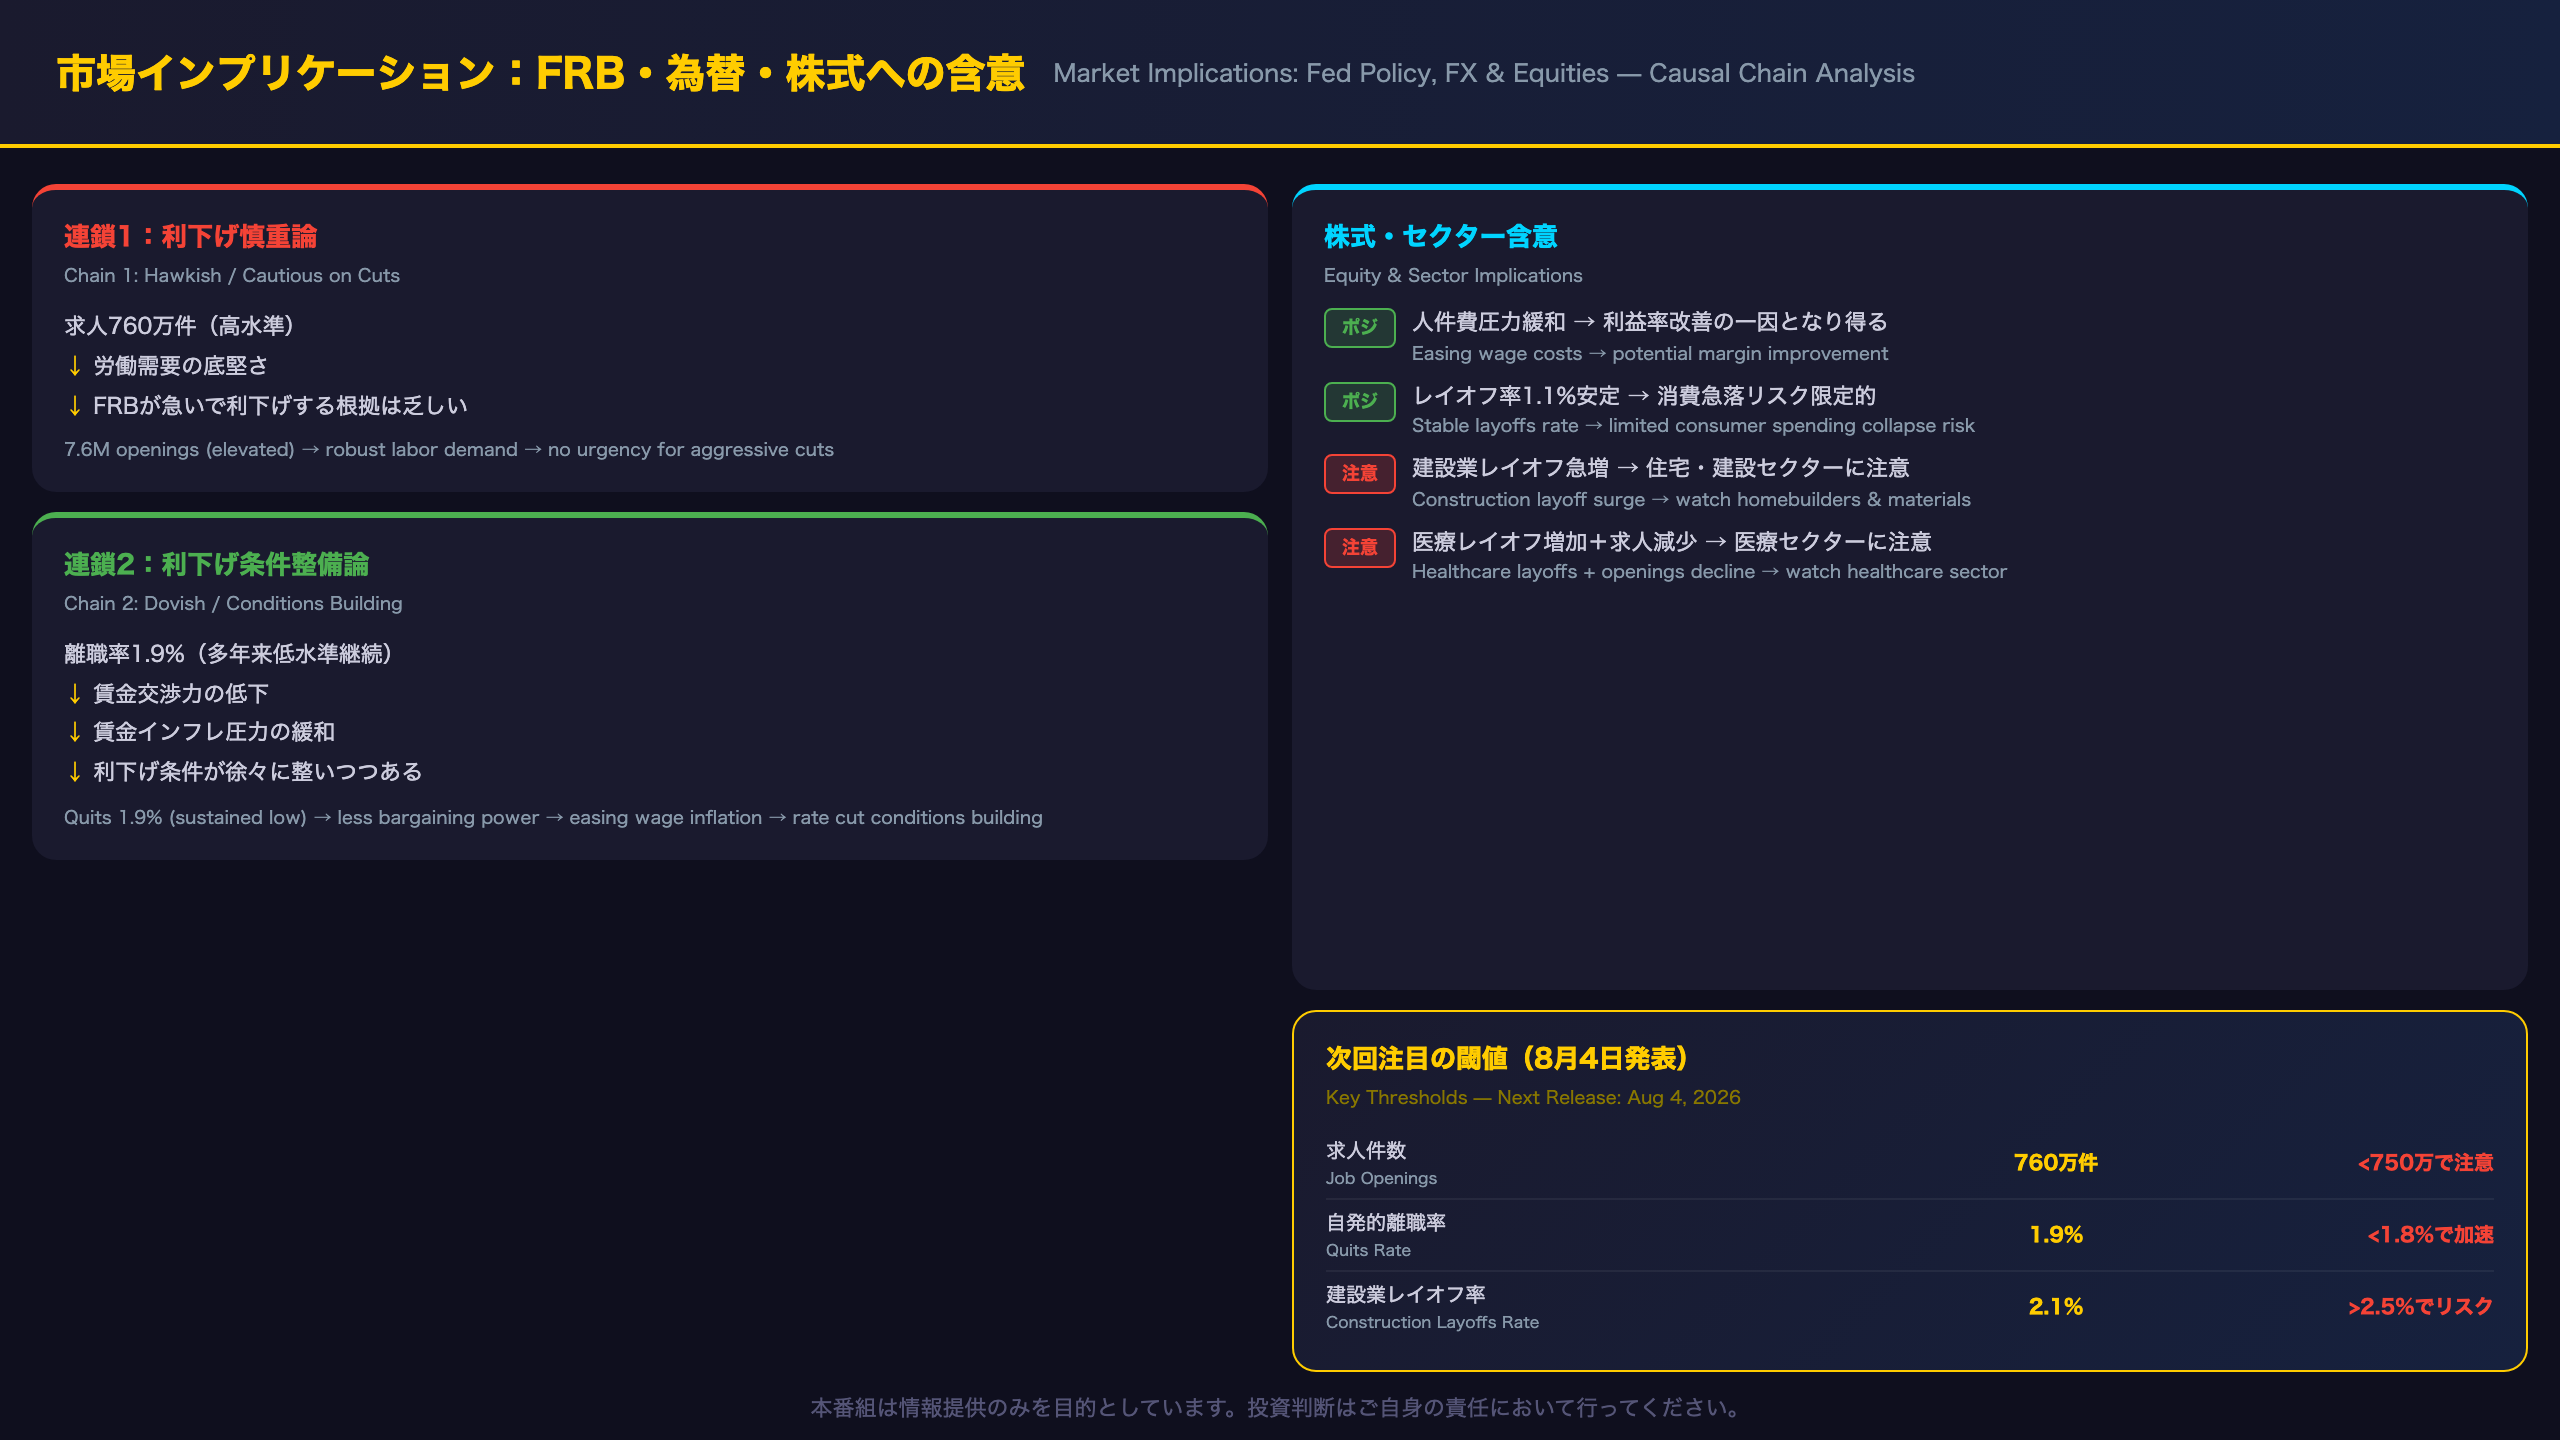
Job openings at 7.6M (still elevated) → labor demand remains robust → labor market not yet loose enough → Fed has no urgency to cut rates aggressively
Chain 2 (Dovish / Conditions Building):
Quits rate at 1.9% (sustained multi-year low) → declining worker bargaining power → easing wage inflation → supports inflation converging to 2% target → rate cut conditions gradually aligning
These two chains are not contradictory. The most coherent synthesis: “No urgency to cut, but the conditions for cuts are gradually building.” This is consistent with a Fed that remains data-dependent and patient.
U.S. Dollar
Labor market resilience is generally considered a USD-supportive factor through the interest rate differential channel: strong labor market → Fed holds rates higher for longer → wider rate differential vs. other G10 currencies → USD support. However, this JOLTS data alone is insufficient to make a directional currency call. The dollar’s trajectory depends on a complex interplay of rate differentials, risk sentiment, and geopolitical factors.
Equities
Positive factors:
– Gradual labor market cooling → easing corporate wage cost pressures → potential margin improvement, particularly for labor-intensive sectors
– Stable layoffs rate (1.1%) → no broad-based surge in job cuts → limits risk of sharp consumer spending decline
Sector-specific cautions:
– Construction layoff surge → watch homebuilders, construction materials, and related REITs
– Healthcare layoffs + openings decline → monitor hospital systems, staffing agencies, and healthcare REITs
Key Thresholds to Watch (Next Release: August 4, 2026)
| Indicator | Current | Watch Level | Signal |
|---|---|---|---|
| Job Openings | 7.594M | <7.5M | Demand softening |
| Quits Rate | 1.9% | <1.8% | Accelerating wage pressure easing |
| Construction Layoffs Rate | 2.1% | >2.5% | Sector-specific risk |
| Healthcare Openings Rate | 5.6% | <5.0% | Structural shift in healthcare hiring |
Disclaimer: This article is for informational purposes only. All investment decisions are made solely at your own risk.







