
📺 Watch the Full Video Analysis
This article was automatically generated by the NFC Market Live AI analysis system. (Updated: 2026-07-29 00:05 JST)
📄 Primary Source
U.S. Census Bureau
https://www.census.gov/manufacturing/m3/adv/pdf/durgd.pdf
Deep dive into the June 2026 US Durable Goods Orders advance report released July 27 by the Census Bureau.
📊 Headline new orders rose just 0.3% to $334.8B, a modest rebound from May’s 4.0% drop.
📈 But core capex orders (nondefense capital goods ex-aircraft) rose 0.9%, extending May’s 1.9% gain for a second straight monthly increase.
⚠️ The headline’s wild swings trace back to aircraft orders (+167.4% in April, -51.1% in May) — noise, not necessarily weakness.
💡 Backlog grew for the 23rd time in 24 months, while inventories stayed lean versus shipments.
A balanced, data-driven read on where US business investment really stands.
耐久財受注 総合評価:表面の弱さと隠れた強さ / Headline Softness, Hidden Strength
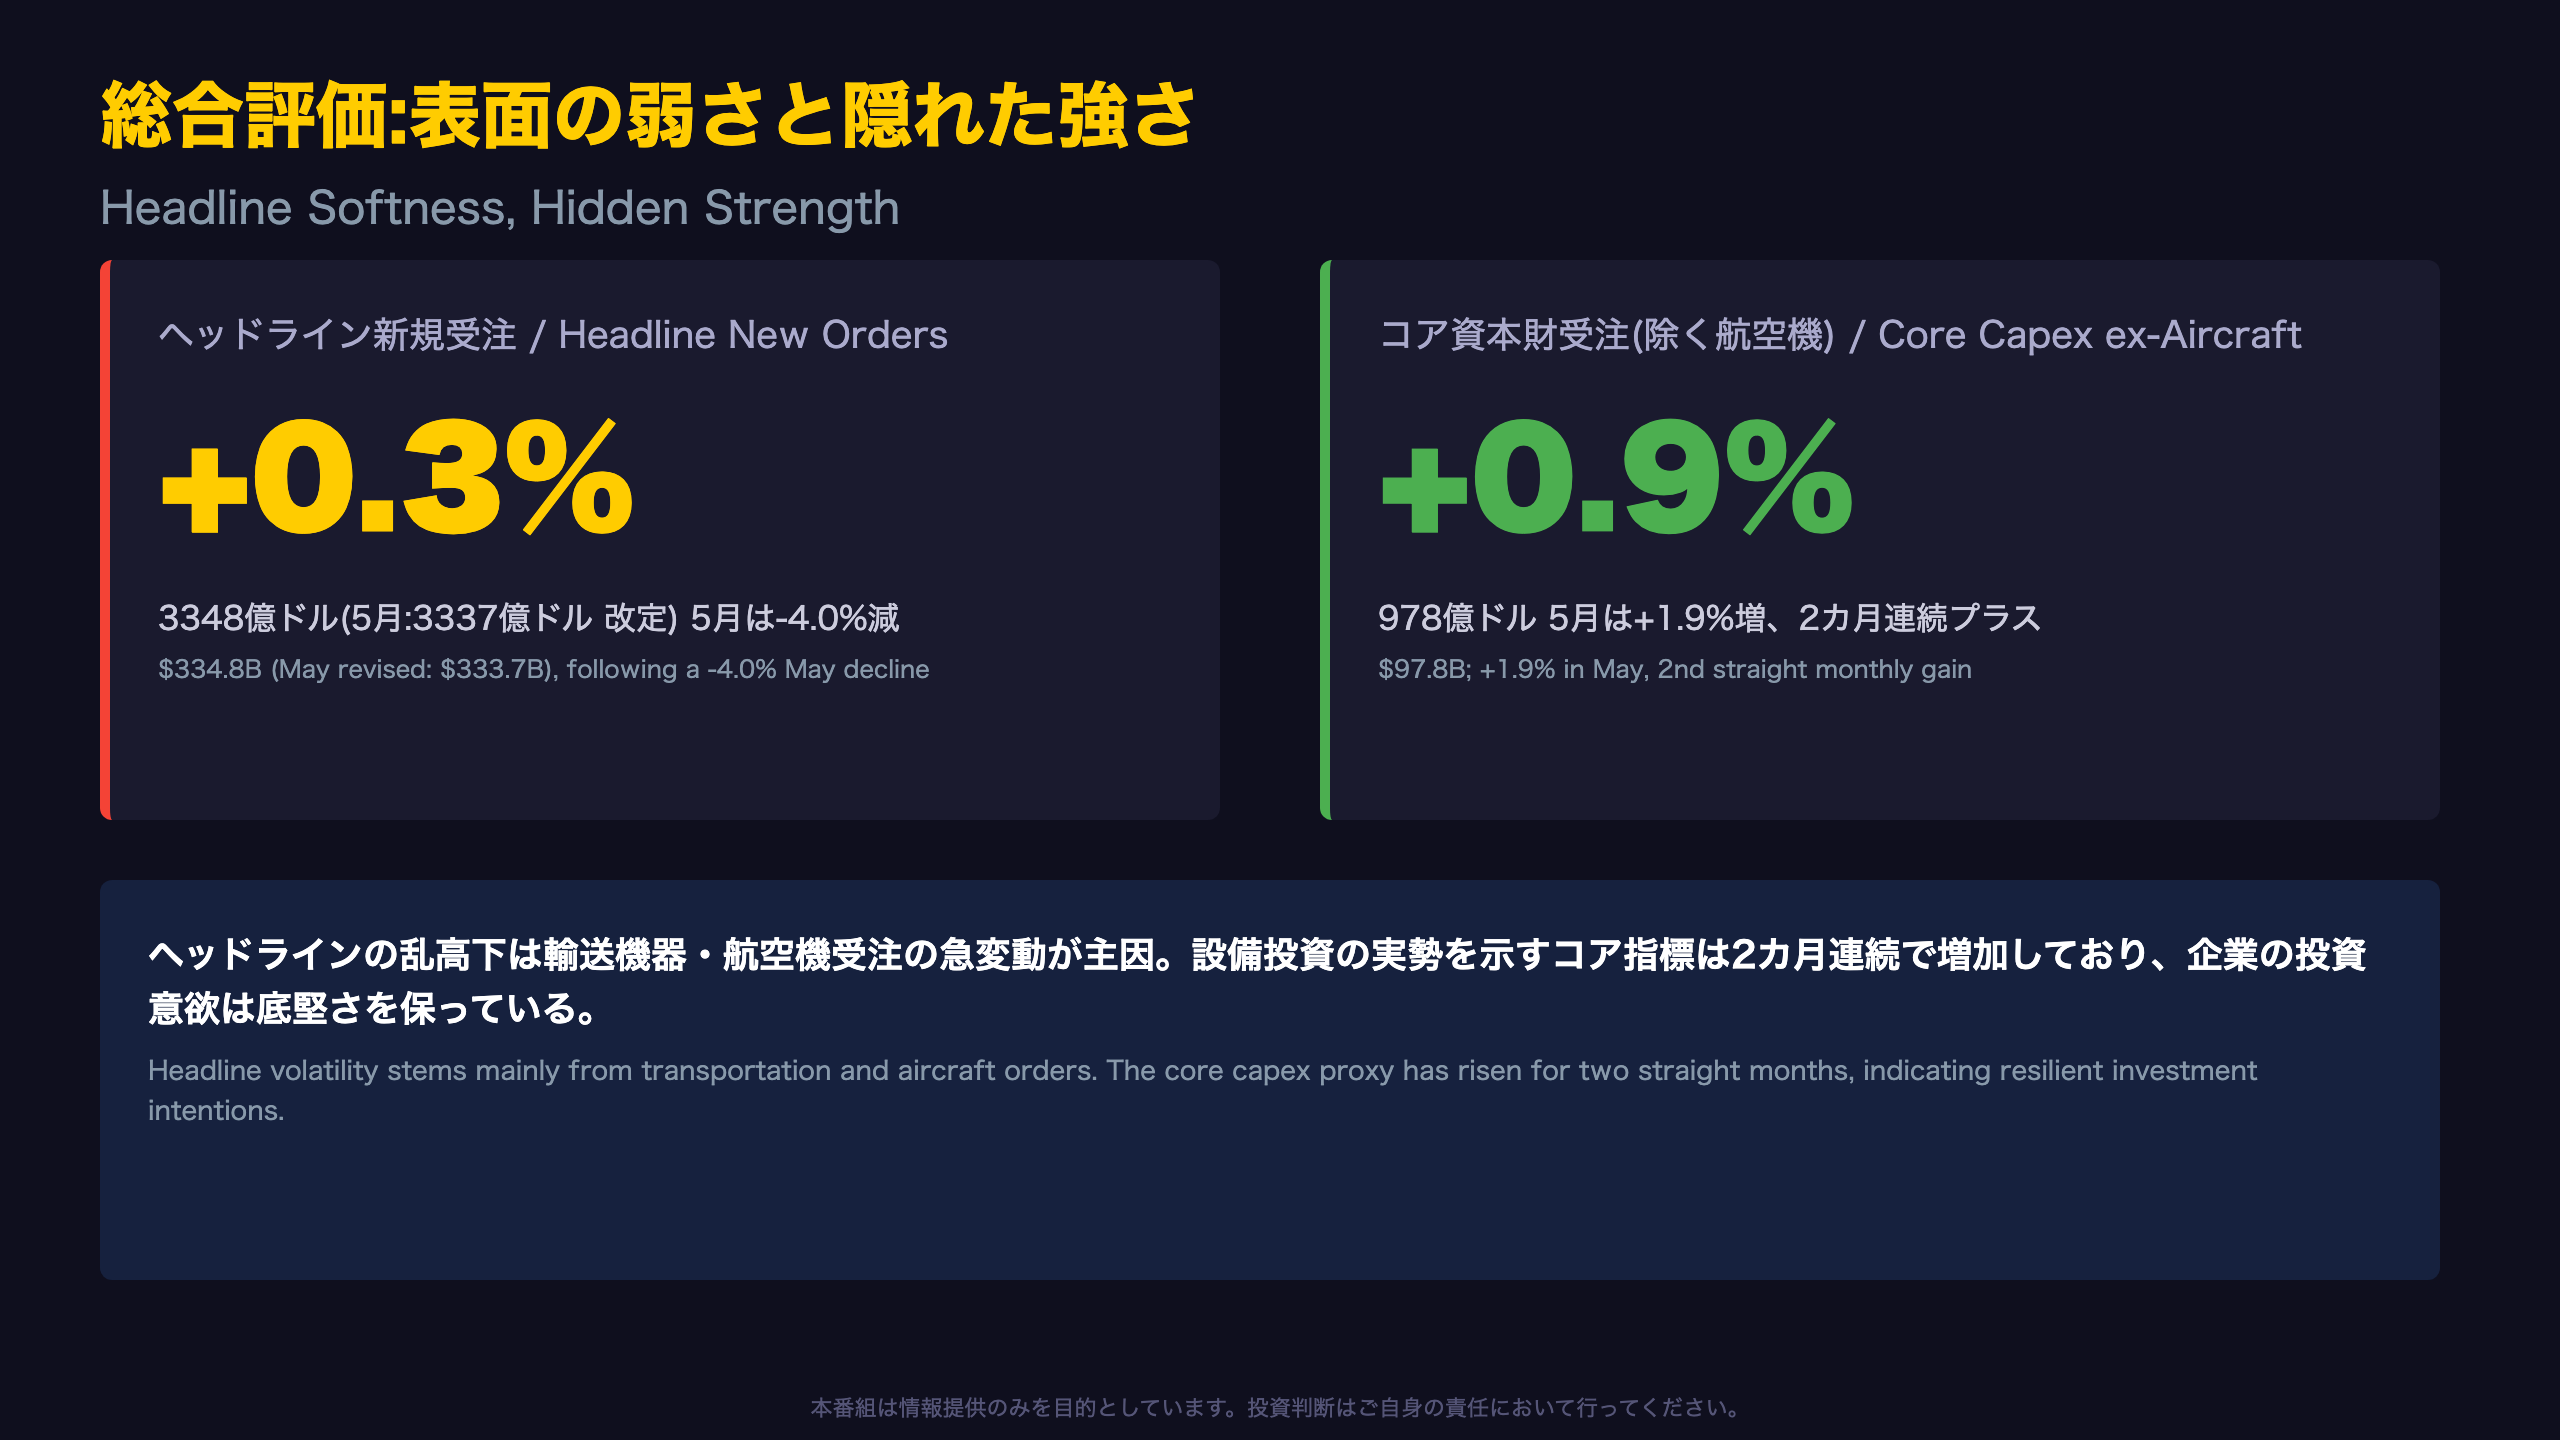
What the release actually says
The Census Bureau’s advance report is compiled from the Manufacturers’ Shipments, Inventories, and Orders (M3) survey, a voluntary panel of roughly 4,700 reporting units. It explicitly notes new orders were “up three of the last four months,” which tempers any narrative of sudden weakness from a single soft print.
Context for international readers
Unlike a central bank release, this Census Bureau report carries no policy signal of its own, but it directly feeds the equipment investment component of US GDP, making it closely watched by both the Federal Reserve and equity markets tracking industrial sector health.
Bull and bear reads
Bears will note the 0.3% June bounce looks thin against May’s 4.0% decline. Bulls counter that the ex-aircraft, ex-defense core measure just posted back-to-back monthly gains (+1.9% May, +0.9% June), a cleaner signal of underlying capex demand than the noisy headline.
What’s next
Revised May data and the full nondurables breakdown arrive August 4. The July advance report follows August 26 — watch whether core capital goods orders extend to a third consecutive monthly increase, which would strengthen the resilience case.
乱高下の正体:航空機受注というノイズ / Behind the Whipsaw: Aircraft Order Noise
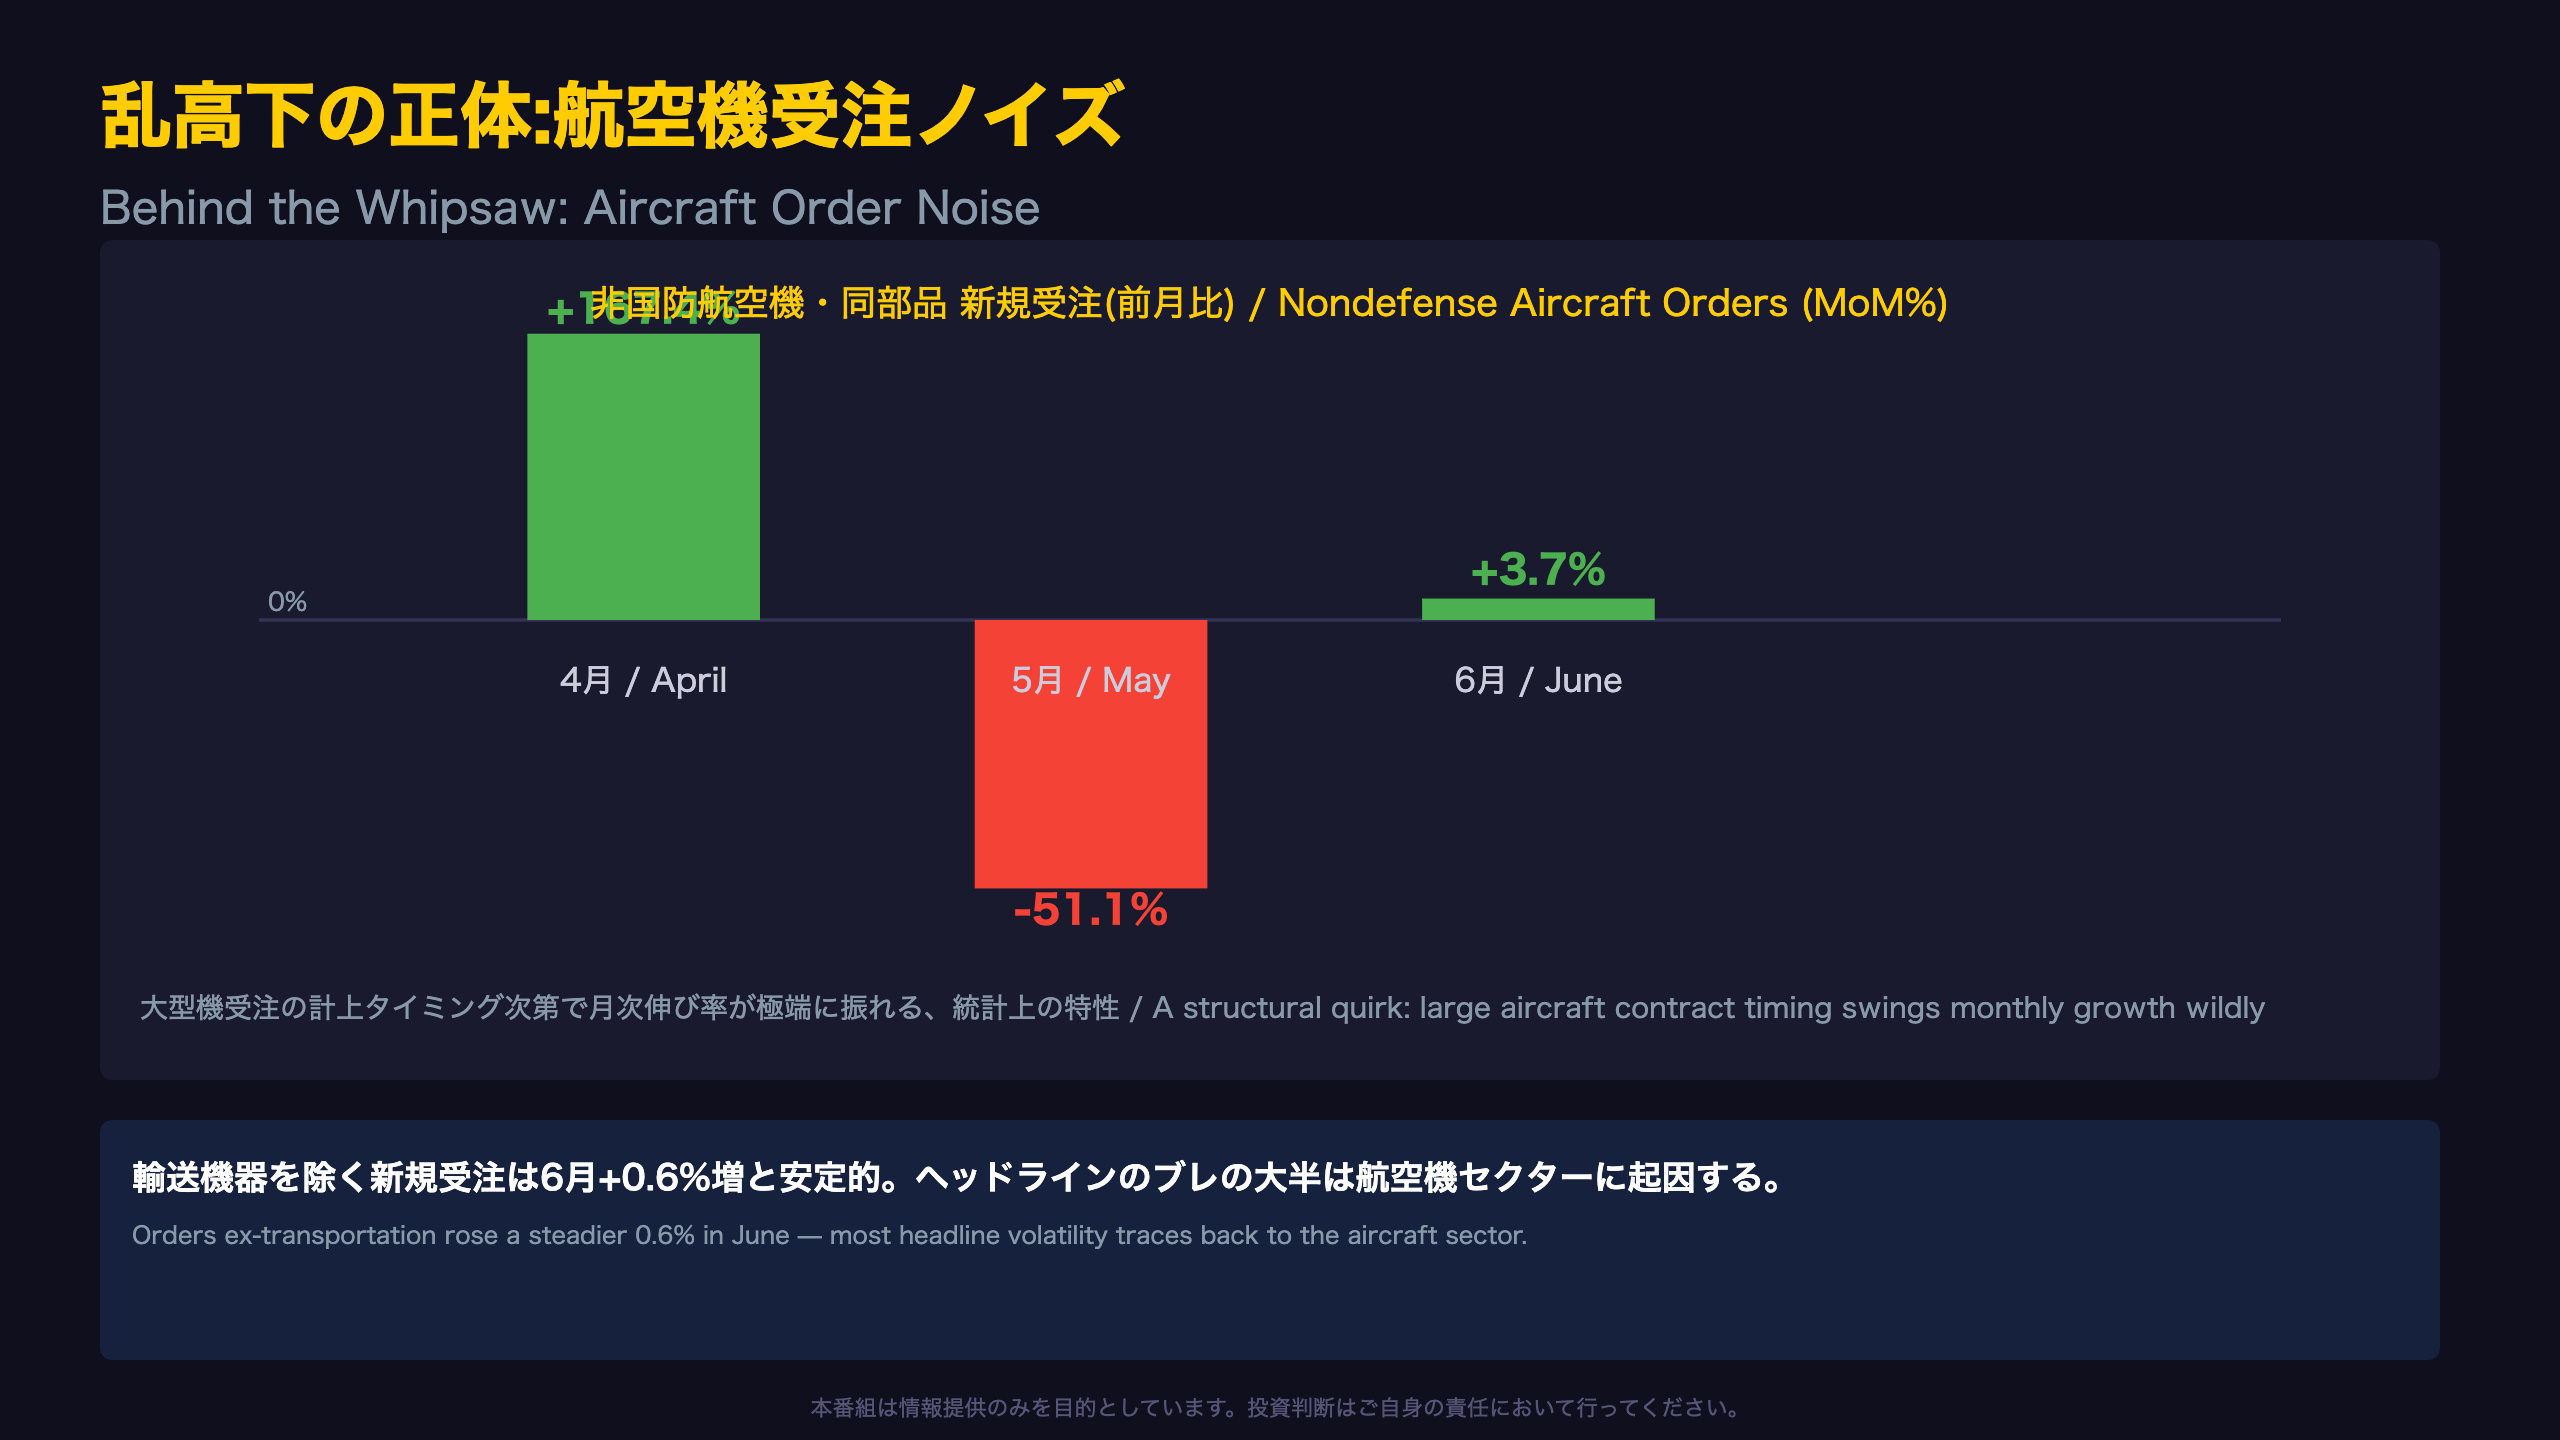
Quantifying the swing
Nondefense aircraft and parts orders moved from $18.75B in April (+167.4% MoM) to $18.08B in May (-51.1%) to $18.75B in June (+3.7%). The report states these figures plainly without commentary, but the magnitude of the swing is striking on its own.
Why aircraft orders behave this way
A single wide-body jet order can run into the hundreds of millions of dollars, so the timing of when a contract books can swing an entire category’s monthly growth rate by double digits. This is a structural feature of the M3 survey’s aircraft category, not evidence of demand collapsing or booming (Level C inference — a single data point shouldn’t be read as a trend shift).
The ex-transportation contrast
Orders excluding transportation rose a comparatively tame 1.5% in April, 1.8% in May, and 0.6% in June — confirming that most of the headline’s volatility originates in transportation and aircraft, not the broader manufacturing base.
A caveat for readers
The Census Bureau explicitly states: “Statistical significance is not measurable for this survey.” The M3 panel is not a probability sample, so month-to-month percentage changes should be read directionally, not as precise point estimates.
コア資本財、2カ月連続の増加 / Core Capex Orders: Two Straight Months of Growth
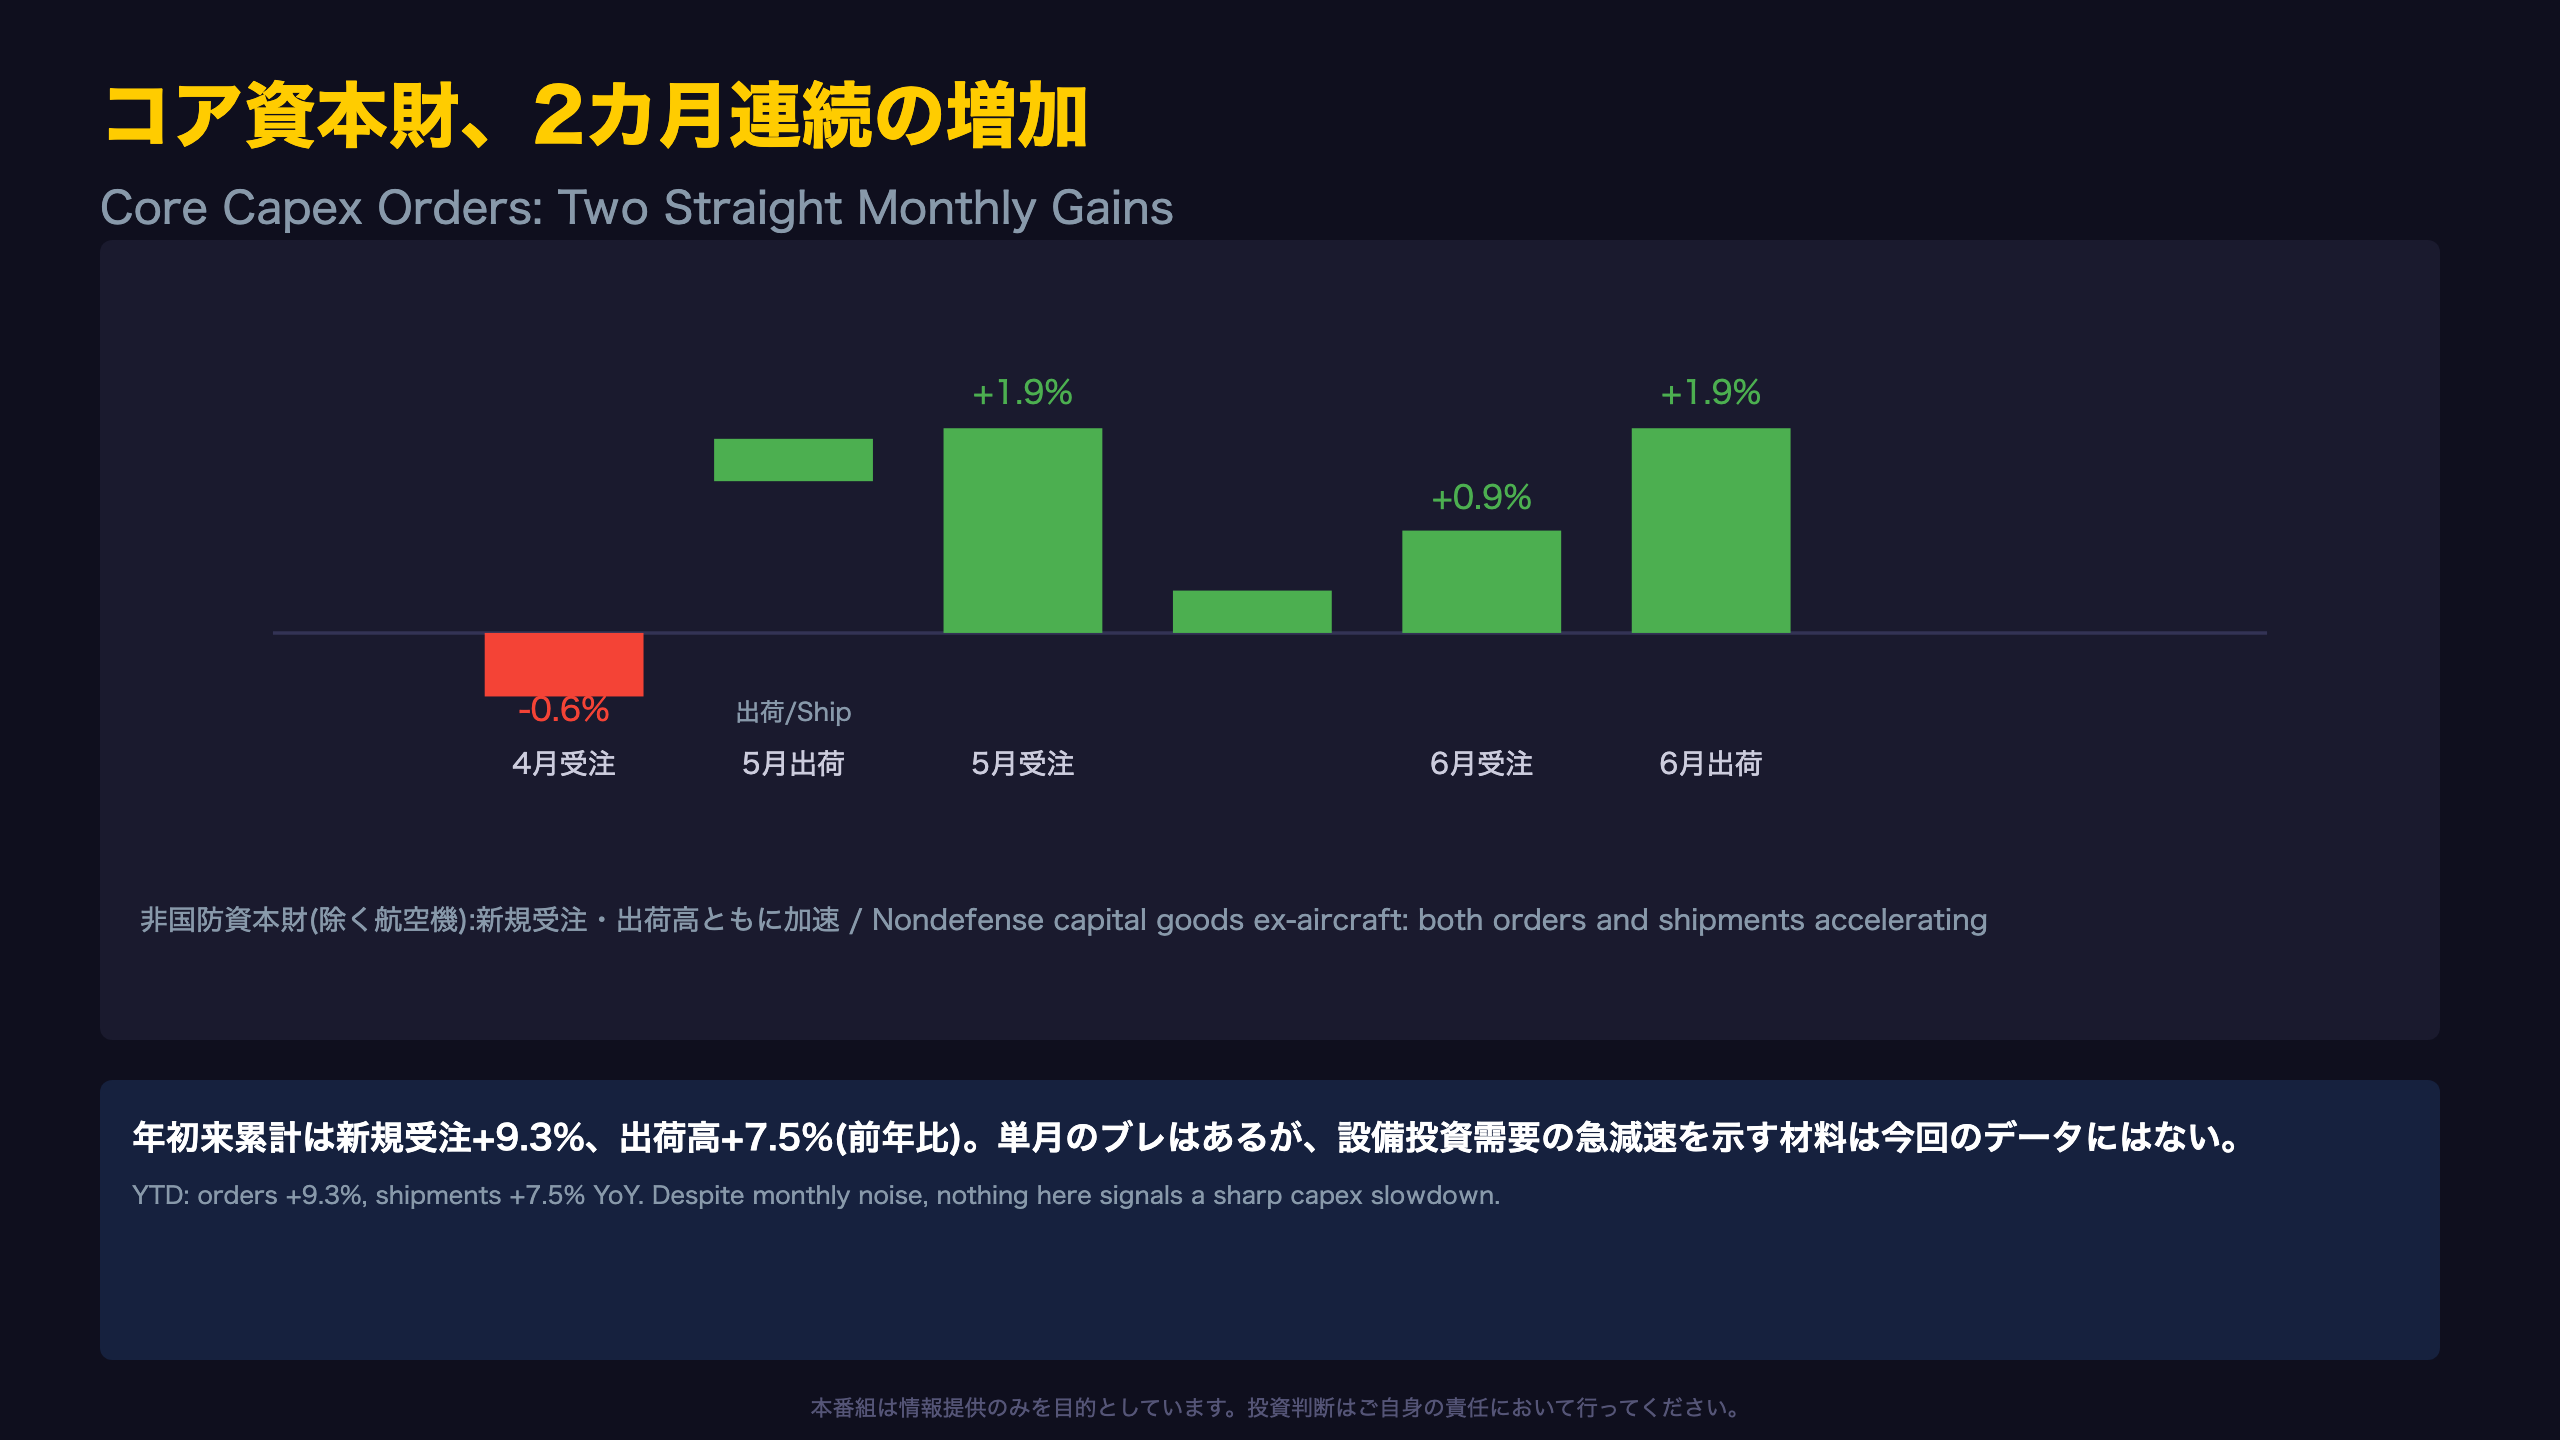
Why this indicator matters
Economists tracking US GDP’s equipment investment component watch nondefense capital goods orders excluding aircraft above all else — it strips out the lumpy aircraft and defense components to isolate the purest read on private-sector capex demand.
Three-month trajectory
| Month | New Orders MoM | Shipments MoM |
|---|---|---|
| April | -0.6% | +0.6% |
| May | +1.9% (revised) | +0.2% |
| June | +0.9% | +1.9% |
Orders and shipments have alternated in leading the acceleration, so there’s no simple downward trend to point to.
Year-to-date resilience
Year-to-date, core orders are up 9.3% and shipments up 7.5% versus the same period last year — both comfortably outpacing typical US inflation readings, suggesting genuine nominal strength, not just price effects.
The other side of the argument
Bulls will call this two-month streak a sign the capex cycle has bottomed. But averaging in April’s -0.6% dip yields a three-month average gain of roughly 0.7%, which skeptics could call “steady” rather than “strong” — a case where the data supports a more modest, wait-and-see read too.
受注残高は23カ月連続増、在庫は健全水準 / Backlog Grows for 23rd Month, Inventories Stay Lean
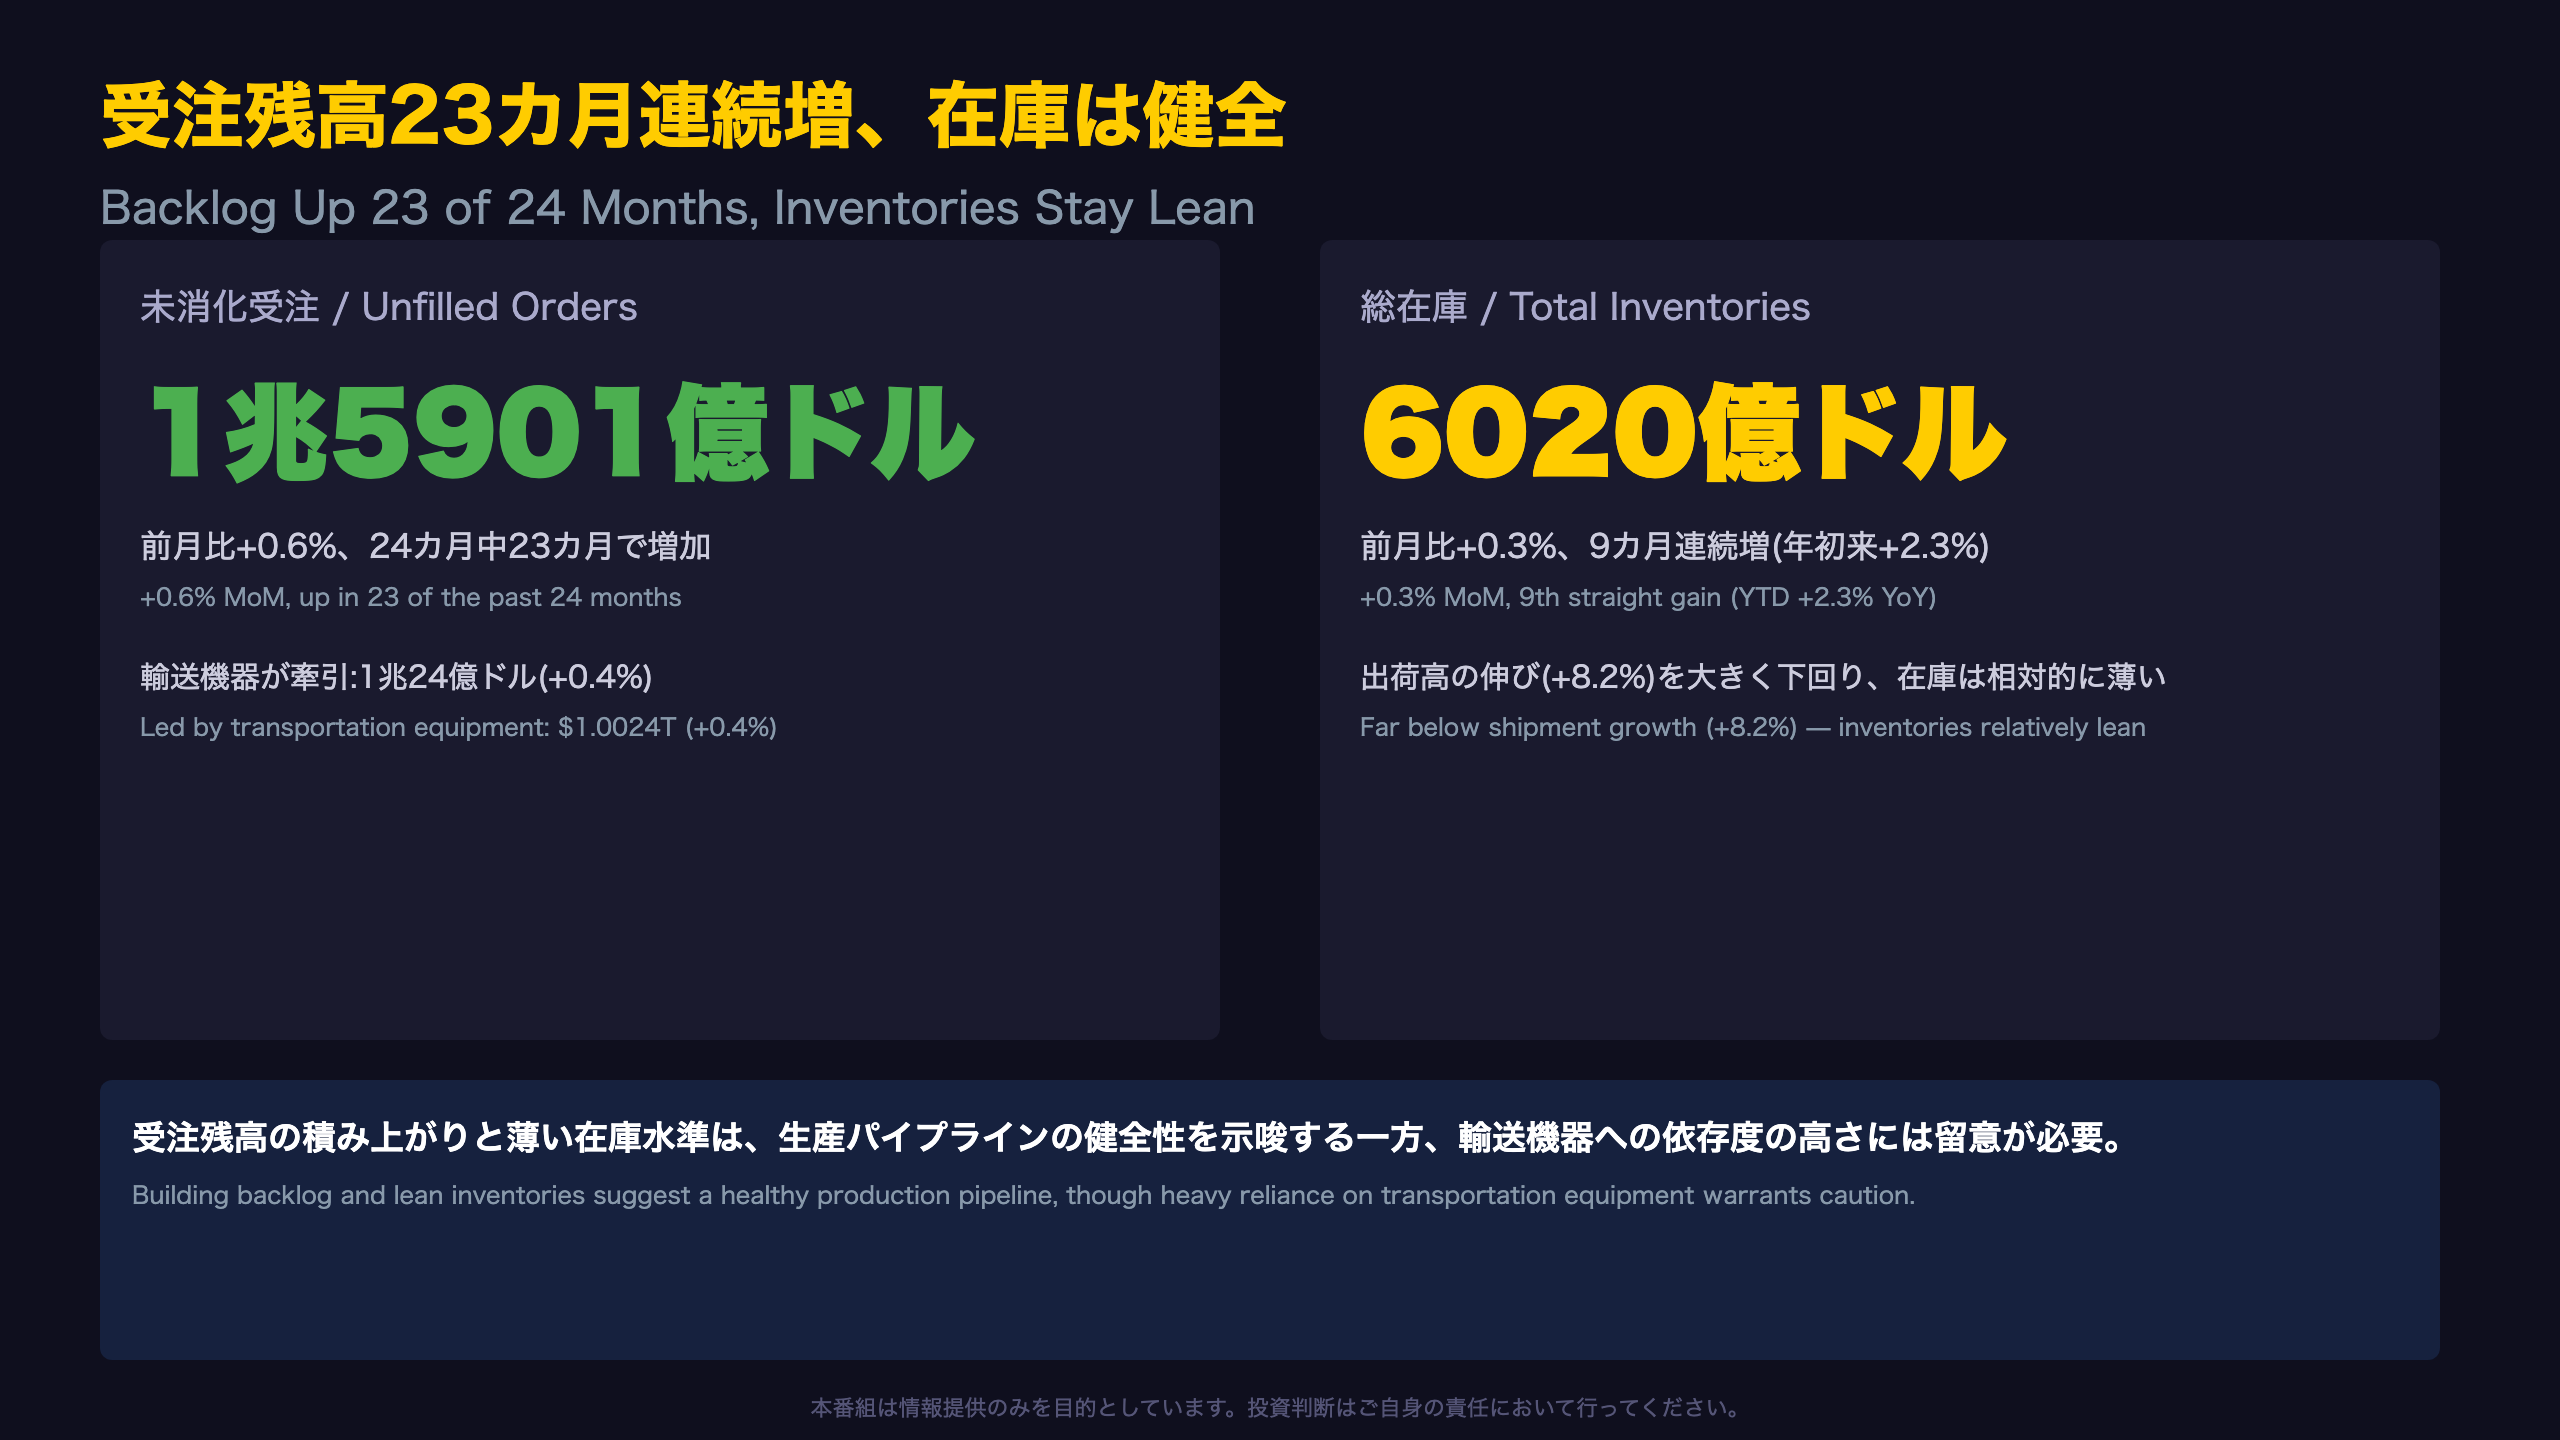
What the backlog tells us
The report states unfilled orders were “up twenty-three of the last twenty-four months,” reflecting nearly two years of consistent backlog growth — a sign manufacturers have a deep pipeline of future production work.
Unfilled orders for manufactured durable goods in June…increased $9.3 billion or 0.6 percent to $1,590.1 billion.
Inventory-to-shipment dynamics
Inventories have risen for nine consecutive months (+0.3% in June), but year-over-year growth of just 2.3% trails shipment growth of 8.2% by a wide margin. This gap implies an improving inventory-to-shipments ratio — inventories are getting comparatively leaner, which typically signals lower risk of a destocking-driven production slowdown (a dynamic US equity markets watch closely in industrial and manufacturing sectors).
A note of caution
However, the backlog’s growth leans heavily on transportation equipment, whose $1.0024 trillion unfilled orders make up about 63% of the total durable goods backlog — largely aircraft-related. Backlog excluding transportation rose a more modest 0.9% to $587.7 billion, still positive but smaller in absolute scale.
Looking ahead
The August 4 revision will offer a more granular breakdown of inventories by stage of fabrication (materials, work-in-process, finished goods), useful for gauging whether the lean inventory trend persists.
セクター別に見る強弱:ハイテクと防衛が牽引 / Sector Breakdown: Tech and Defense Lead
Durable tech demand
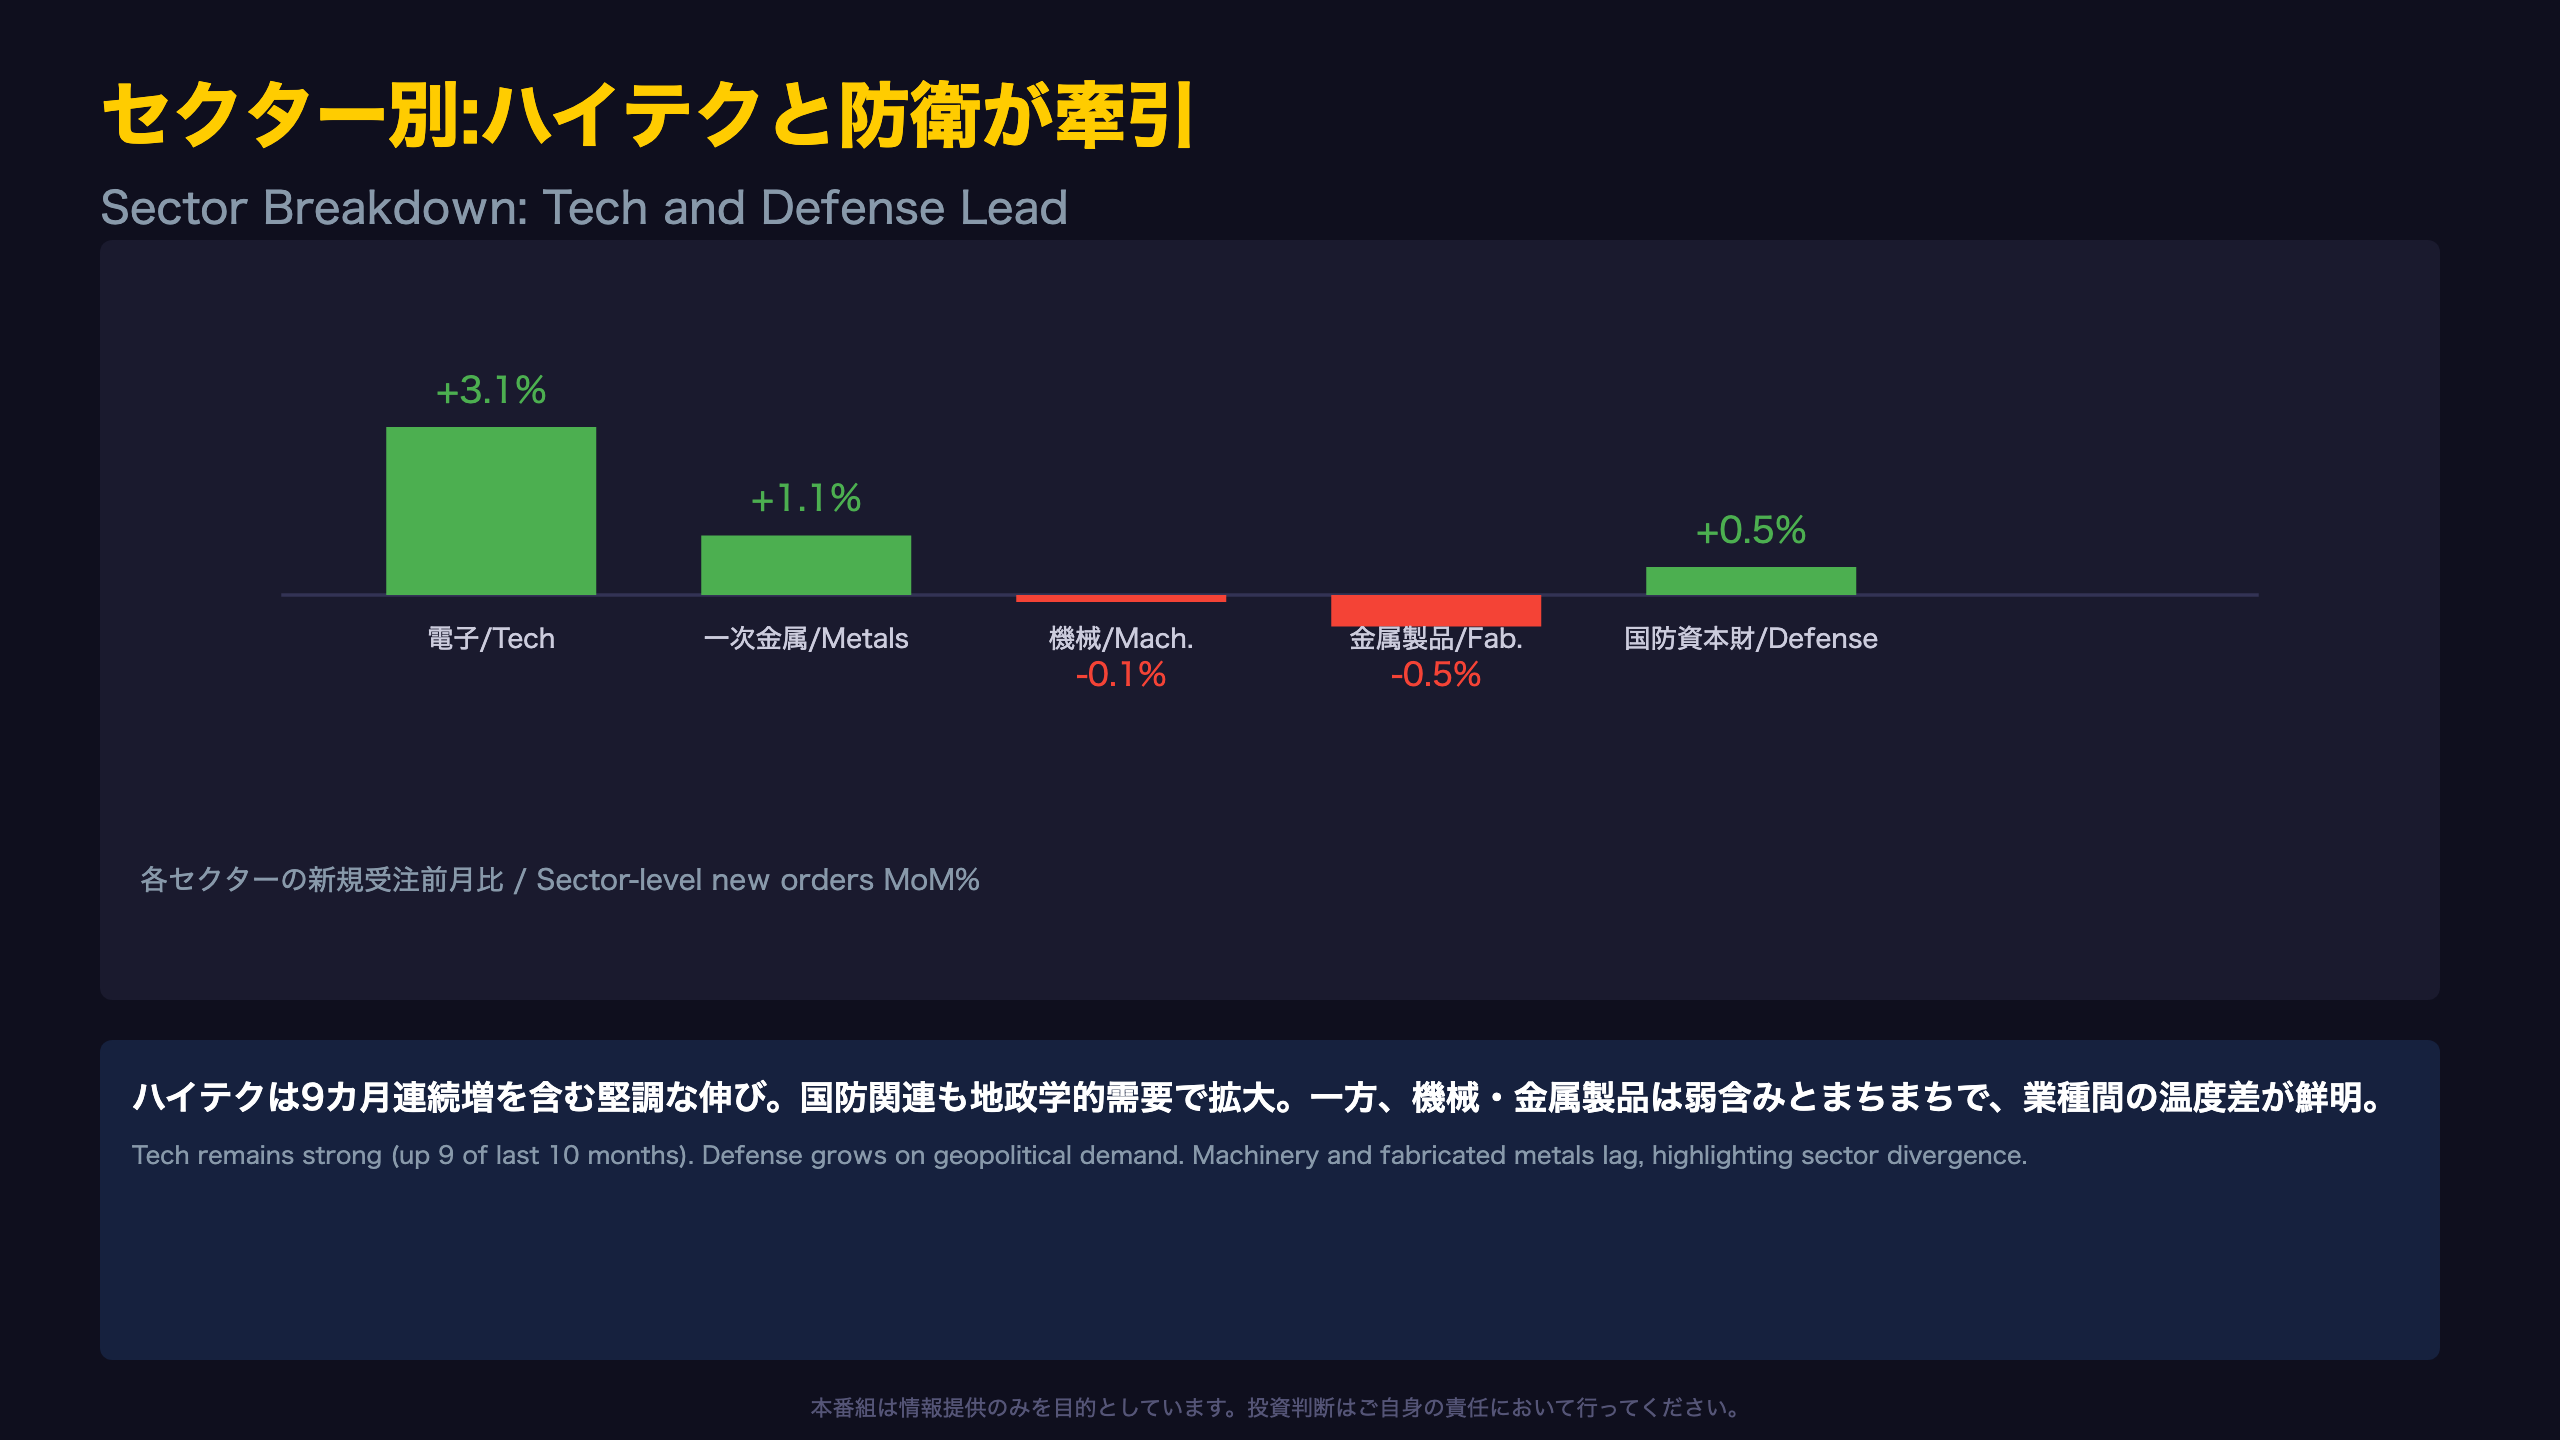
Computers and electronic products orders have risen in “nine of the last ten months,” per the report — nearly a year-long uptrend that coincides with the broader AI infrastructure buildout. Data center equipment demand may be a contributing factor (Level C inference, based on a single indicator, not a confirmed causal driver).
A mixed middle
Machinery (-0.1%) and fabricated metal products (-0.5%) both dipped slightly, though primary metals rose 1.1% — a sector-by-sector divergence. These mid-cycle industrial categories tend to show larger month-to-month noise, so multiple months of data are needed before drawing trend conclusions.
Defense-driven growth
Defense capital goods orders rose 0.5%, shipments rose 4.0%, and unfilled orders climbed 1.4% to $224.7 billion. Defense spending is driven by geopolitical and budgetary factors distinct from private capex cycles — investors should be careful not to conflate defense strength with broader private-sector demand health, a distinction that matters for sector-specific equity plays (industrials vs. aerospace/defense primes).
A balanced read
Tech and defense are the clear leaders this month, while traditional mid-cycle industrial sectors show a mixed bag. US manufacturing demand varies meaningfully by sub-sector — a uniform “strong” or “weak” label oversimplifies the picture.
市場への含意:ノイズを超えた実勢を読む / Market Implications: Reading Through the Noise

The evidentiary chain, explicit
[Fact] Core capital goods orders (ex-aircraft) rose 0.9% in June after 1.9% in May, two consecutive monthly gains → [Mechanism] This series is one of the primary monthly inputs the Bureau of Economic Analysis uses to estimate the equipment investment component of US GDP → [Market implication] It is generally believed that resilient capex signals sustained corporate confidence in production activity, which could offer a relative tailwind for industrial and capital goods equities — but this single advance report cannot, on its own, confirm a shift in Fed policy expectations or the broader business cycle.
Explicit statistical limits
The release states plainly: “Statistical significance is not measurable for this survey” and the M3 estimates “are not based on a probability sample.” Unlike CPI or nonfarm payrolls, this data carries no confidence interval — month-to-month percentage changes should be treated as directional signals, not precise point estimates, a distinction international investors unfamiliar with US statistical agencies should keep in mind when comparing this to, say, Eurostat or UK ONS releases that do publish confidence intervals.
What comes next
August 4: revised May data plus detailed nondurables
August 26: July advance report
If core capital goods orders extend to a third consecutive monthly gain in July, the case for a capex cycle bottom strengthens. If July reverses lower, this month’s two-month streak could prove to be a temporary bounce rather than a durable trend — a distinction that matters for how markets price forward Fed rate expectations and industrial-sector earnings revisions.
Disclaimer: This article is for informational purposes only. All investment decisions are made solely at your own risk.