📺 Watch the Full Video Analysis
This article was automatically generated by the NFC Market Live AI analysis system. (Updated: 2026-07-30 21:40 JST)
📄 Primary Source
U.S. Bureau of Economic Analysis
https://www.bea.gov/sites/default/files/2026-07/gdp2q26-adv.pdf
A deep dive into the U.S. Bureau of Economic Analysis’ Q2 2026 GDP Advance Estimate.
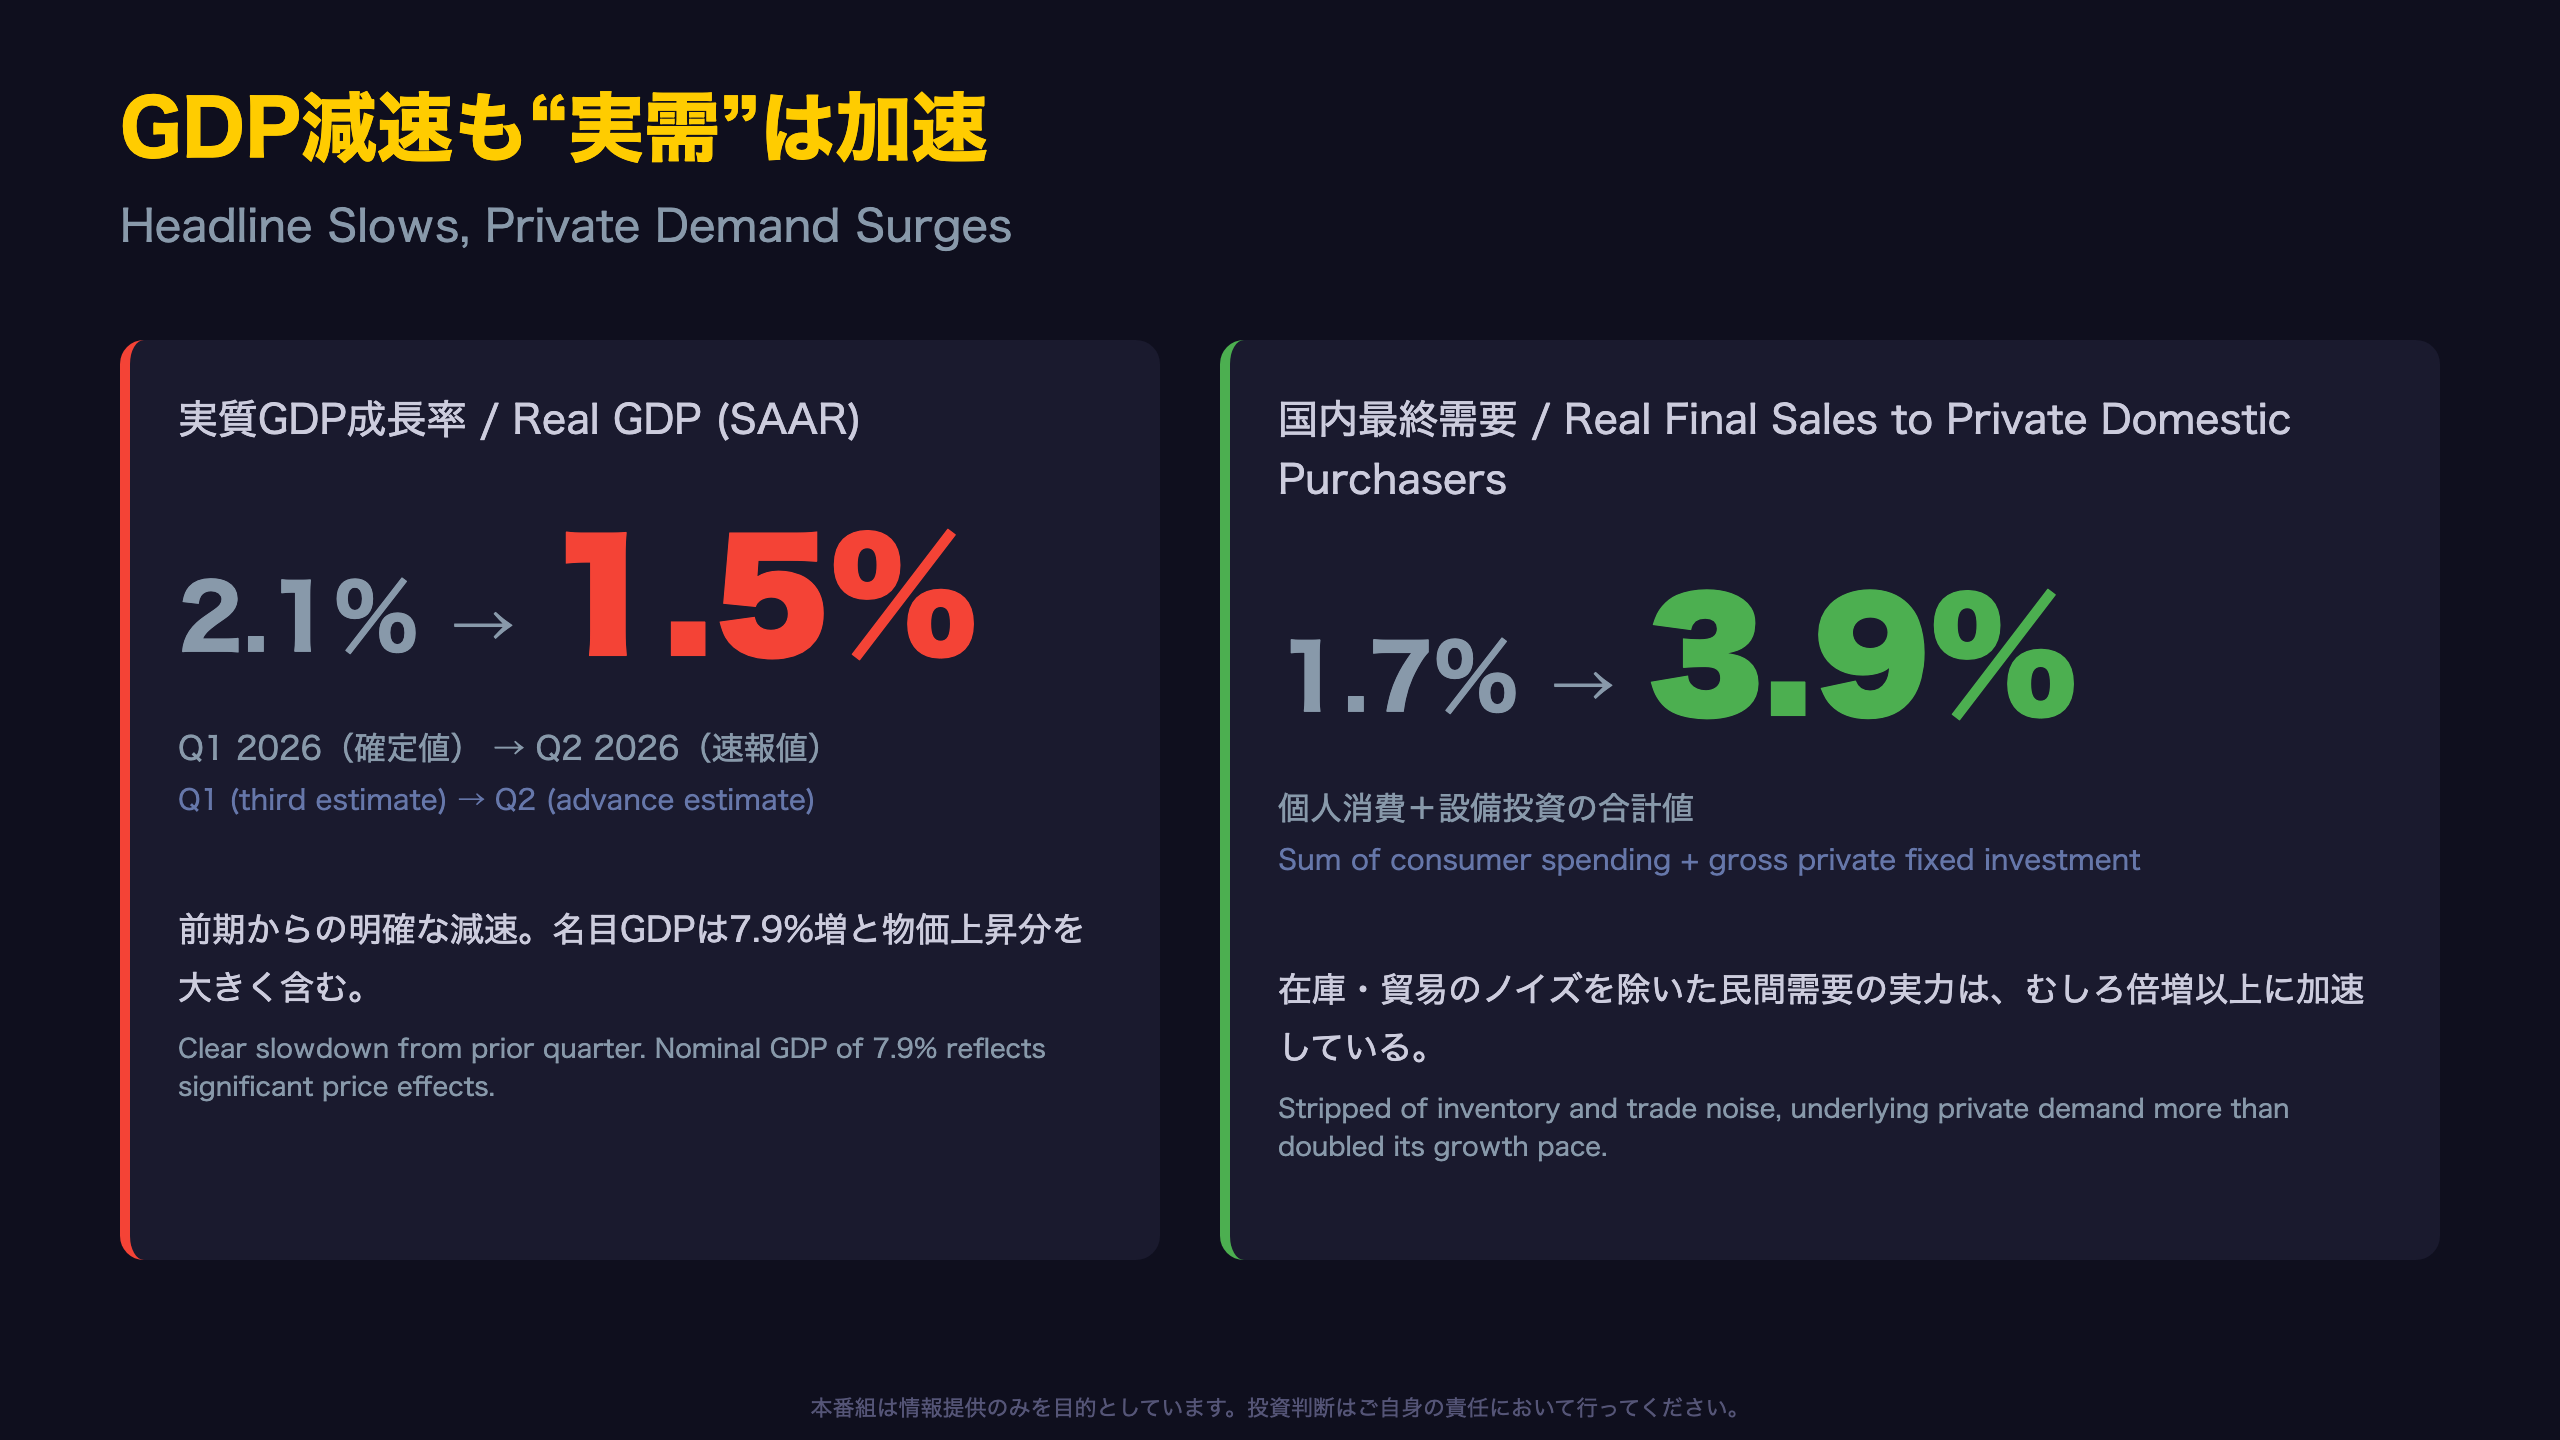
📊 Real GDP grew at a 1.5% annualized rate, down from 2.1% in Q1
📈 Real final sales to private domestic purchasers accelerated from 1.7% to 3.9%
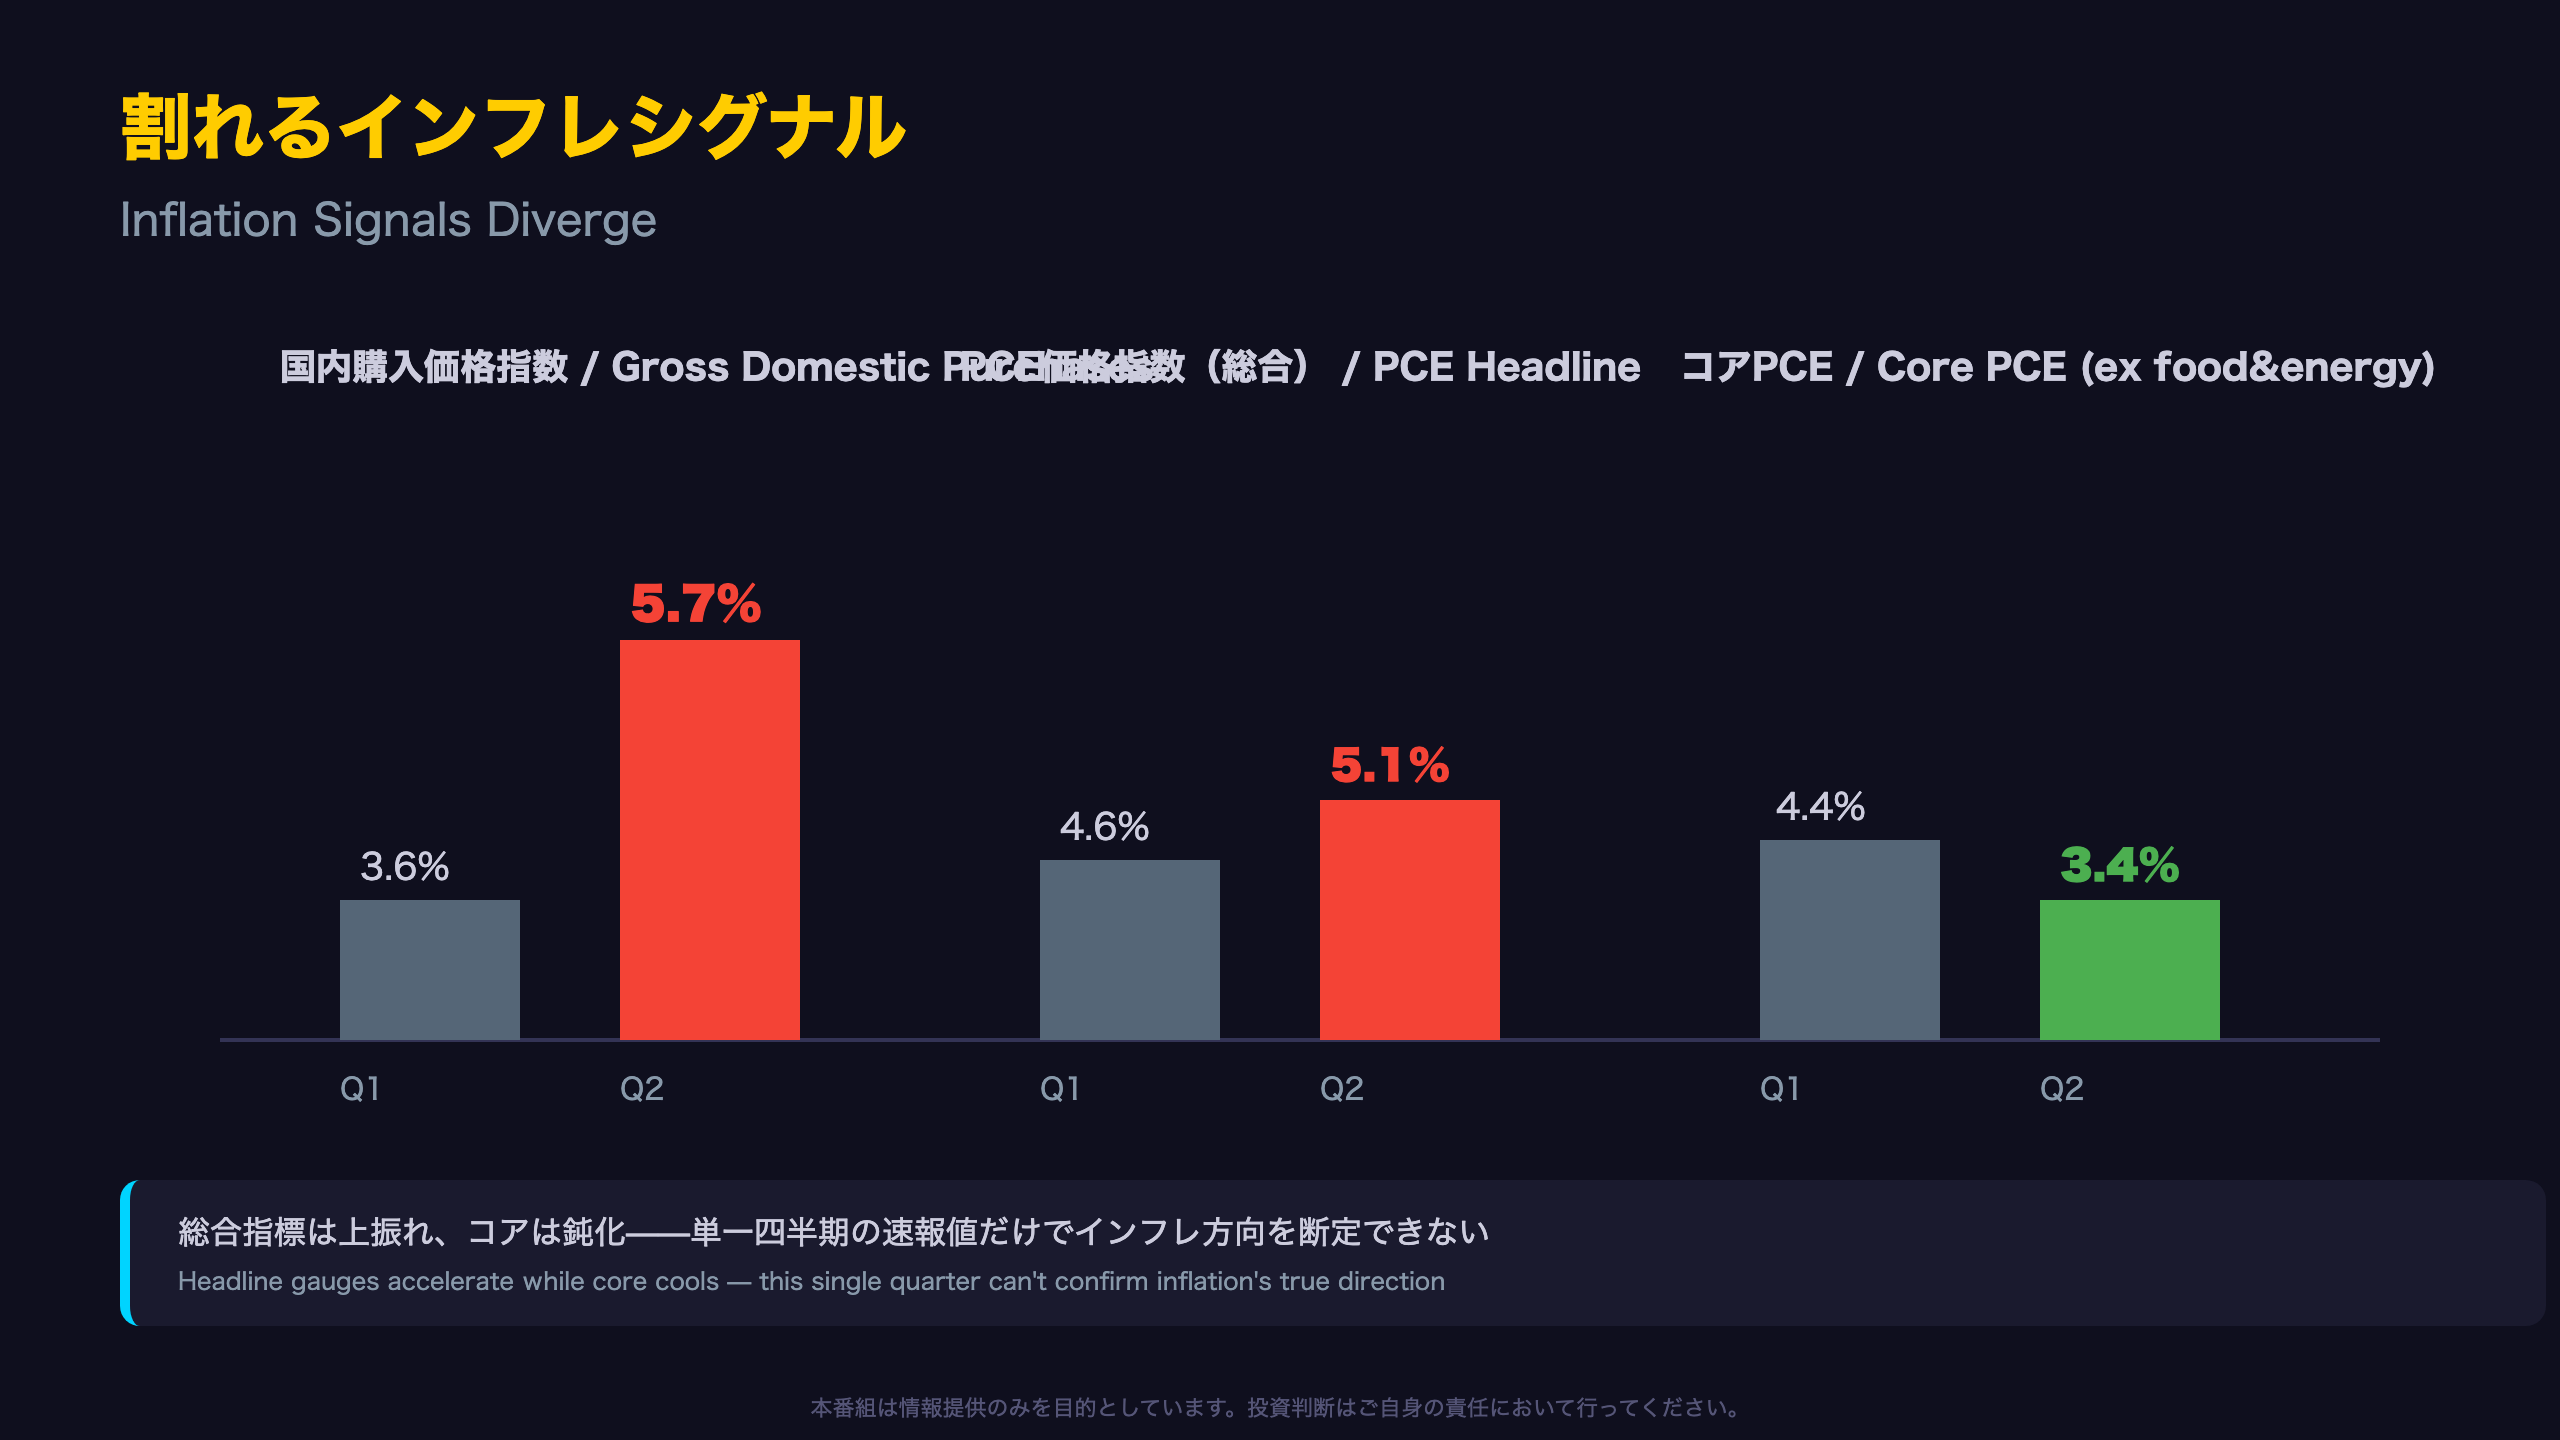
⚠️ The gross domestic purchases price index jumped from 3.6% to 5.7%, and headline PCE inflation rose to 5.1%
💡 Yet core PCE (ex food & energy) cooled from 4.4% to 3.4%
We break down the divergence between headline deceleration and resilient private demand, and what it means for the Fed’s next move.
GDP減速も“実需”は加速——二極化する米国経済
Two Faces of the Advance Estimate
The U.S. Bureau of Economic Analysis (BEA), the federal agency responsible for compiling official U.S. GDP data, released its advance estimate for Q2 2026 showing real GDP growth of 1.5% annualized, down from 2.1% in Q1 (third/final estimate) and up from just 0.5% in Q4 2025.
“The contributors to the increase in real GDP in the second quarter were increases in consumer spending, investment, and exports that were partly offset by a decrease in government spending.”
Nominal vs. Real: A Widening Gap
Current-dollar (nominal) GDP grew 7.9% annualized — more than five times the real growth rate. This gap reflects accelerating price pressures, which we explore in later slides.
Two Competing Reads
- Bullish case: The acceleration in real final sales to private domestic purchasers suggests underlying private-sector momentum is strengthening.
- Cautious case: The deceleration partly reflects government spending cuts and a wider trade drag — factors that may be more technical/accounting-driven than a genuine loss of economic momentum.
Unlike the Fed’s FOMC statements, GDP advance estimates are not policy documents — they are statistical snapshots subject to two rounds of revision (second estimate Aug 26, third estimate later). U.S. investors should note this is preliminary data.
牽引役は消費・投資・輸出、足を引っ張った政府支出
Reading the Contribution Mix (Qualitative)
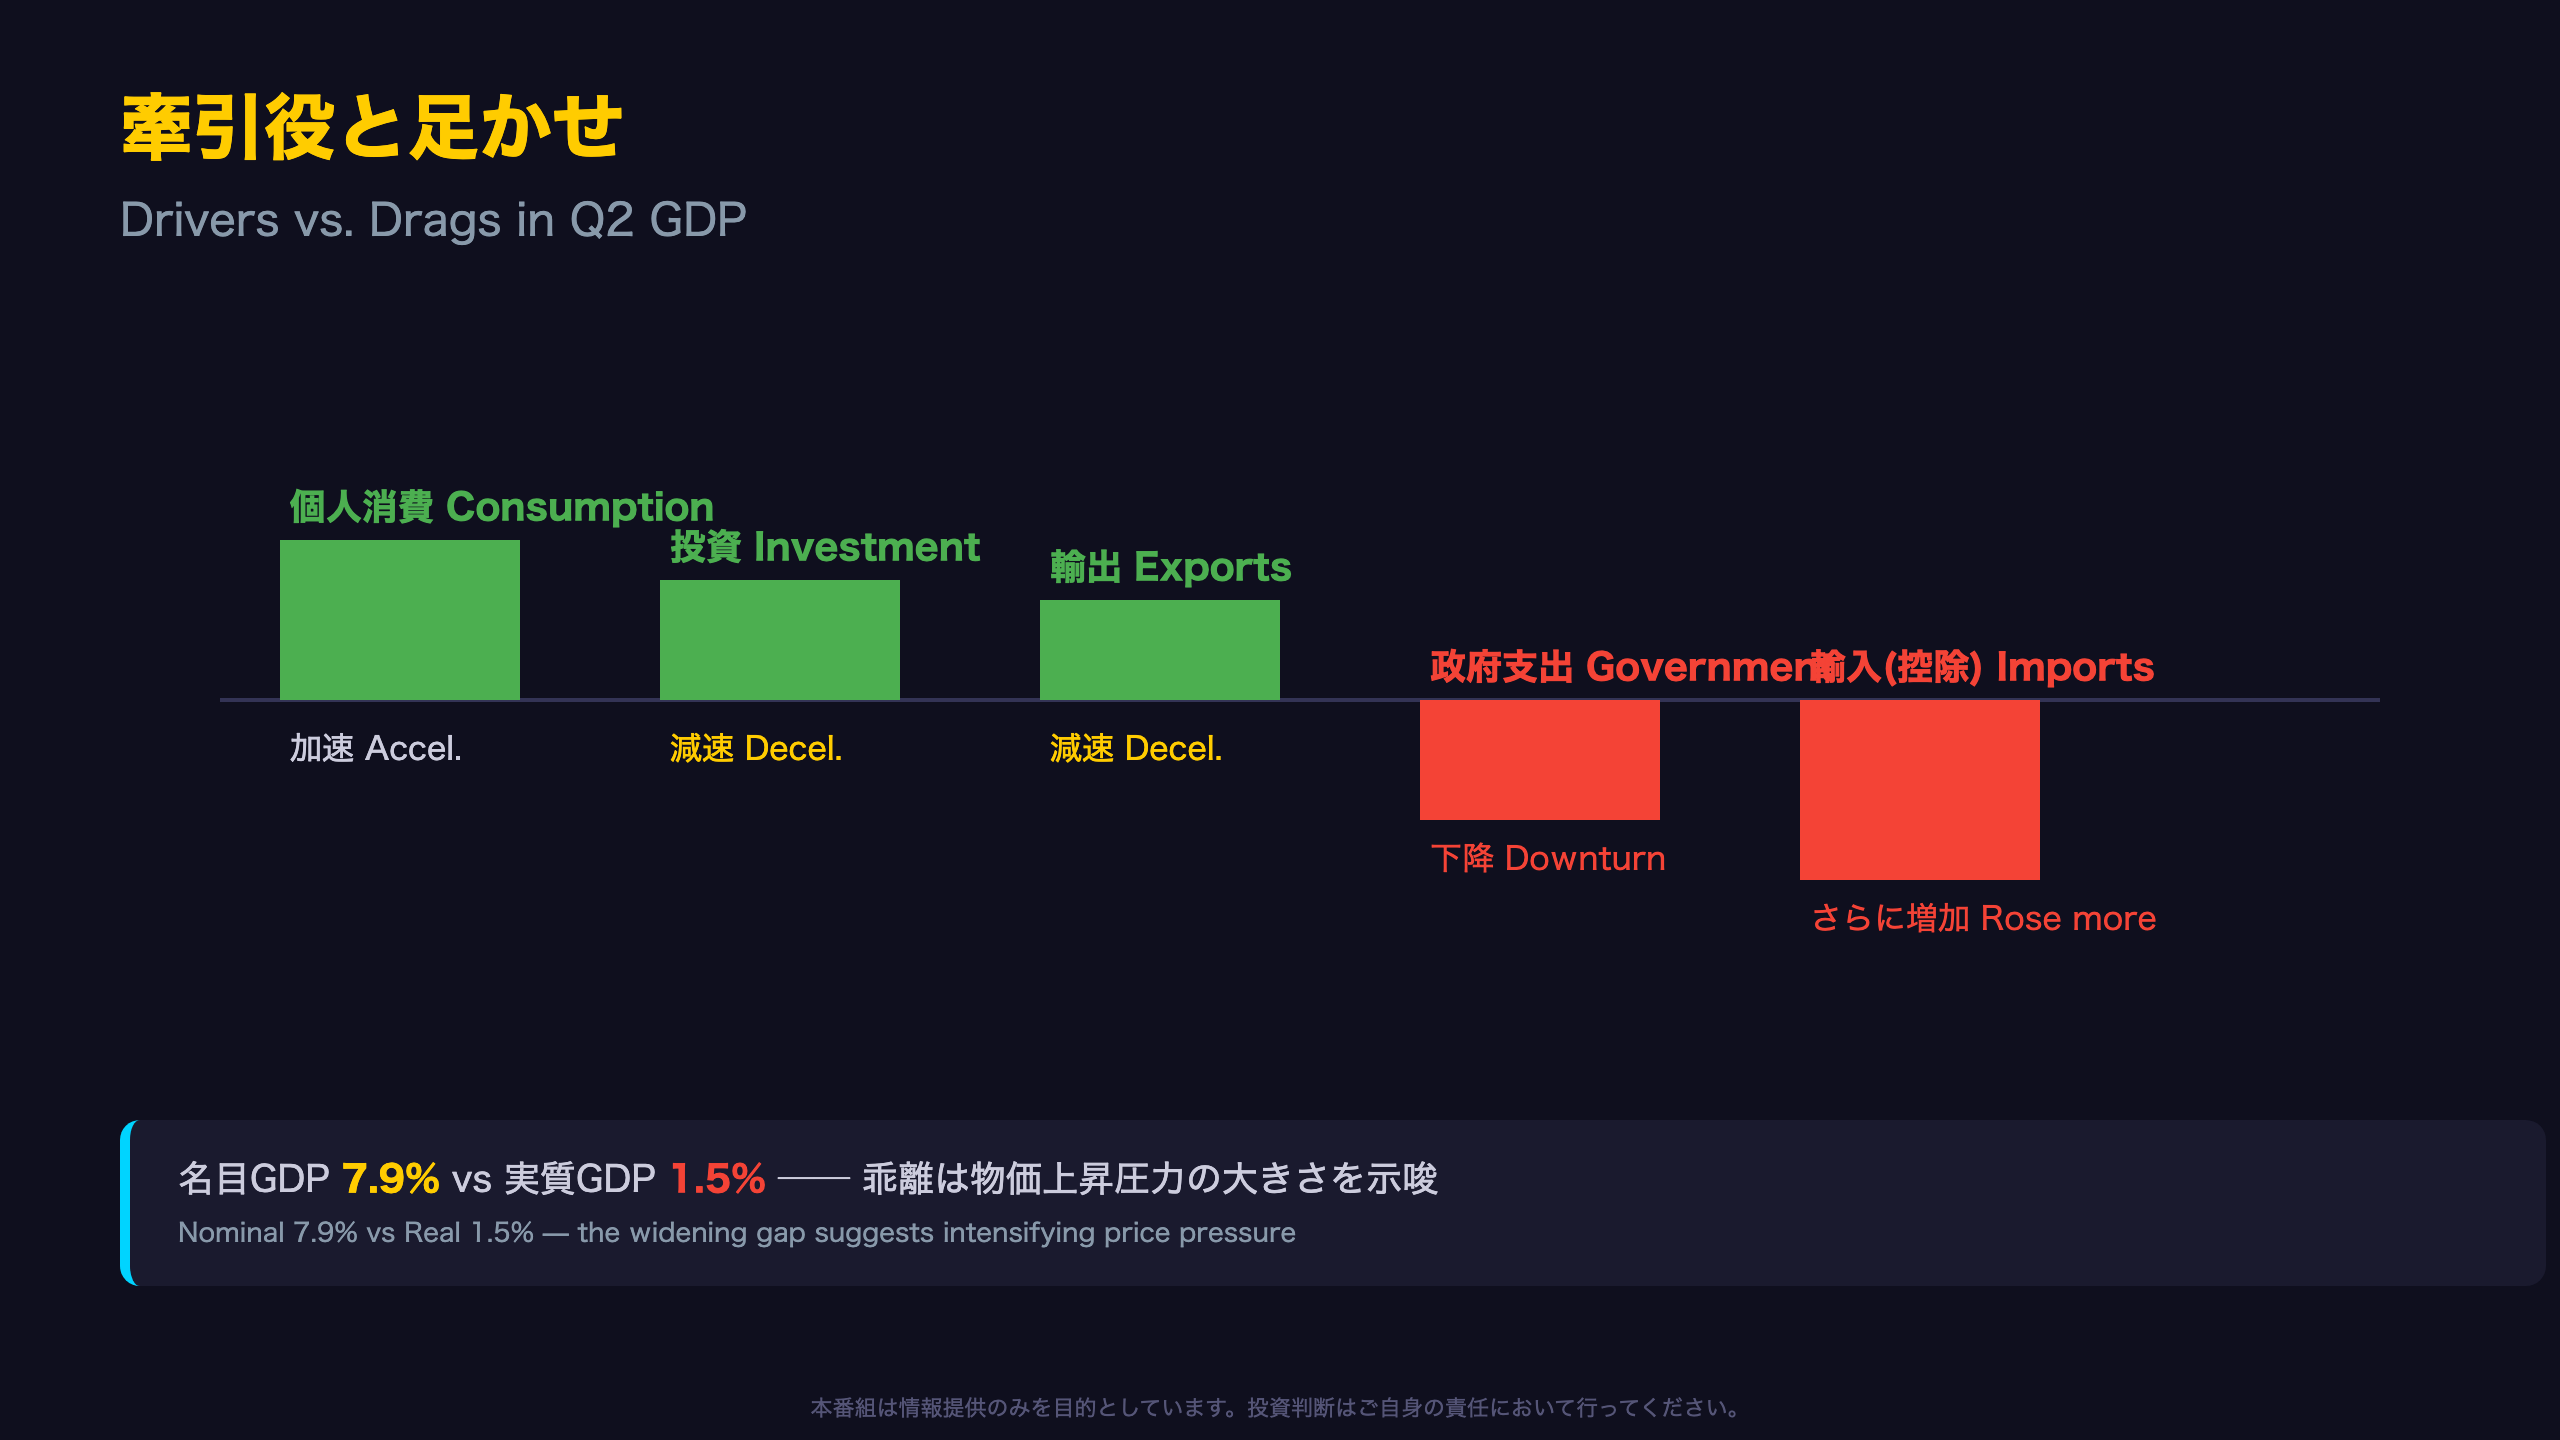
Unlike the Q1 report, the Q2 advance estimate does not disclose precise percentage-point contributions from each GDP component — this level of detail typically arrives with the second estimate (due August 26, 2026). What we can say qualitatively, based on BEA’s text:
| Driver | Q1 → Q2 Change |
|---|---|
| Consumer spending | Accelerated |
| Investment | Decelerated |
| Exports | Decelerated |
| Government spending | Turned into a downturn (was a positive contributor in Q1) |
| Imports (subtraction) | Increased further |
“Compared to the first quarter, the deceleration in real GDP in the second quarter reflected a downturn in government spending and decelerations in investment and exports that were partly offset by an acceleration in consumer spending.”
The Nominal-Real Gap Widens
The gap between nominal GDP (7.9%) and real GDP (1.5%) — about 6.4 percentage points — is notably wider than Q1’s gap of 3.7 points (5.8% vs. 2.1%). This widening gap is a rough proxy for accelerating price pressure within the economy, distinct from the Fed’s preferred PCE inflation gauge but directionally consistent with it.
What’s Next
Watch for the August 26 second estimate, which will quantify exactly how large the government spending drag and export slowdown were in percentage-point terms — information investors will need to properly assess the durability of this quarter’s private-sector strength.
ノイズを除いた“本当の実力”——国内最終需要3.9%の意味
Why “Real Final Sales to Private Domestic Purchasers” Matters
Headline GDP includes inventory investment and net exports — two notoriously volatile components that can distort the true underlying trend in any single quarter. The BEA’s Real Final Sales to Private Domestic Purchasers metric strips these out, isolating the “stickier” demand from households and businesses. U.S. macro analysts often treat this as a cleaner read on domestic economic momentum than headline GDP itself.
What Drove the Consumption Gain (per BEA)
- Goods: other nondurable goods (mainly prescription drugs), motor vehicles (led by new light trucks), furnishings and durable household equipment (led by furniture)
- Services: food services and accommodations, financial services and insurance (led by portfolio management)
- Nonprofit institutions’ spending, driven by professional advocacy output
“The increase in consumer spending reflected increases in both goods and services.”
Historical Context
Q1’s 1.7% figure itself was revised down by 0.7 percentage points from the prior (second) estimate of 2.4%. That earlier read suggested softening private demand — but the jump to 3.9% in Q2 suggests that softness may have been temporary rather than the start of a structural slowdown.
Caveat: this is a single-quarter acceleration in an advance estimate. U.S. investors comparing this to, say, U.S. retail sales or ISM services data should note this figure itself remains subject to revision on August 26.
設備投資の中身——在庫調整とハイテク輸入の綱引き

Decoding the Quality of Business Investment
Breaking down the BEA’s investment narrative reveals a nuanced picture:
What rose:
– Equipment: “widespread” gains led by industrial equipment, transportation equipment, and information processing equipment
– Intellectual property products: software (mainly prepackaged software) and R&D
What fell:
– Private inventory investment: largest drag from wholesale trade
– Nonresidential structures: led down by manufacturing construction
“The increase in investment primarily reflected increases in equipment and intellectual property products that were partly offset by decreases in private inventory investment and nonresidential structures.”
The Hidden Investment Signal in Rising Imports
One of the more intriguing details: the rise in imports was led by capital goods (excluding automotive) — specifically telecommunications equipment, semiconductors, and industrial equipment. These are precisely the categories tied to business capital spending. Because imports are a subtraction in GDP accounting, this means some of the genuine investment strength in the U.S. economy may be arithmetically masked as a drag on headline GDP — a classic quirk familiar to anyone tracking the AI/semiconductor capex cycle.
Two Ways to Read It
- Bullish: Rising imports of tech capital goods could reflect an ongoing AI/semiconductor-driven capex cycle among U.S. businesses.
- Cautious: The inventory drawdown, especially in wholesale trade, could also reflect businesses becoming more cautious about near-term demand — a read that cannot be ruled out from this single data point (Level C inference).
総合は上振れ、コアは鈍化——割れるインフレシグナル
Three Price Gauges, Three Different Signals
The GDP report includes three separate price measures, and this quarter they diverged sharply:
| Index | Q1 | Q2 | Change |
|---|---|---|---|
| Gross Domestic Purchases Price Index | 3.6% | 5.7% | +2.1pt |
| PCE Price Index (headline) | 4.6% | 5.1% | +0.5pt |
| PCE Price Index (core, ex food & energy) | 4.4% | 3.4% | −1.0pt |
“The price index for gross domestic purchases increased 5.7 percent in the second quarter, compared with an increase of 3.6 percent in the first quarter.”
Context for International Readers
The PCE price index is the Federal Reserve’s preferred inflation gauge — distinct from the more widely known headline CPI reported by the Bureau of Labor Statistics. The Fed’s 2% target is set in PCE terms, not CPI terms, which is why this GDP release (rather than the monthly CPI report) carries extra weight for rate-decision watchers globally.
Why Did Core Diverge From Headline?
The report does not break down which specific categories (food or energy) drove the wedge between headline and core measures — that detail is simply not disclosed in this release. What we can infer (Level C reasoning) is that food and/or energy prices were likely the primary driver of the widening gap, since by definition that is the only difference between the two measures.
A Statistical Caveat
This is an advance estimate. In the prior quarter’s report, BEA noted technical adjustments were made to legal services prices for January and March but not February — a reminder that PCE price sub-components sometimes undergo judgmental adjustments. Similar technical noise could be present in Q2’s figures ahead of the August 26 second estimate.
Market Implication
A cooling core PCE is generally viewed as supportive of eventual Fed easing, but this single quarter’s data — with the headline and “purchases” price gauges simultaneously accelerating — does not allow a clean directional call on Fed policy.
政府支出減の正体と、速報値が持つ“振れ幅”のリスク
The Government Spending “Decline” May Be Less Dramatic Than It Looks
The BEA offers an unusually clear technical explanation for the drop in government spending:
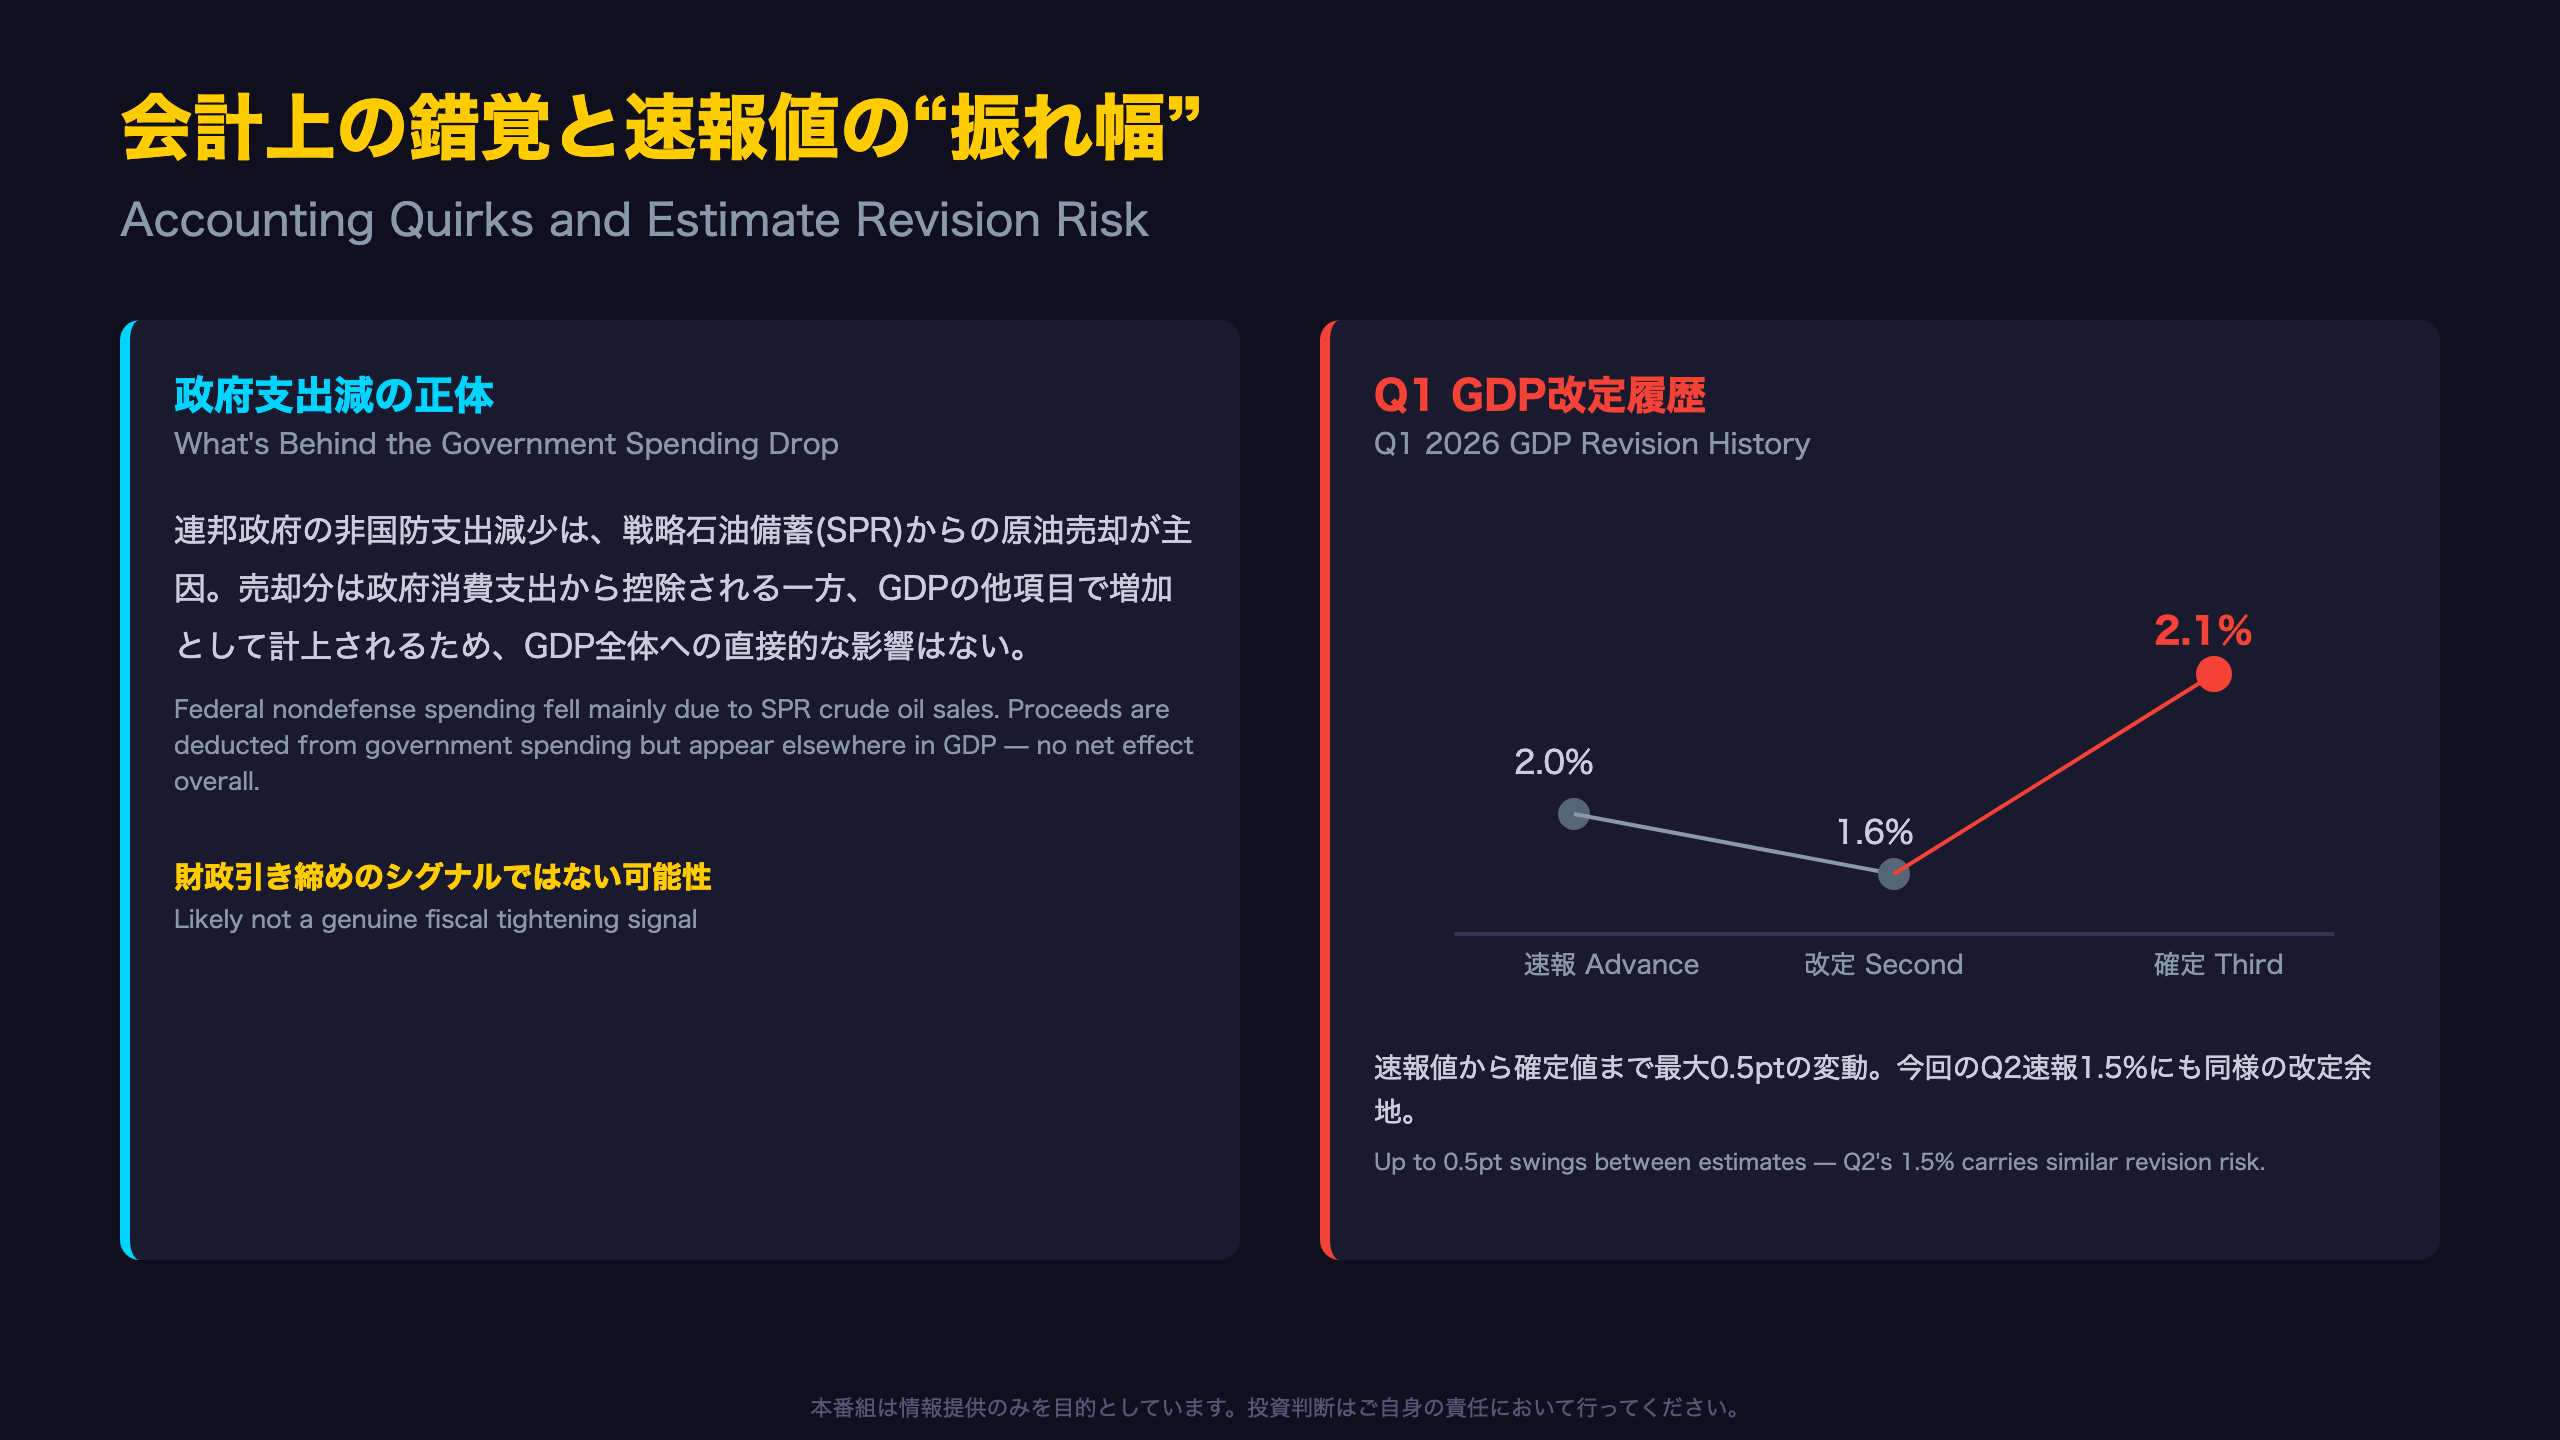
“The pattern of nondefense spending primarily reflected sales of crude oil from the Strategic Petroleum Reserve, based on data from the Department of Energy… Because the oil sold by the government is reflected as an increase in other components of GDP, there is no direct effect on GDP.”
In other words, the nominal decline in government spending largely reflects an accounting reclassification tied to SPR (Strategic Petroleum Reserve) oil sales, not necessarily a genuine fiscal tightening (Level B inference, supported by BEA’s own explicit statement).
What Revision History Tells Us About Estimate Uncertainty
Looking at how Q1 2026 GDP evolved across BEA’s three standard release stages illustrates just how much advance estimates can move:
| Release | Growth Rate |
|---|---|
| Advance estimate (April) | 2.0% |
| Second estimate (May) | 1.6% |
| Third/final estimate (June) | 2.1% |
That’s a swing of up to 0.5 percentage points between the second and third estimates alone — driven primarily, per BEA, by a downward revision to imports (which mechanically boosts GDP since imports are a subtraction).
Implication for Today’s 1.5% Print
Given this precedent, investors should treat today’s Q2 advance estimate of 1.5% as a starting point, not a final answer. The August 26 second estimate and the subsequent third estimate could move this figure meaningfully in either direction — a critical caveat for anyone using this data point to time trades around Fed policy expectations. Unlike, say, the UK’s ONS GDP releases (which undergo fewer revision rounds), the U.S. GDP process is explicitly multi-staged, and each stage can materially shift the narrative.
FRBに突きつけられる二律背反——次の一手への示唆

Reading the Market Implications Through Chains of Evidence
Chain 1: Accelerating Domestic Demand → Equity Market Support
Real final sales to private domestic purchasers accelerated from 1.7% to 3.9% (fact from the report) → this suggests “sticky” private consumption and business investment demand is expanding (economic mechanism) → this could act as a supportive factor for corporate earnings and equity markets (market implication).
Chain 2: Surging Price Index → Bond Market Caution
The gross domestic purchases price index accelerated from 3.6% to 5.7% (fact) → it is generally believed that intensifying price pressure raises expectations for prolonged central bank tightening, though this single dataset cannot confirm that direction, since core PCE simultaneously cooled from 4.4% to 3.4% — meaning the Fed’s actual weighting of these signals cannot be determined from this report alone (uncertain market implication).
Chain 3: Headline Deceleration → Premature to Call a Slowdown
Real GDP decelerated from 2.1% to 1.5% (fact) → this deceleration was primarily driven by an accounting-related factor in government spending (SPR oil sales) and rising imports, not by a direct weakening in private demand itself (mechanism, per BEA’s own explanation) → pricing in aggressive recession risk based on this headline figure alone appears premature (Level B inference).
What to Watch Next
The August 26 second estimate (which will also include corporate profits data) and the unified annual update beginning September 30, 2026, will be the next tests of this narrative. Key questions: will investment and consumption figures be revised down, and is the government spending drag temporary (as BEA suggests) or does it persist into subsequent quarters?
This analysis is based solely on data published by the U.S. Bureau of Economic Analysis and does not constitute a forecast of future policy decisions or market prices.
Disclaimer: This article is for informational purposes only. All investment decisions are made solely at your own risk.