📺 Watch the Full Video Analysis
This article was automatically generated by the NFC Market Live AI analysis system. (Updated: 2026-07-31 23:12 JST)
📄 Primary Source
University of Michigan
http://www.sca.isr.umich.edu/
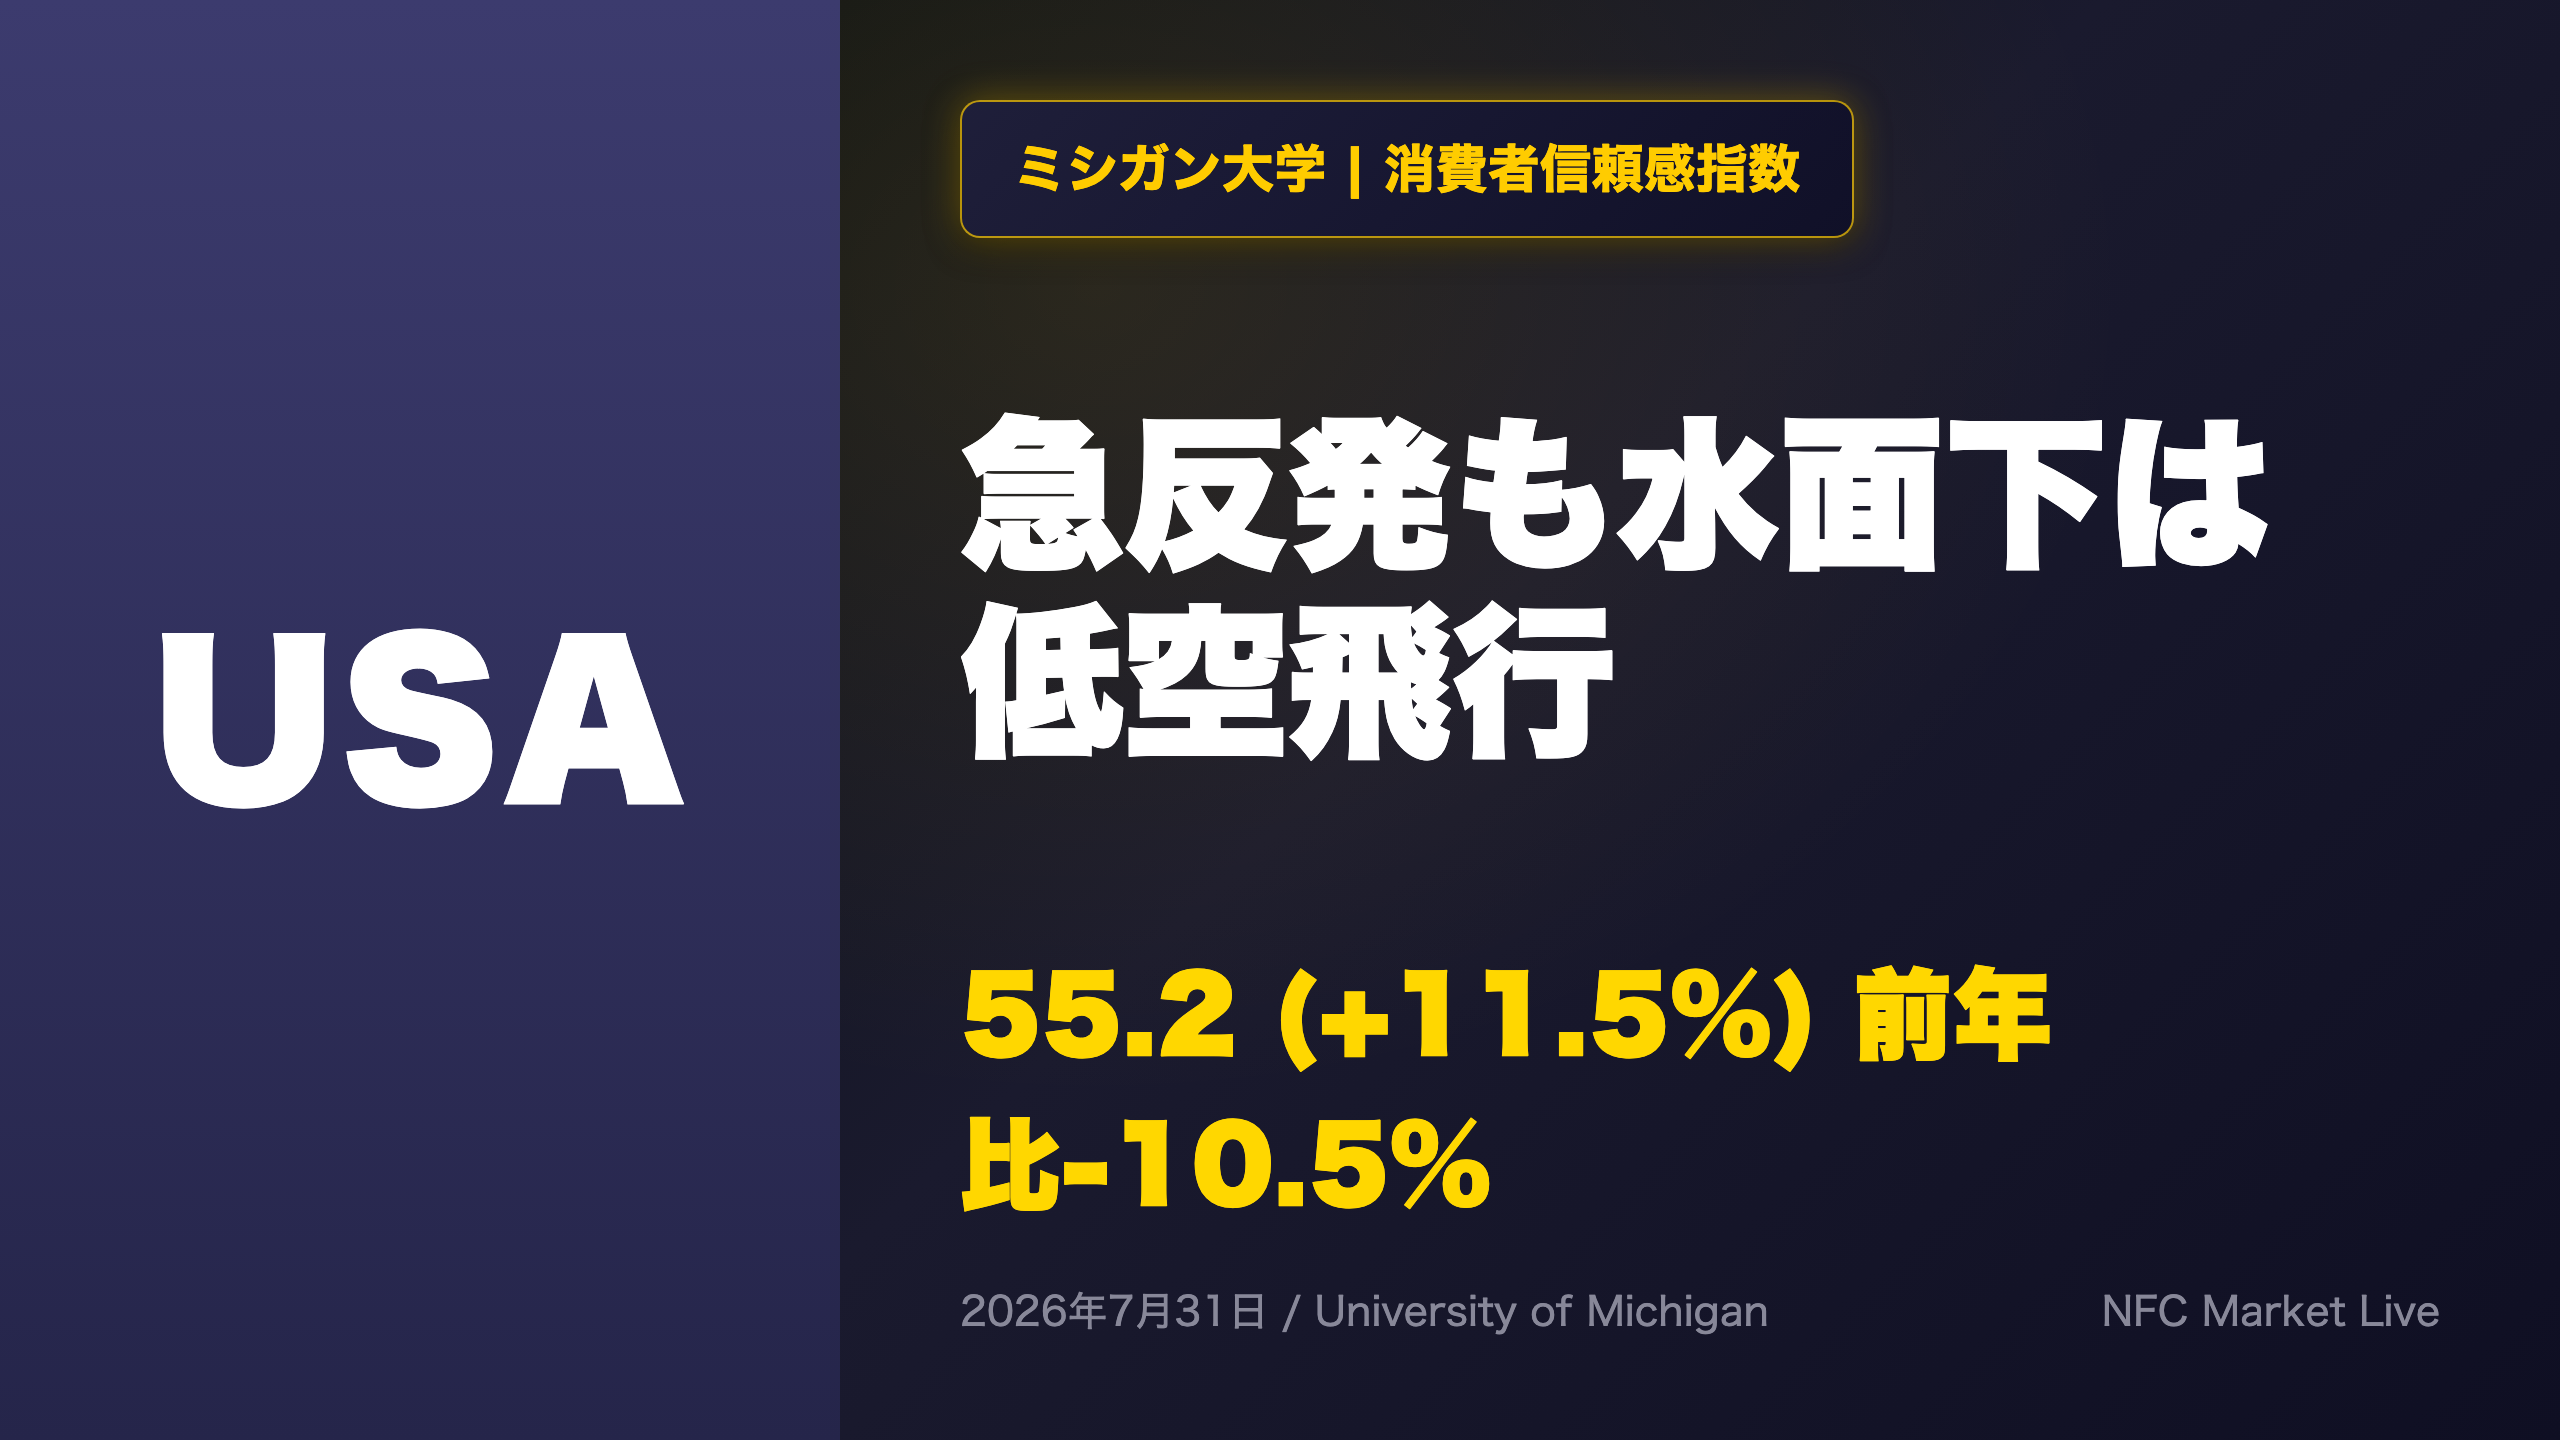
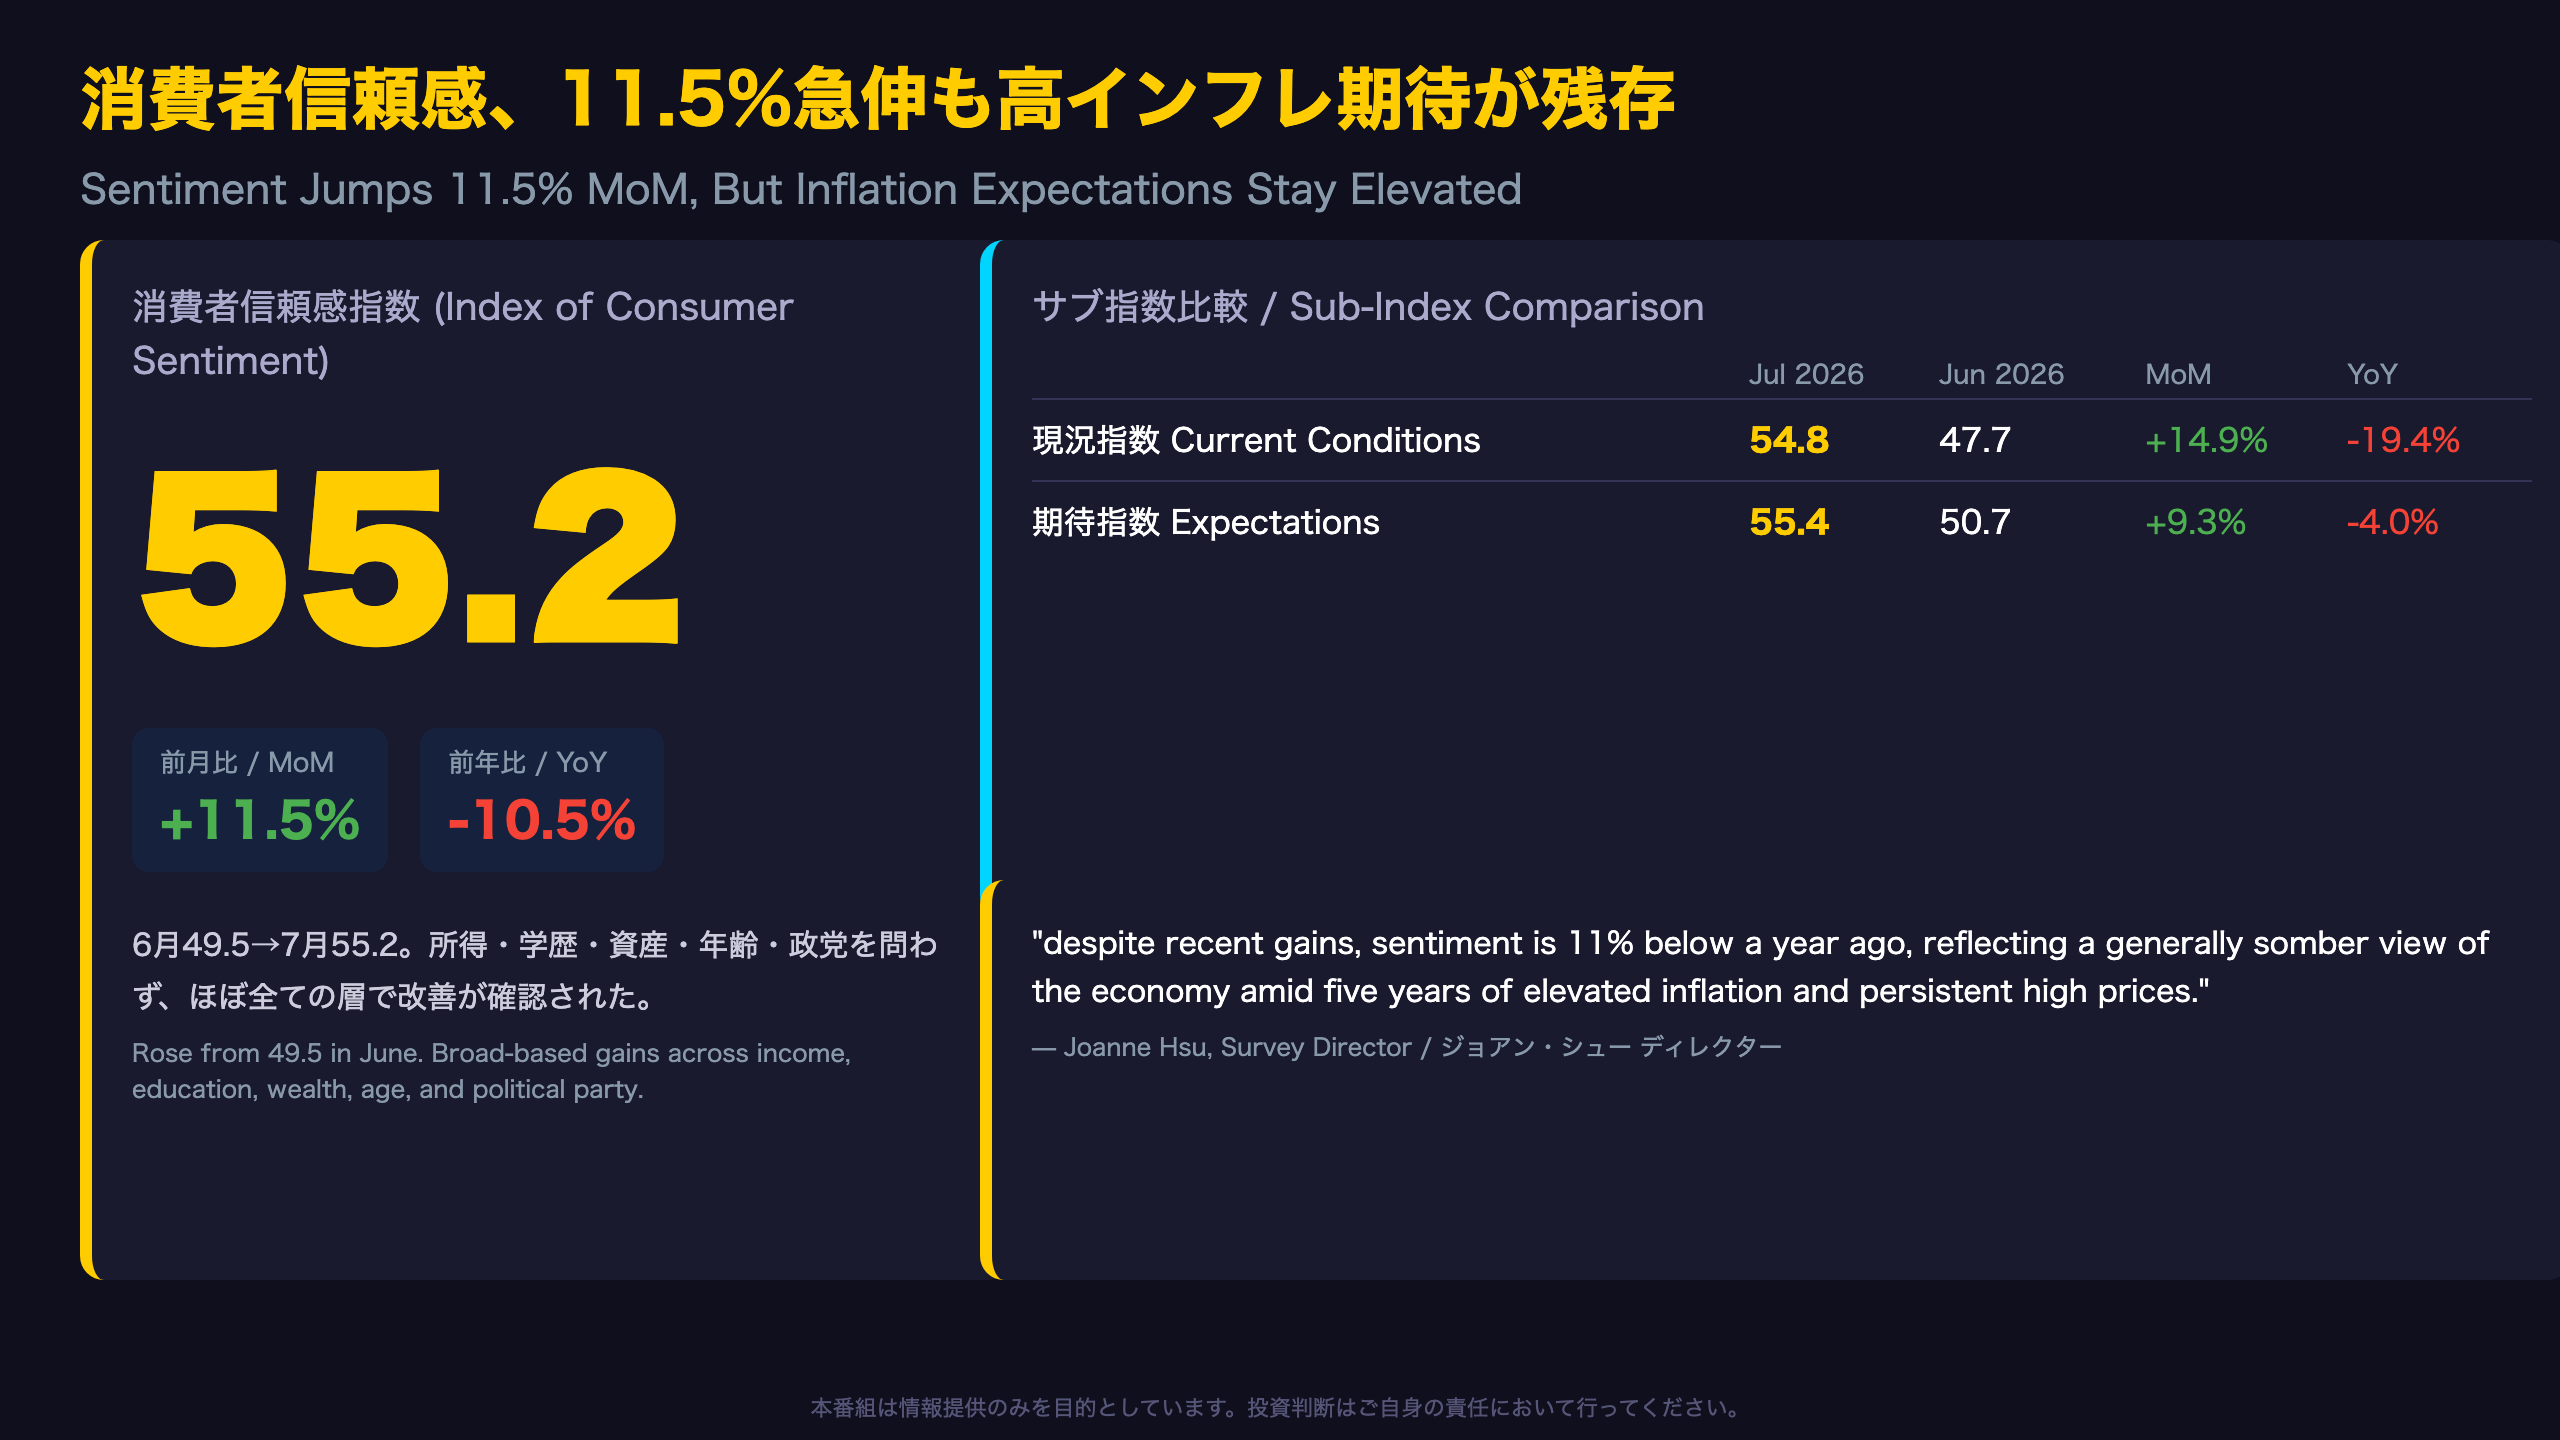
📊 The University of Michigan’s final Consumer Sentiment Index for July 2026 came in at 55.2, up 11.5% from June.
Improvements were broad-based across income, education, age, and political affiliation.
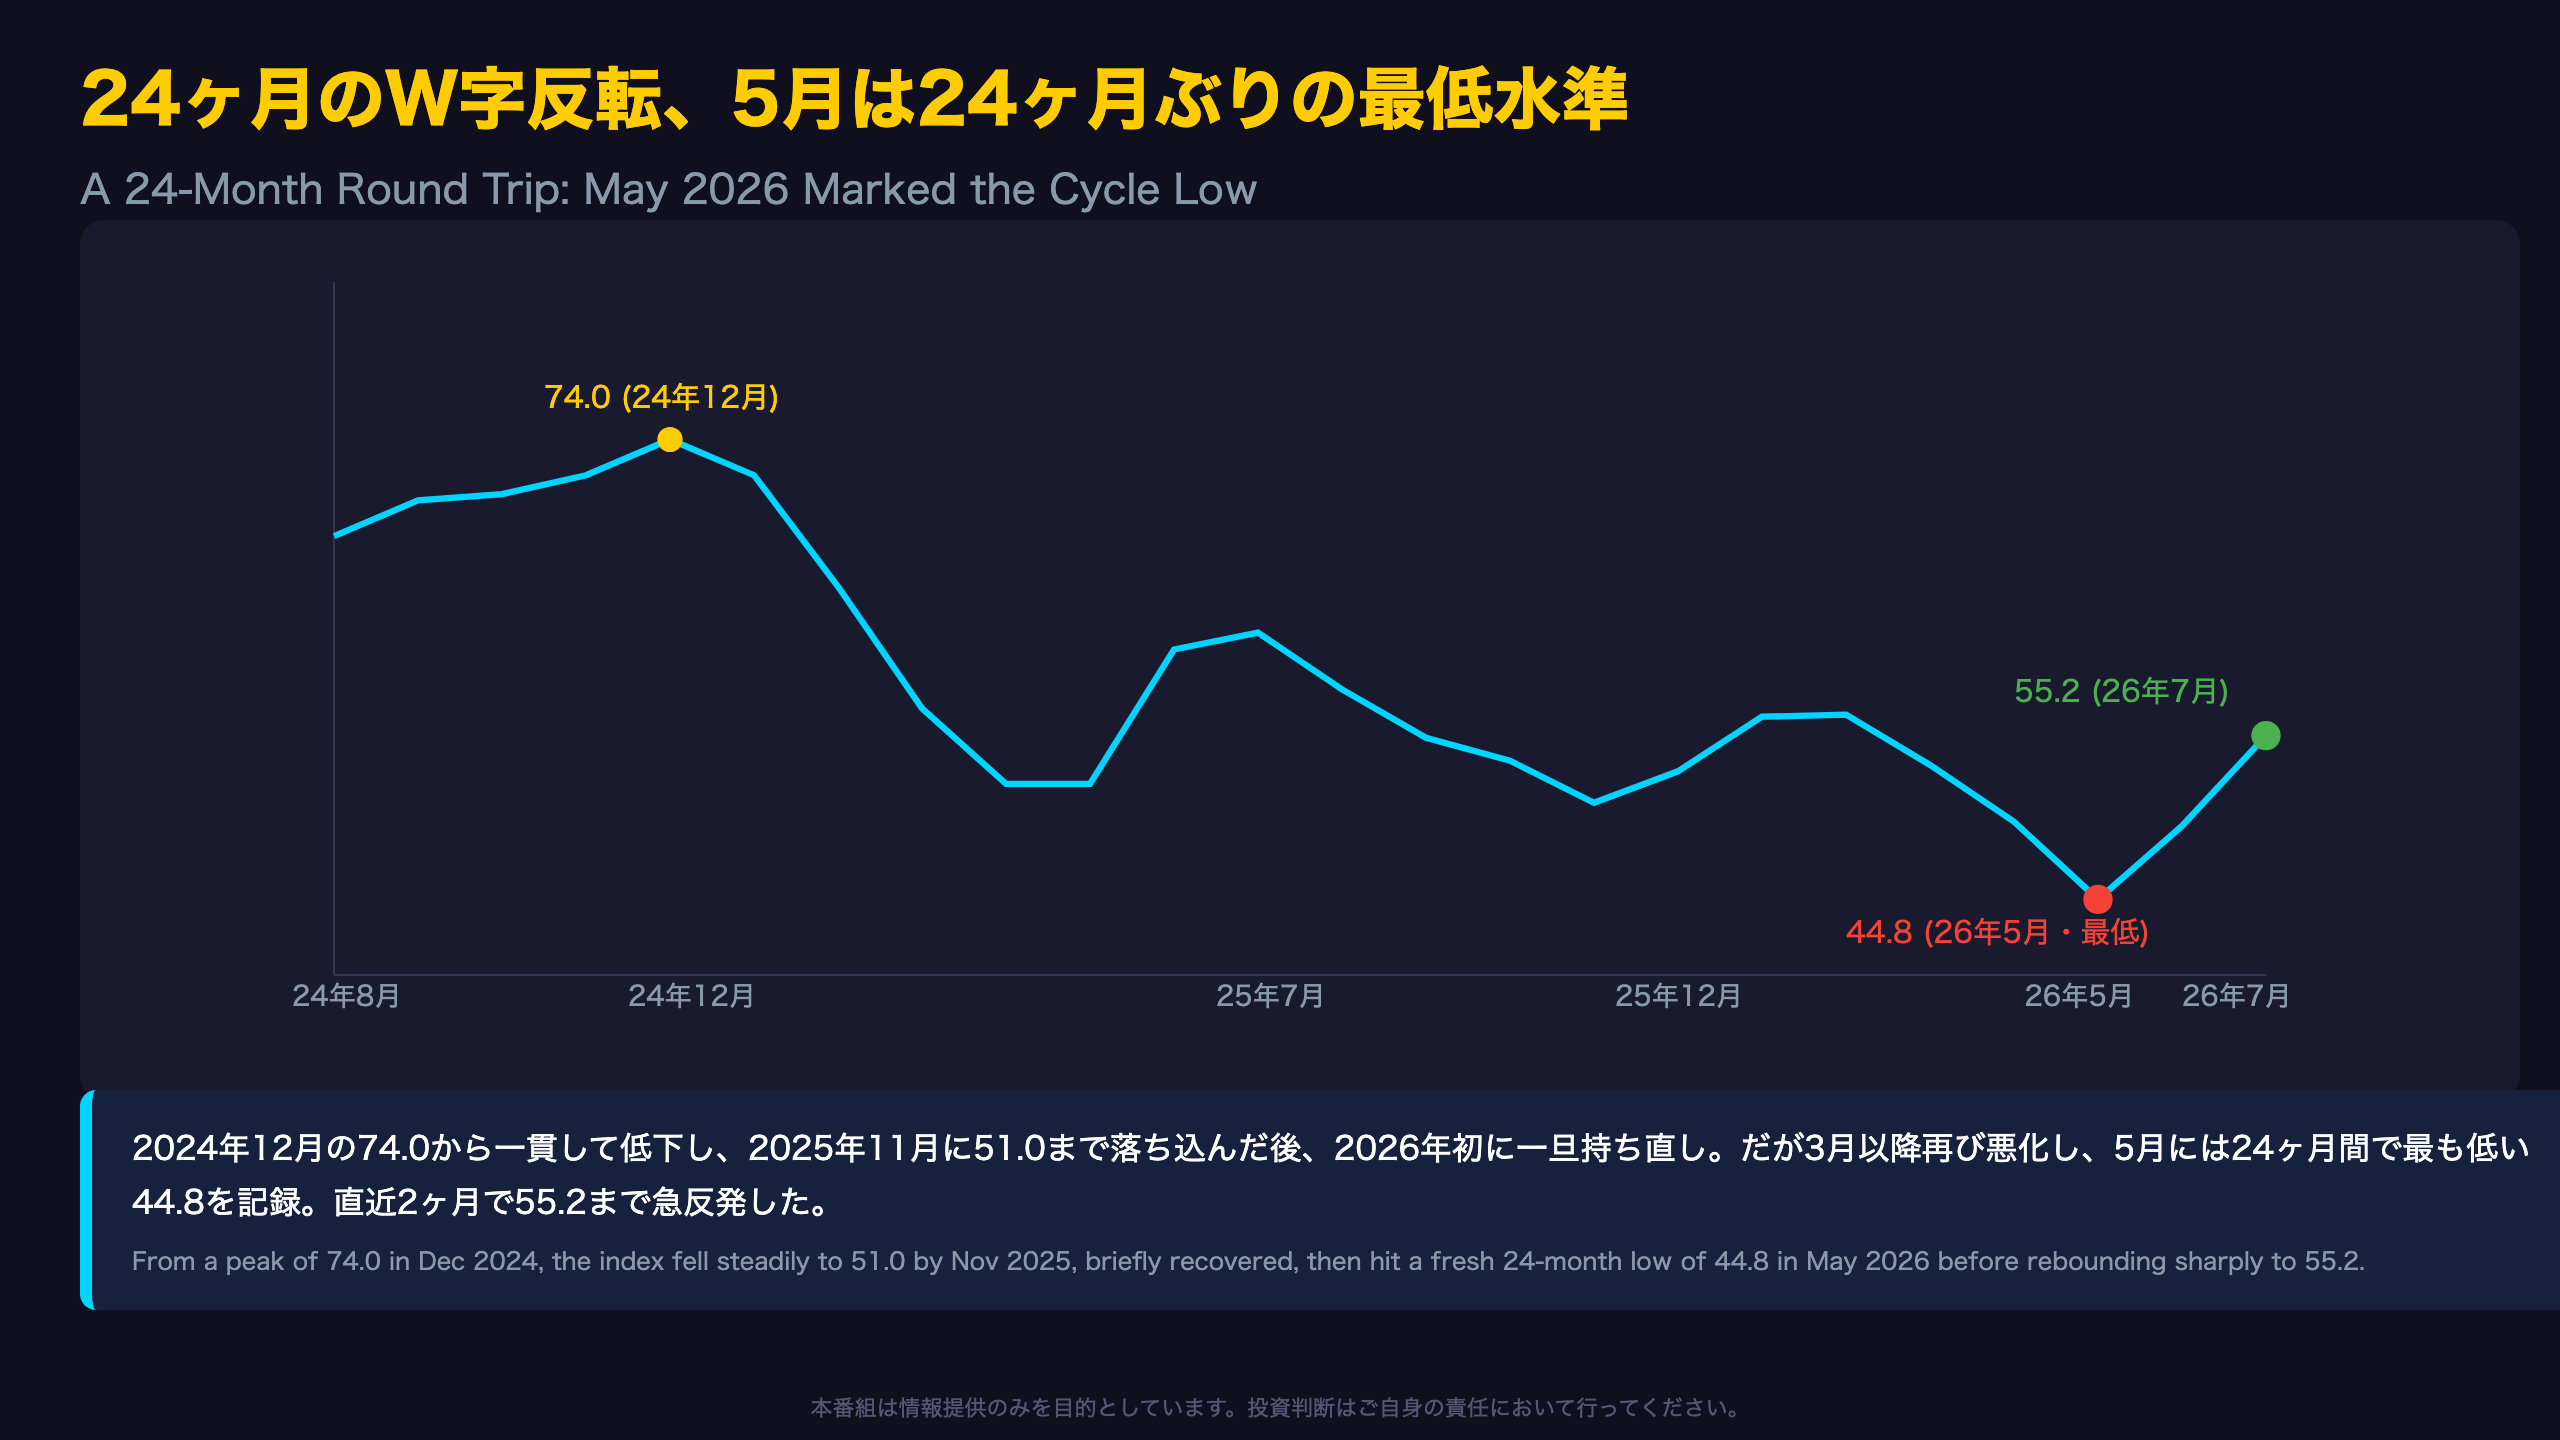
📉 Yet the index remains down 10.5% year-over-year, still far below the 67.9-74.0 range seen in late 2024.
💡 Year-ahead inflation expectations eased to 4.2%, but remain above February’s pre-conflict 3.4%.
⚠️ We break down the two-sided story behind this month’s data in this Deep Dive.
消費者信頼感、11.5%急伸も高インフレ期待が残存
What is the University of Michigan Survey of Consumers?
Unlike the Conference Board’s Consumer Confidence Index, the Michigan survey is a rotating-panel survey run continuously since the 1940s, closely watched by the Fed because it directly asks households about their year-ahead and five-year inflation expectations — a key input for policymakers gauging whether inflation expectations remain \”anchored.\”
Headline Numbers
| Metric | Jul 2026 | Jun 2026 | Jul 2025 | MoM | YoY |
|---|---|---|---|---|---|
| Sentiment | 55.2 | 49.5 | 61.7 | +11.5% | -10.5% |
| Current Conditions | 54.8 | 47.7 | 68.0 | +14.9% | -19.4% |
| Expectations | 55.4 | 50.7 | 57.7 | +9.3% | -4.0% |
Director Joanne Hsu noted the final reading \”confirmed its early-month reading, landing almost 12% above June,\” with improvements broad-based across income, education, wealth, age, and political affiliation.
Market Read
For U.S. rate markets, a sharp rebound alongside still-elevated inflation expectations creates a mixed signal — supportive of near-term consumption, but not clearly disinflationary. The next release (preliminary August data) arrives August 14, 2026.
24ヶ月のW字反転、5月は24ヶ月ぶりの最低水準
A Second Look: The \”Double Dip\” Pattern
Beyond the headline rebound, Director Joanne Hsu flagged an under-discussed sub-metric: \”Five-year expected business conditions reached a 12-month high, though it remains well under its historical average.\” This distinct sub-index tracks longer-run business condition views, separate from the headline sentiment gauge, and shows a similar pattern of partial improvement without full normalization.
Two Similar-Shaped Dips
The 24-month series shows 2025’s mini-dip (Mar 57.0 → Apr 52.2 → May 52.2) before rebounding to 60.7 in June. 2026 repeated a similar three-month decline (Mar 53.3 → Apr 49.8 → May 44.8) but fell to a deeper trough before rebounding. This repeated shock-and-recovery pattern is a structural feature worth tracking, rather than a one-off event.
What Comes Next
The August 14, 2026 preliminary release will be the key test of whether this two-month rebound has staying power. Notably, a similar rebound in June 2025 (+8.5pt) did not hold, with sentiment resuming its decline the following month — a cautionary precedent against reading too much into a single month’s bounce.
現況と期待の非対称性、現況指数が-19.4%で主導
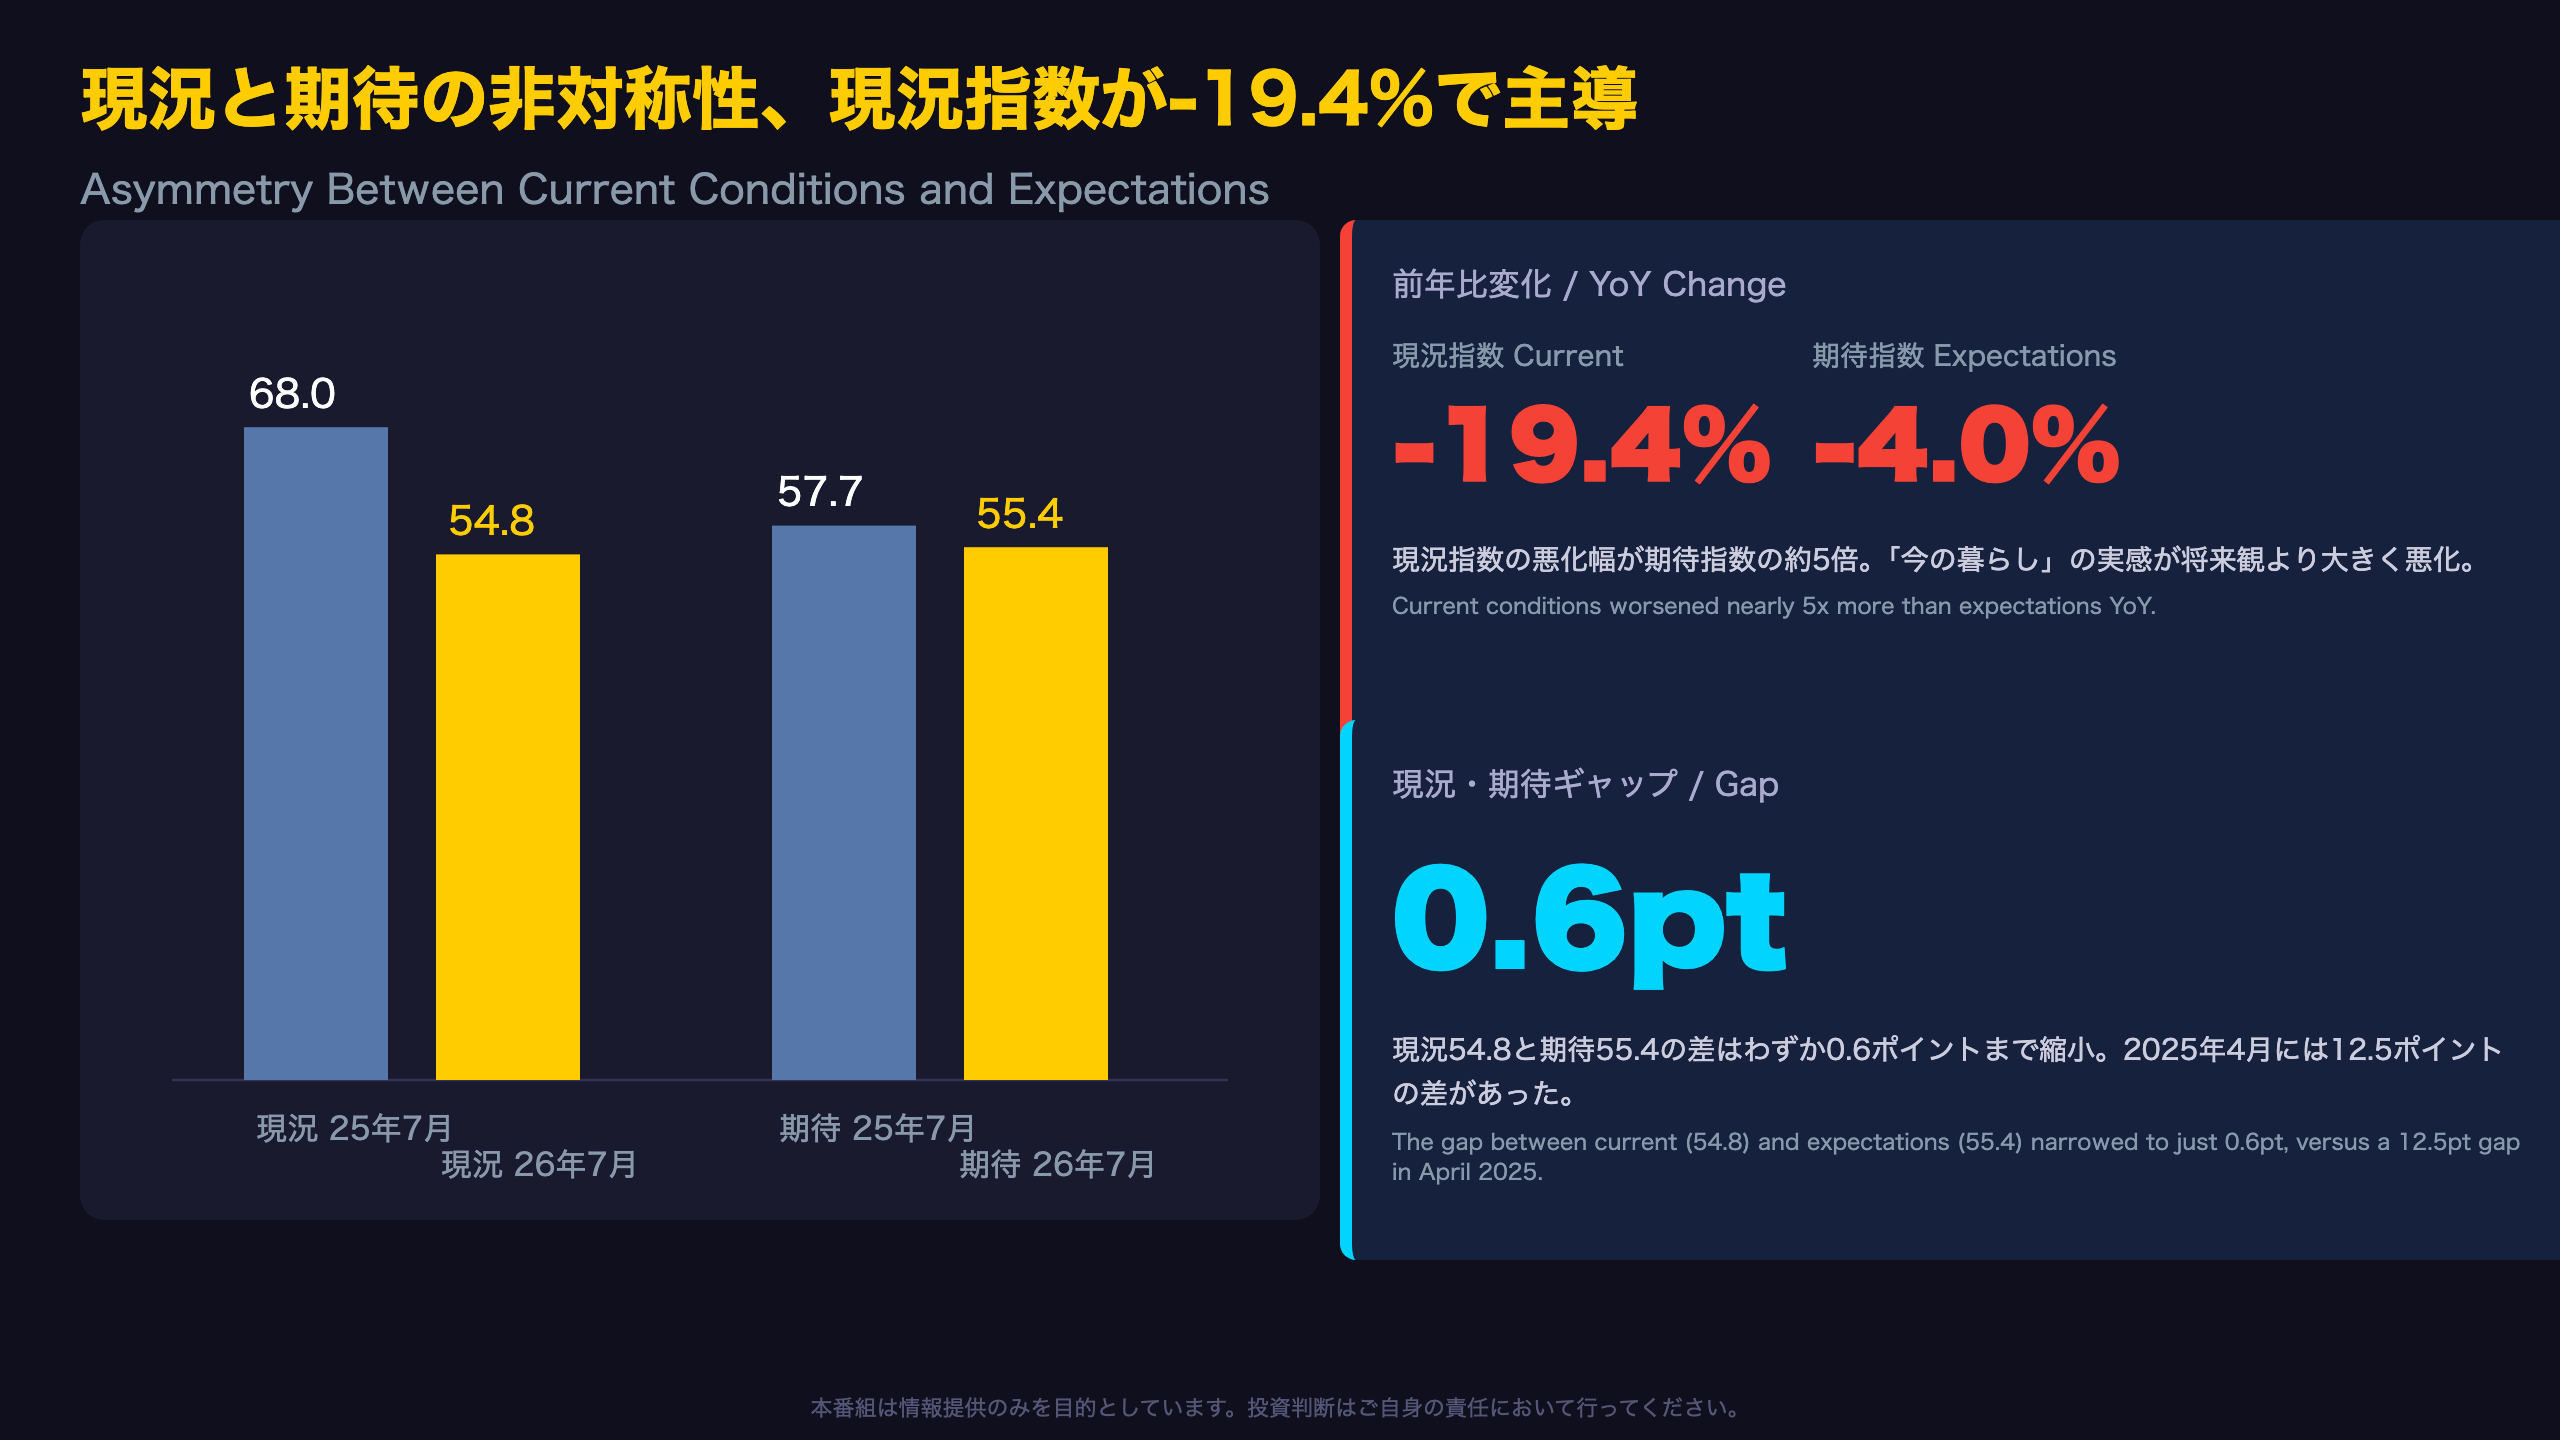
Tracking the Current-Expectations Gap Over Time
The spread between Current Conditions (ICC) and Expectations (ICE) has swung significantly over the past 24 months. In April 2025, ICC (59.8) exceeded ICE (47.3) by +12.5 points — a pattern often associated with elevated recession fear, as forward-looking sentiment deteriorated far more than the present assessment. That gap narrowed to just +0.1pt by November 2025, and now stands at -0.6pt in July 2026 (ICE slightly above ICC).
Gap History (Selected Months)
| Month | ICC | ICE | Gap |
|---|---|---|---|
| Dec 2024 | 75.1 | 73.3 | +1.8 |
| Apr 2025 | 59.8 | 47.3 | +12.5 |
| Nov 2025 | 51.1 | 51.0 | +0.1 |
| May 2026 | 45.8 | 44.1 | +1.7 |
| Jul 2026 | 54.8 | 55.4 | -0.6 |
Two Ways to Read a Narrow Gap
A small ICC-ICE gap can reflect either shared optimism or shared pessimism — the November 2025 convergence occurred near cycle lows, not during a recovery. This month’s convergence is different: both sub-indices are rising together, a comparatively healthier configuration, though it does not by itself confirm a durable recovery.
1年先インフレ期待、二度の急騰を経て4.2%に低下
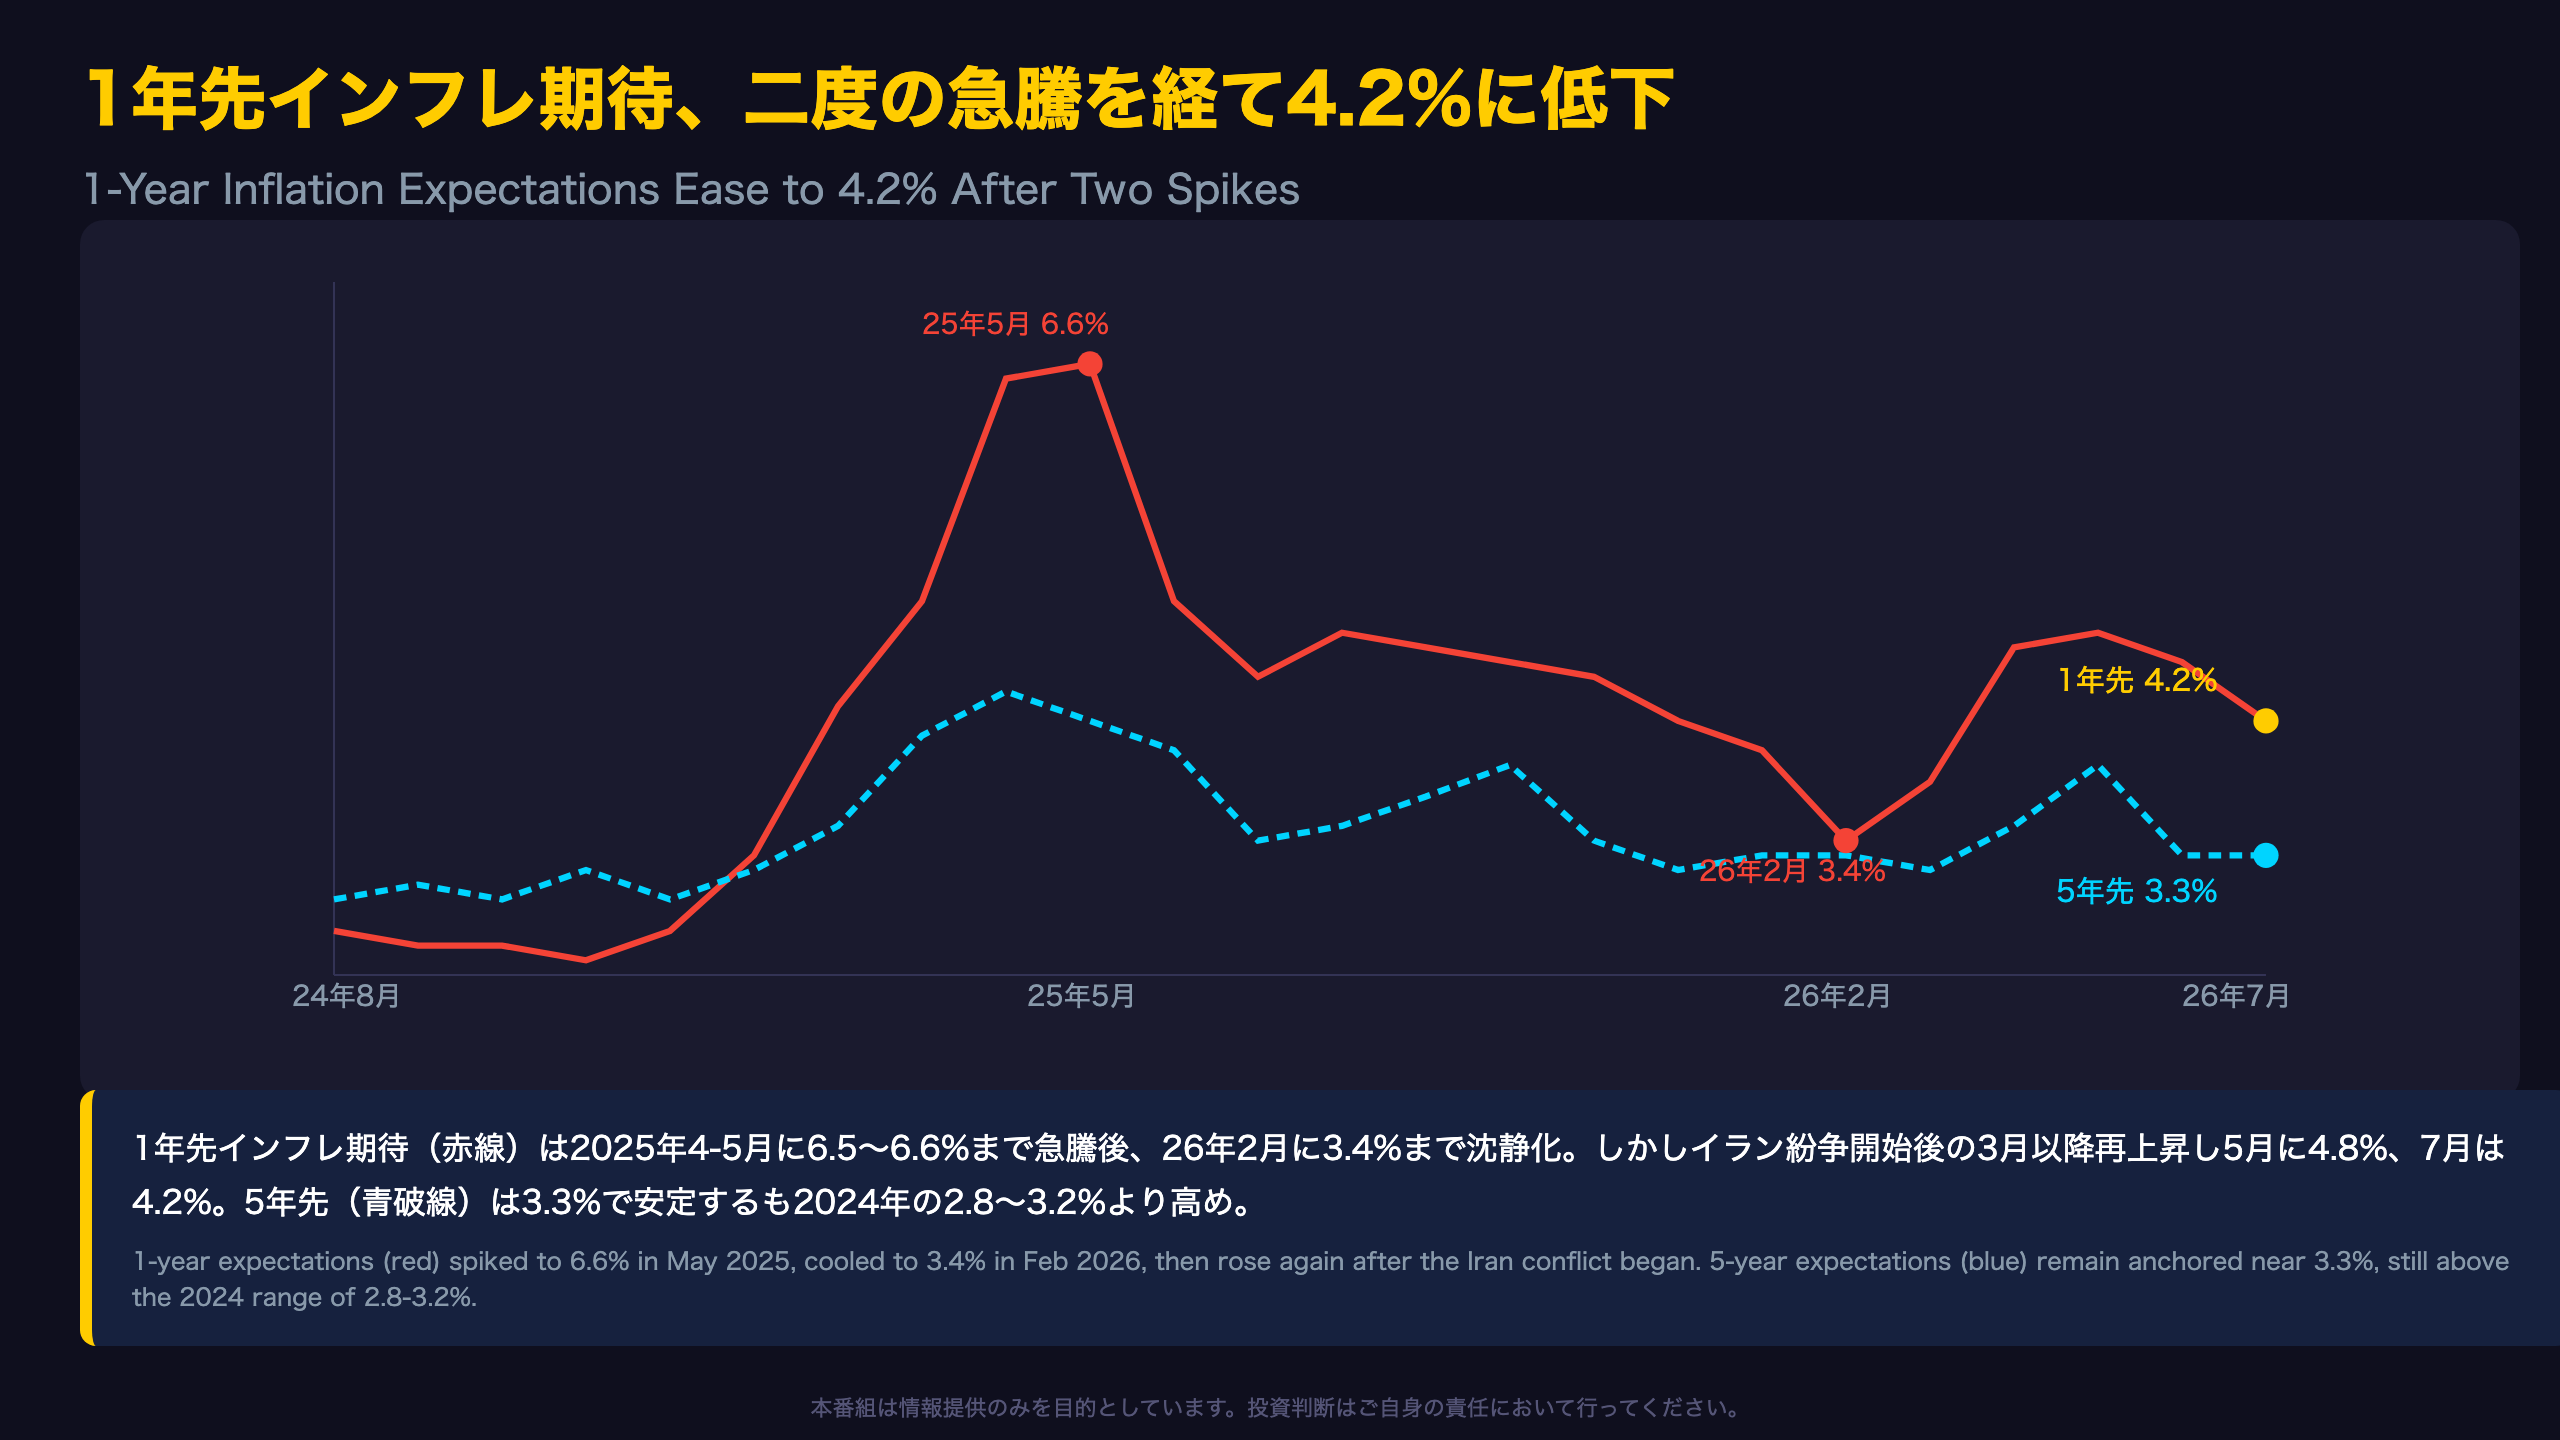
Why the 5-Year Number Matters More to the Fed
The Federal Reserve pays closer attention to the 5-year inflation expectation than the 1-year figure, because long-run expectations are considered the better gauge of whether the public’s inflation psychology remains \”anchored\” to the Fed’s 2% target. At 3.3%, the long-run reading is essentially unchanged from June and only modestly above the 2.8%-3.2% range seen throughout 2024 — a meaningfully smaller gap than the 4.2%-4.4% peaks seen in April-May 2025.
Two Distinct Spikes in Short-Run Expectations
The 1-year expectation has spiked twice in the past 24 months: once in April-May 2025 (rising from 5.0% to a peak of 6.6%), and again in March-May 2026 (from 3.8% to 4.8%). The report attributes the second spike’s context directly: \”The current reading substantially exceeds the 3.4% seen in February before the Iran conflict began, along with all 2024 readings.\” This is the report’s own framing, not an inferred causal claim.
Distance from the Fed’s Target
Both readings — 4.2% (1-year) and 3.3% (5-year) — remain above the Fed’s 2% inflation target. That said, a single household survey cannot on its own predict how the FOMC will weigh this against labor market and hard inflation data at upcoming meetings.
回復シグナルと高インフレ期待、FRBは両にらみ
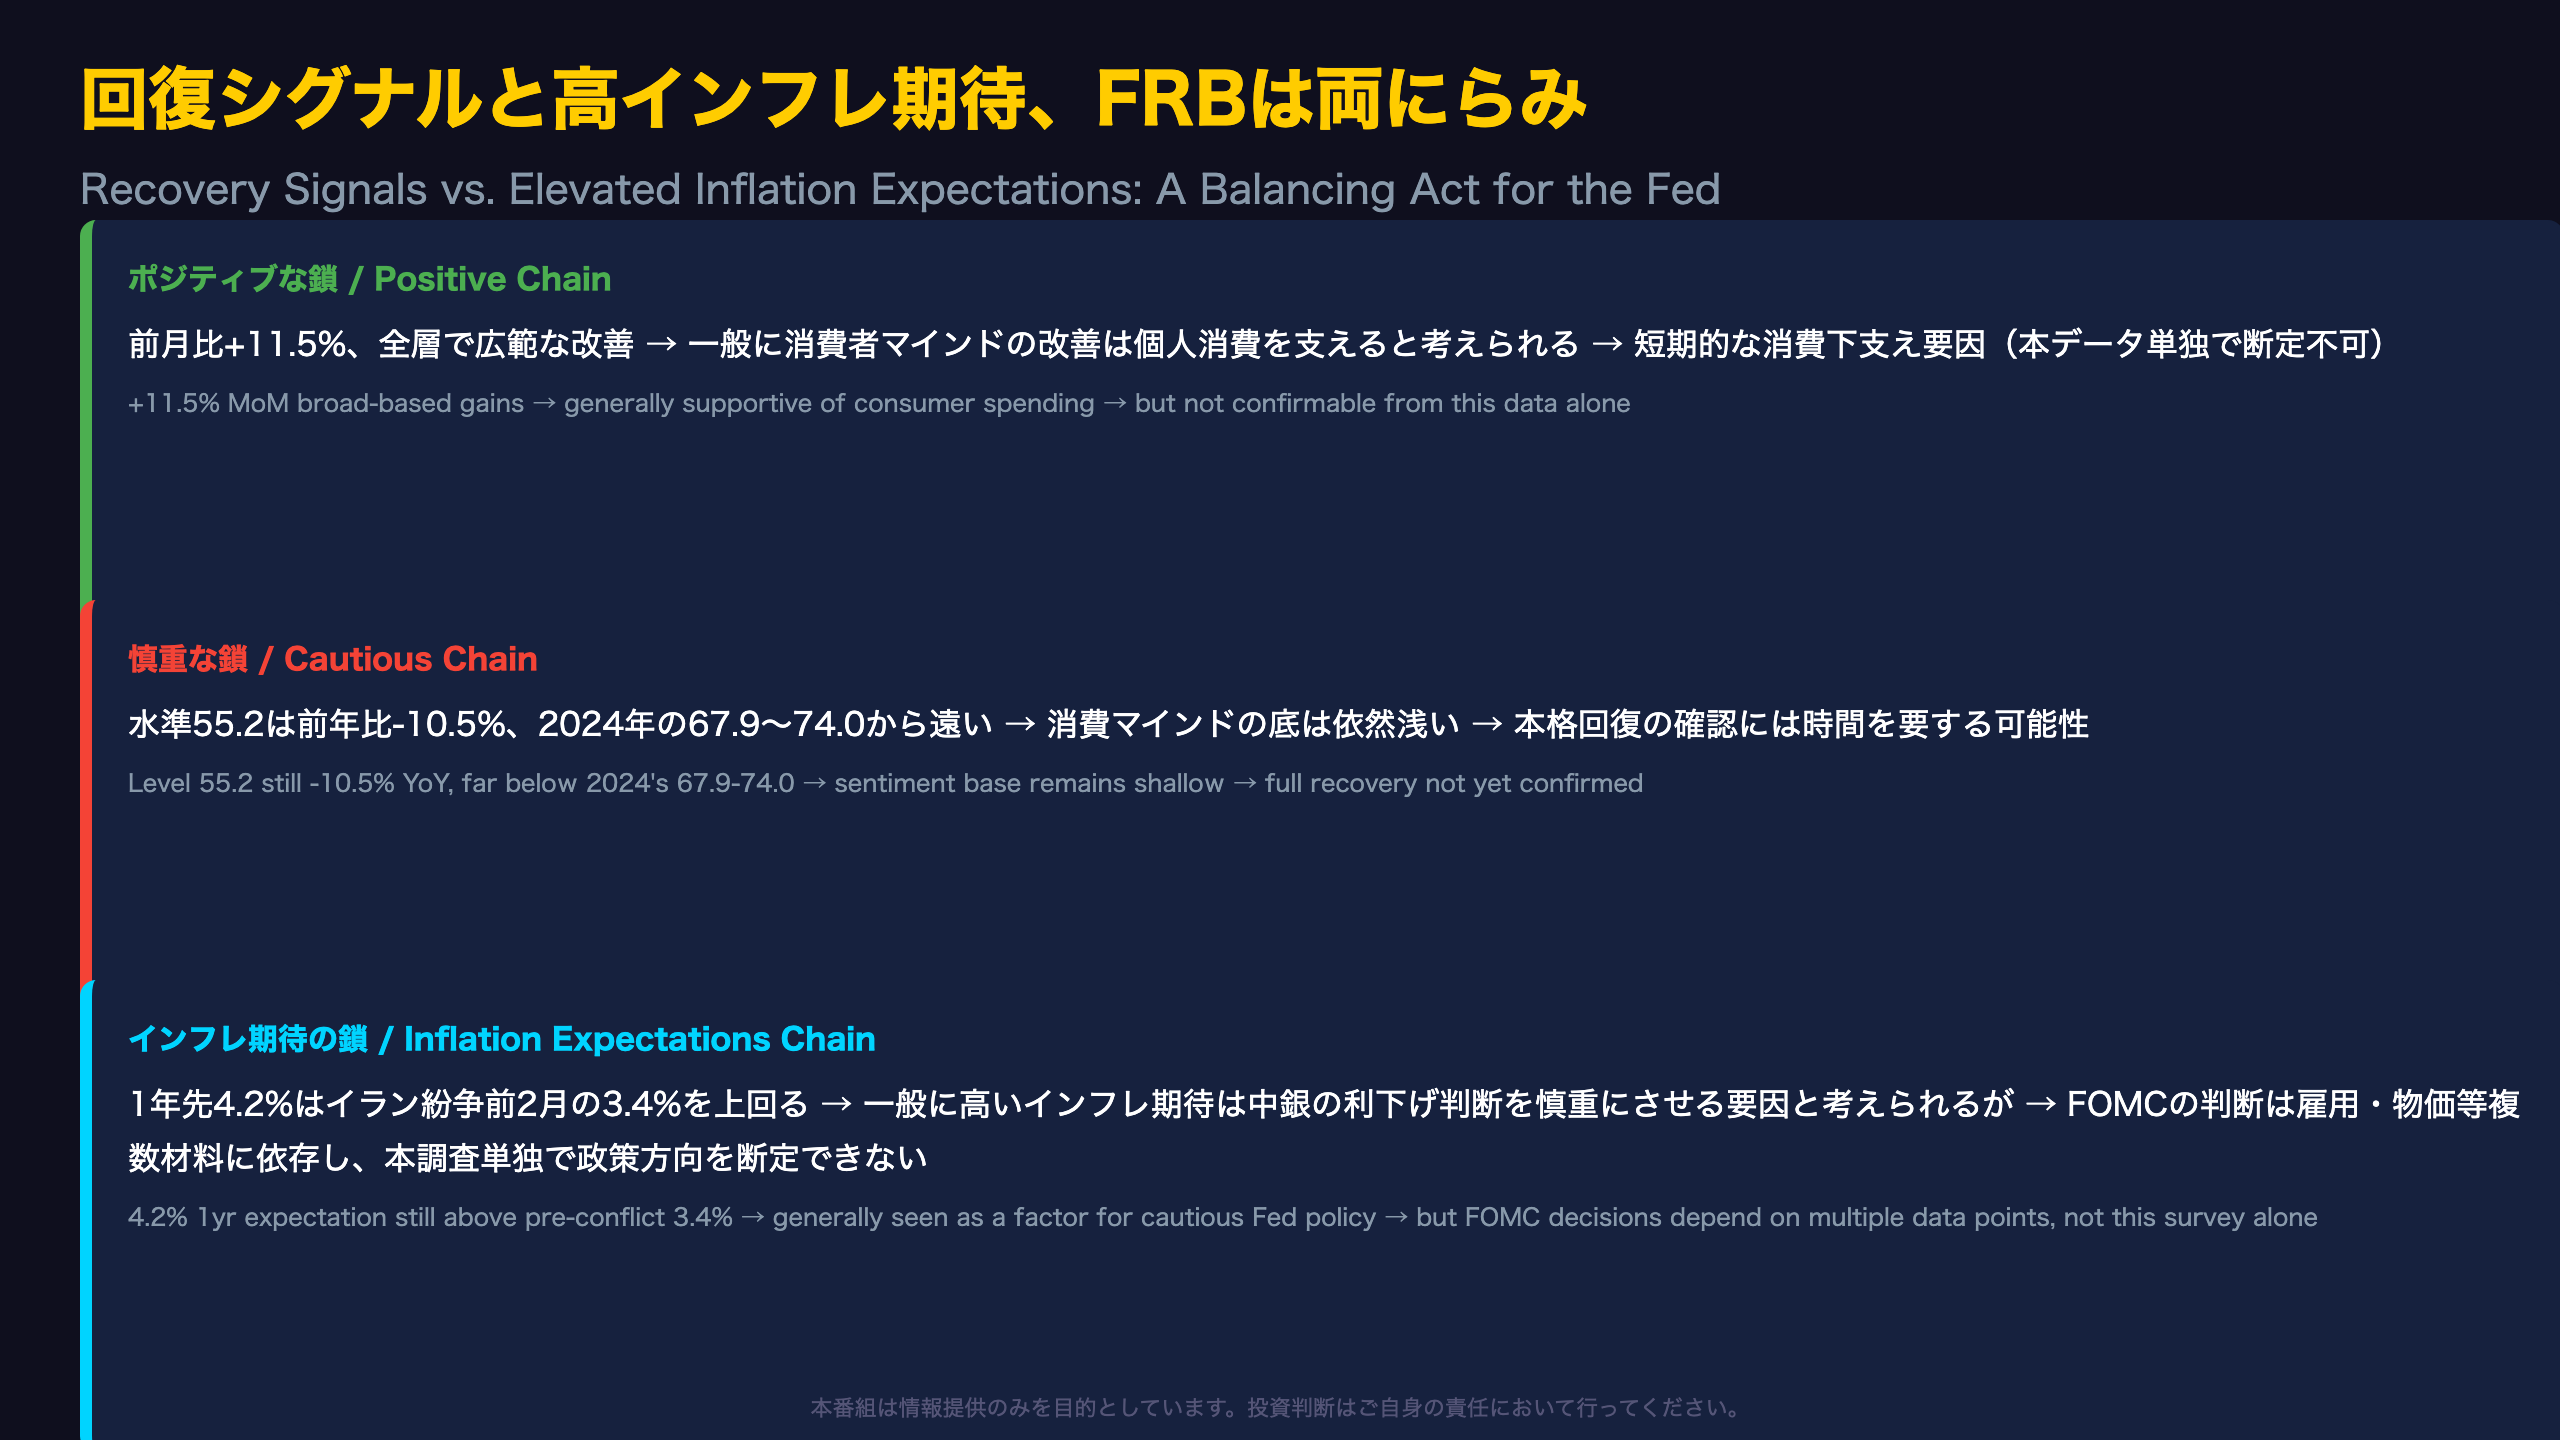
Survey-Based vs. Market-Based Inflation Expectations
The Michigan survey captures household-level, survey-based inflation expectations. Professional investors often cross-check this against market-based measures, such as TIPS breakeven inflation rates derived from Treasury markets. When the two diverge significantly, it can spark debate over which better reflects actual future inflation. This report itself does not reference market-based breakevens, so any comparison should be treated as external context rather than something drawn from this release.
What to Watch Next
The August 14, 2026 preliminary release for August data will be the next test, with two key questions: (1) can the index hold near the 55 level, and (2) does the 1-year inflation expectation continue easing below 4.2%? A renewed drop below 50 would suggest this month’s rebound was largely a one-off correction rather than a durable shift.
Bottom Line
This release presents a genuinely two-sided picture: a sharp near-term rebound, a still-depressed absolute sentiment level relative to 2024, and inflation expectations that remain above both their pre-2026-conflict base and the Fed’s 2% target. None of these signals alone is sufficient to predict the Fed’s next policy move or the trajectory of consumer spending.
Disclaimer: This article is for informational purposes only. All investment decisions are made solely at your own risk.