
📺 Watch the Full Video Analysis
This article was automatically generated by the NFC Market Live AI analysis system. (Updated: 2026-08-08 07:12 JST)
📄 Primary Source
米国労働省(DOL)— 新規失業保険申請件数
https://www.dol.gov/newsroom/releases/eta/eta20260806
米国エネルギー情報局(EIA)— 週間石油状況レポート
https://www.eia.gov/petroleum/supply/weekly/pdf/highlights.pdf
連邦準備制度理事会(FRB)— H.4.1 バランスシート
https://www.federalreserve.gov/releases/h41/current/h41.htm
📊 A full breakdown of this week’s 3 major US weekly indicators.
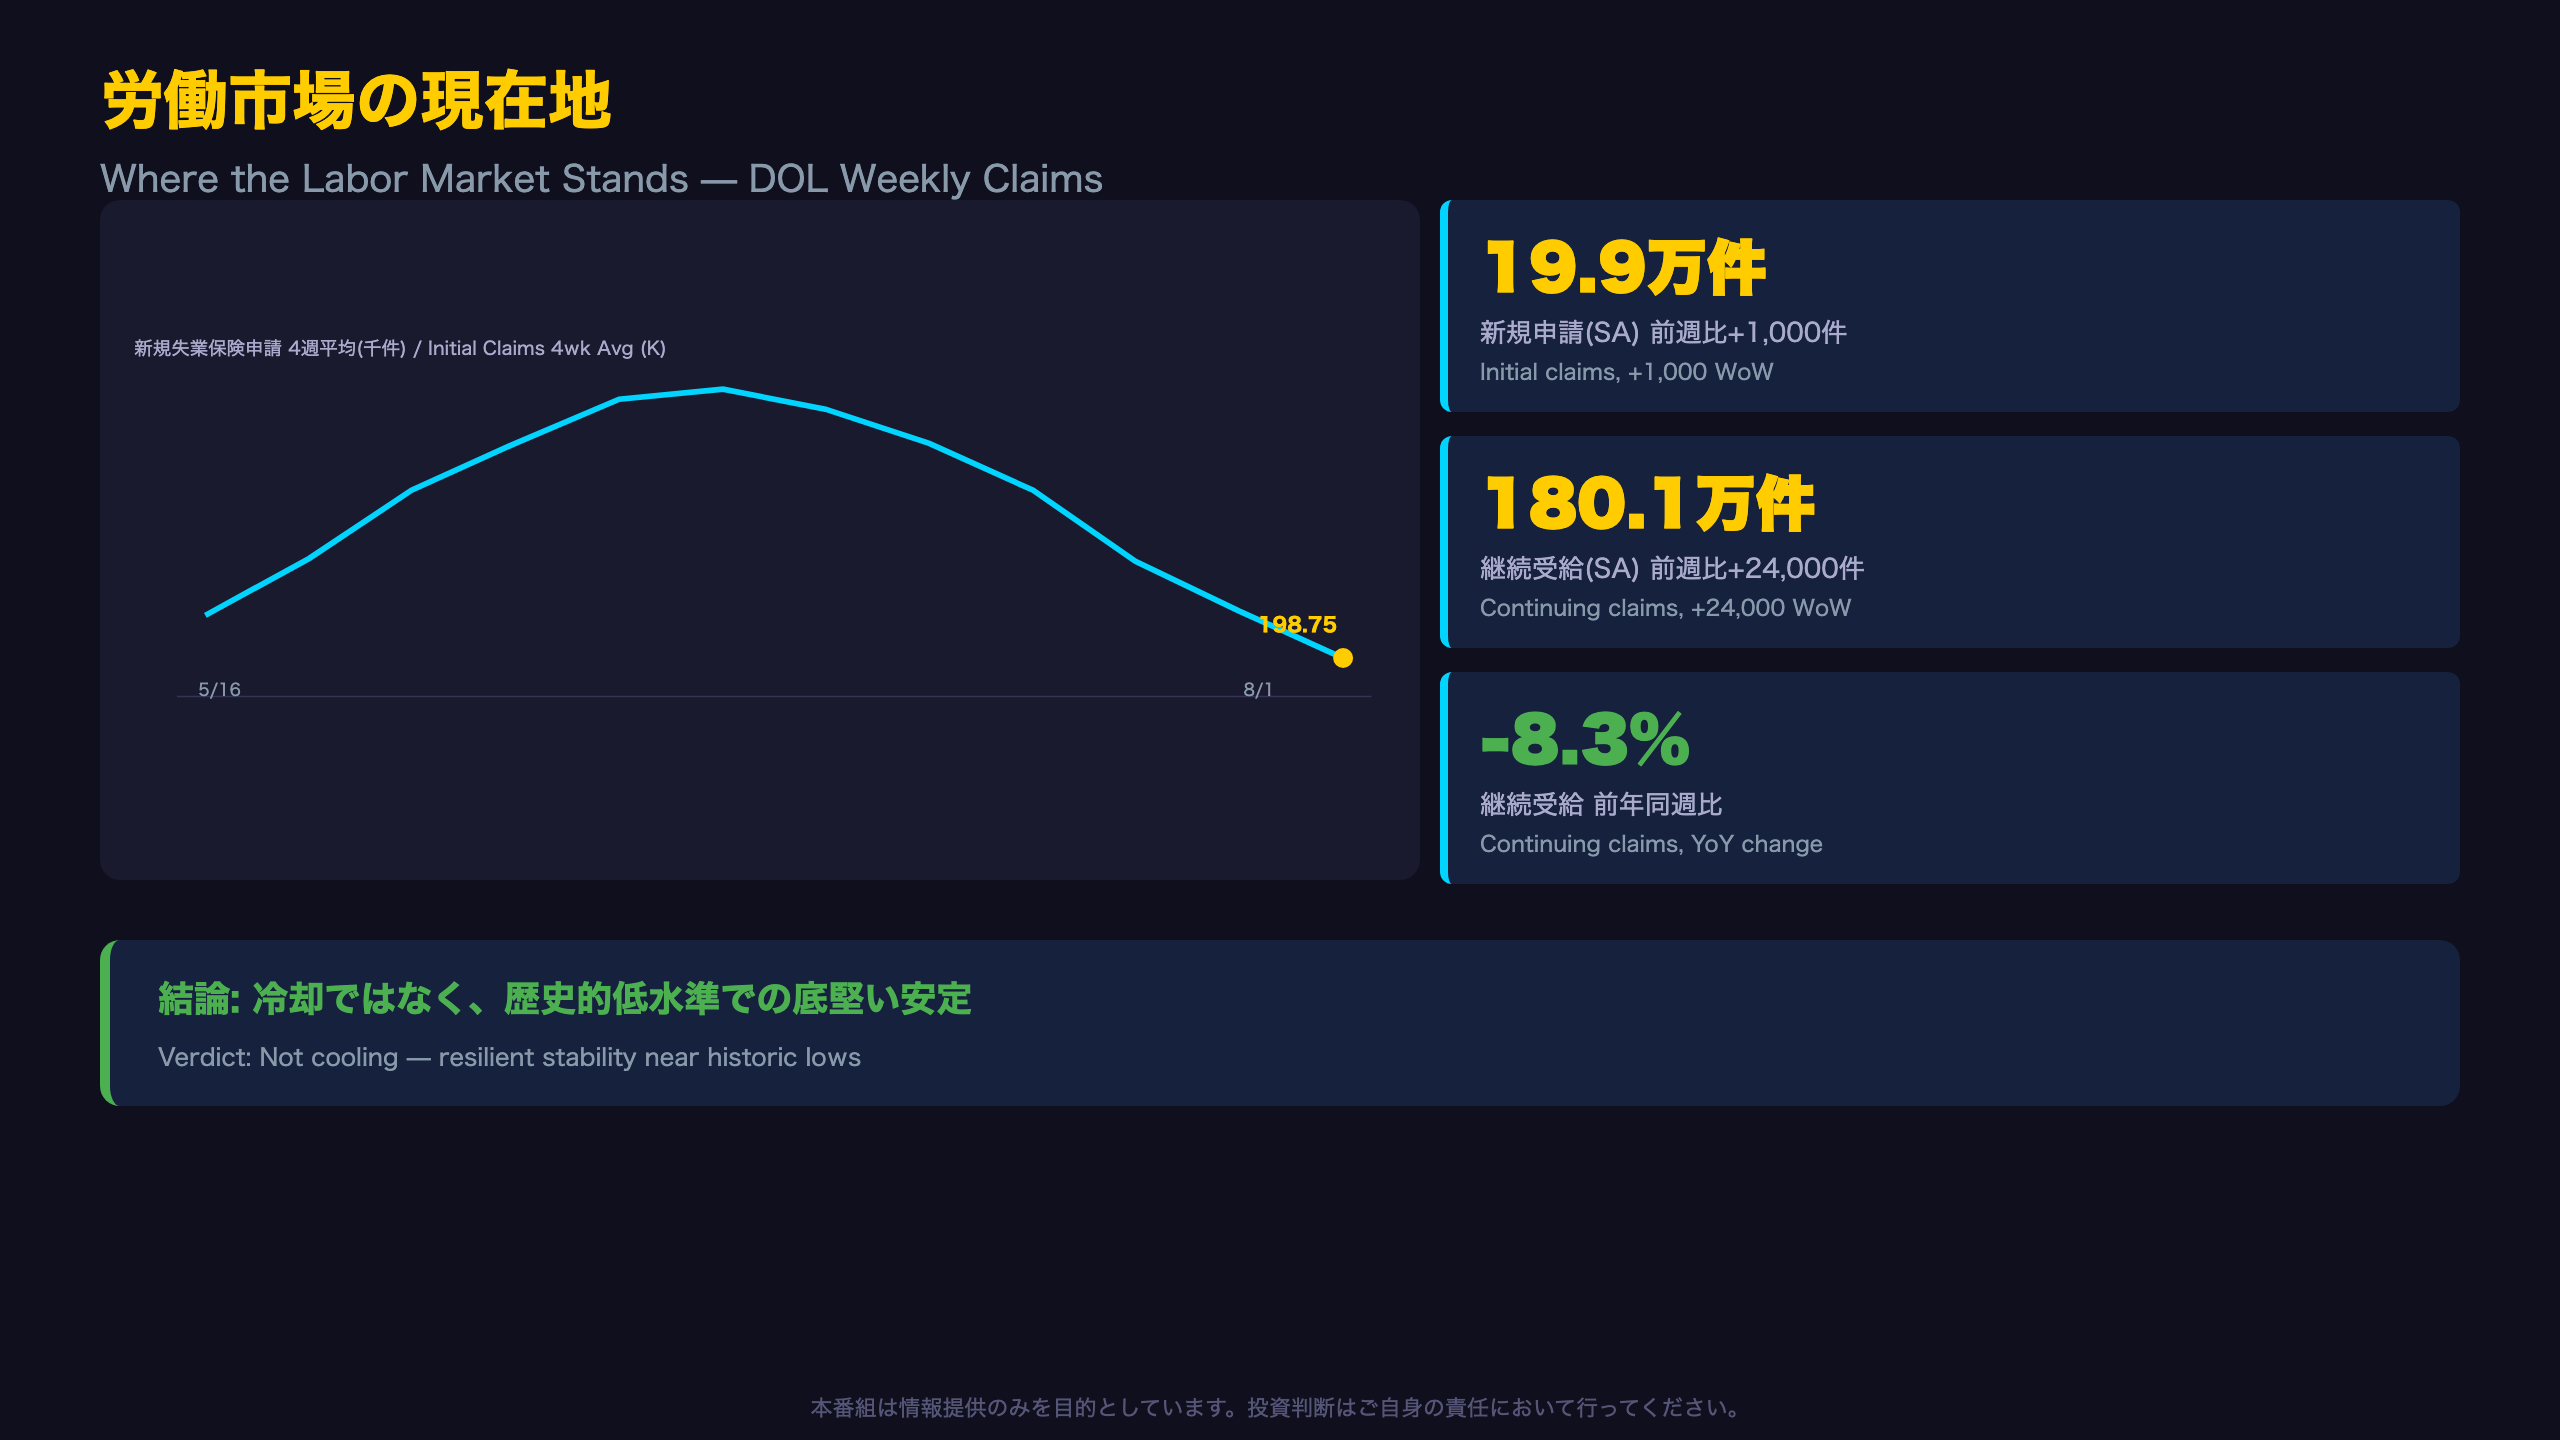
Initial jobless claims: 199K, with the 4-week average near historic lows at 198,750 — labor market resilience holds.
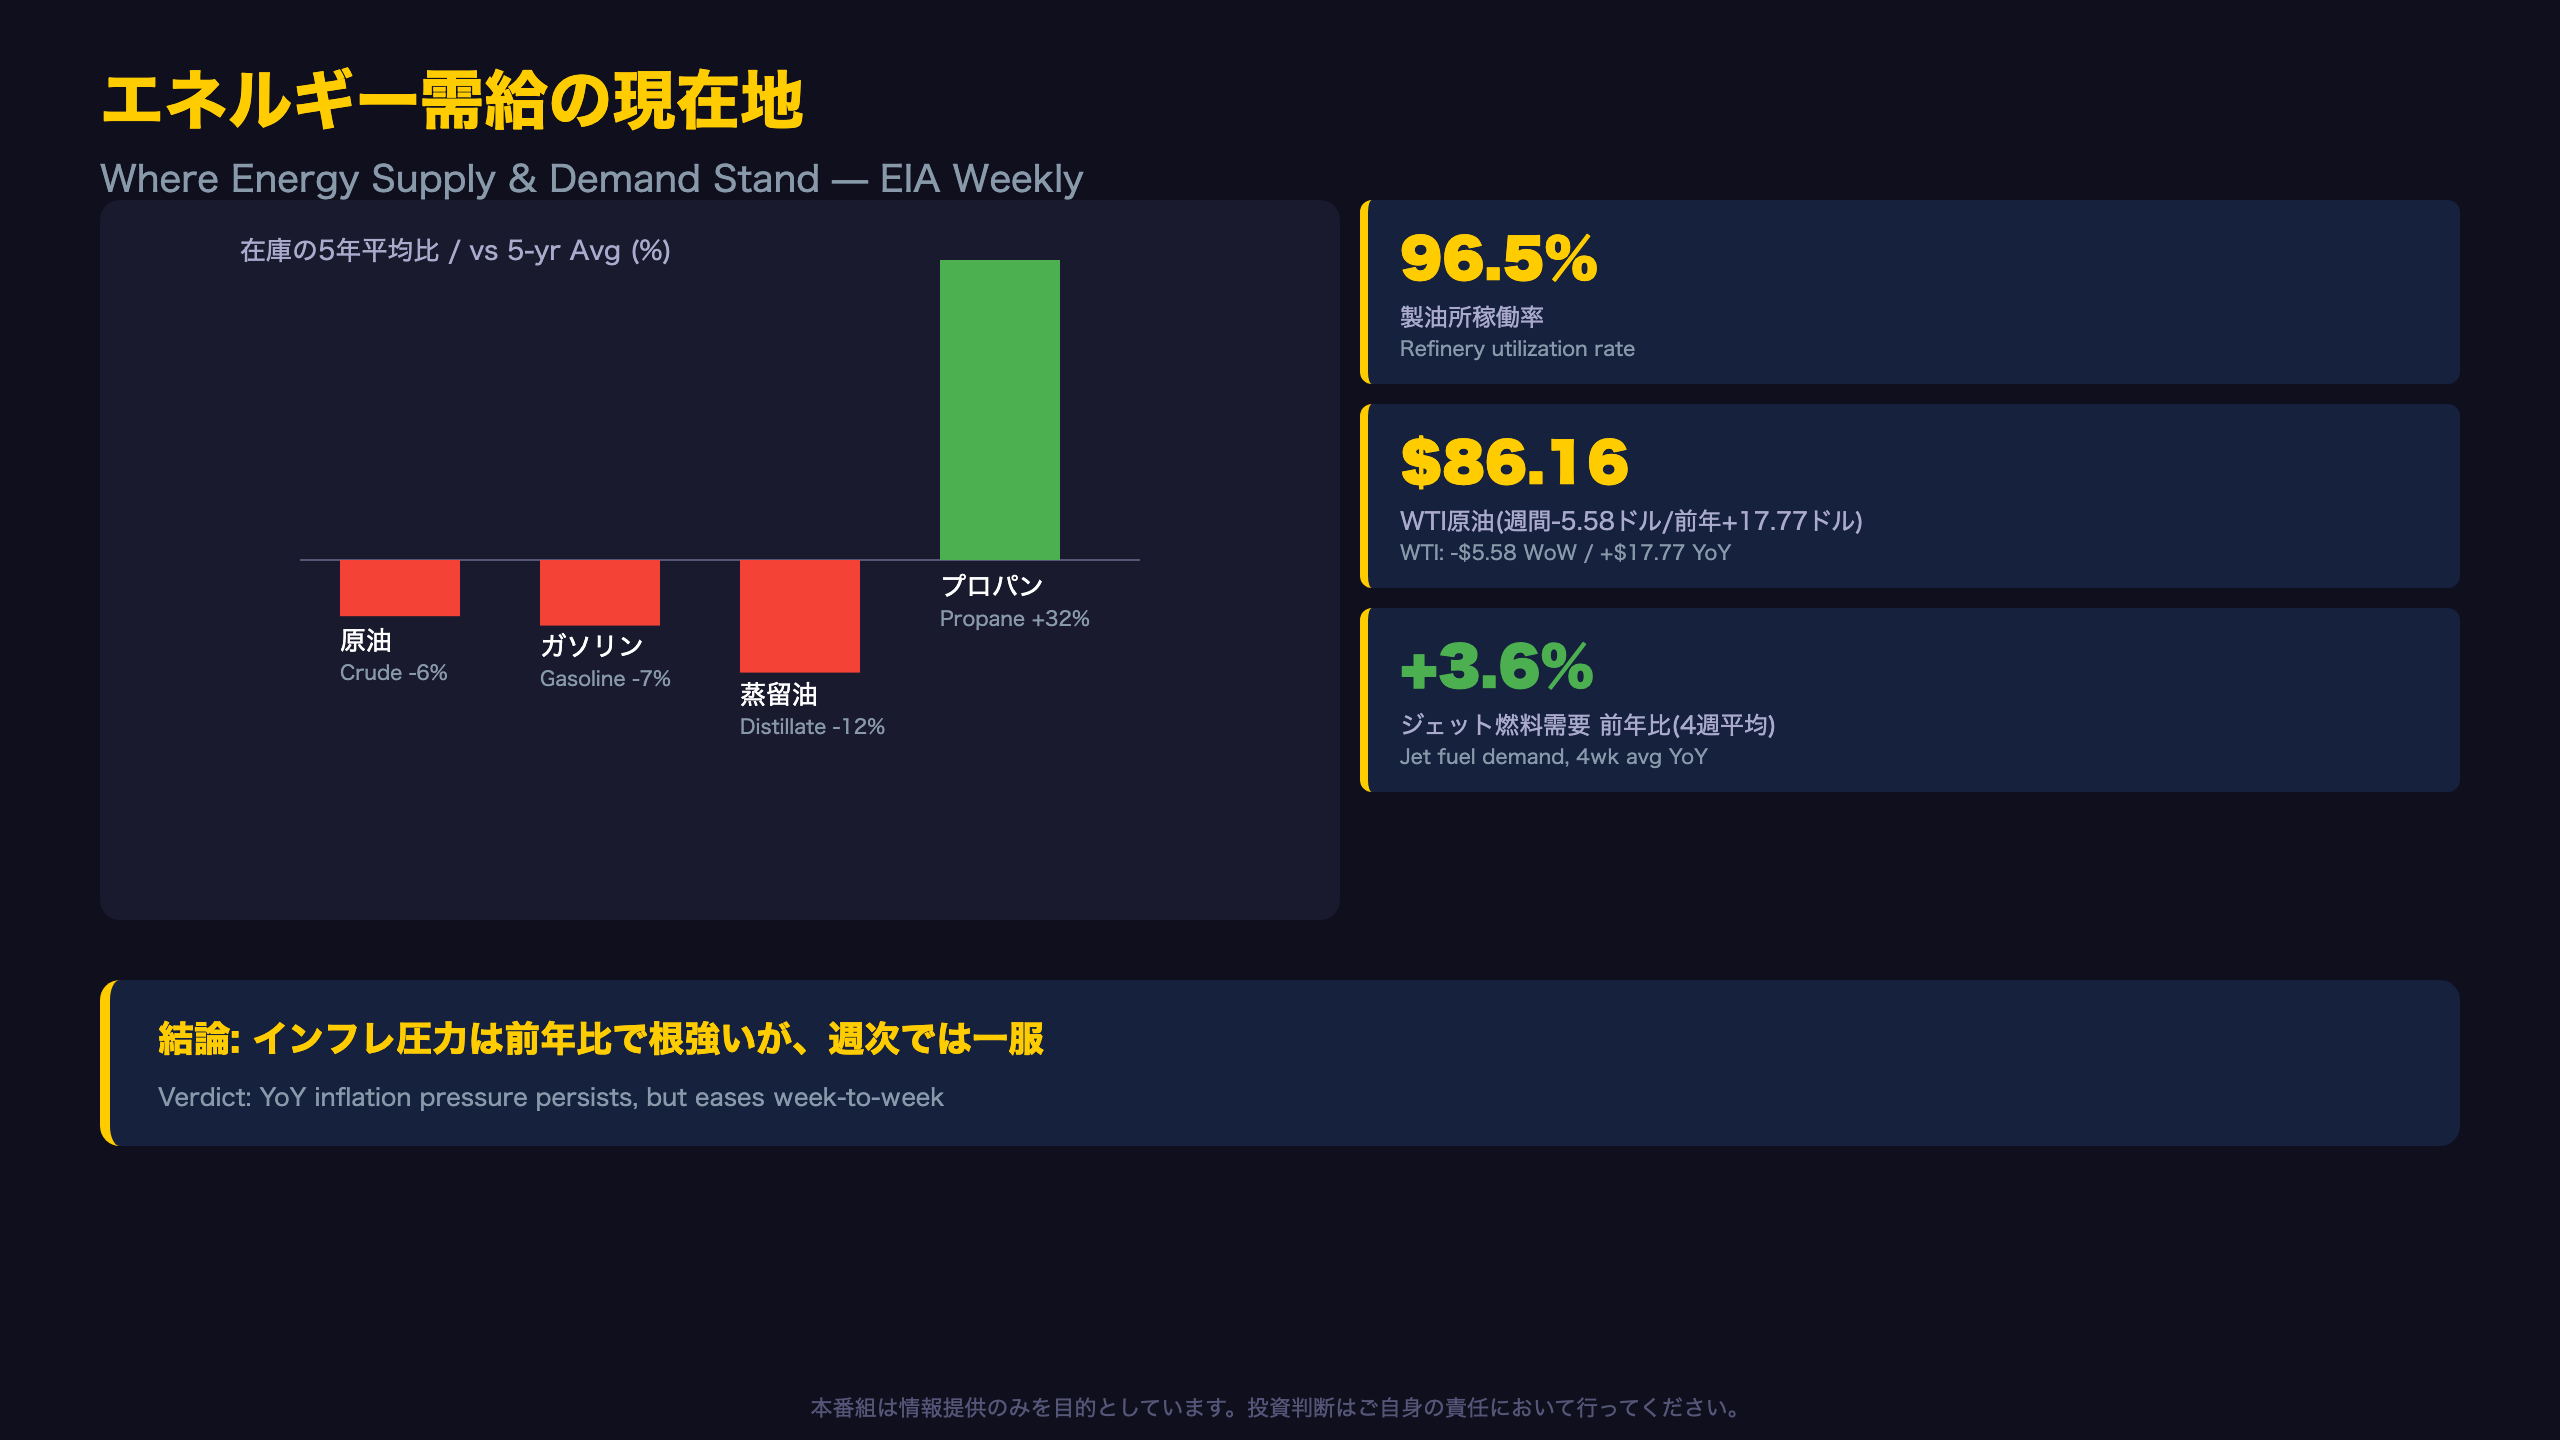
⛽ EIA data shows gasoline and distillate inventories below 5-year averages, even as WTI fell $5.58 on the week.
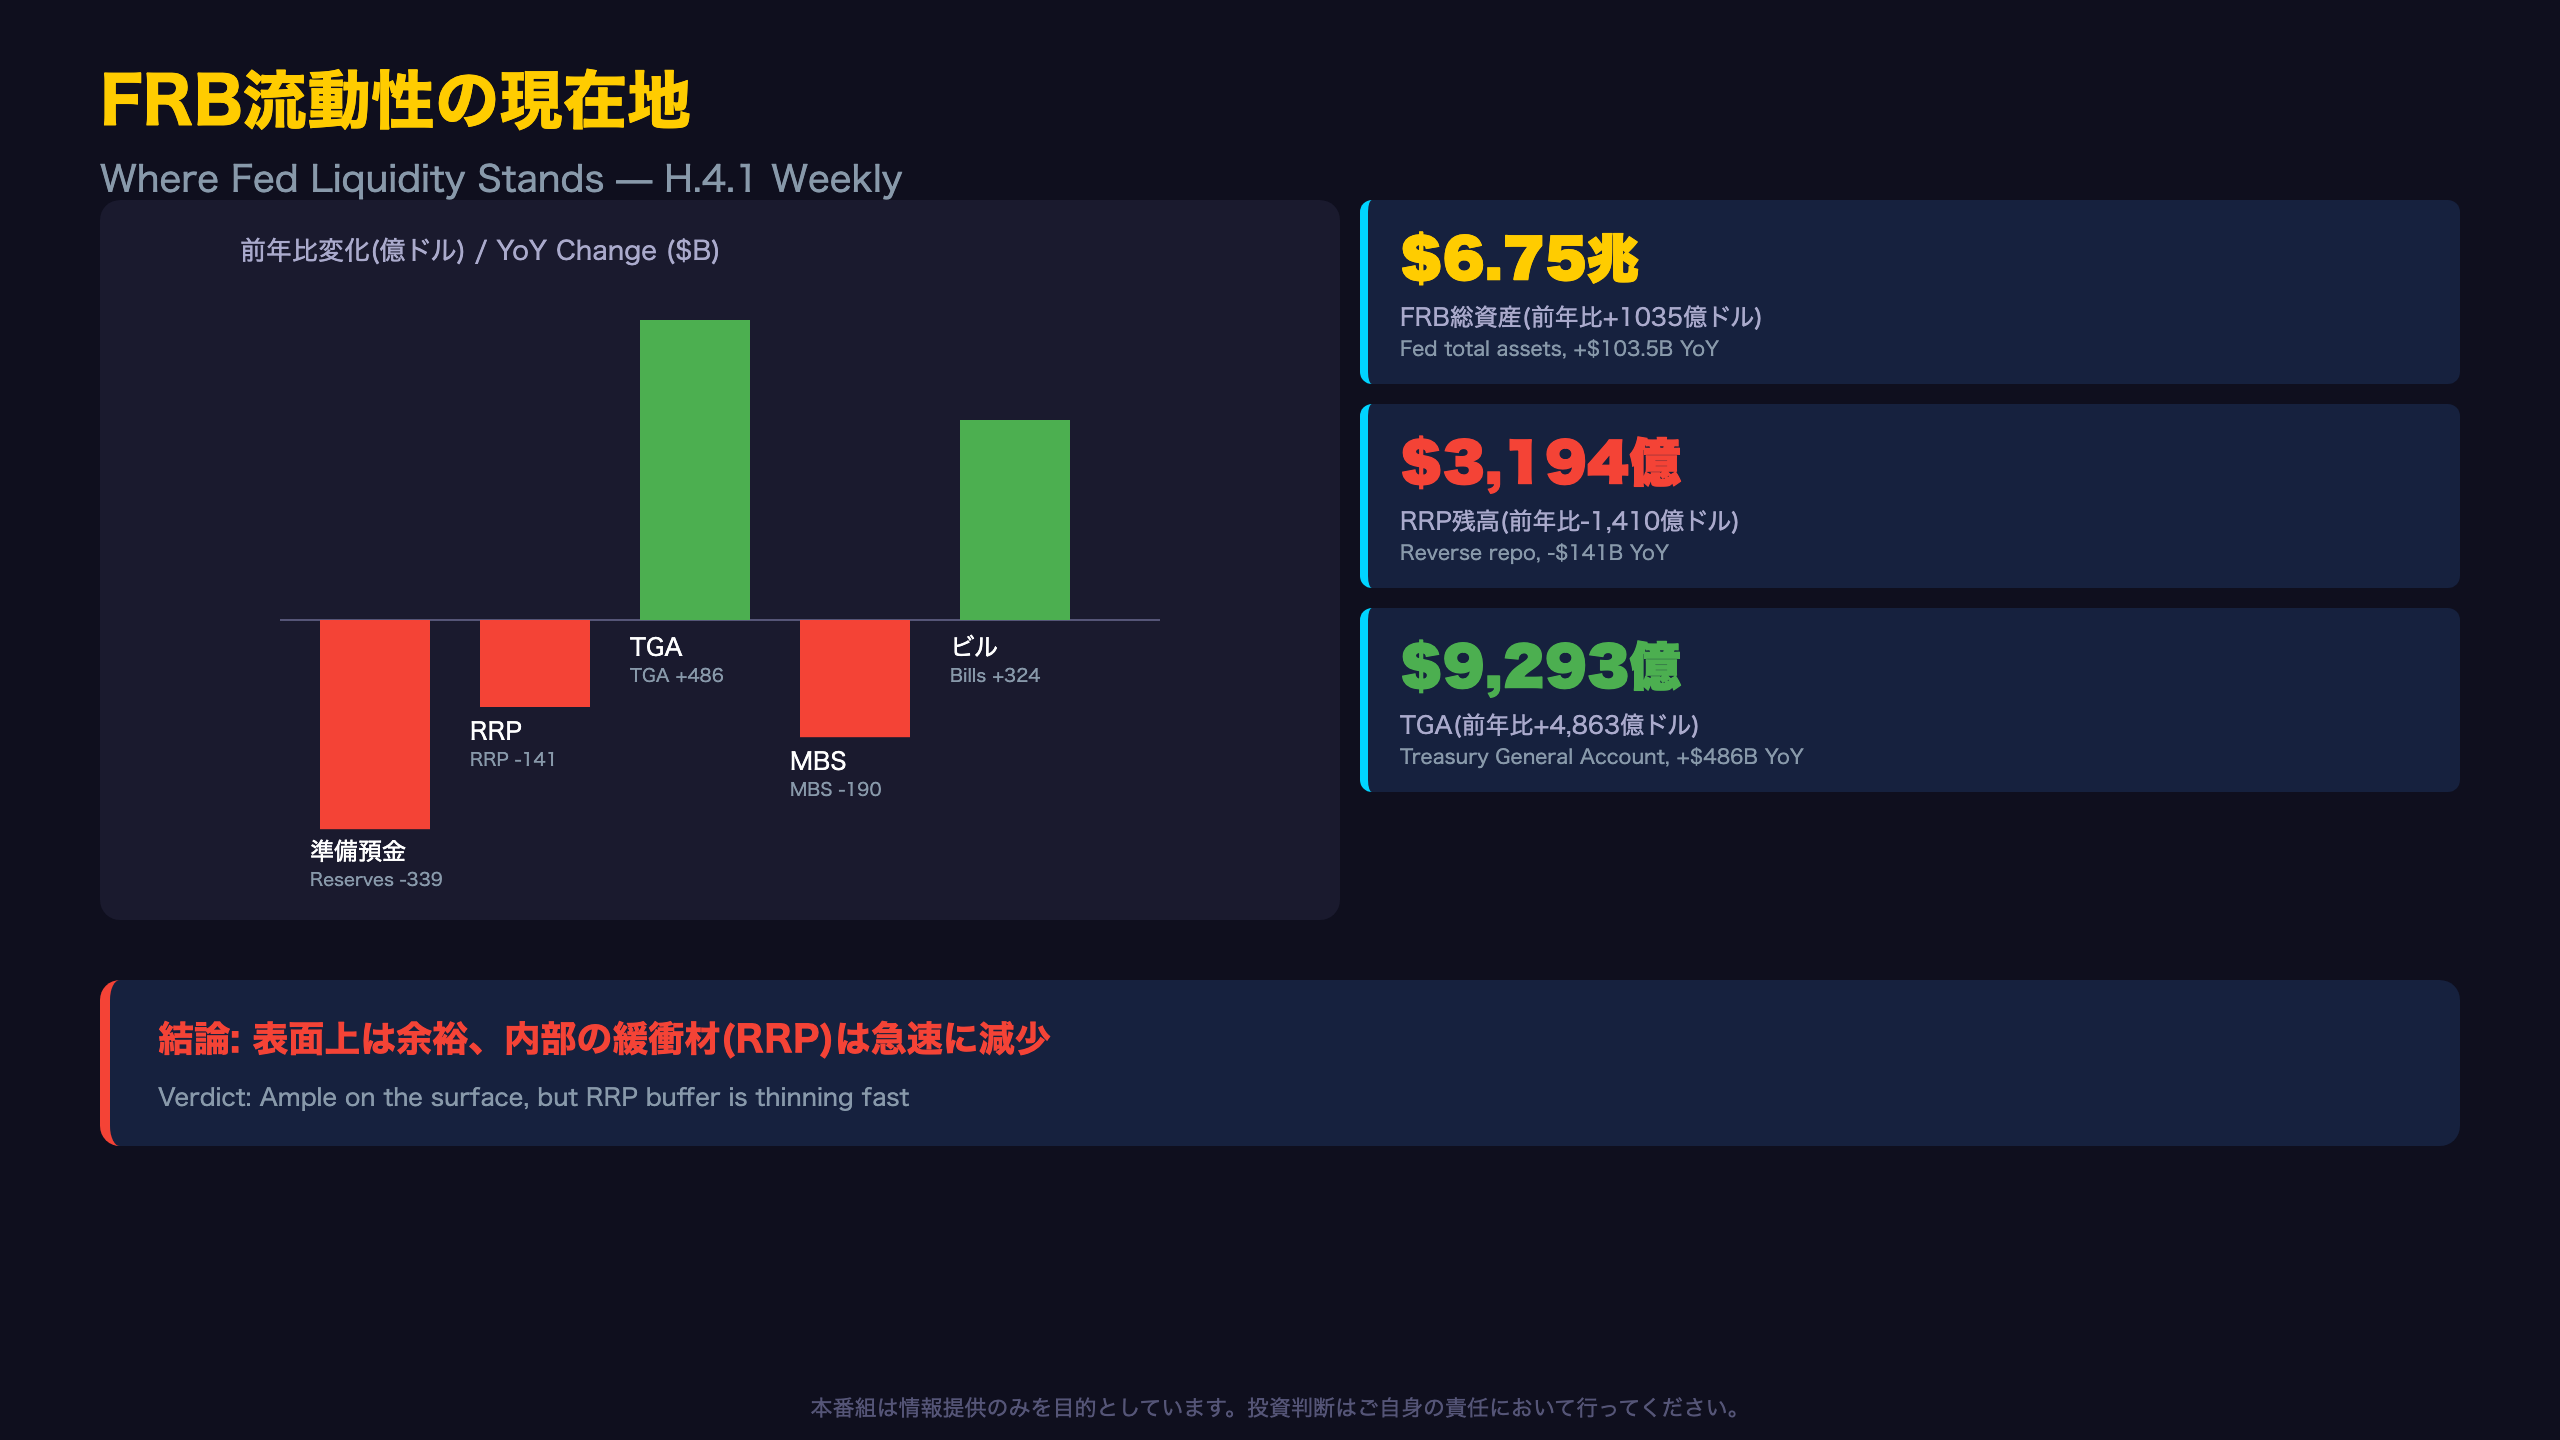
🏦 The Fed’s balance sheet is roughly flat — but reverse repo balances dropped $141B YoY while the Treasury General Account grew $486B.
💡 We break down what this liquidity ‘plumbing shift’ means for markets next week.
今週のアルティメット・サマリー
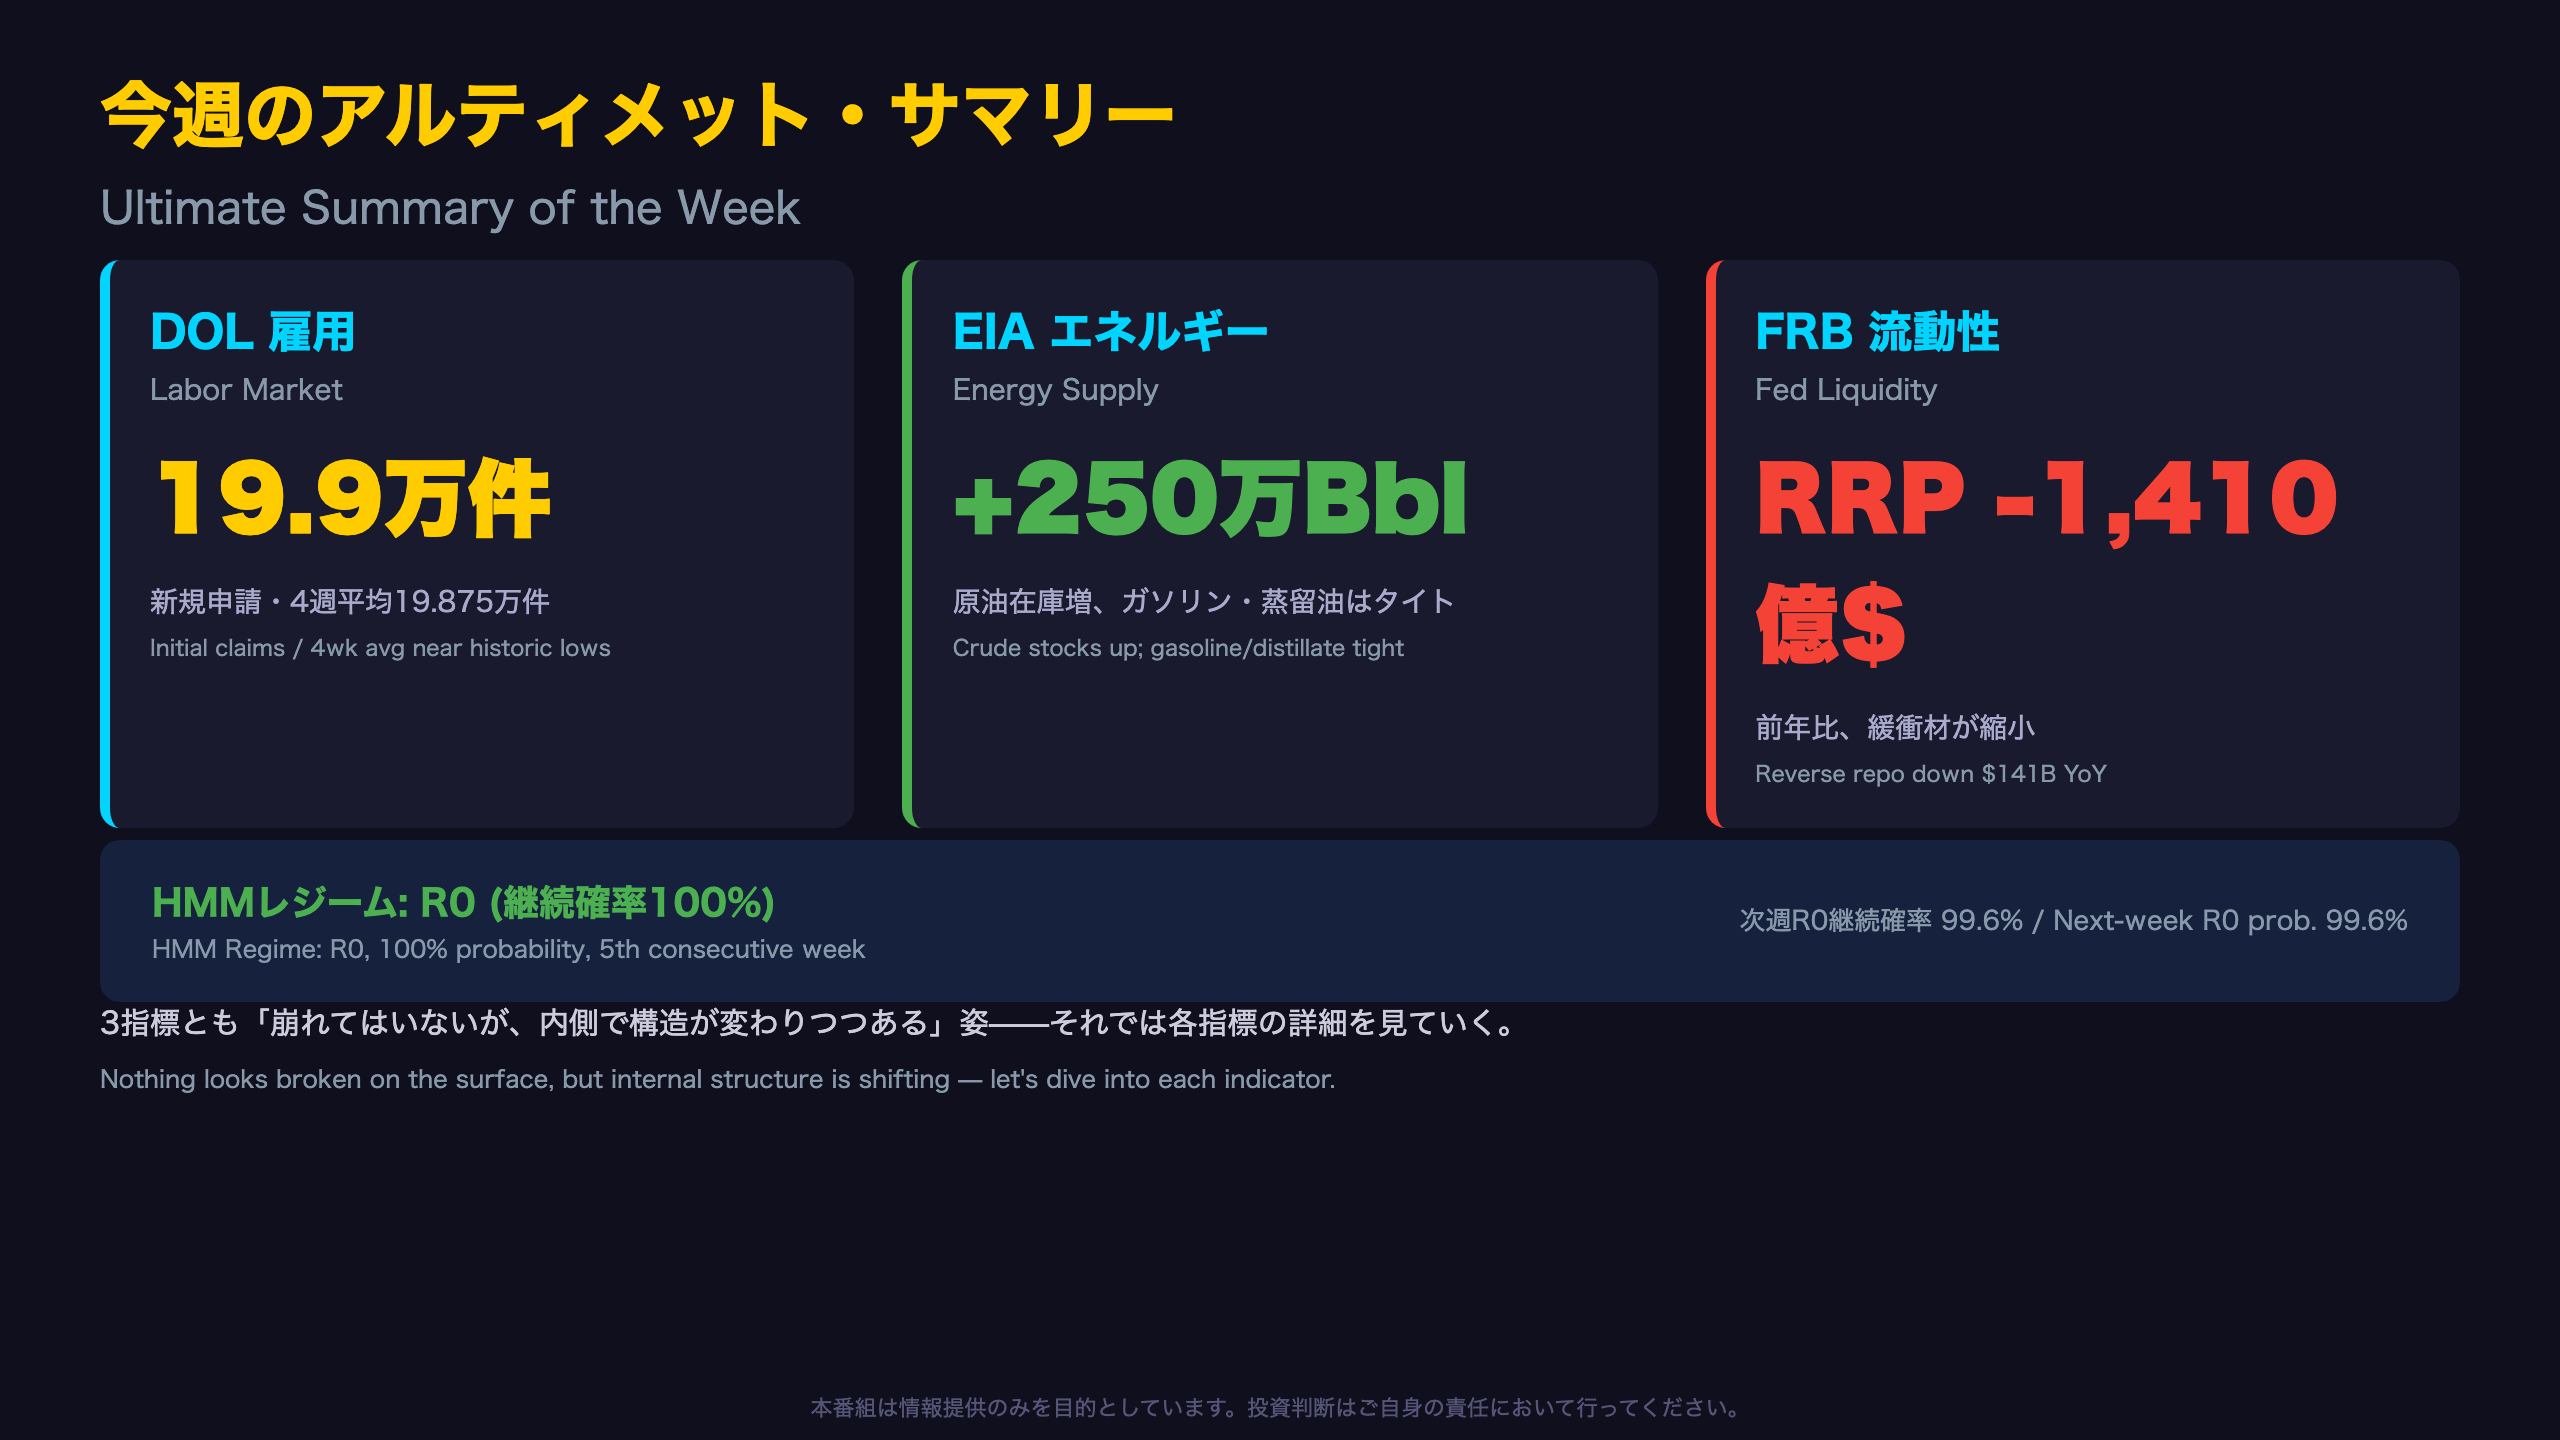
What a Statistical Regime Model Says About This Week
For readers unfamiliar with high-frequency macro tracking, DOL, EIA, and the Fed’s H.4.1 release are three of the most closely watched weekly US data points, each capturing a different corner of the economy: labor separations, energy supply/demand, and central bank balance sheet mechanics.
A quantitative overlay—a weekly Hidden Markov Model (HMM) regime classifier—adds useful context. The model has kept the US economy in Regime R0 with 100% probability for five consecutive weeks, with the ‘centroid distance’ (how typical this week looks versus the regime’s history) unchanged at 1.7885, and a 99.6% probability of staying in R0 next week. In plain terms: nothing looks statistically abnormal at the aggregate level.
But under the hood, the anomaly detector flags something different. EIA total petroleum products supplied logged a Z-score of 3.03—the only reading above the 3.0 threshold the model treats as a red flag, historically associated with early-stage regime transitions. Several CPI components (headline and core MoM) and labor force metrics (participation rate, employment-population ratio) also show Z-scores above 2.0, all skewing low.
Why this matters: aggregate-level regime stability can mask component-level drift. If multiple inflation and labor sub-indicators quietly drift in the same direction even while the regime holds, that’s often how transitions begin. This is not a call that a shift is imminent, but it’s a reason to watch next week’s data with extra scrutiny.
労働市場の現在地 (DOL詳細)
Context for Non-US Readers: Why Weekly Jobless Claims Matter
Unlike the monthly Non-Farm Payrolls report, DOL’s weekly initial claims data is released every Thursday and offers the highest-frequency read on labor market turns available to US policymakers and traders. These are noisy administrative filings, but the 4-week moving average smooths much of that volatility.
Historical framing: A year ago (week of August 2, 2025), the 4-week average sat around 221,000. Today’s reading of 198,750 marks a year-over-year decline of over 22,000, though the path wasn’t linear—claims rose as high as 224,500 in late June 2026 before falling sharply through July.
Continuing claims, a better proxy for how long the unemployed stay unemployed, tell a similar story: down to 1,791,250 on a 4-week average basis, versus 1,947,250 a year ago—roughly an 8% decline.
State-level nuance: New Jersey and Puerto Rico currently share the nation’s highest insured unemployment rate at 2.6%, followed by Rhode Island (2.3%). This regional dispersion largely reflects structural factors (state UI benefit generosity, industry mix) rather than a sudden new shock.
What’s next: the monthly Non-Farm Payrolls report will be the key cross-check on whether this claims-based resilience narrative holds up against the broader employment picture — a comparison US-focused investors should watch closely alongside next week’s data.
エネルギー需給の現在地 (EIA詳細)
Reading the EIA Weekly Petroleum Status Report
The EIA’s Weekly Petroleum Status Report is the highest-frequency official gauge of US oil supply, demand, and refining activity, published every Wednesday and closely watched by commodity traders and the Fed (energy prices feed directly into headline CPI).
The import/refinery tug-of-war: Crude imports jumped 515,000 bpd week-over-week to 6.2 million bpd, though the 4-week average of 5.8 million bpd remains 4.4% below year-ago levels. Refiners simultaneously pulled back crude inputs by 183,000 bpd while running at a still-elevated 96.5% utilization rate—suggesting refiners were near practical capacity limits, leaving less room to absorb the import surge, which likely contributed to the 2.5-million-barrel crude stock build.
A product-by-product divergence: Propane/propylene inventories are now 32% above their five-year average, a sharp contrast to gasoline (-7%) and distillate (-12%). Energy inventories aren’t monolithic — feedstock-heavy products can behave very differently from transportation fuels.
Retail price divergence: Regular gasoline dipped 1.7 cents on the week, but diesel rose 3.5 cents and remains up $1.548 (about 41%) year-over-year. Since diesel costs flow directly into trucking and freight rates, this divergence is one channel through which energy costs could leak into broader goods prices — worth watching alongside upcoming CPI transportation data.
FRB流動性の現在地 (H.4.1詳細)
Inside the Fed’s Balance Sheet: A Quiet Asset Swap
For readers new to the H.4.1 release: this weekly report is the Fed’s own balance sheet snapshot, tracking Treasury and mortgage-backed securities holdings, bank reserves, and the Treasury’s checking account at the Fed. It’s the primary lens through which markets track quantitative tightening (QT) progress.
The swap beneath the surface: While total assets are roughly flat, composition is shifting meaningfully. Treasury bill holdings rose $324.2 billion year-over-year to a weekly average of $524.9 billion, while mortgage-backed securities fell $189.8 billion to $1.93 trillion. This is consistent with continued passive MBS runoff being offset by active reinvestment into short-term bills.
A statistical flag worth noting: a separate quantitative regime model flags ‘currency in circulation’ as running hot, with a Z-score of 2.45 versus the model’s baseline regime. The H.4.1 data confirms the direction: currency in circulation rose $70.9 billion year-over-year to a $2.47 trillion weekly average.
Bottom line for market participants: this is not a resumption of aggressive QT, nor a reversal into QE — it’s a rebalancing story. But combined with reverse repo depletion, it adds one more data point to watch for tightening liquidity conditions in money markets.
ストラテジスト総括 — 3指標の連関と来週の注目シナリオ

Cross-Indicator Scorecard and the ‘Plumbing Risk’ Branch Point
Putting this week’s three reports side by side reveals a split: real-economy indicators (labor, energy) and the Fed’s monetary-plumbing indicators (RRP, TGA) are moving on very different tracks.
| Indicator Family | Direction | YoY |
|---|---|---|
| Labor (continuing claims) | Improving | ~-8% |
| Energy demand (4-wk avg) | Roughly flat | -0.9% |
| Fed total assets | Flat | ~+1.6% |
| Reverse repo (RRP) | Sharp decline | ~-31% |
| Treasury General Account (TGA) | Sharp increase | ~+110% |
The takeaway: labor and energy data are not deteriorating on a year-over-year basis, while the Fed’s funding-market indicators (RRP, TGA) have moved dramatically. This asymmetry is the key lens for interpreting next week’s calendar.
The weekly HMM regime model still assigns 100% probability to Regime R0 for a fifth straight week — nothing in this data set is statistically abnormal at the aggregate level. However, several CPI sub-components (core and headline MoM) show meaningfully elevated Z-scores (2.47 and 2.75) relative to the regime’s historical pattern — a signal not captured in this week’s labor/energy/Fed data, but worth flagging ahead of the next CPI release.
Two branch points for investors to watch: (1) does the year-over-year improvement in continuing claims persist, confirming labor resilience isn’t fading; (2) as reverse repo balances approach depletion, does an accelerating TGA rebuild start to visibly squeeze bank reserves or short-term rates. Neither can be confirmed from one week of data, but if both move adversely together, that combination would warrant a more cautious posture toward funding markets.
Disclaimer: This article is for informational purposes only. All investment decisions are made solely at your own risk.