This article was automatically generated by the NFC Market Live AI analysis system. (Updated: 2026-11-05 17:40 JST)
📄 Primary Source
Statistics Norway
https://www.ssb.no/en/arbeid-og-lonn/sysselsetting/statistikk/arbeidskraftundersokelsen
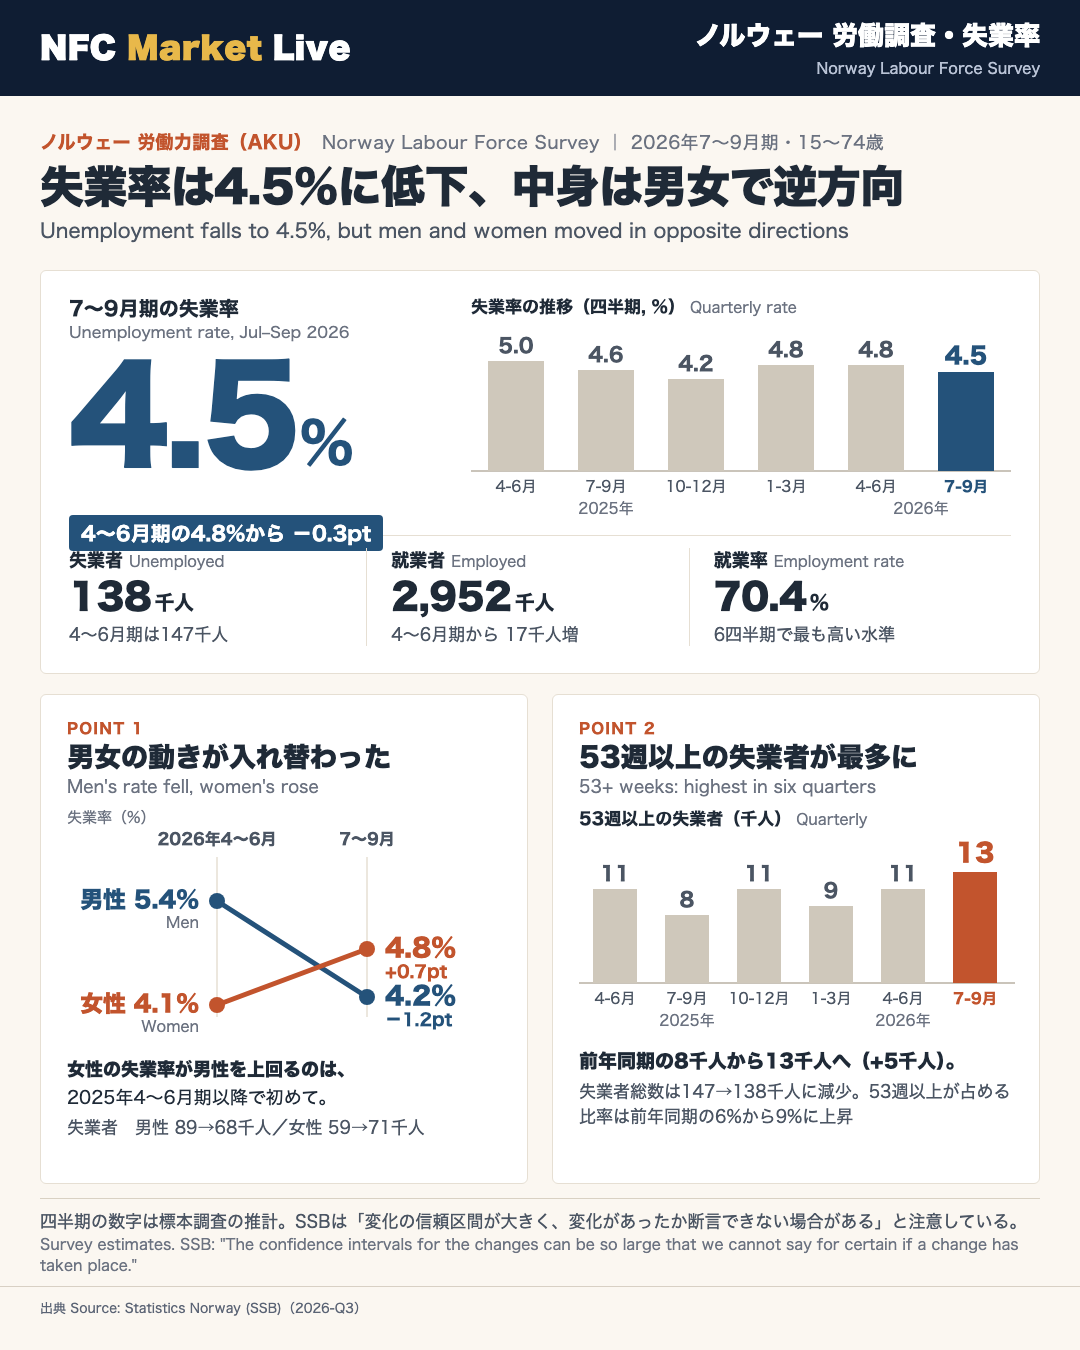
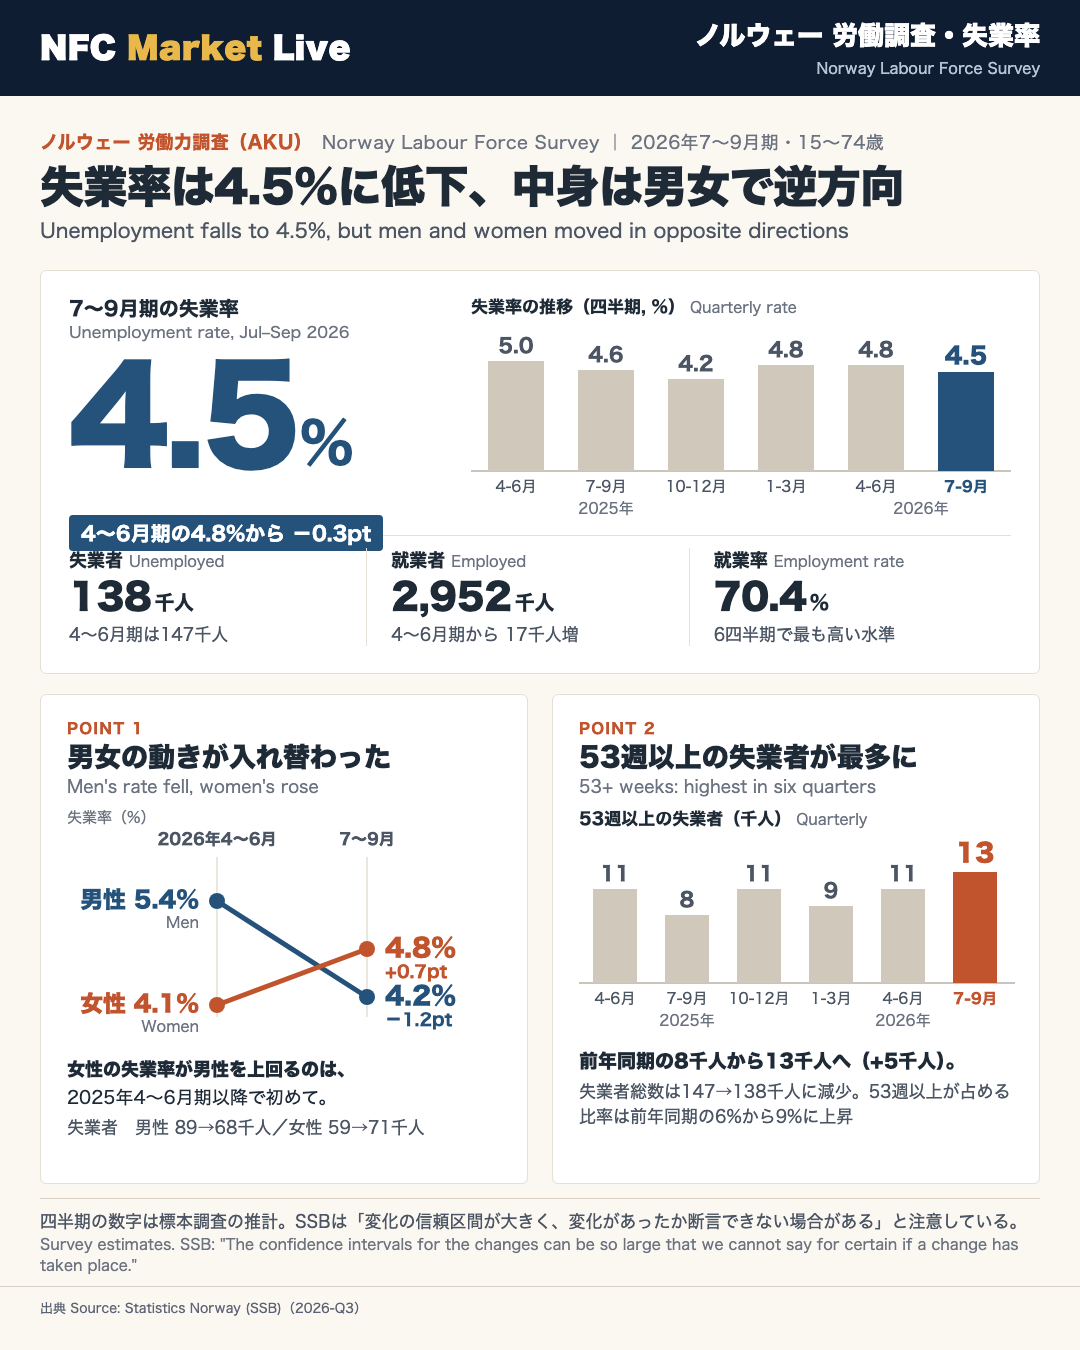
Statistics Norway (SSB) updated its Labour Force Survey on November 5, 2026. The unemployment rate for persons aged 15-74 was 4.5% in Q3 2026, down from 4.8% in Q2 and below 4.6% a year earlier. Unemployed persons numbered 138,000 (Q2: 147,000). Employed persons rose to 2,952,000 (Q2: 2,935,000), with the employment rate at 70.4% (Q2: 70.1%) and the labour force participation rate at 73.7% (Q2: 73.6%).
Men and women moved in opposite directions. The male unemployment rate fell from 5.4% to 4.2%, while the female rate rose from 4.1% to 4.8%. Among 15-24 year-olds, the male rate went from 17.5% to 12.1% and the female rate from 10.8% to 14.5%. The 25-54 rate eased from 3.5% to 3.2%.
By duration of job search, those searching for 53 weeks or more rose from 11,000 to 13,000 (8,000 a year earlier), or 9% of the unemployed.
The September 2026 trend figures show 141,000 unemployed (4.6%) and 2,928,000 employed (69.8% of the population), with changes of +1,000 each and 0.0 points in the rates.
SSB notes that confidence intervals for changes can be so large that it is not certain a change has occurred, and recommends the trend and three-month moving averages. The next update is November 25, 2026.
The Ultimate Summary:失業率4.5%に低下、ただし中身は男女で逆方向
Bottom line: a firm labour market, but an uneven one underneath
Statistics Norway (SSB) published its Labour Force Survey (LFS, known locally as AKU) on November 5, 2026. For persons aged 15-74, the Q3 2026 unemployment rate was 4.5%, down from 4.8% in Q2 and 4.6% a year earlier. The LFS is a household survey that counts someone as unemployed if they had no work in the reference week, searched for work in the previous four weeks and could start soon. It follows EU/ILO definitions, so it is comparable with Eurostat data. It differs from the registered unemployment published by the Nav welfare agency.
| Indicator | Q3 2025 | Q2 2026 | Q3 2026 |
|---|---|---|---|
| Unemployment rate | 4.6% | 4.8% | 4.5% |
| Employed (000) | 2,917 | 2,935 | 2,952 |
| Employment rate | 69.9% | 70.1% | 70.4% |
| Participation rate | 73.3% | 73.6% | 73.7% |
The strong side
Employment rose by 17,000 on the quarter and 35,000 on the year. The employment rate (70.4%) and participation rate (73.7%) are the highest of the six quarters shown, while the share outside the labour force (26.3%) is the lowest.
The cautious side
- 4.5% is above the 4.2% of Q4 2025 and the 2024 annual average of 4.0%. It equals the 2025 average.
- The September 2026 trend figures are flat: 4.6% unemployment and 141,000 unemployed, unchanged from the previous month.
- SSB itself warns: ‘The confidence intervals for the changes can be so large that we cannot say for certain if a change has taken place.’
This note does not draw conclusions on monetary policy or asset prices, which the source does not address. The next update is on November 25, 2026.
論点1:男女の動きが入れ替わった
Behind the headline: men’s unemployment falls sharply, women’s rises
Splitting the 4.8% to 4.5% decline by sex shows opposite moves.
| Indicator | Q3 2025 | Q2 2026 | Q3 2026 |
|---|---|---|---|
| Male unemployment rate | 4.7% | 5.4% | 4.2% |
| Female unemployment rate | 4.5% | 4.1% | 4.8% |
| Male unemployed (000) | 77 | 89 | 68 |
| Female unemployed (000) | 65 | 59 | 71 |
| Male 15-24 rate | 15.3% | 17.5% | 12.1% |
| Female 15-24 rate | 13.7% | 10.8% | 14.5% |
In the six quarters shown (from Q2 2025), this is the first time the female rate exceeds the male rate.
Reading the flows
- Men: unemployment fell by 21,000 but employment rose only 7,000. The labour force shrank by 14,000 and the group outside it grew by 17,000. Part of the fall may therefore reflect people leaving the labour force rather than finding work.
- Women: the labour force grew by 21,000 and the group outside it fell by 18,000. Employment rose 10,000 and unemployment rose 12,000. New entrants who are still searching may explain part of the rise. Female participation (70.8%) and employment (67.4%) are the highest of the period shown.
Youth
The female youth rate of 14.5% is only slightly above the 13.7-14.3% range of Q2-Q3 2025 and Q1 2026. The 10.8% in Q4 2025 and Q2 2026 looks like the unusual reading. The male youth rate (12.1%) and the male 25-54 rate (3.1%) are the lowest of the six quarters.
Caveat
Subgroup estimates rest on small samples. SSB says the standard error of change must be multiplied by about 1.3 where gross flows are large. One quarter is not enough to call a structural shift.
論点2:求職期間の長い失業者がじわり増加
Total unemployment fell, but the longest searches grew
The number of unemployed fell from 147,000 in Q2 to 138,000 in Q3. The duration breakdown is less benign.
| Search duration (000) | Q3 2025 | Q2 2026 | Q3 2026 |
|---|---|---|---|
| 1-4 weeks | 46 | 40 | 43 |
| 5-13 weeks | 37 | 32 | 29 |
| 14-26 weeks | 16 | 22 | 21 |
| 27-39 weeks | 4 | 7 | 7 |
| 40-52 weeks | 10 | 14 | 13 |
| 53 weeks and over | 8 | 11 | 13 |
| Total | 141 | 147 | 138 |
What stands out
- Those searching for 53 weeks or more number 13,000, the highest of the six quarters shown and up from 8,000 a year earlier. Their share is 9%, versus 6% in Q3 2025.
- Adding the three categories of 27 weeks or more gives 33,000, versus 22,000 a year earlier. Summing the table’s shares gives about 23% versus 16%. Rounding applies, so treat these as approximations.
- The 5-13 week group fell from 37,000 to 29,000 on the year, and the 1-4 week group is 43,000 (31% of the total, versus 27% in Q2).
Two readings
The positive reading is that the total fell and the mid-duration group shrank. The cautious reading is that a layer of harder-to-place jobseekers may be building up. With one quarter and small cells, neither can be asserted as a trend.
Data quality
SSB notes that non-response in the LFS has risen in recent years and that web-based answering is being introduced gradually through 2025-2026. Differences of 1,000-2,000 in small cells may be within the margin of error.
質疑で深める:何を確かめれば判断できるか
Likely questions, and what the source supports
Q1. Is 4.5% a clear improvement?
The quarterly picture is positive: the employment and participation rates are the highest of six quarters and unemployment fell. But the September 2026 trend unemployment rate is 4.6%, flat on the previous month. SSB advises users to rely on the trend and the three-month moving averages, because the monthly seasonally adjusted and unadjusted series are volatile and heavily revised. A 0.3-point quarterly drop may lie within sampling error.
Q2. Is the rise in female unemployment bad news?
Female unemployment rose by 12,000, but the female labour force grew by 21,000 and the group outside it fell by 18,000. That suggests more women entering the labour market, so it is not clearly a deterioration. The female 15-24 group is worth watching: unemployed persons rose from 24,000 to 34,000.
Q3. Does the rise in long-term unemployment signal a structural change?
The 53-weeks-plus group is 13,000, the highest in the period shown, but this is a single quarter and a 2,000 increase. It does not support a structural claim by itself. The higher count of those searching 27 weeks or more than a year earlier (33,000 versus 22,000, by summing categories) is the point to check in coming quarters.
What to watch next
- Next update: November 25, 2026. Given SSB’s publication cycle (3-4 weeks after month-end), it is expected to cover October trend and seasonally adjusted figures.
- Whether the trend unemployment rate moves from 4.6%.
- Whether the gender reversal persists.
- Whether the 53-weeks-plus group stays elevated.
Per SSB’s revision policy, the first two months of a quarter are preliminary and re-estimated at quarter-end, so figures should be read as subject to revision. As an international benchmark, LFS results follow EU/ILO definitions and are comparable with other European countries.
Disclaimer: This article is for informational purposes only. All investment decisions are made solely at your own risk.