📺 Watch the Full Video Analysis
This article was automatically generated by the NFC Market Live AI analysis system. (Updated: 2026-08-10 19:24 JST)
📄 Primary Source
Statistics Norway
https://www.ssb.no/en/priser-og-prisindekser/konsumpriser/statistikk/konsumprisindeksen
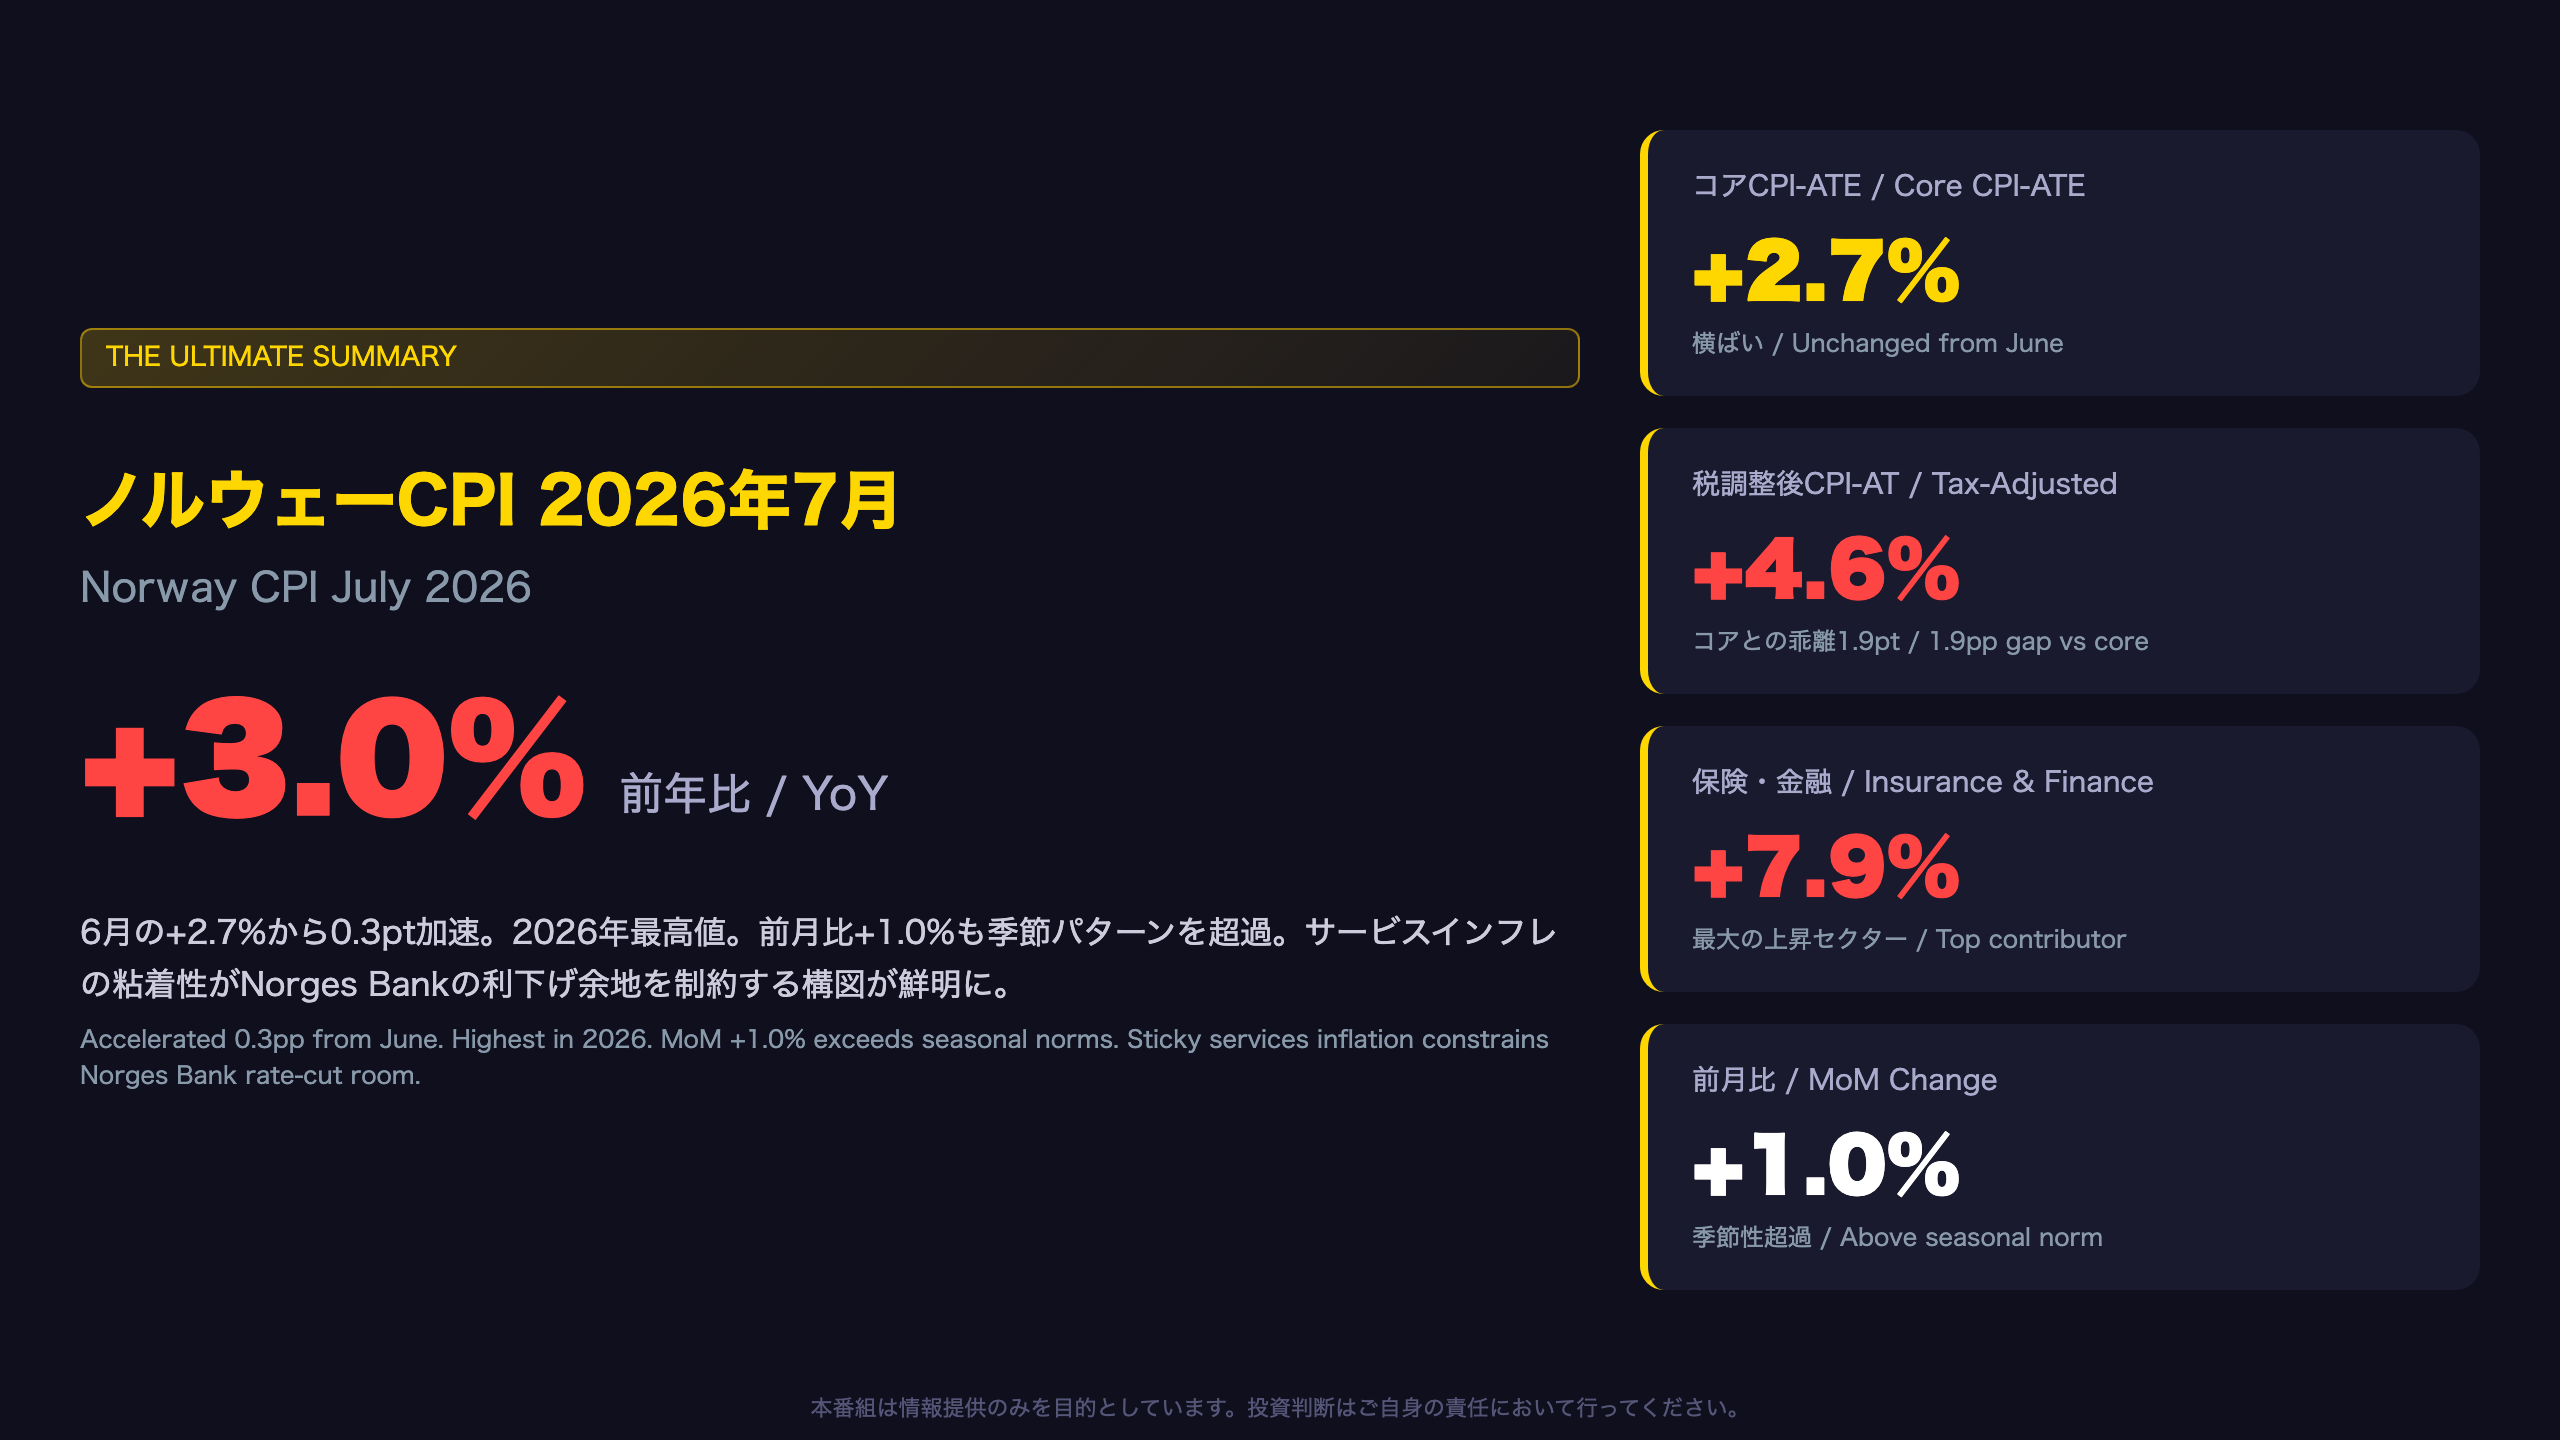
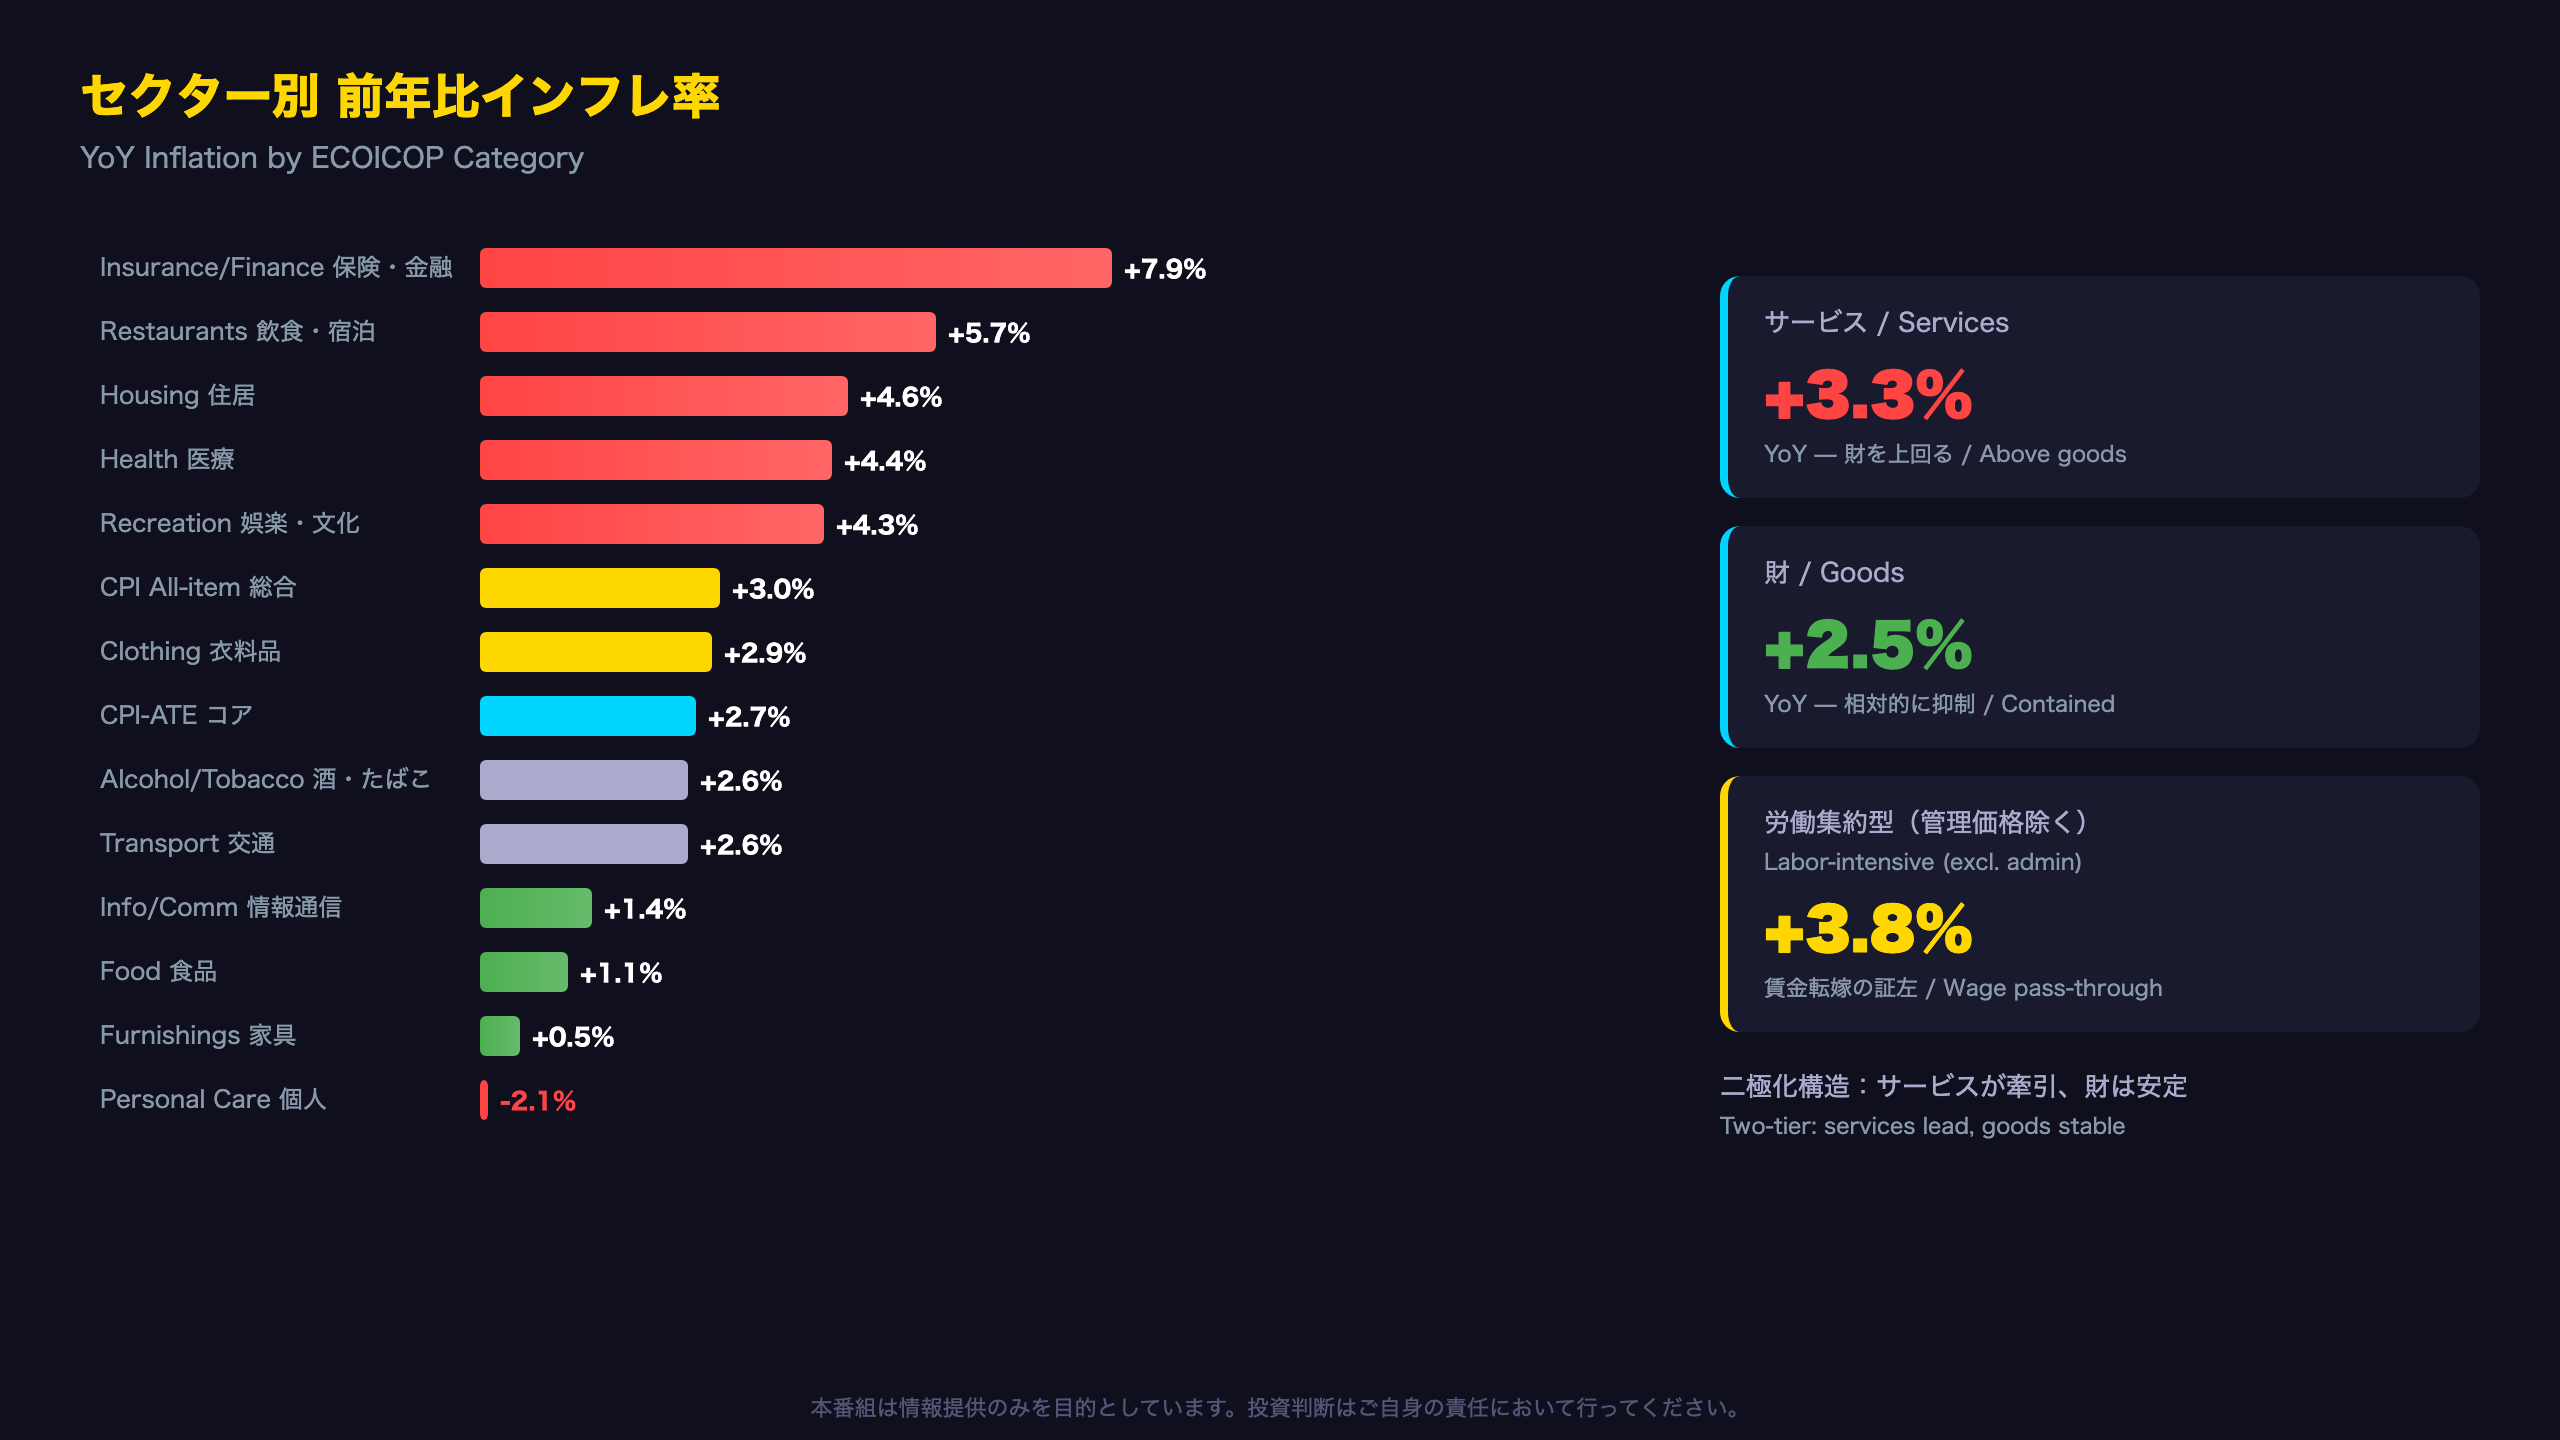
📊 Statistics Norway (SSB) released July 2026 CPI data on August 10.\n\n📈 Headline CPI accelerated to +3.0% YoY from +2.7% in June. MoM change was +1.0%.\n\n🔍 Key findings:\n• Core CPI (CPI-ATE) steady at +2.7% YoY, but tax-adjusted CPI-AT surged to +4.6%\n• Insurance & financial services: +7.9% YoY — the standout outlier\n• Housing +4.6%, restaurants & accommodation +5.7% — sticky services inflation\n• Food spiked +3.2% MoM but remains low at +1.1% YoY\n\n💡 Norges Bank’s rate-cut path faces headwinds from persistent services inflation. We analyze implications for NOK, Nordic bonds, and the policy outlook.
The Ultimate Summary:ヘッドラインCPI 3%到達、サービスインフレの粘着性が利下げシナリオを制約
Norway’s CPI Framework: What International Investors Need to Know
Statistics Norway (SSB, Statistisk sentralbyra) publishes the Consumer Price Index on the 10th of each month. Unlike the US CPI which uses a single headline measure, Norway publishes multiple variants:
- CPI: All-items headline index
- CPI-ATE: Adjusted for tax changes and excluding energy — this is Norges Bank’s preferred core measure
- CPI-AT: Adjusted for tax changes only (includes energy)
The July 2026 Reading in Context
Headline CPI at +3.0% YoY represents the highest print of 2026. The monthly index path (2025=100 base) shows: Jan 101.6 → Feb 102.2 → Mar 102.4 → Apr 102.8 → May 103.0 → Jun 102.8 → Jul 103.8. The June-to-July jump of +1.0 index points is notably larger than the typical seasonal uptick.
CPI-ATE vs CPI-AT: The Tax Wedge
The 1.9 percentage point gap between CPI-AT (+4.6%) and CPI-ATE (+2.7%) reveals that energy prices are adding significant upward pressure, while tax policy changes are simultaneously dampening measured inflation. For comparison, the ECB’s HICP for the Eurozone was running around 2.2-2.5% in mid-2026, making Norway’s underlying inflation notably hotter than its European peers.
Implications for Norges Bank
Norges Bank targets 2% inflation over time (using CPI-ATE as the operational measure). At 2.7%, CPI-ATE remains 70 basis points above target. Combined with the acceleration in headline CPI, this data reinforces the case for maintaining the policy rate at current levels rather than initiating cuts. The next Norges Bank rate decision is a key event to watch.
Base Effects: What August Could Bring
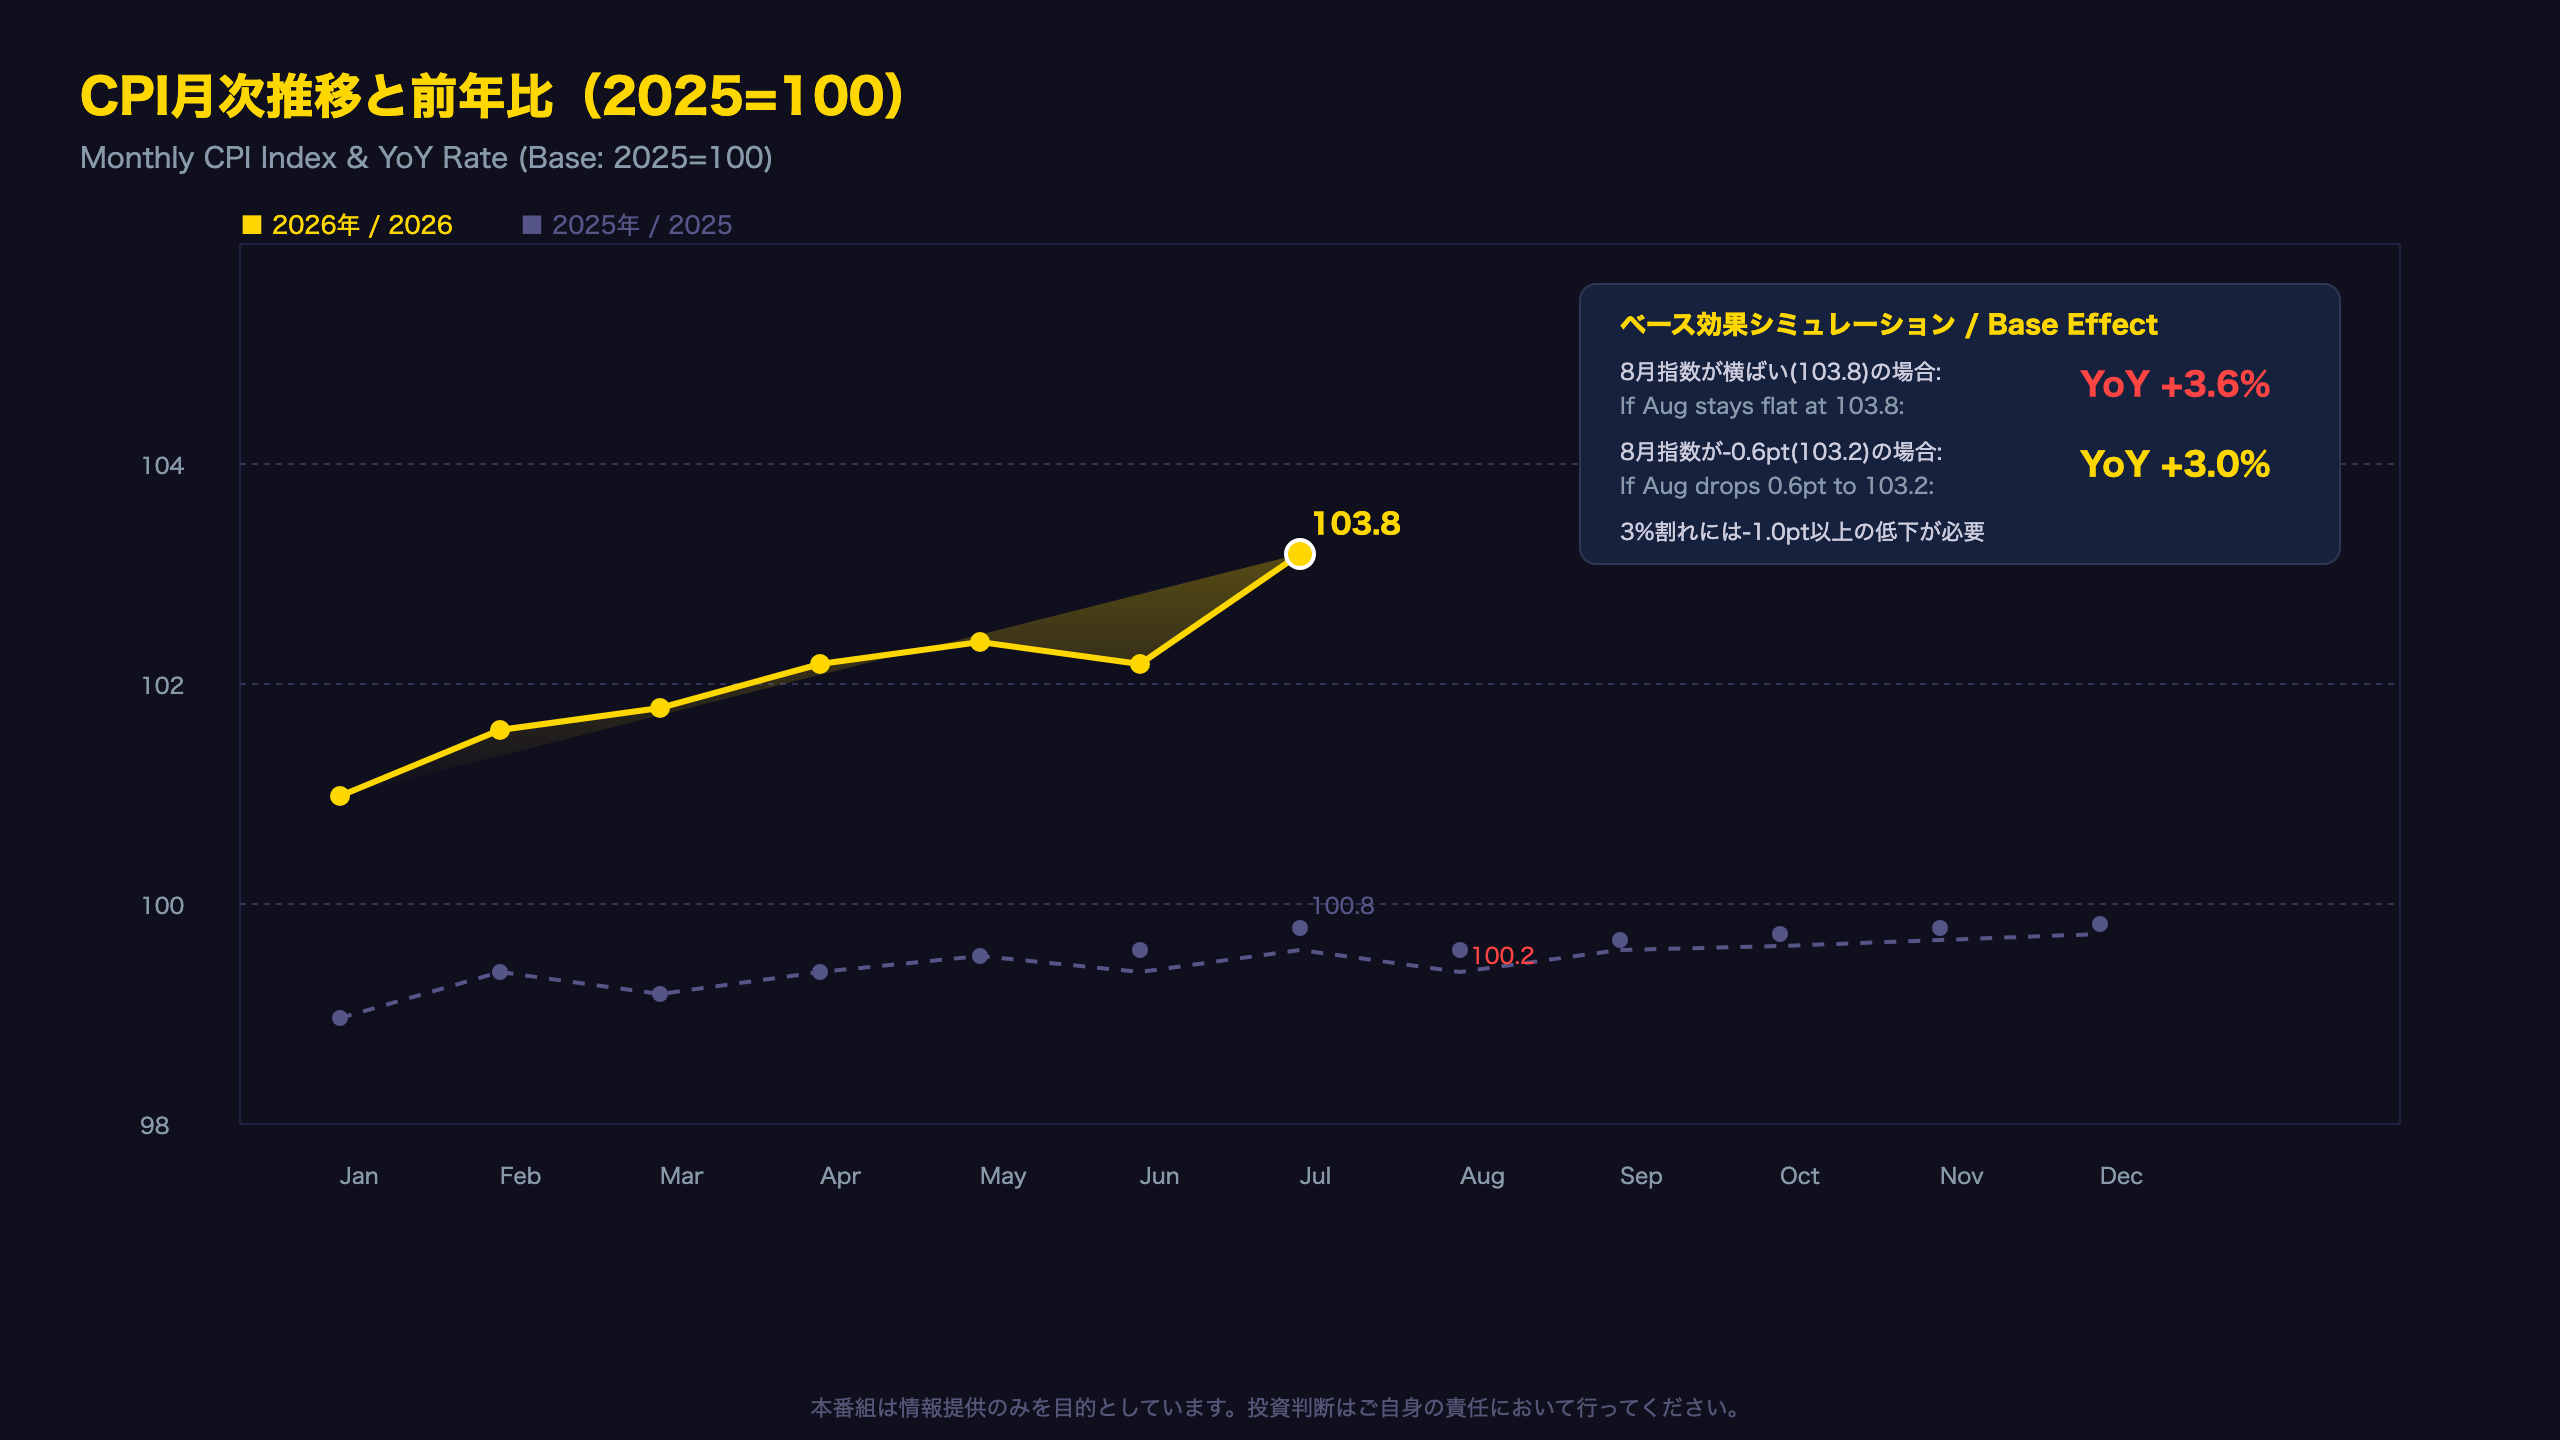
In 2025, the CPI index fell from 100.8 in July to 100.2 in August. If 2026 follows a similar seasonal pattern with even a modest decline, the year-over-year comparison could push headline CPI even higher in August due to the lower base.
セクター別分析:サービスインフレの二極化構造
Weight Structure Shifts: What Changed in Norway’s CPI Basket
Comparing July 2025 and July 2026 weights reveals significant structural changes in Norwegian consumption patterns:
| Category | 2025 Weight | 2026 Weight | Change |
|---|---|---|---|
| Housing | 253.4 | 312.3 | +58.9 |
| Recreation & Culture | 108.4 | 84.5 | -23.9 |
| Transport | 151.6 | 138.1 | -13.5 |
| Food & Beverages | 117.4 | 104.7 | -12.7 |
| Information & Communication | 43.4 | 52.5 | +9.1 |
The Housing Weight Surge
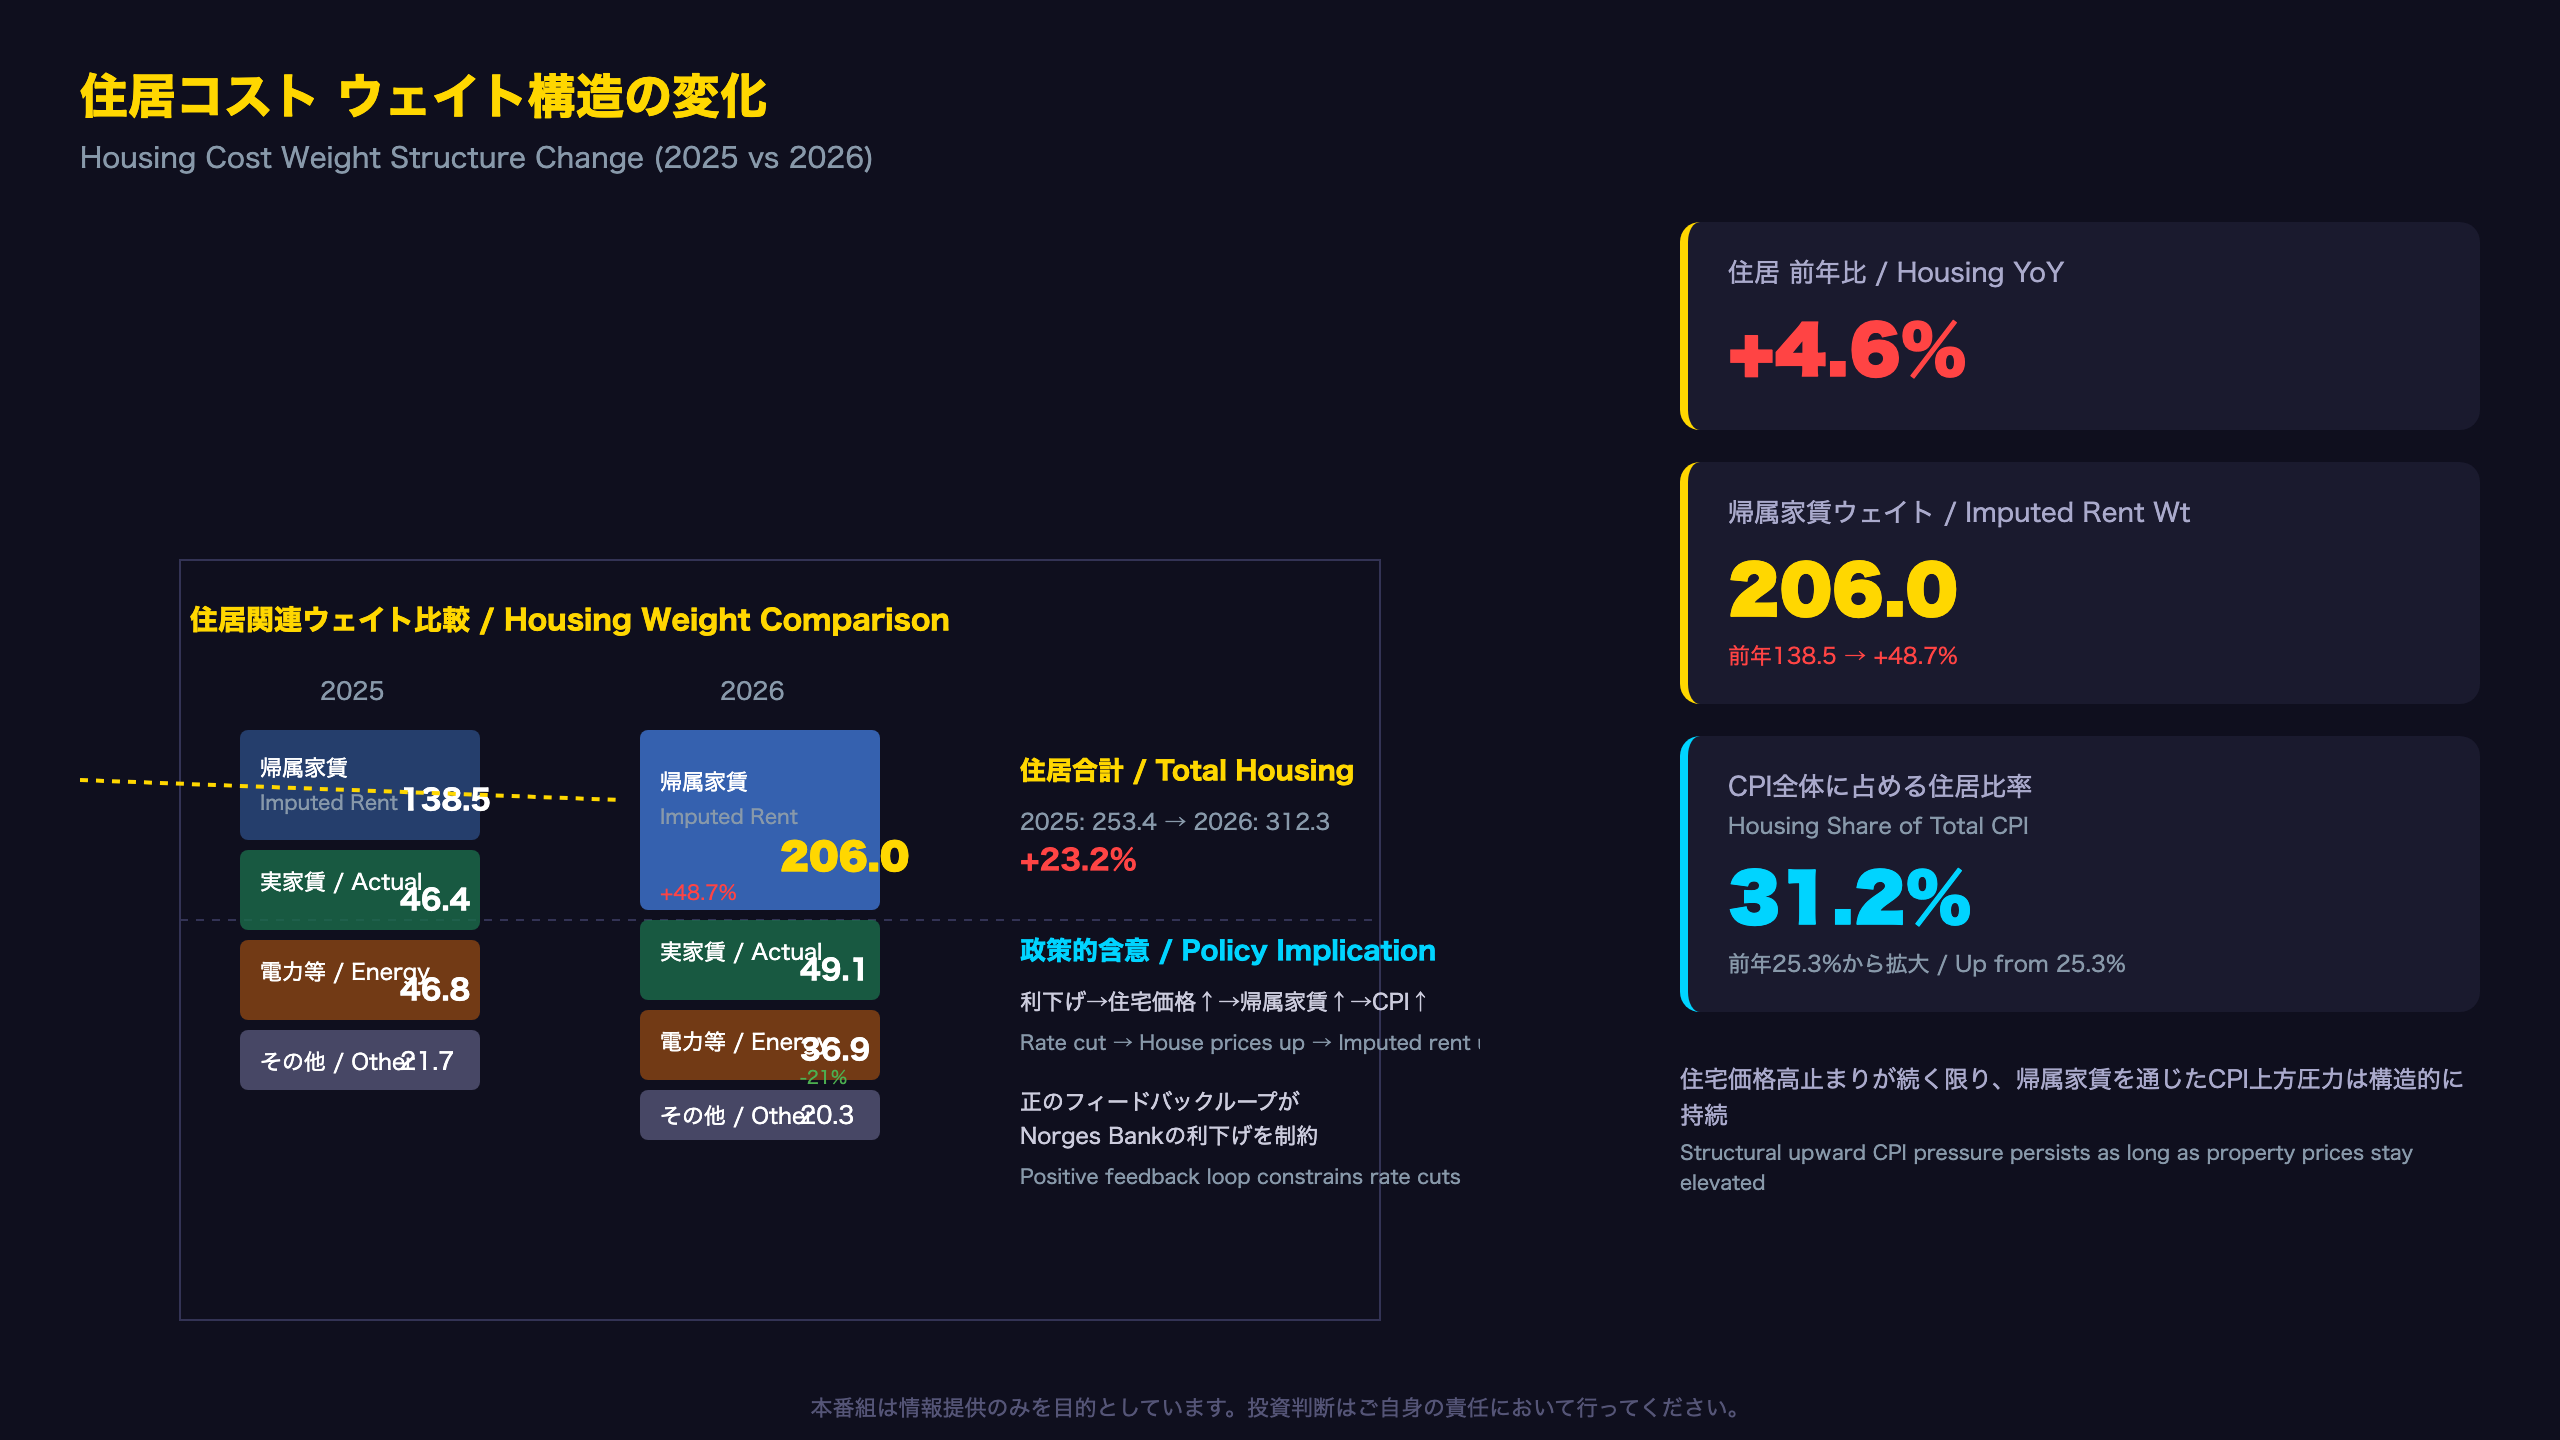
Housing’s weight expanded from 253.4 to 312.3 — a 23% increase. Most dramatically, imputed rents (owner-occupied housing costs) jumped from 138.5 to 206.0, a 48.7% increase. This reflects Norway’s rising property prices and means housing costs now exert far greater influence on headline CPI. For context, in the US CPI, shelter accounts for roughly 36% of the basket; Norway’s housing weight at 31.2% is approaching similar dominance.
Insurance & Financial Services Deep Dive
Insurance weight fell (13.7→11.8) while financial services expanded (11.7→15.4, +32%). The +7.9% YoY inflation in this category likely reflects higher mortgage-related fees and insurance premiums adjusting to elevated property values. This is a feedback loop: higher house prices → higher insurance costs → higher CPI.
The Labor-Intensive Services Puzzle
SSB publishes a unique breakdown: “Services where labor dominates” shows just +0.1% YoY including administered prices, but +3.8% excluding them. This 3.7 percentage point gap reveals that government-controlled prices (childcare, public transport, healthcare) are being deliberately held down, masking the true extent of wage-driven services inflation in the market sector.
Comparison with Eurozone
The ECB’s services HICP for the Eurozone was running around 3.8-4.0% in mid-2026. Norway’s market-priced services inflation at +3.8% is comparable, suggesting similar wage-price dynamics across Northern Europe despite different monetary policy frameworks.
住居コストの構造変化:帰属家賃ウェイト急拡大の意味
Understanding Imputed Rents in Norway’s CPI
Norway’s CPI uses the “rental equivalence” approach for owner-occupied housing — estimating what homeowners would pay if they rented their property on the open market. This is conceptually similar to the US Bureau of Labor Statistics’ Owners’ Equivalent Rent (OER), which accounts for roughly 27% of the US CPI basket.
The Weight Explosion: 138.5 → 206.0
Imputed rents’ weight surged 48.7% between the 2025 and 2026 baskets. This is extraordinary. For context, total CPI weights sum to 1,000, so imputed rents alone now account for 20.6% of the entire Norwegian CPI basket — up from 13.9% a year ago. This single category now has more influence on headline CPI than food, transport, or any other individual component.
Why This Matters for Norges Bank
The policy dilemma is clear:
- Rate cuts → Lower mortgage rates → Higher housing demand → Higher property prices → Higher imputed rents → Higher CPI
- Rate holds → Continued mortgage pressure on households → Potential consumption drag → But CPI stays elevated via housing
This creates a structural floor under measured inflation that is largely insensitive to demand conditions in the broader economy. Even if consumer spending weakens, housing costs will continue pushing CPI higher as long as property prices remain elevated.
International Comparison: Housing in CPI Baskets
| Country | Housing Weight | Includes Imputed Rent? |
|---|---|---|
| Norway CPI | 31.2% | Yes (20.6% alone) |
| US CPI | ~36% | Yes (OER ~27%) |
| Eurozone HICP | ~16% | No |
| UK CPI | ~14% | No (CPIH does) |
This means Norway’s CPI is structurally more sensitive to property market dynamics than the Eurozone’s HICP. Investors comparing Norwegian inflation to ECB targets should adjust for this methodological difference.
Energy Weight Decline
Electricity, gas and fuels weight fell from 46.8 to 36.9 (-21%). This reduces the direct pass-through of energy price volatility into headline CPI, potentially making future readings less volatile but more persistently driven by housing and services.
月次推移とベース効果:8月以降のCPI見通し
Monthly CPI Trajectory: Decoding the 2026 Path
Index Levels and YoY Calculations
| Month | 2026 Index | 2025 Index | YoY |
|---|---|---|---|
| Jan | 101.6 | 98.1 | +3.6% |
| Feb | 102.2 | 99.5 | +2.7% |
| Mar | 102.4 | 98.8 | +3.6% |
| Apr | 102.8 | 99.4 | +3.4% |
| May | 103.0 | 99.9 | +3.1% |
| Jun | 102.8 | 100.1 | +2.7% |
| Jul | 103.8 | 100.8 | +3.0% |
The year-over-year rate has oscillated between 2.7% and 3.6% throughout 2026, with no clear downward trend. This is significant because Norges Bank targets 2% inflation over time.
Base Effect Analysis for August
In 2025, the CPI index dropped from 100.8 (July) to 100.2 (August) — a 0.6-point decline. This creates a favorable base for August 2026’s year-over-year calculation:
- If Aug 2026 index stays flat at 103.8: YoY = +3.6%
- If Aug 2026 drops 0.6pts (matching 2025 seasonal): YoY = +3.0%
- If Aug 2026 drops 1.0pt: YoY = +2.6%
The base effect suggests that unless August sees an unusually large monthly decline, headline CPI will remain at or above 3%.
Seasonal Patterns in Norwegian CPI
Historically, Norwegian CPI shows:
– January: Strong increase (new year price adjustments, tax changes)
– June-July: Mixed (summer sales in clothing offset by food/travel increases)
– August: Typically a slight decline (end of summer, back-to-school effects)
SSB uses X-12-ARIMA for seasonal adjustment. The raw monthly changes should be interpreted with these patterns in mind.
What This Means for Rate Expectations
With headline CPI likely to remain around 3% through Q3 2026, and CPI-ATE at 2.7% (well above the 2% target), market pricing for Norges Bank rate cuts may need to be pushed further out. The September 10 release (August data) will be critical for confirming whether the 3% level has become entrenched.
インプリケーション:Norges Bank利下げシナリオと市場への示唆
Norges Bank Policy Framework and Today’s Data
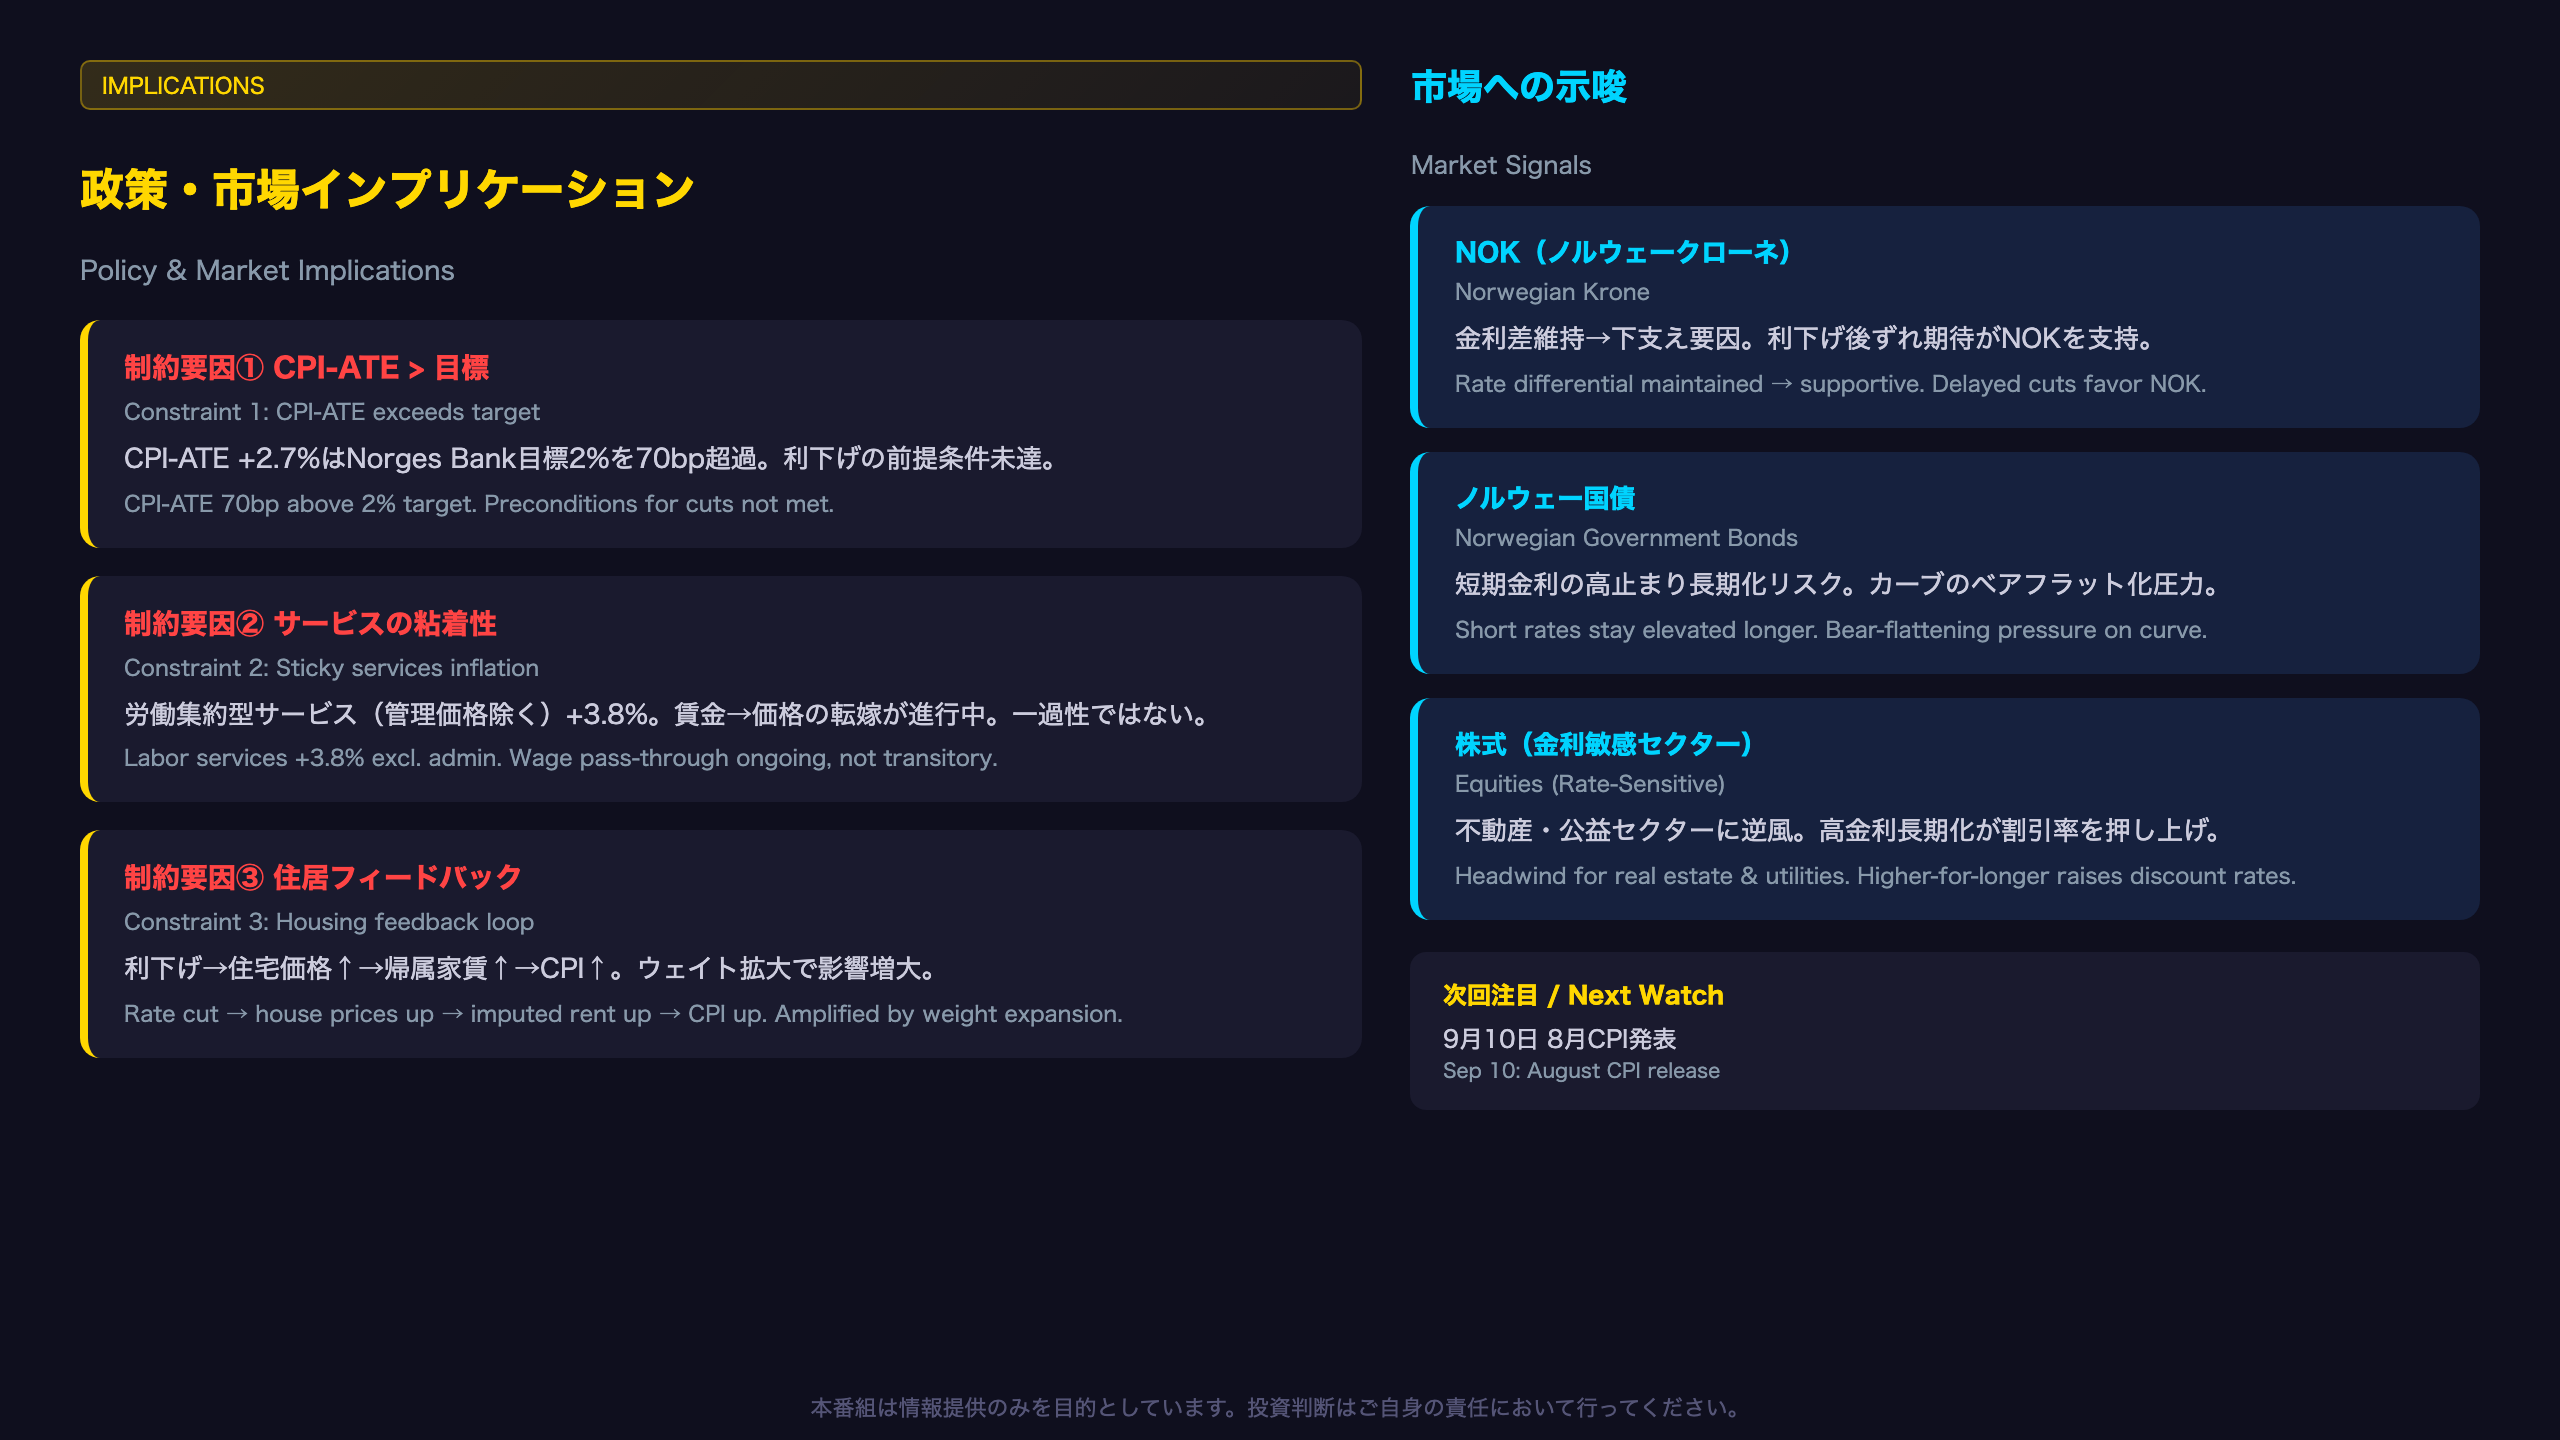
Norges Bank targets “close to 2 percent over time” using CPI-ATE as its operational inflation measure. With CPI-ATE at 2.7% — 70 basis points above target — the data does not support initiating rate cuts.
Market Transmission Channels
The stickiness of services inflation transmits to markets through several channels:
- Short-term rates: Delayed rate-cut expectations → Higher short-end NOK rates
- FX (NOK): Maintained rate differential vs EUR/SEK → NOK support
- Long bonds: Inflation premium → Bear-flattening pressure on the yield curve
- Equities: Higher-for-longer rates → Pressure on rate-sensitive sectors (real estate, utilities)
The Bull Case for Rate Cuts (Counterargument)
Investors should also consider factors supporting eventual easing:
- Food inflation at just +1.1% YoY suggests no broad-based demand overheating
- Durable goods (furnishings +0.5%, clothing +2.9%) remain well-contained
- Personal care & social protection at -2.1% YoY — outright deflation in some categories
- Global disinflationary forces (China export prices, tech deflation) may eventually weigh
Norway vs Peers: Rate Cut Timing
| Central Bank | Current Rate | CPI (Latest) | Core Inflation | Rate Cut Started? |
|---|---|---|---|---|
| Norges Bank | TBD | 3.0% | 2.7% (CPI-ATE) | No |
| ECB | ~3.0% | ~2.3% | ~2.7% | Yes (2024) |
| Riksbank (Sweden) | ~3.0% | ~2.0% | ~2.5% | Yes (2024) |
| Fed | ~4.5% | ~2.8% | ~3.0% | Partial |
Norway’s core inflation is comparable to peers who have already begun cutting, but the headline acceleration to 3.0% and the housing weight structural issue create unique constraints.
Key Dates to Watch
- September 10, 2026: August CPI release — will 3%+ become entrenched?
- Next Norges Bank rate decision: Watch for any shift in forward guidance language
- Q3 GDP data: If growth weakens materially, it could tip the balance toward cuts despite sticky inflation
Disclaimer: This article is for informational purposes only. All investment decisions are made solely at your own risk.