📺 Watch the Full Video Analysis
This article was automatically generated by the NFC Market Live AI analysis system. (Updated: 2026-10-15 13:47 JST)
📄 Primary Source
NFC Market Live
https://www.meti.go.jp/statistics/tyo/iip/result/pdf/press/b2020_202608sj.pdf, https://www.meti.go.jp/statistics/tyo/iip/result/pdf/reference/b2020_202608refsj.pdf, https://www.meti.go.jp/statistics/tyo/iip/result/pdf/real/b2020_202608figsj.pdf
📊 A walkthrough of Japan’s August Indices of Industrial Production (preliminary), released by METI on Sep 30, 2026.
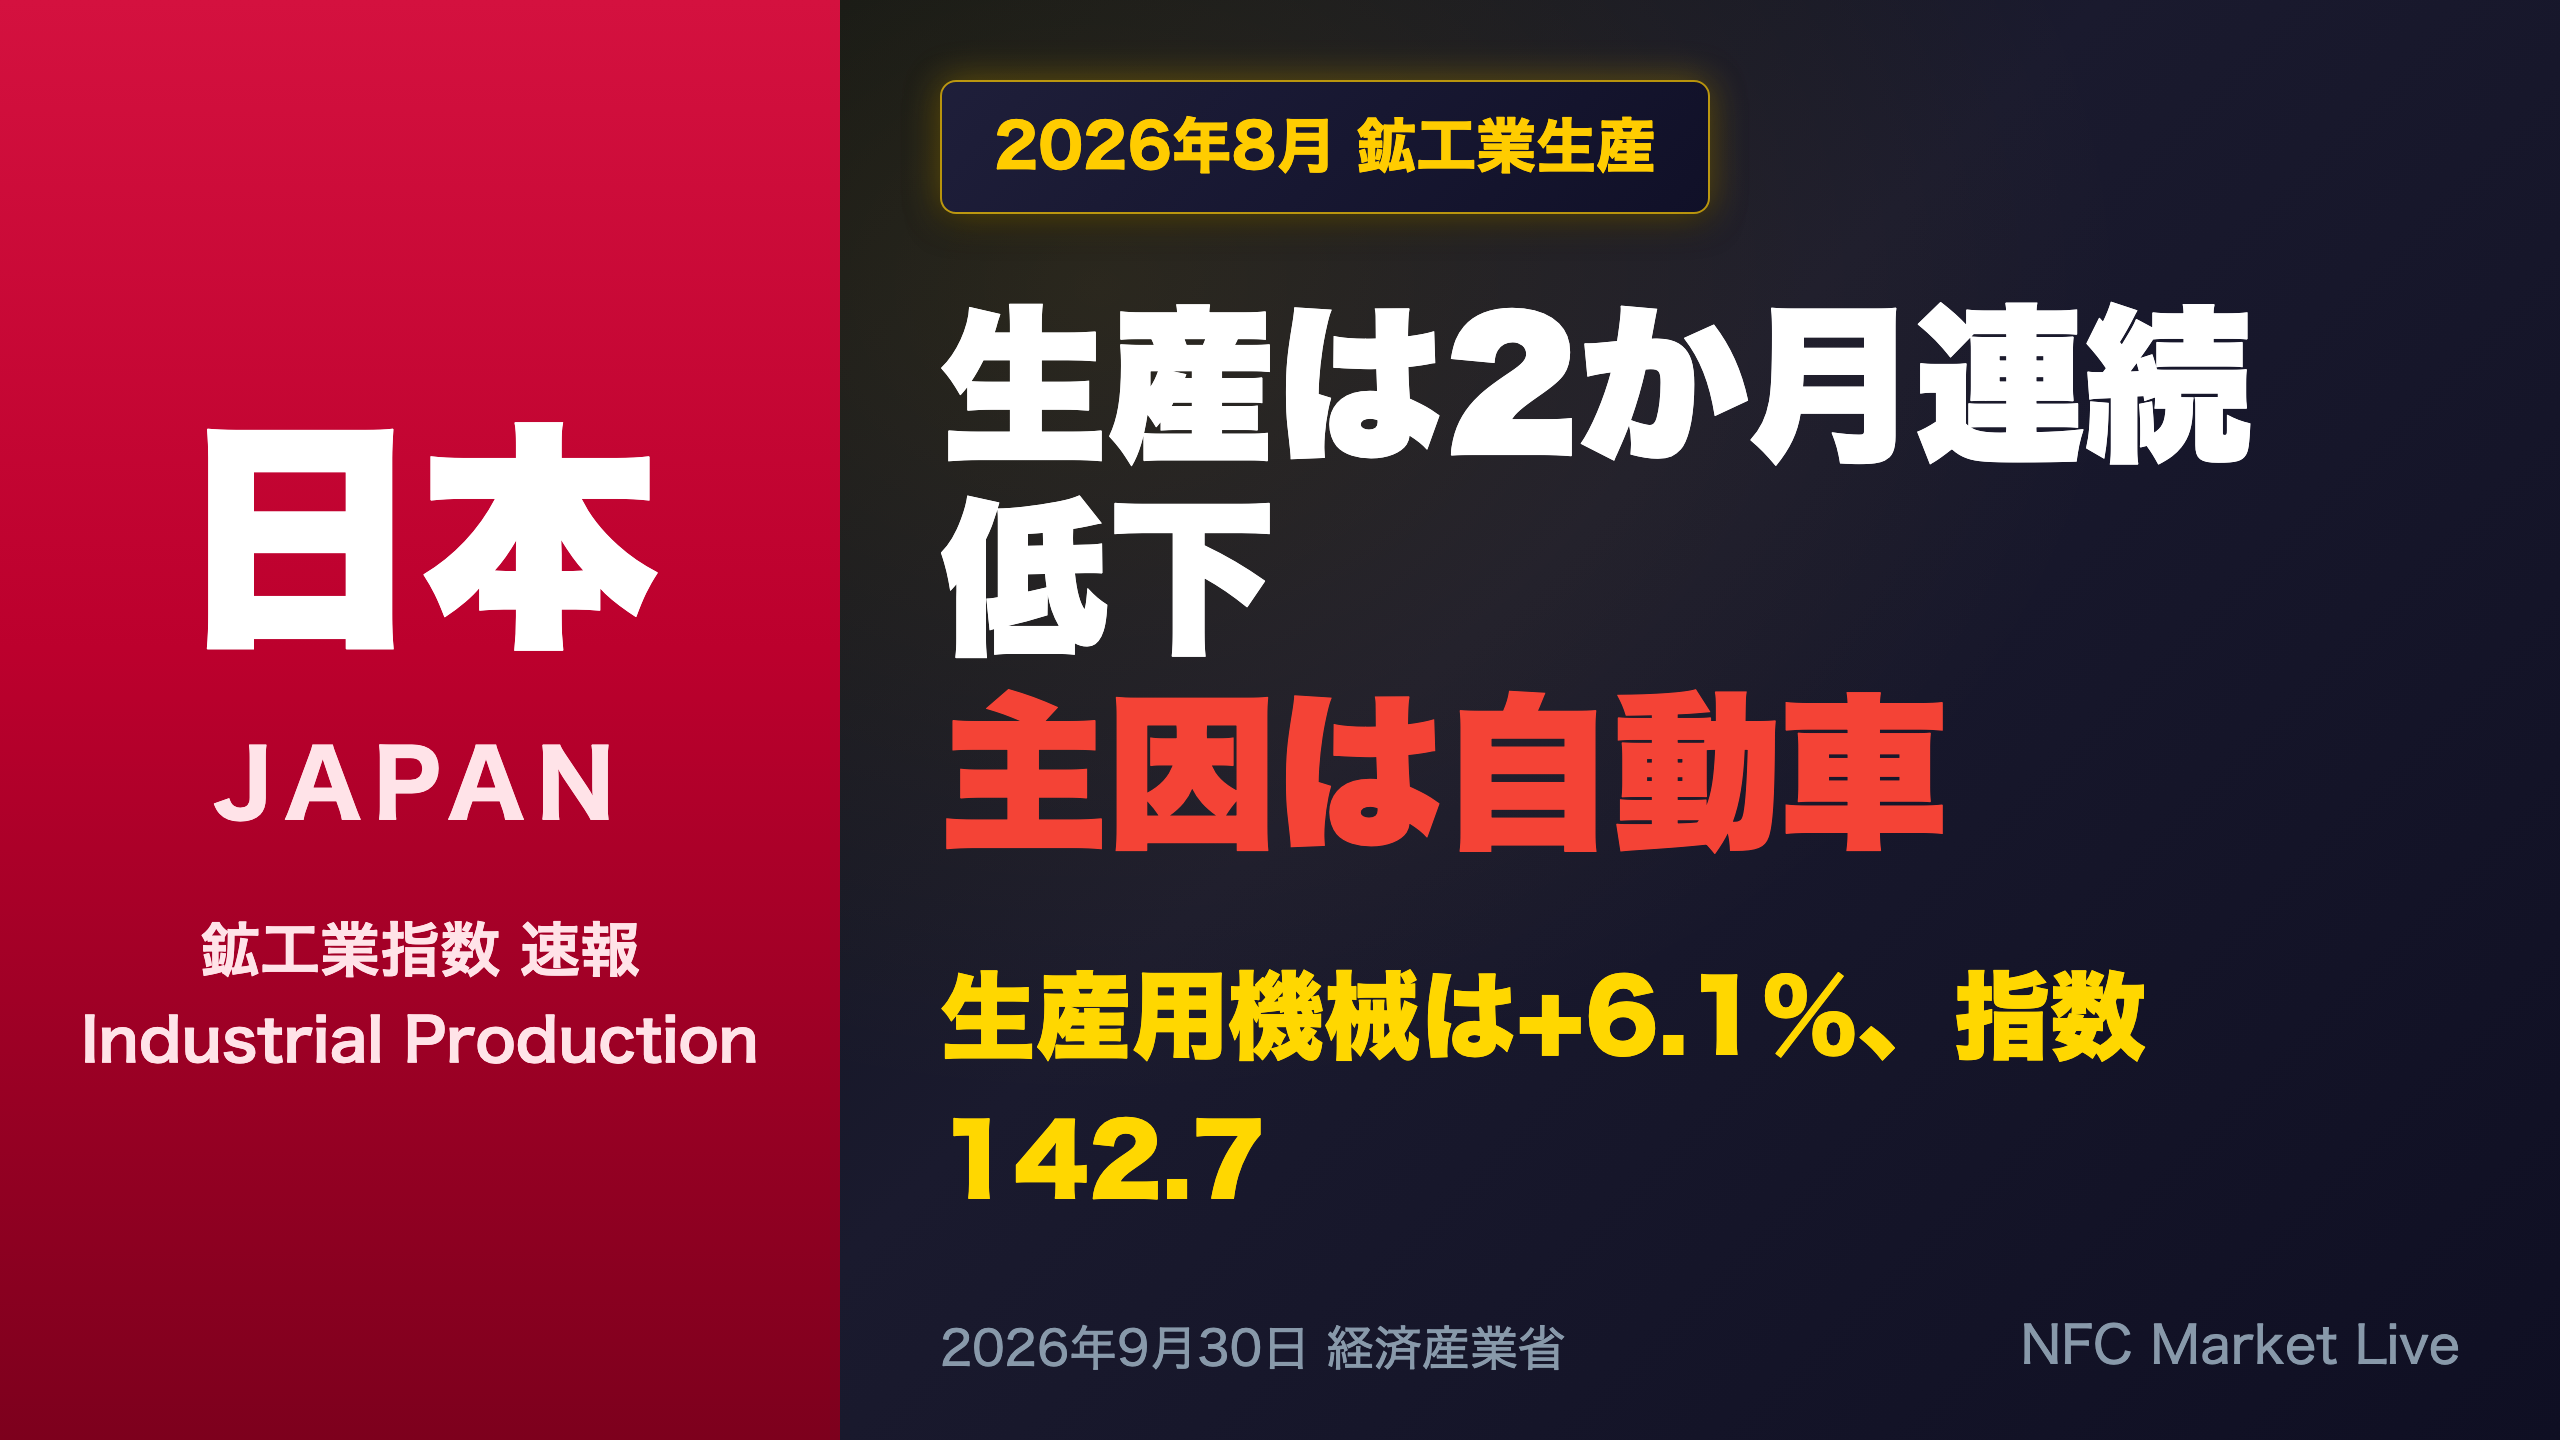
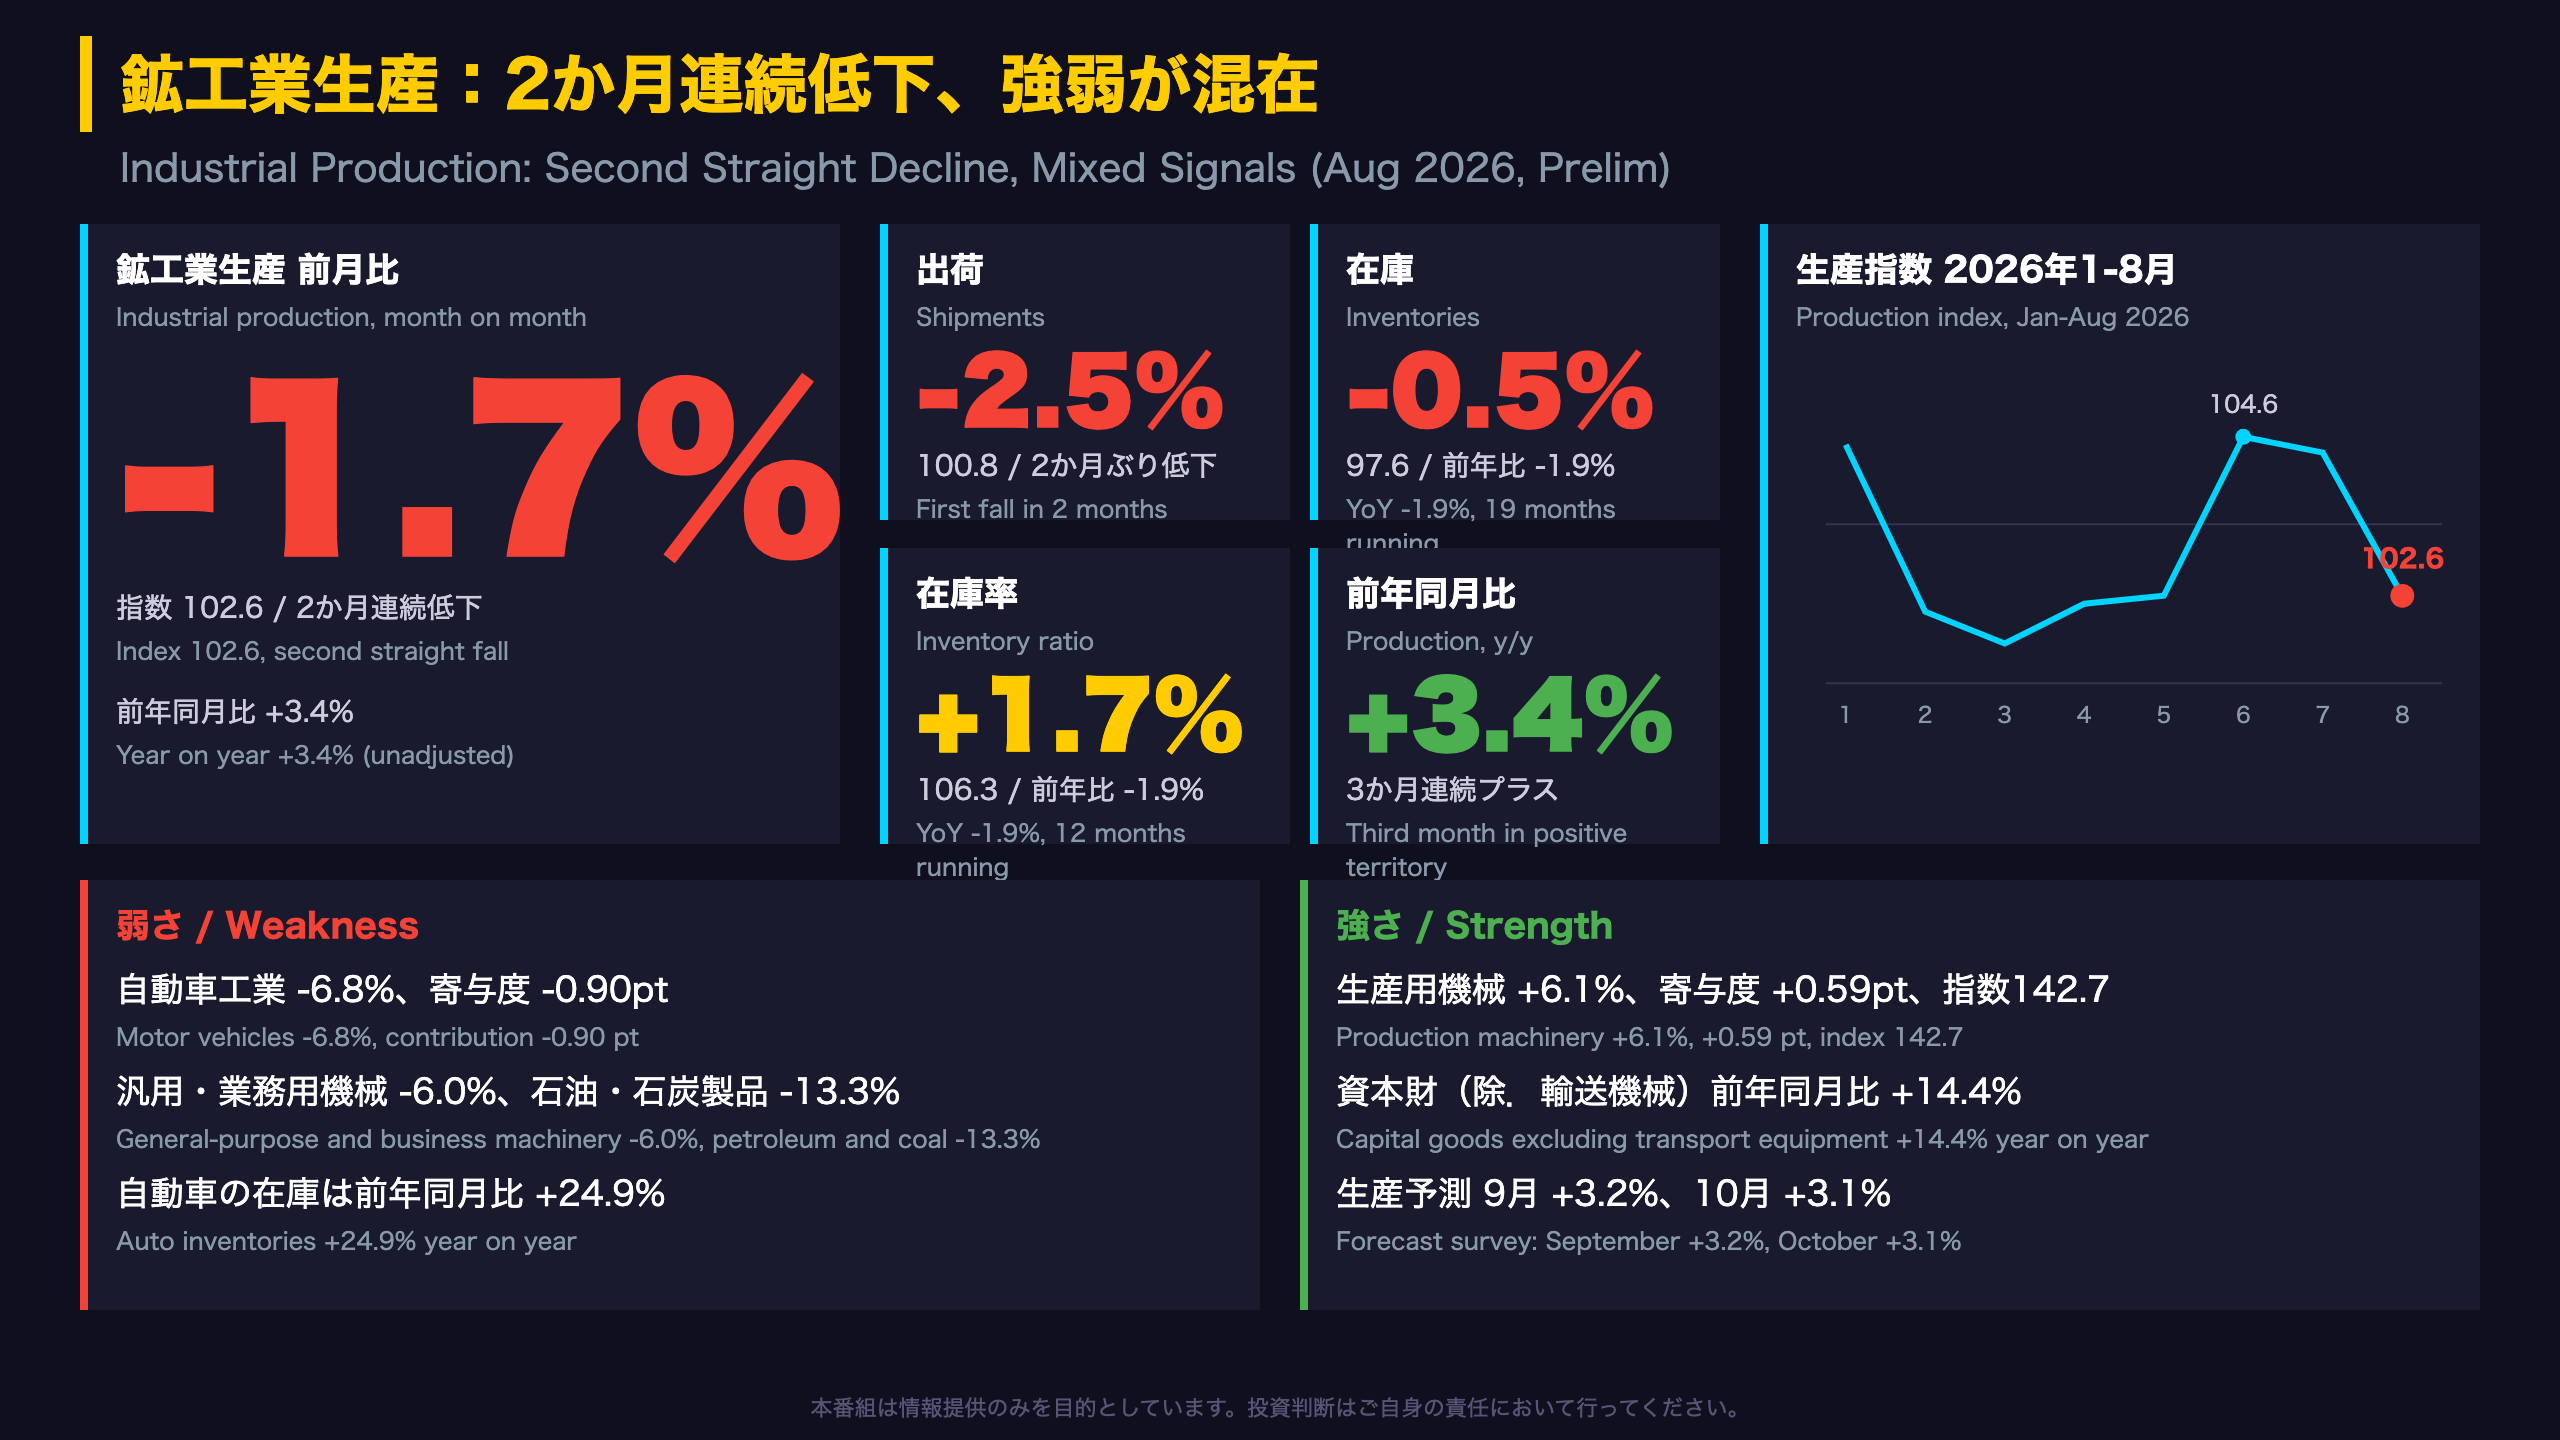
📉 Production fell 1.7% m/m to 102.6, a second straight decline, but remains 3.4% above a year earlier.
🚗 Autos were the main drag (-6.8%, -0.90 pt), while production machinery rose 6.1% to 142.7.
📦 Shipments -2.5%, inventories -0.5%, inventory ratio +1.7%. Total inventories are down 1.9% y/y, yet auto inventories are up 24.9% y/y.
🔭 The forecast survey points to +3.2% in Sep and +3.1% in Oct; METI’s corrected estimate for Sep is +1.6%.
💡 We lay out both the strengths and the weaknesses in the data.
The Ultimate Summary:生産は2か月連続低下、強弱が混在
August Industrial Production: Reading Japan’s Factory Data
The Indices of Industrial Production (IIP) are compiled by the Ministry of Economy, Trade and Industry (METI) from its monthly Current Survey of Production. The base year is 2020 = 100, and the figures released on Sep 30, 2026 are preliminary. It is the Japanese counterpart of the Federal Reserve’s US industrial production report, but METI publishes shipments, inventories and an inventory ratio in the same release, plus a forward-looking forecast survey of manufacturers.
Headline figures (seasonally adjusted)
- Production: 102.6, -1.7% m/m, a second consecutive fall; +3.4% y/y (unadjusted)
- Shipments: 100.8, -2.5% m/m
- Inventories: 97.6, -0.5% m/m; down y/y for the 19th straight month
- Inventory ratio: 106.3, +1.7% m/m
METI kept its assessment at “production is moving sideways”, the same wording used since July 2024. A single-month decline does not by itself show a trend break: 102.6 equals May’s level, and the February-May range was 102.0-102.6.
What the report does not say
The release carries no statement on monetary policy or market pricing, and no capacity-utilization data. Unlike the US index, which includes utilities, Japan’s headline IIP covers mining and manufacturing, with utilities shown separately as a reference series.
増減の主役:自動車の下押しと生産用機械の押し上げ
Who Drove the Move: Autos Versus Production Machinery
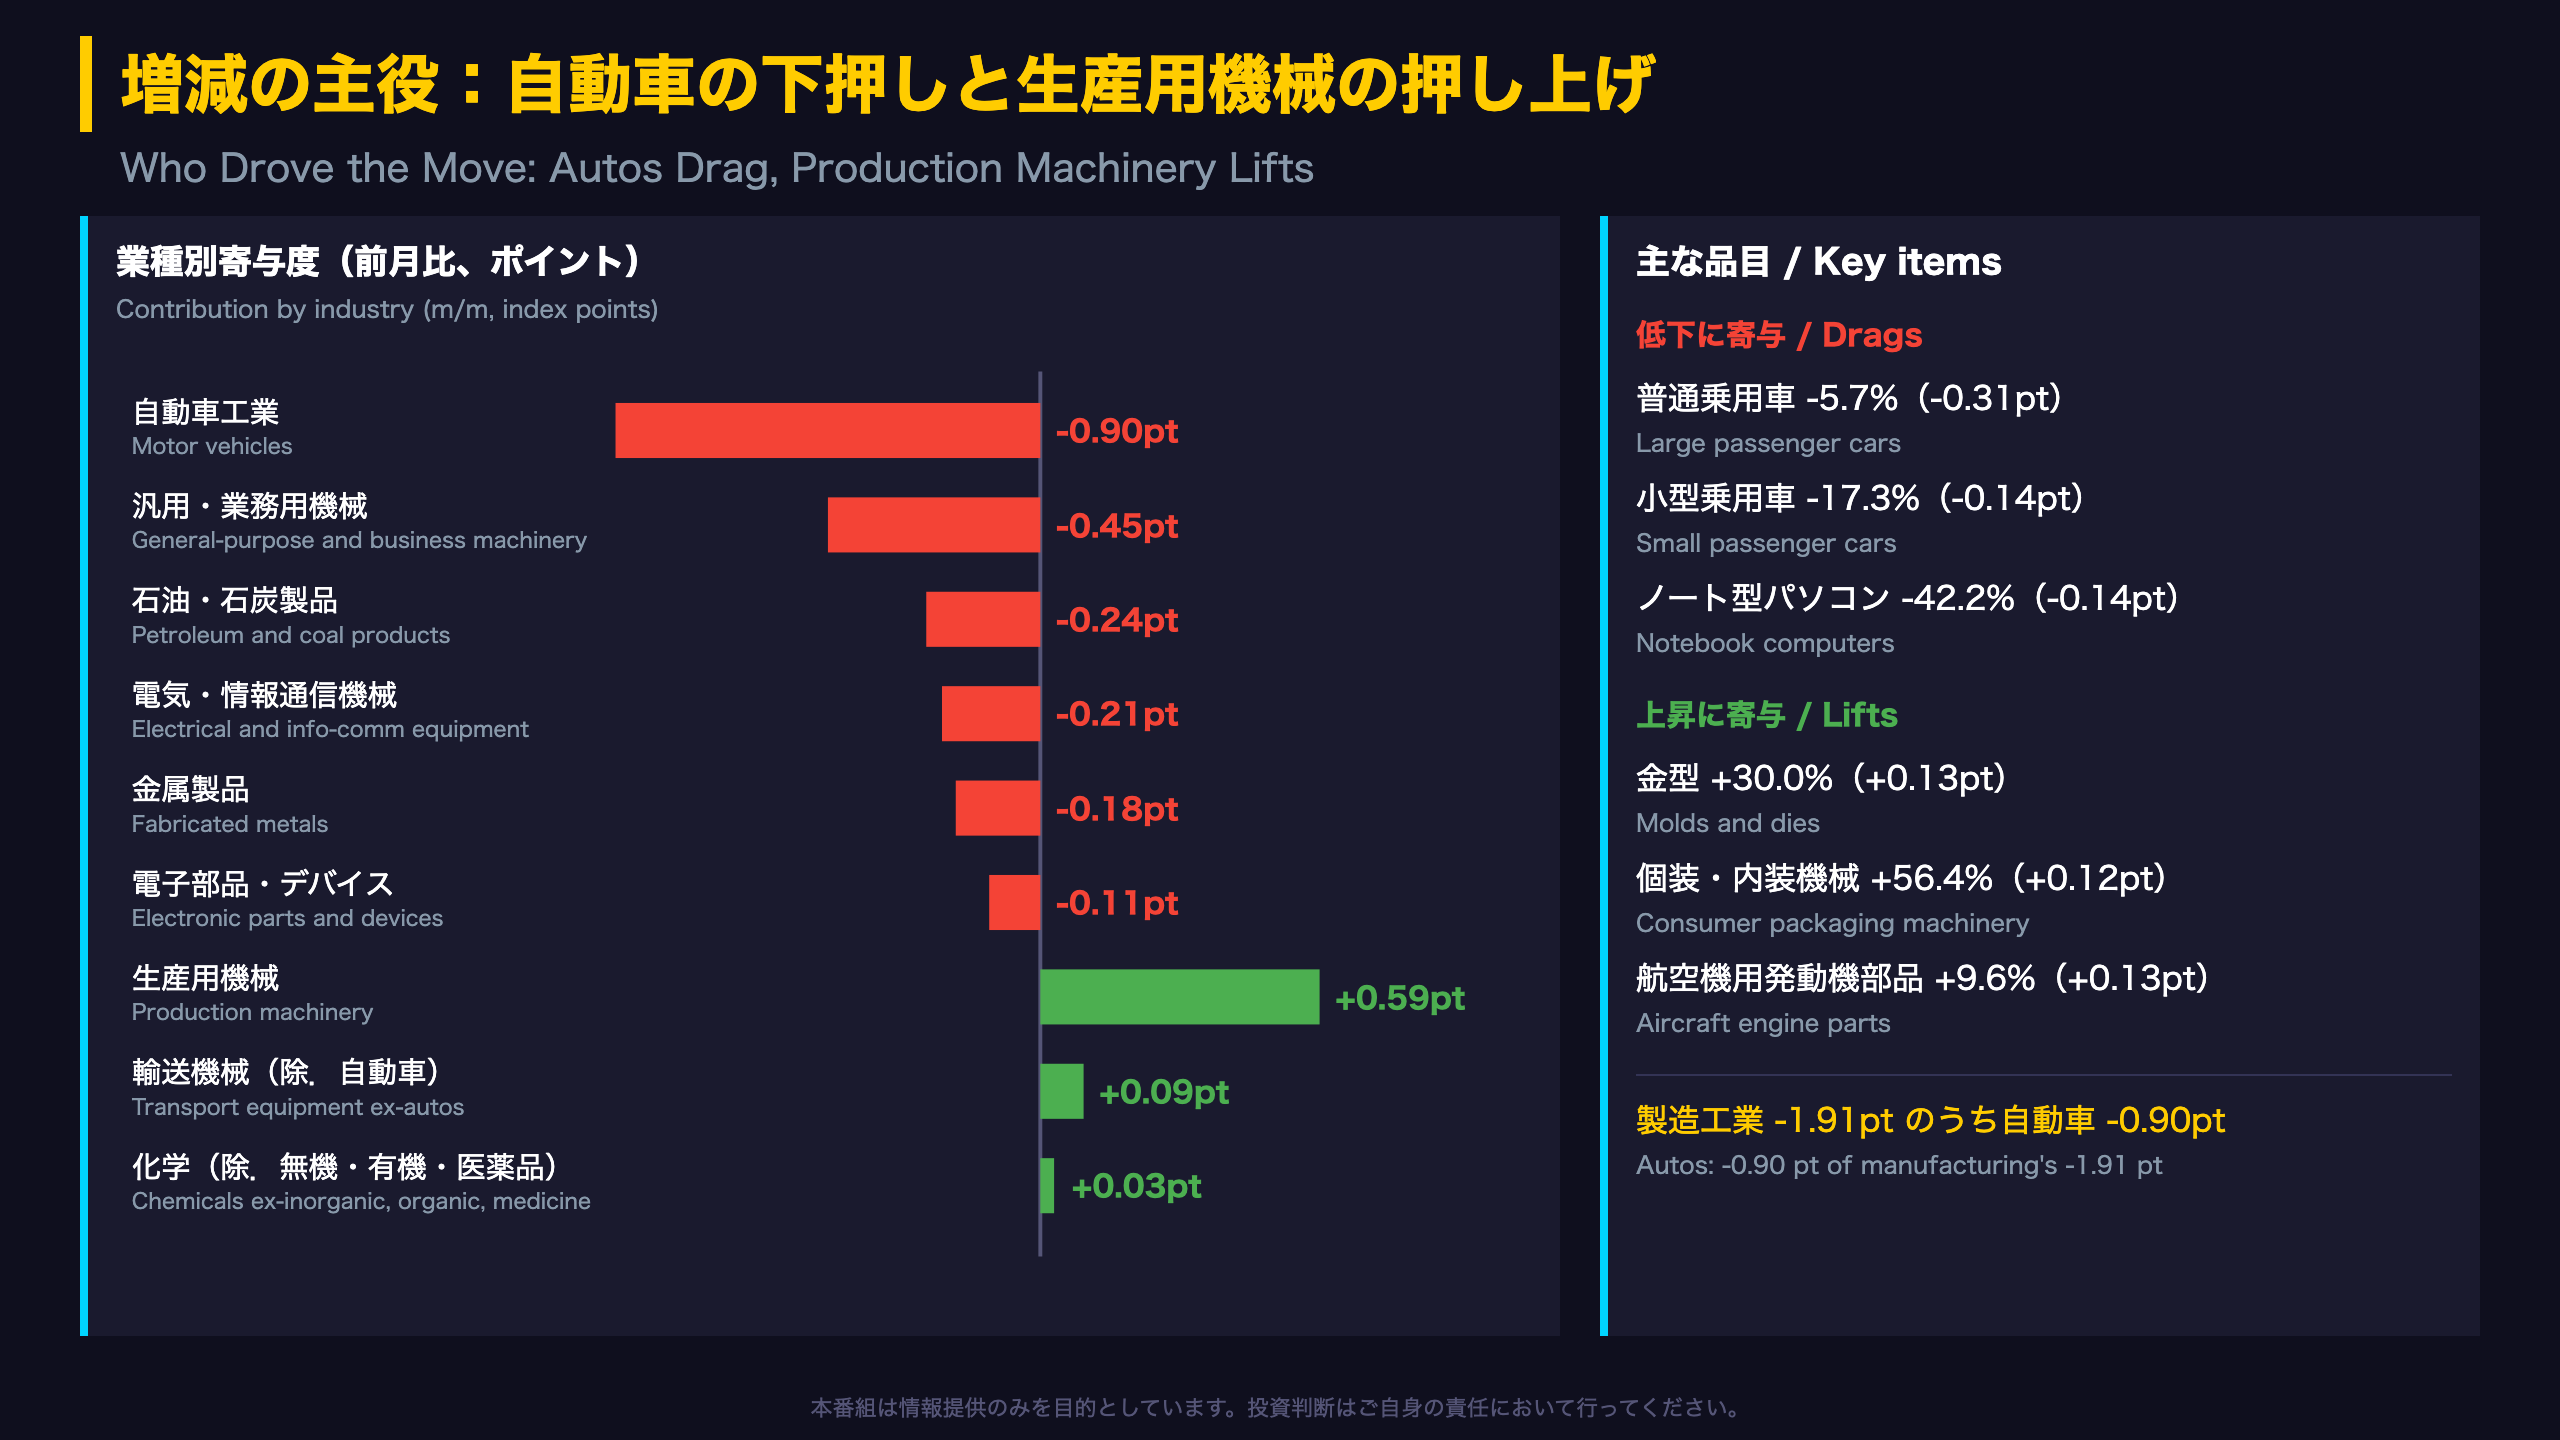
METI’s contribution figures show how many index points each industry added to or removed from total production. Manufacturing as a whole contributed -1.91 points in August.
- Motor vehicles: -6.8% m/m, -0.90 pt (large passenger cars -5.7%, small passenger cars -17.3%)
- General-purpose and business-oriented machinery: -6.0%, -0.45 pt
- Petroleum and coal products: -13.3%, -0.24 pt
- Production machinery: +6.1%, +0.59 pt (molds +30.0%, packaging machinery +56.4%)
- Transport equipment ex-autos: +2.9% (aircraft engine parts +9.6%)
Shipments tell a different story
Transport equipment ex-autos rose in production, but its shipments fell 19.5% (-0.55 pt), led by marine diesel engines (-31.4%). Deliveries of ships and aircraft parts can be lumpy from month to month, so this is a possible one-month swing rather than a trend.
Two readings
The cautious view treats simultaneous declines in autos and general machinery as softer demand. The constructive view notes that autos rose 0.8% in July and that production machinery has now risen three months in a row. Neither can be settled with one month of data.
Context for non-Japan specialists
The industry weights in Japan’s index differ from the US index, which also includes utilities. Japan’s headline series covers mining and manufacturing only, so a machinery-led gain can offset an auto decline more visibly.
在庫サイクルの診断:全体は低水準、偏りは自動車
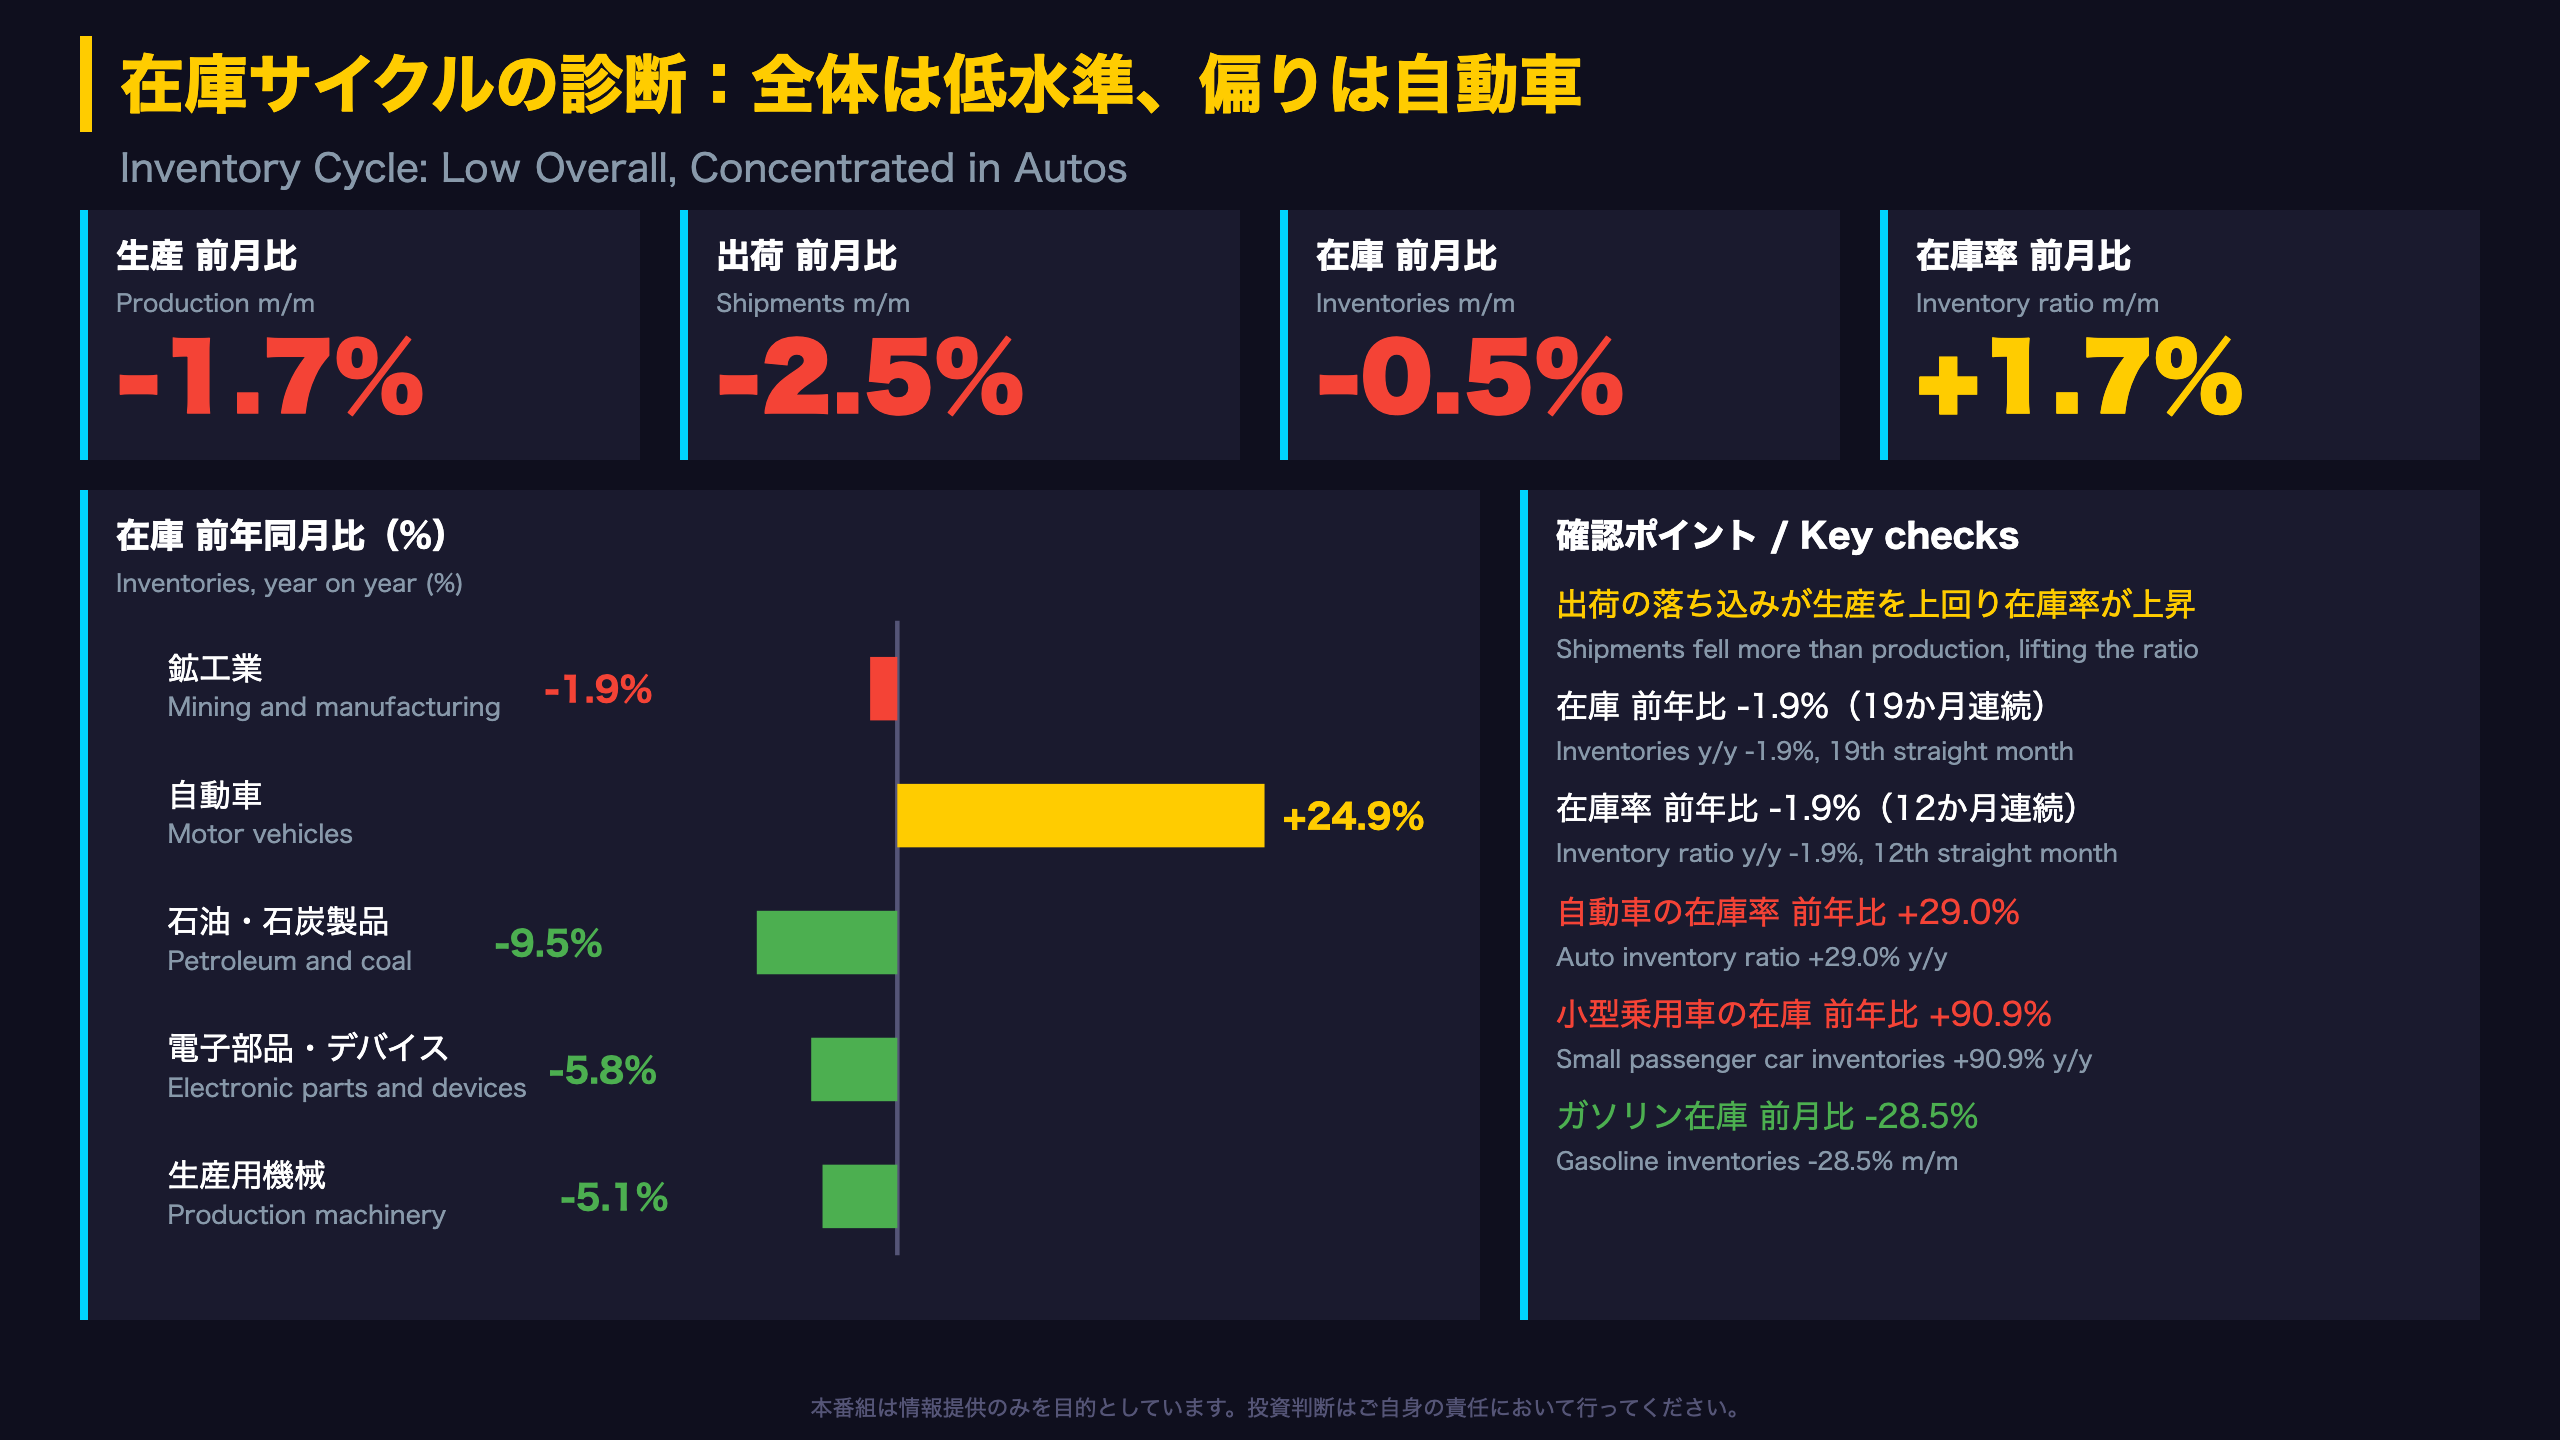
Inventory Cycle: Low Overall, Concentrated in Autos
In METI’s framework, the inventory ratio compares stocks with shipments (and for some items with production). A rising ratio can reflect either unwanted stock build-up or a temporary dip in sales; the level of inventories against last year helps tell the two apart.
| Category | Inventories m/m | Inventories y/y | Ratio m/m |
|---|---|---|---|
| Mining and manufacturing | -0.5% | -1.9% | +1.7% |
| Motor vehicles | -3.3% | +24.9% | +6.5% |
| Electrical and info-comm | 0.0% | -11.7% | +10.6% |
| Production machinery | -1.3% | -5.1% | -4.9% |
| Petroleum and coal | -15.0% | -9.5% | -2.5% |
Reading the cycle
METI’s inventory-cycle chart plots production against inventories, both year on year. For the third quarter, it uses the June-August average for production and the August-end level for inventories. Production was above last year in each of those months (+4.9%, +3.9%, +3.4%), while inventories at August-end were 1.9% below last year.
Where the ratio rose
The electrical and info-comm ratio jumped 10.6% because shipments fell 3.9% on flat inventories. Autos are different: their inventories are 24.9% above a year ago, and the ratio is up 29.0% y/y, so the build-up looks industry-specific.
Two readings
One reading points to pockets of unintended stock, such as polyethylene (+11.3%) and plastic products (+2.5%) rising while output fell. The other stresses that total inventories have been below last year for 19 months. The September data will show whether autos work down their stocks.
設備投資の芽:生産用機械が牽引
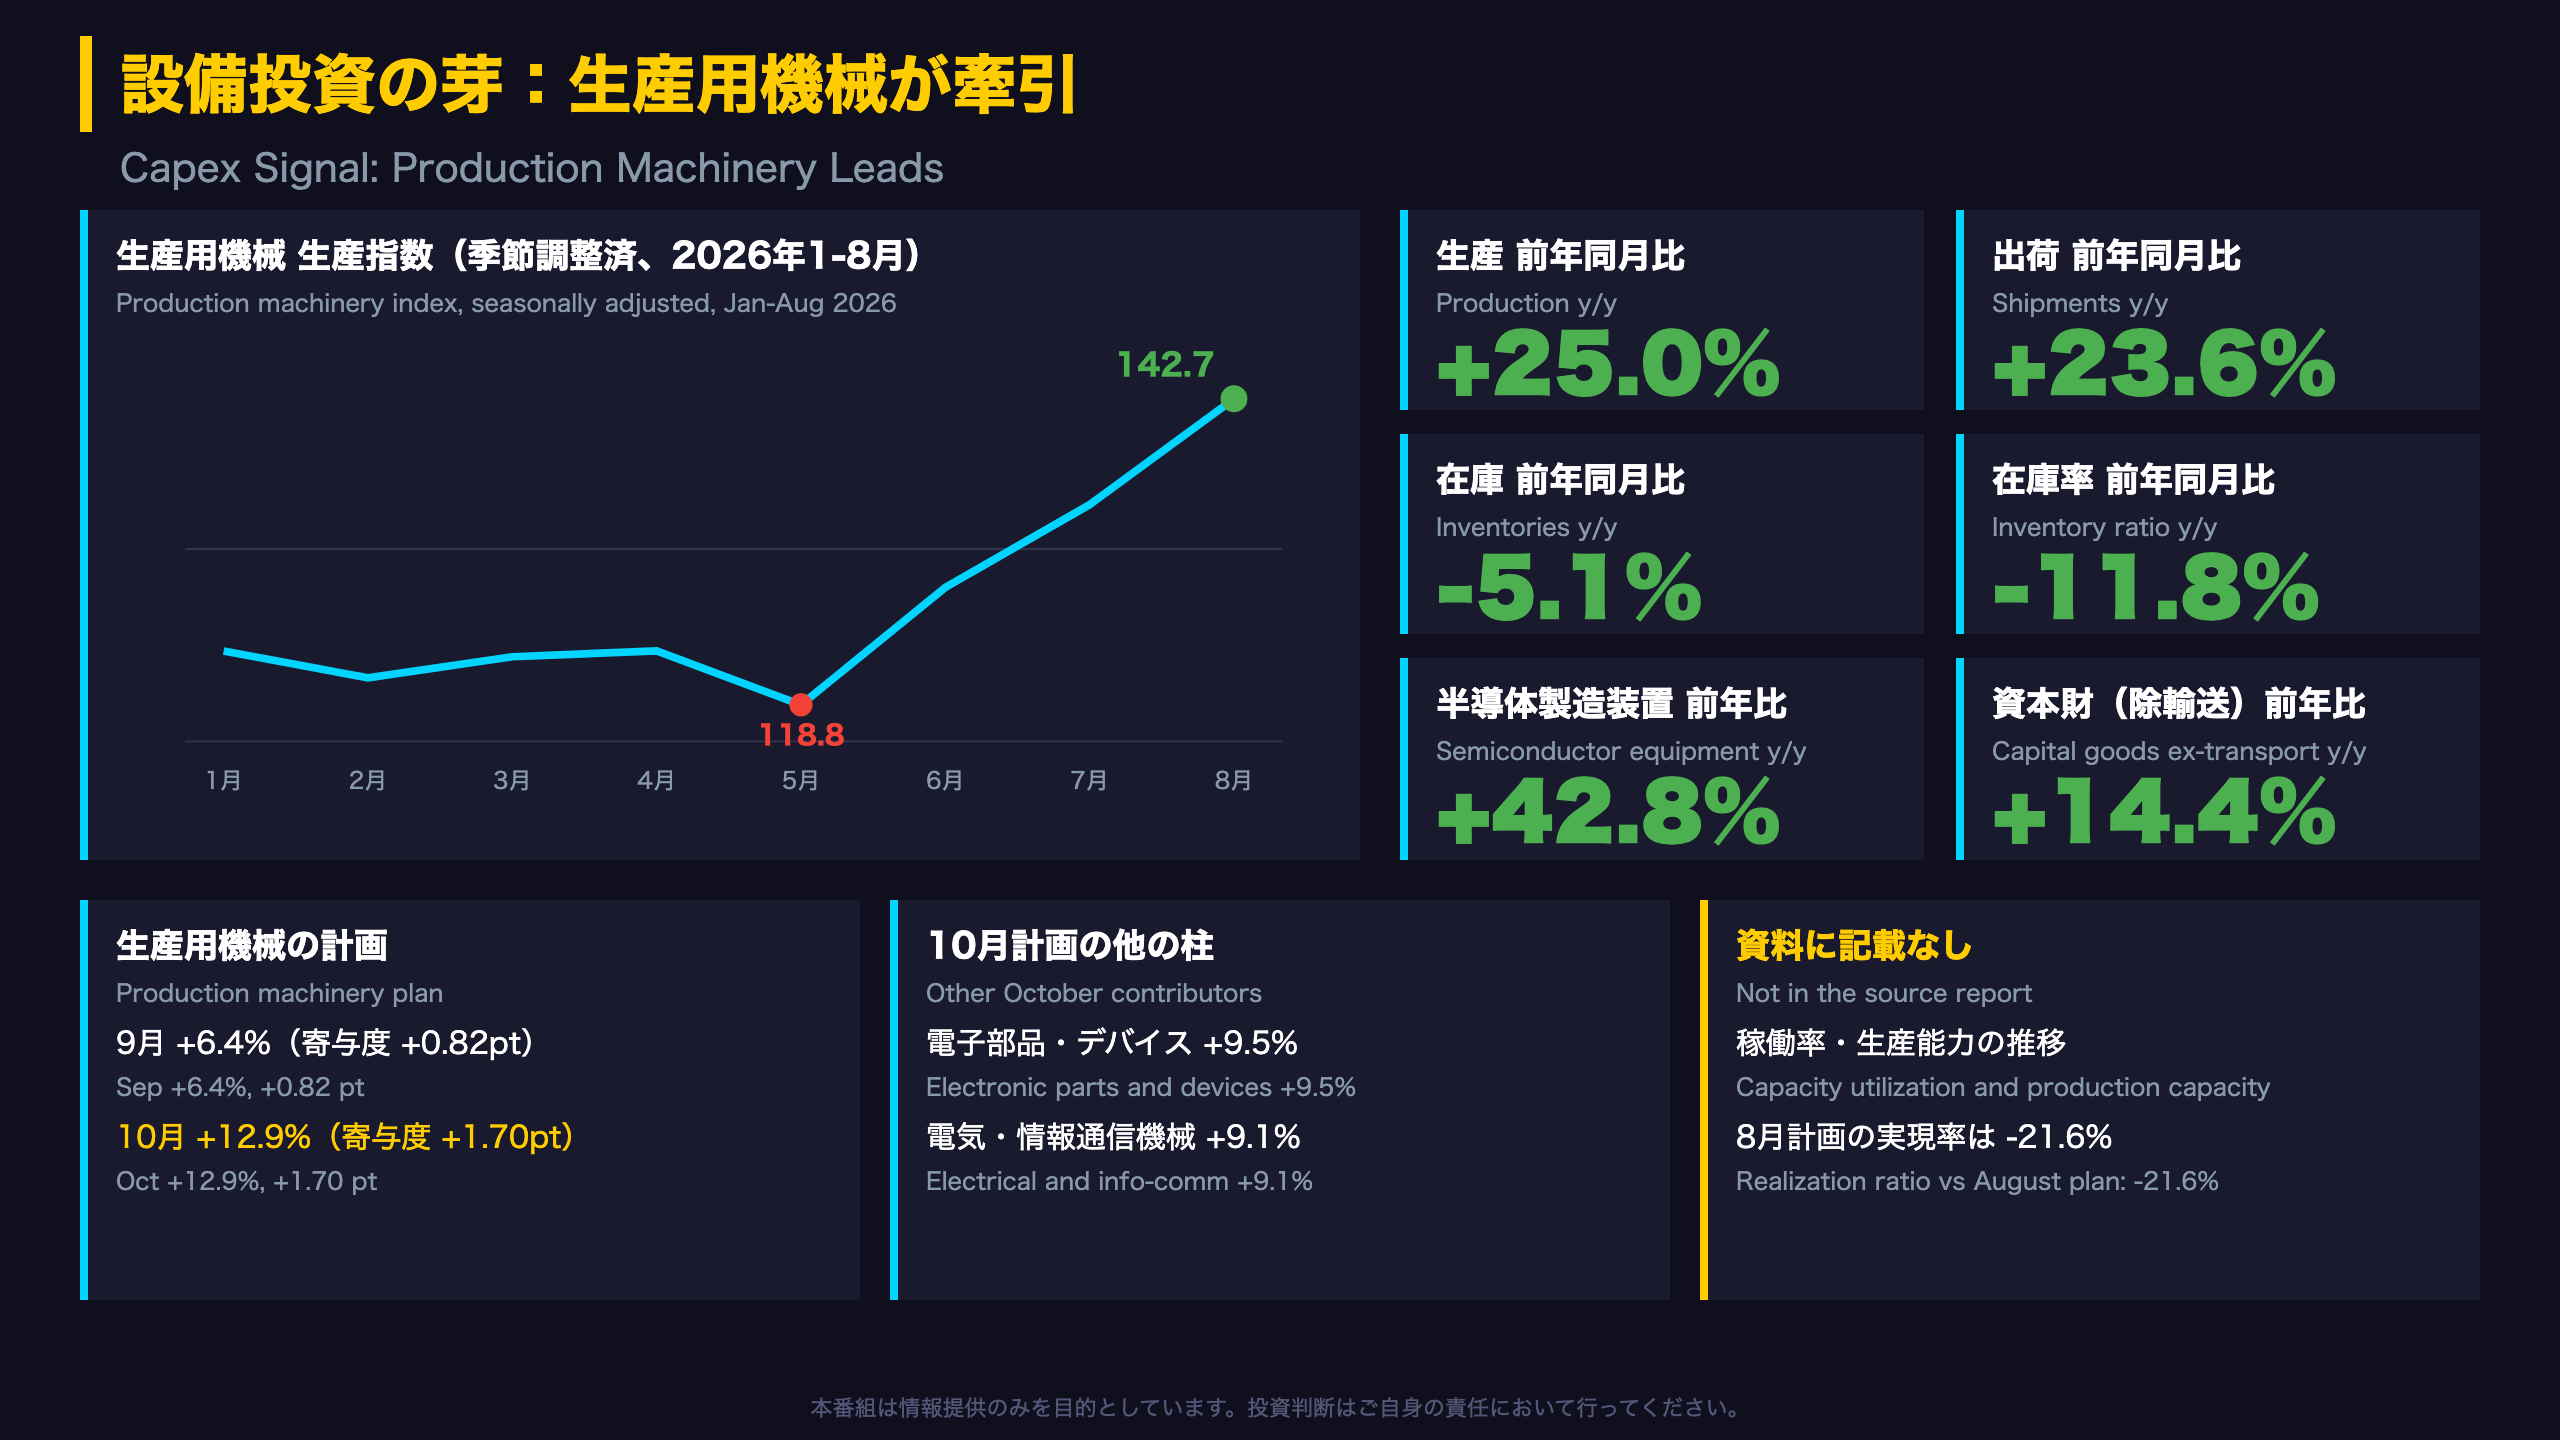
Production Machinery: Trend and Forward Plans
Production index (seasonally adjusted)
| Month | Jan | Feb | Mar | Apr | May | Jun | Jul | Aug |
|---|---|---|---|---|---|---|---|---|
| Index | 123.0 | 120.9 | 122.6 | 123.1 | 118.8 | 128.0 | 134.5 | 142.7 |
Three straight monthly gains have lifted the index 20.1% above May. Production machinery here means industrial equipment such as molds, packaging machinery, industrial robots and semiconductor and flat-panel display manufacturing equipment, and is often read as a proxy for corporate capital spending plans, though METI’s report itself offers no such interpretation.
Supporting data
- Semiconductor manufacturing equipment: +2.3% m/m, +42.8% y/y
- Capital goods ex-transport: +0.2% m/m, +14.4% y/y, shipments +0.7% m/m
- Electronic parts and devices: output -1.9% m/m (-2.4% y/y), but the plan for October is +9.5%
Caveats
The realization ratio for production machinery against the August plan was -21.6%, so plans have tended to overshoot. Capacity utilization and production capacity are not in this release, so statements about the capex cycle cannot be made from this document alone. Reliance on one industry also means a pullback there would matter more.
Comparison
A US analogue would be the equipment-related components of Fed industrial production and durable goods orders for capital goods; those use different definitions and should not be compared level to level.
先行き:予測調査と補正値、次の焦点
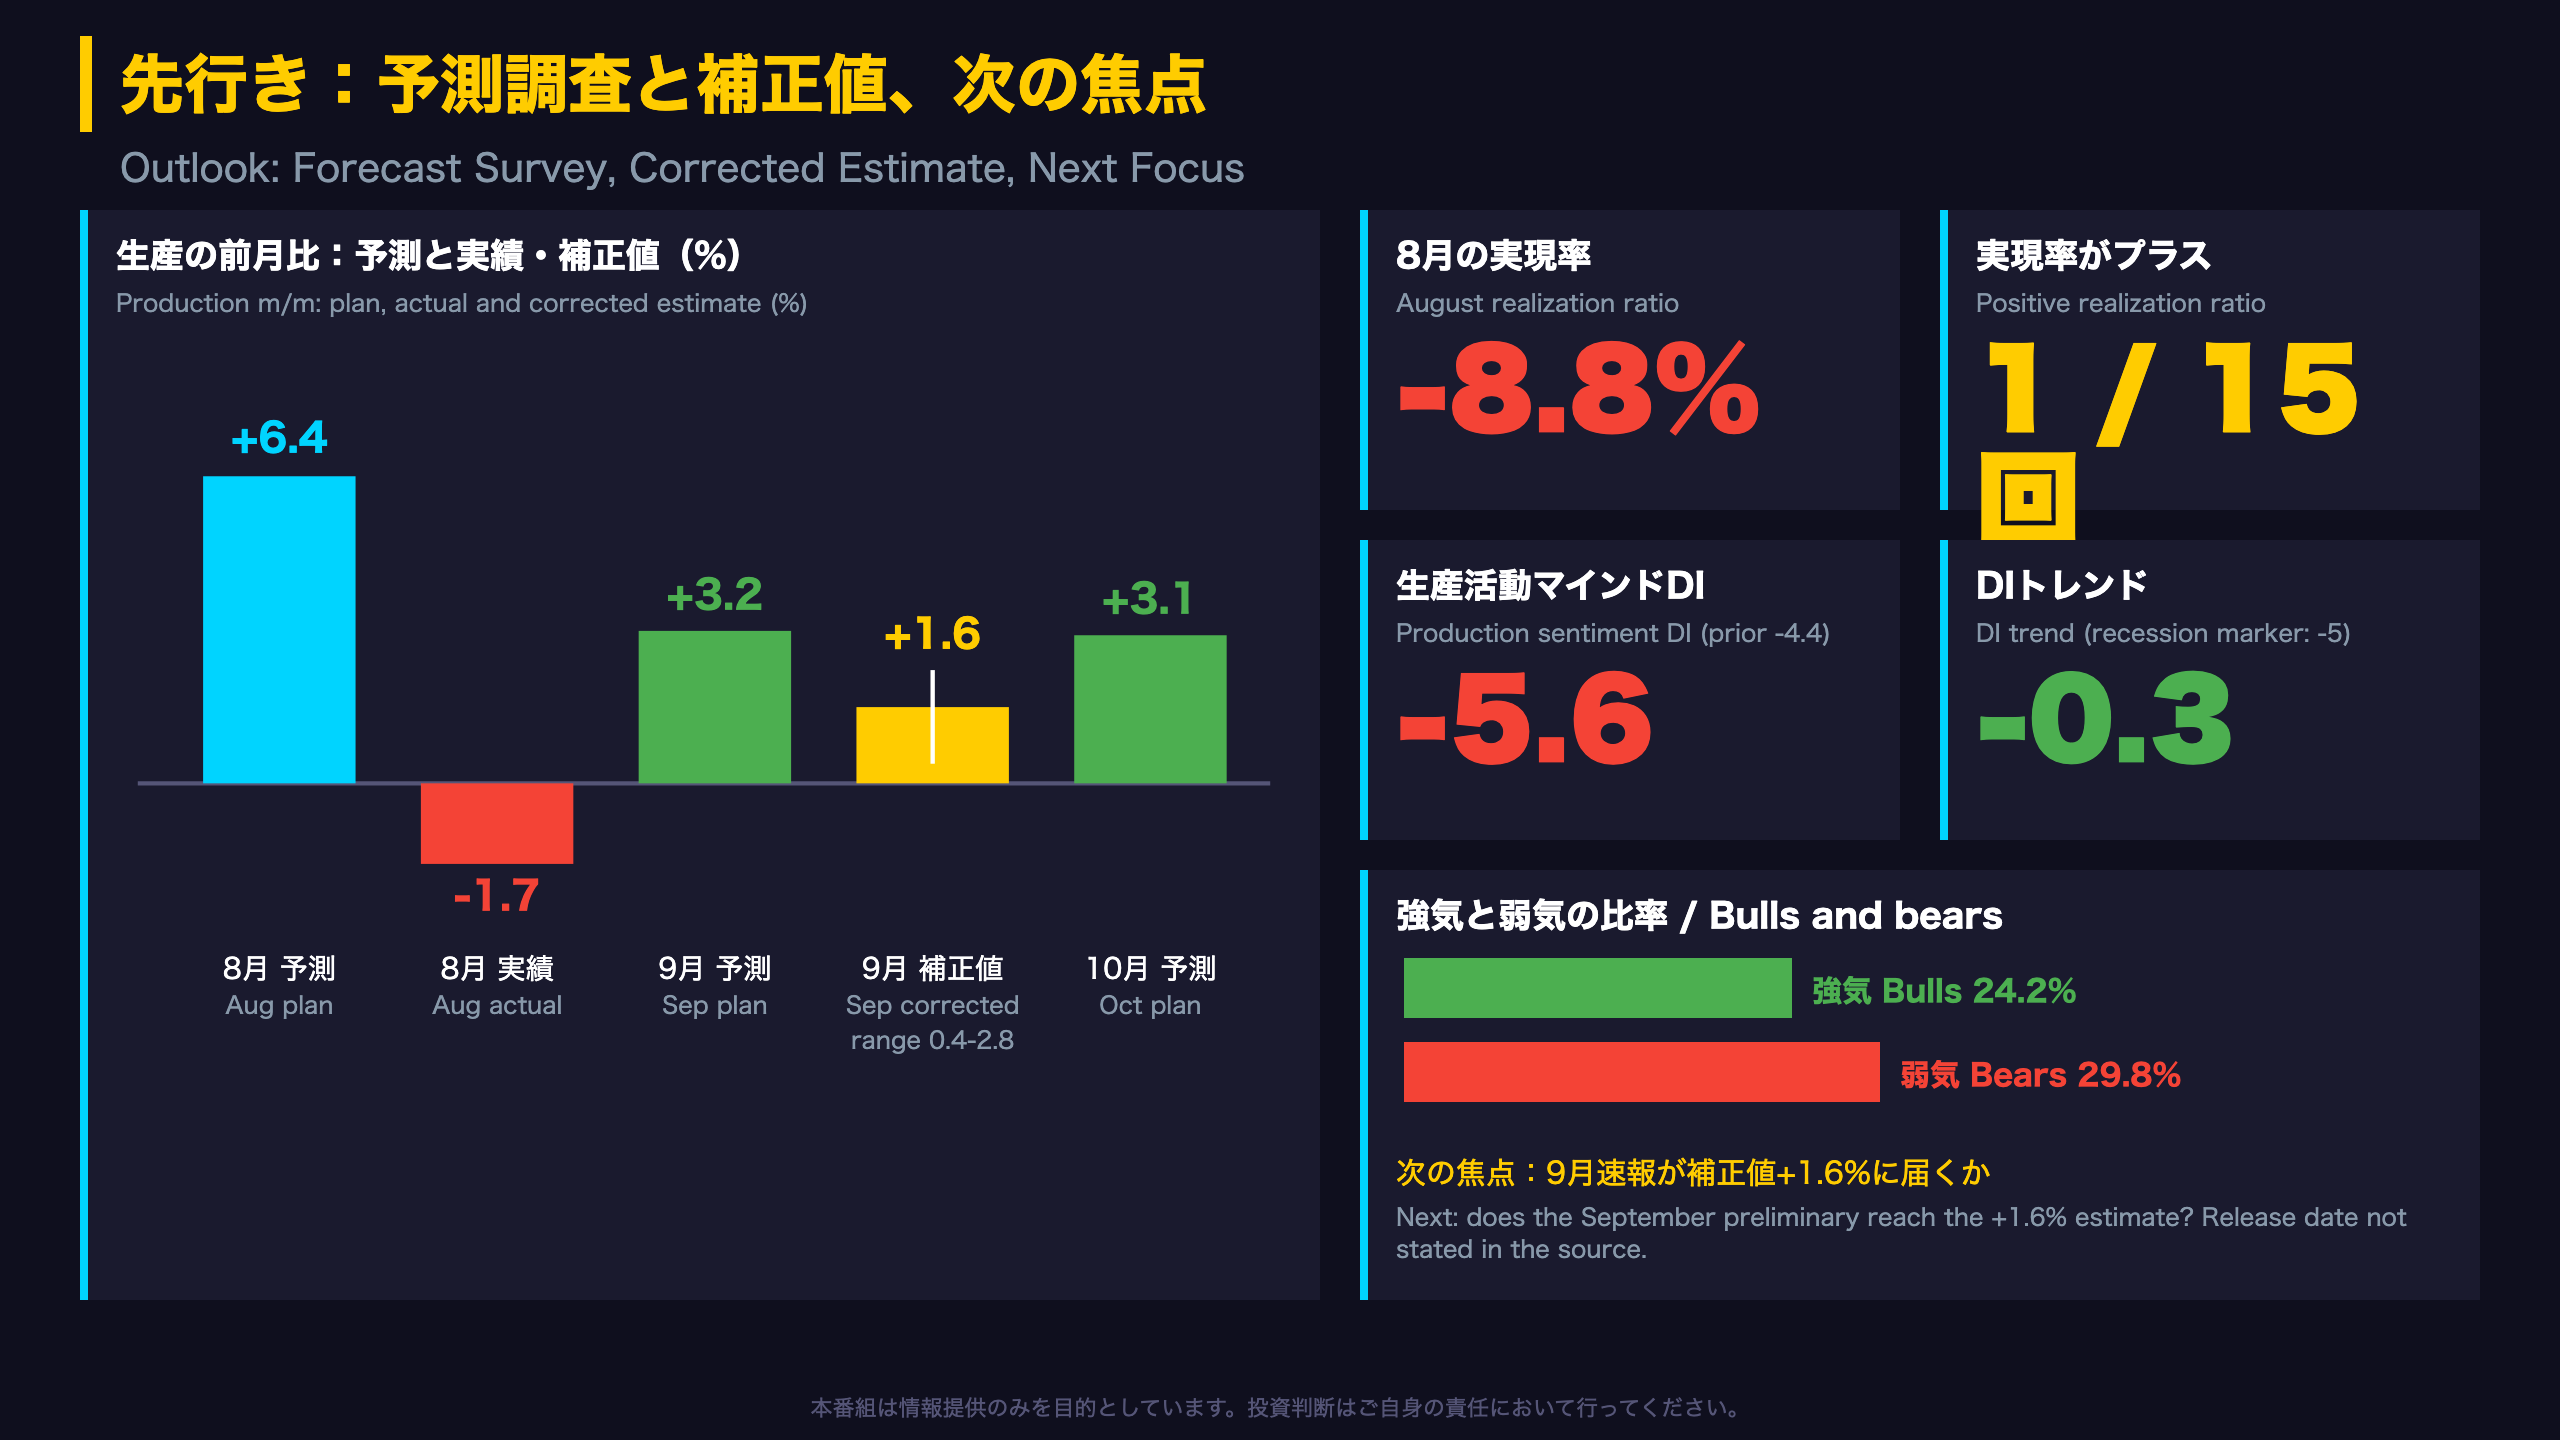
How to Read the Forecast Survey
METI surveys principal producers of about 186 products around the 10th of each month for their actual output last month and plans for this month and next. The realization ratio compares last month’s actual with what firms had planned; the amendment ratio compares this month’s plan with what they had pencilled in a month ago. METI also publishes a corrected estimate, which adjusts for the survey’s tendency to run high.
| Industry | Sep plan | Oct plan | Aug realization |
|---|---|---|---|
| Manufacturing | +3.2% | +3.1% | -8.8% |
| Production machinery | +6.4% | +12.9% | -21.6% |
| Electronic parts and devices | -1.0% | +9.5% | -0.6% |
| Electrical and info-comm | +11.3% | +9.1% | -12.9% |
| Transport equipment | +4.6% | +2.7% | -10.2% |
| Petroleum products | +18.2% | +1.8% | -18.3% |
Two readings
The cautious reading: the realization ratio was negative in 14 of the last 15 surveys, and August’s -8.8% was the largest miss in that span, so headline plans should be treated as an upper bound. The constructive reading: even the corrected estimate for September is positive (+1.6%, range 0.4-2.8%), October plans are led by capital goods (+12.7%), and the sentiment DI trend of -0.3 is above the -5 recession marker.
What to watch next
The September preliminary report will show where actual output lands relative to the 0.4-2.8% range. The DI components show bulls at 24.2% versus bears at 29.8%. The source does not state the release date. This is comparable in spirit to US regional Fed surveys of expected output, but those are diffusion indices of sentiment rather than quantity plans.
Disclaimer: This article is for informational purposes only. All investment decisions are made solely at your own risk.