📺 Watch the Full Video Analysis
This article was automatically generated by the NFC Market Live AI analysis system. (Updated: 2026-10-08 17:48 JST)
📄 Primary Source
財務省
https://www.mof.go.jp/policy/international_policy/reference/balance_of_payments/preliminary/pg202608.htm
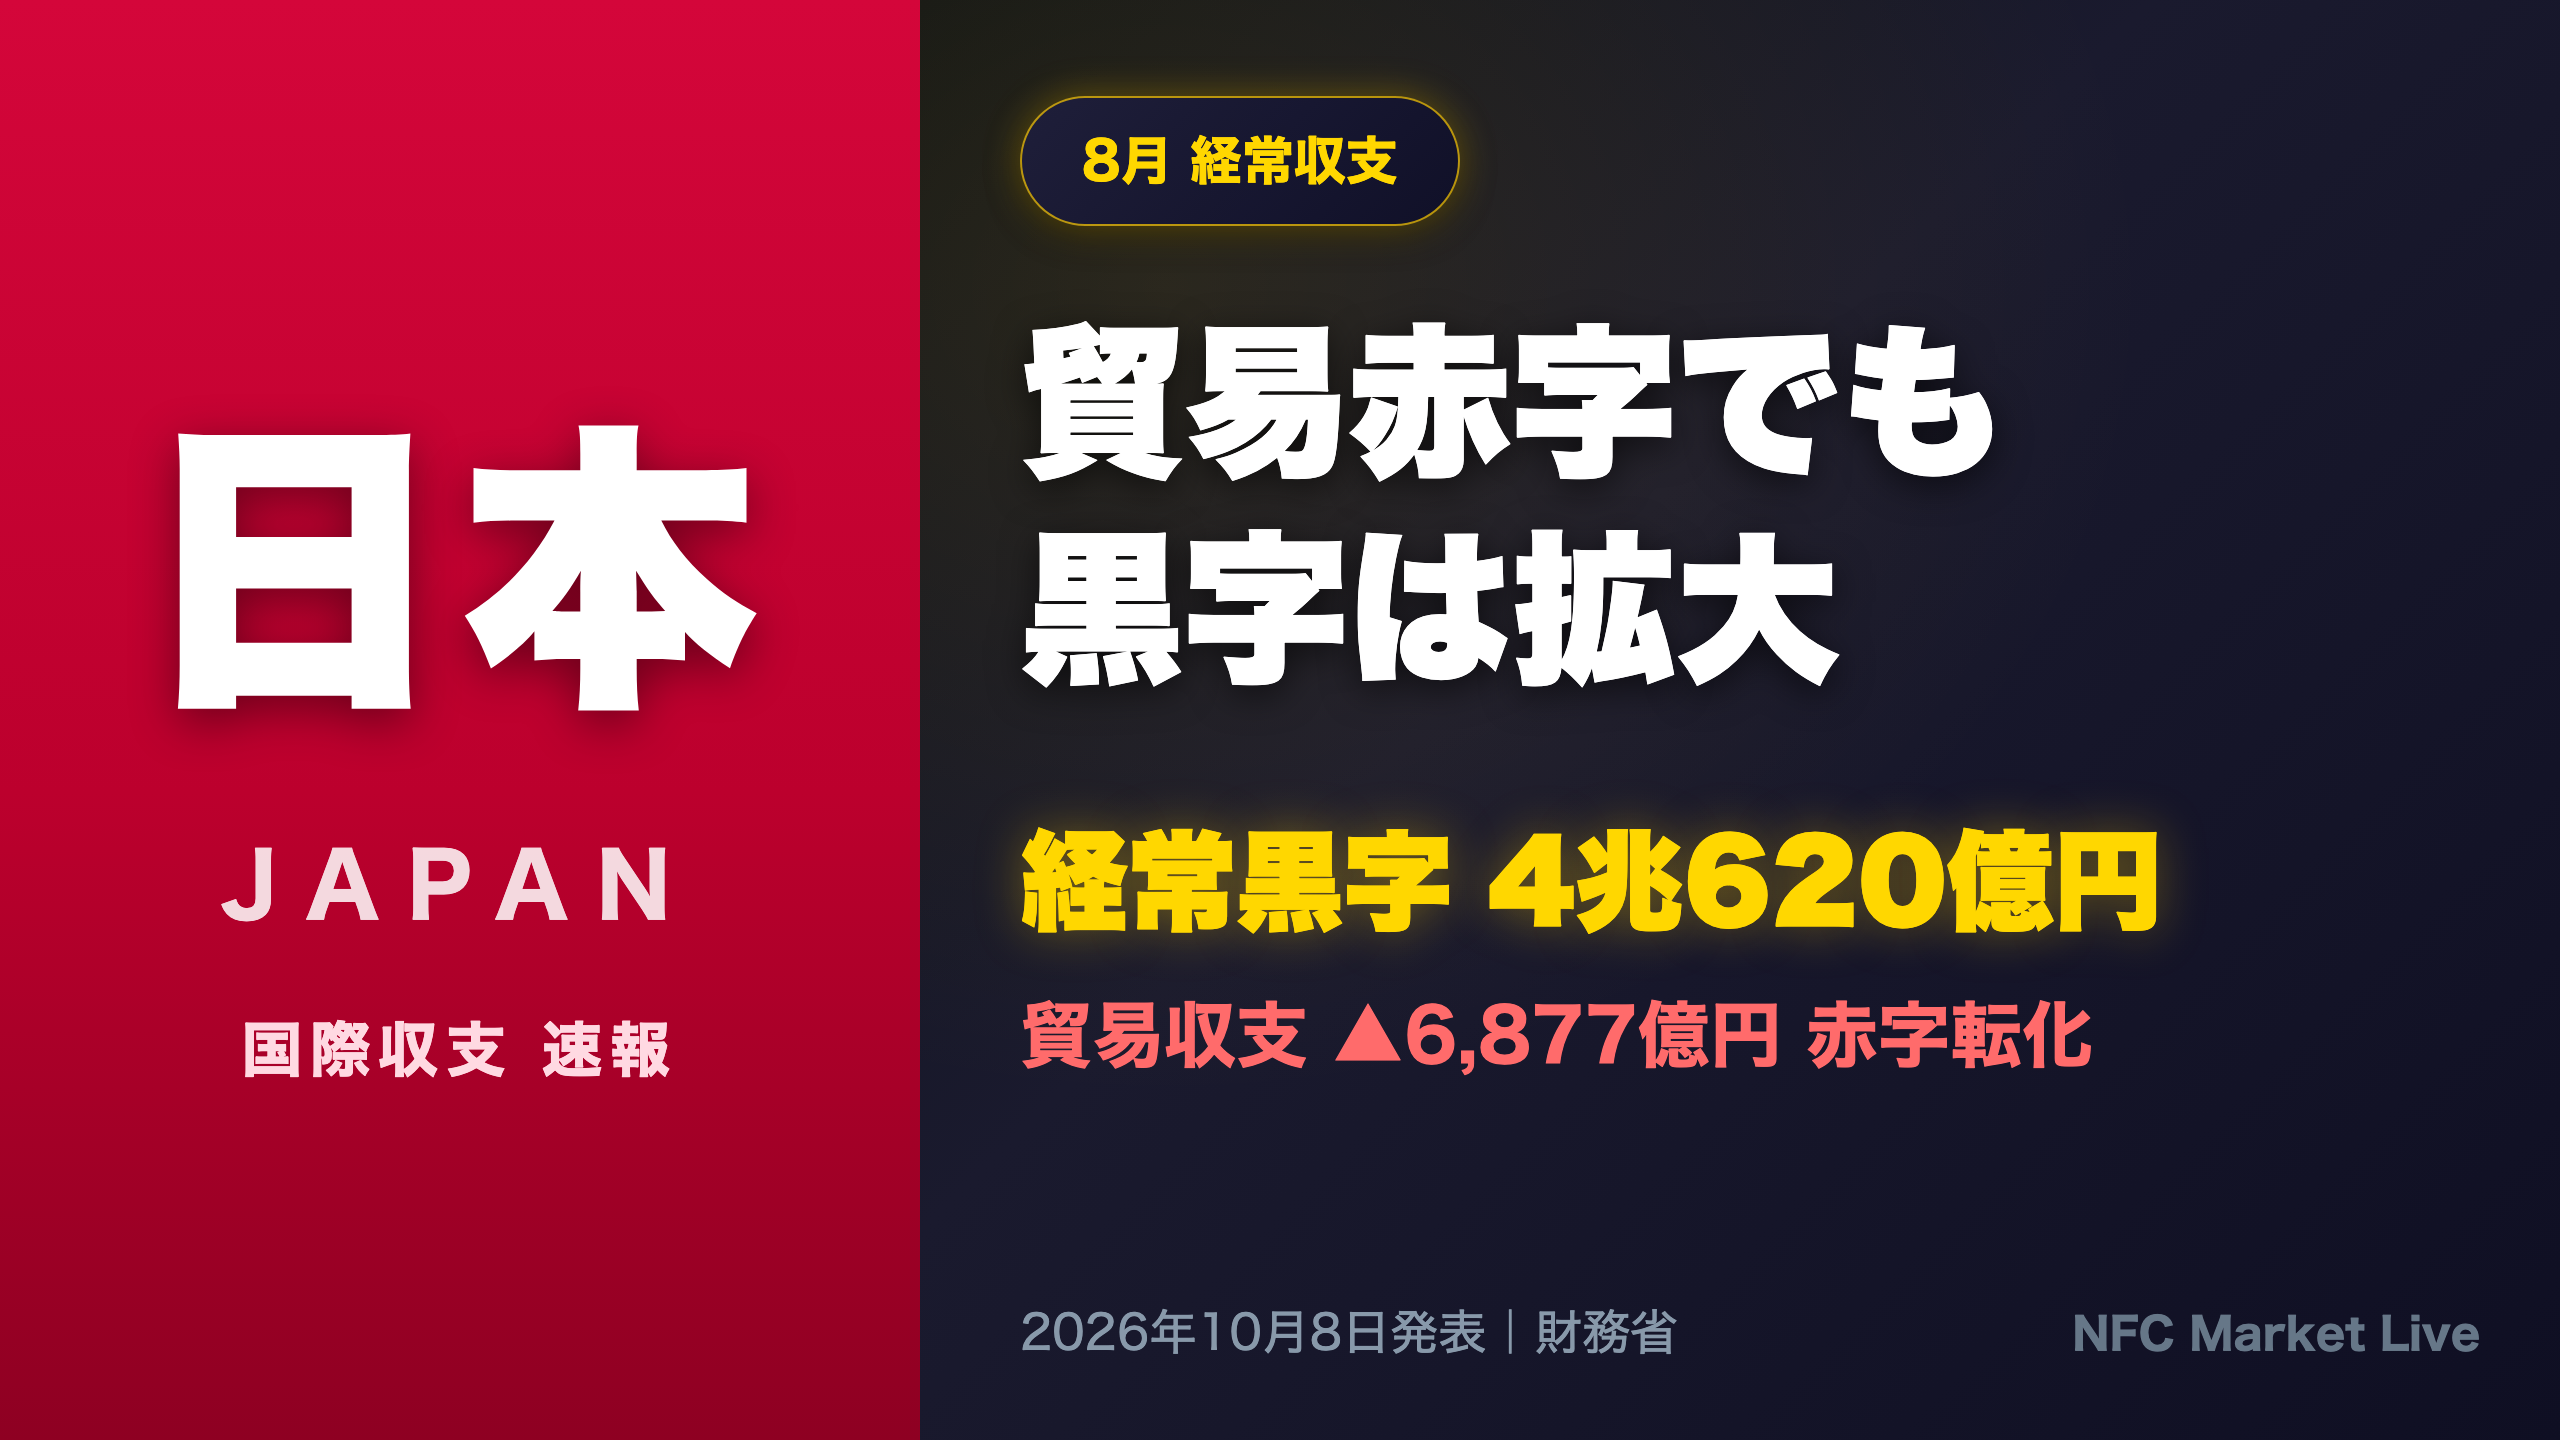
📊 Japan’s Ministry of Finance released August 2026 balance of payments flash data.
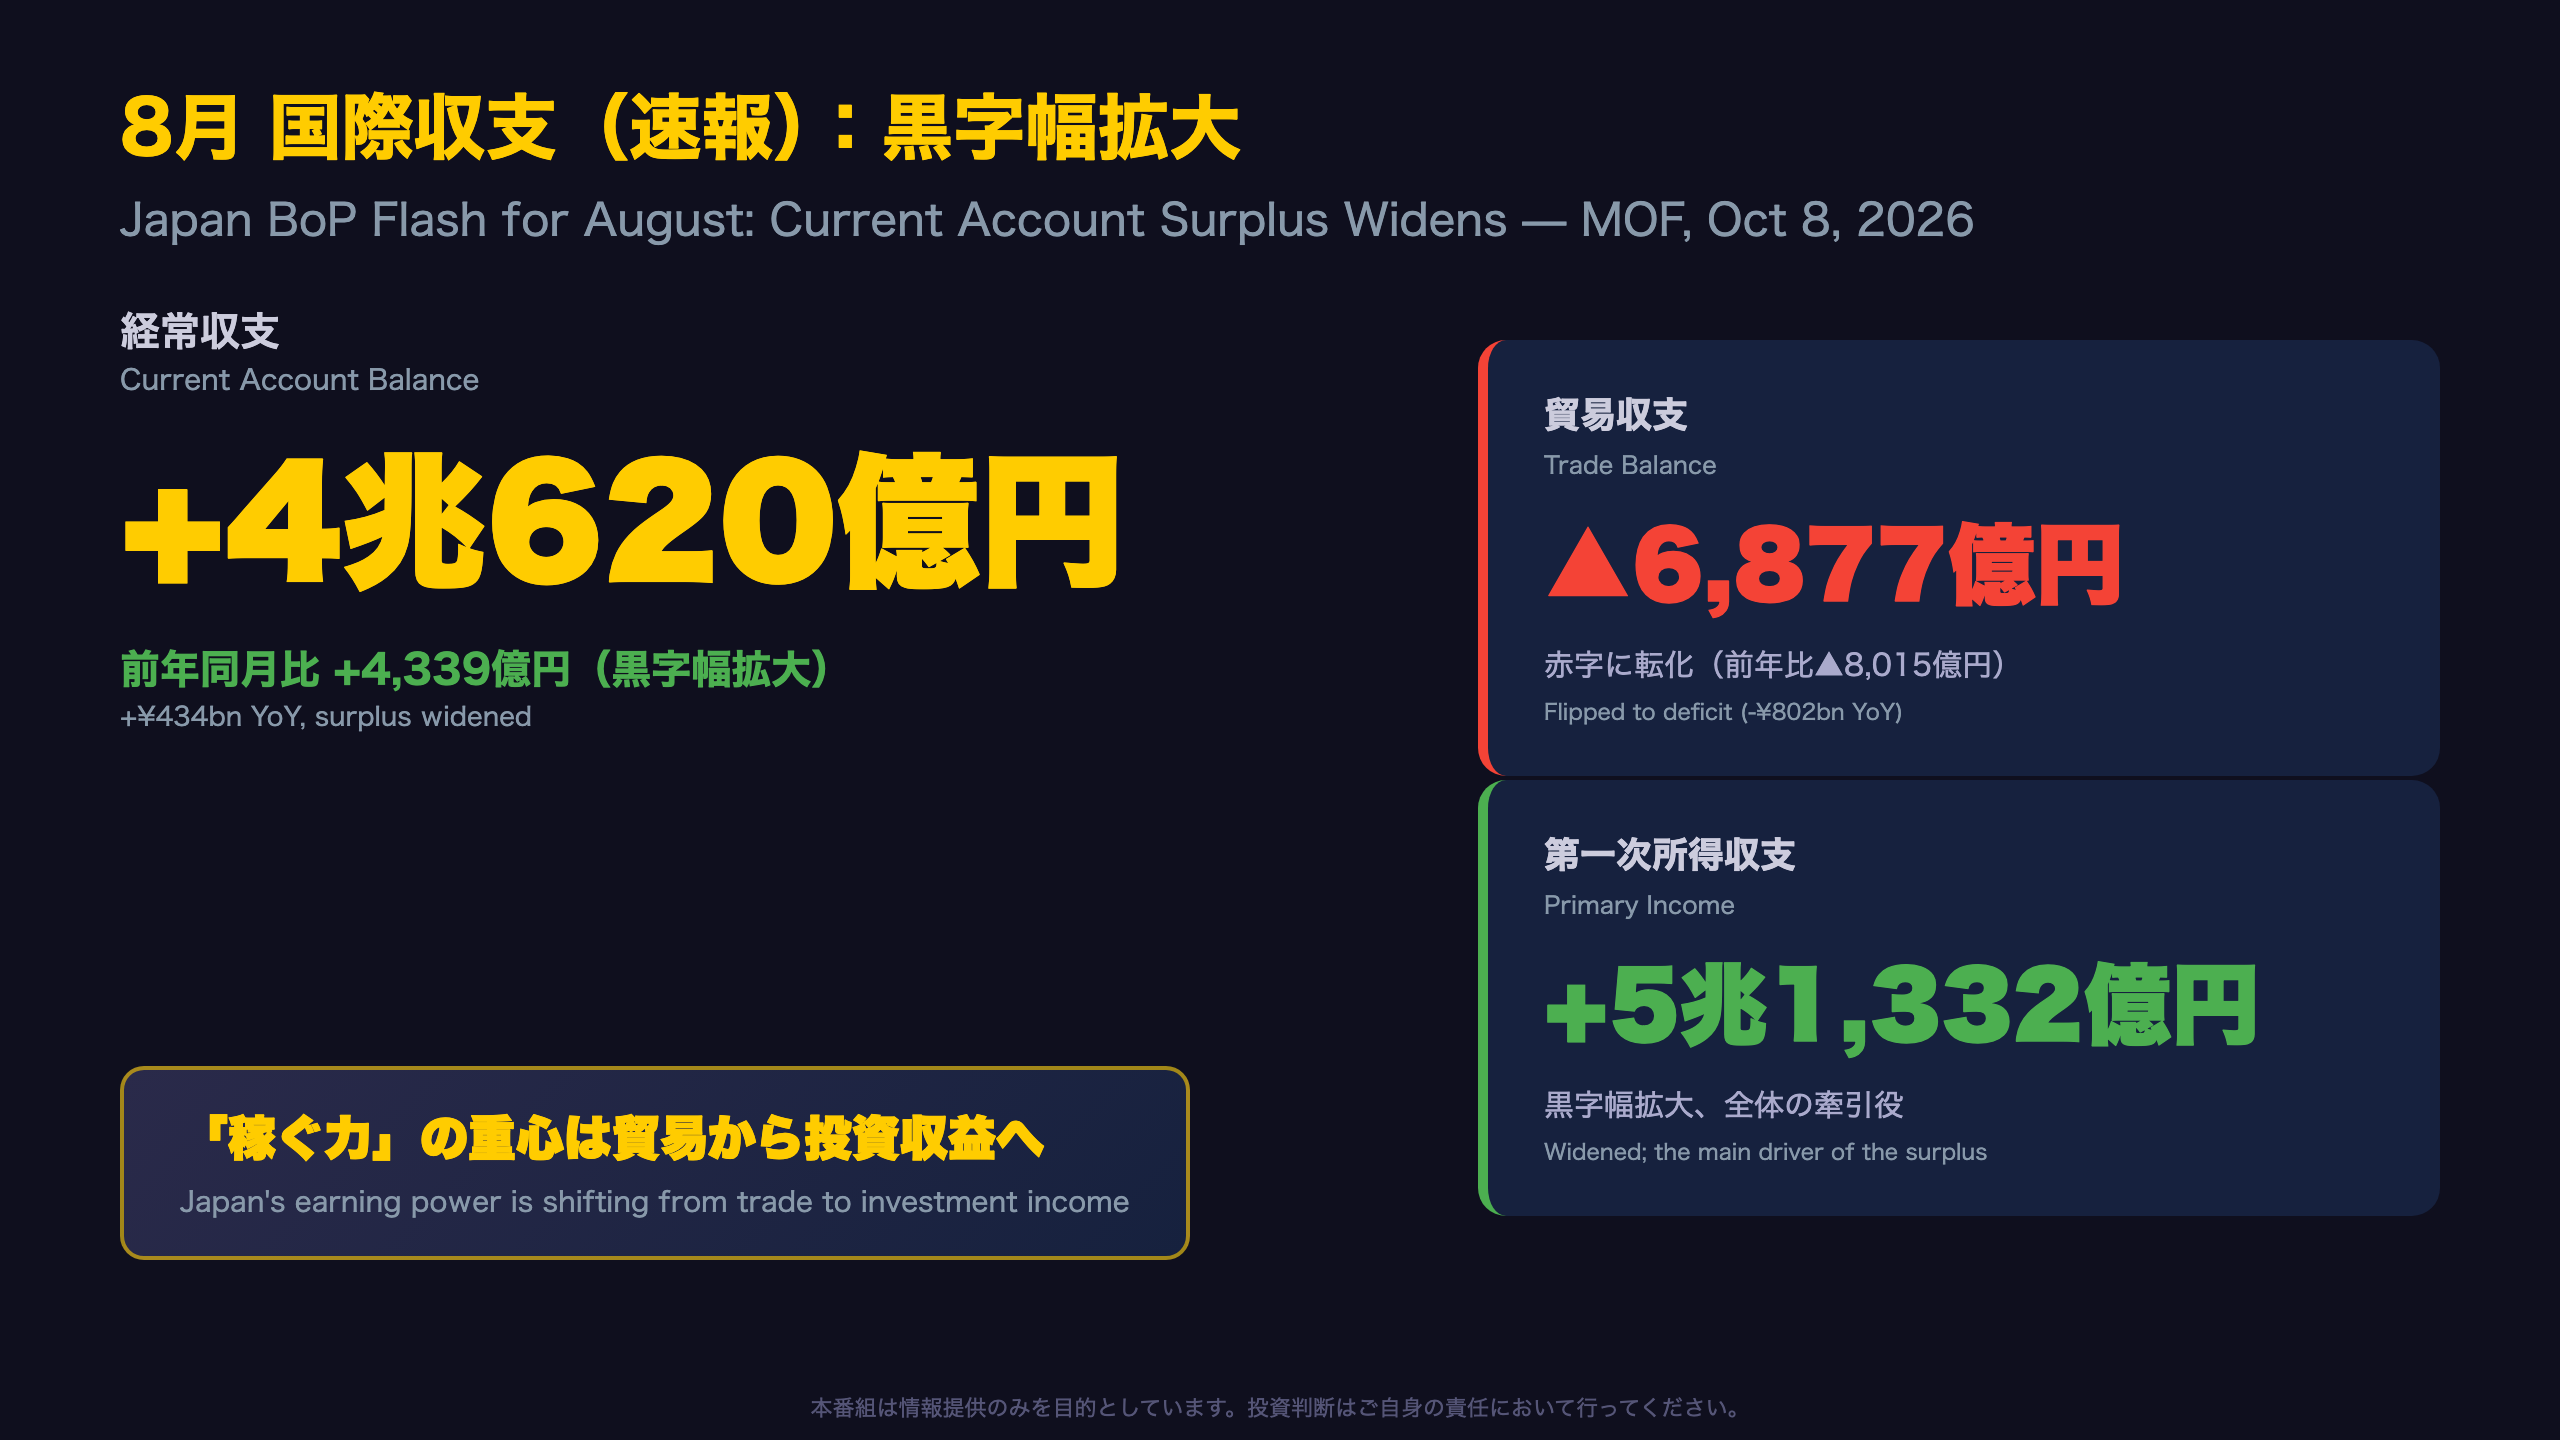
💡 The current account surplus expanded to ¥4.06 trillion (+¥434bn YoY) even as the trade balance flipped to a ¥688bn deficit.
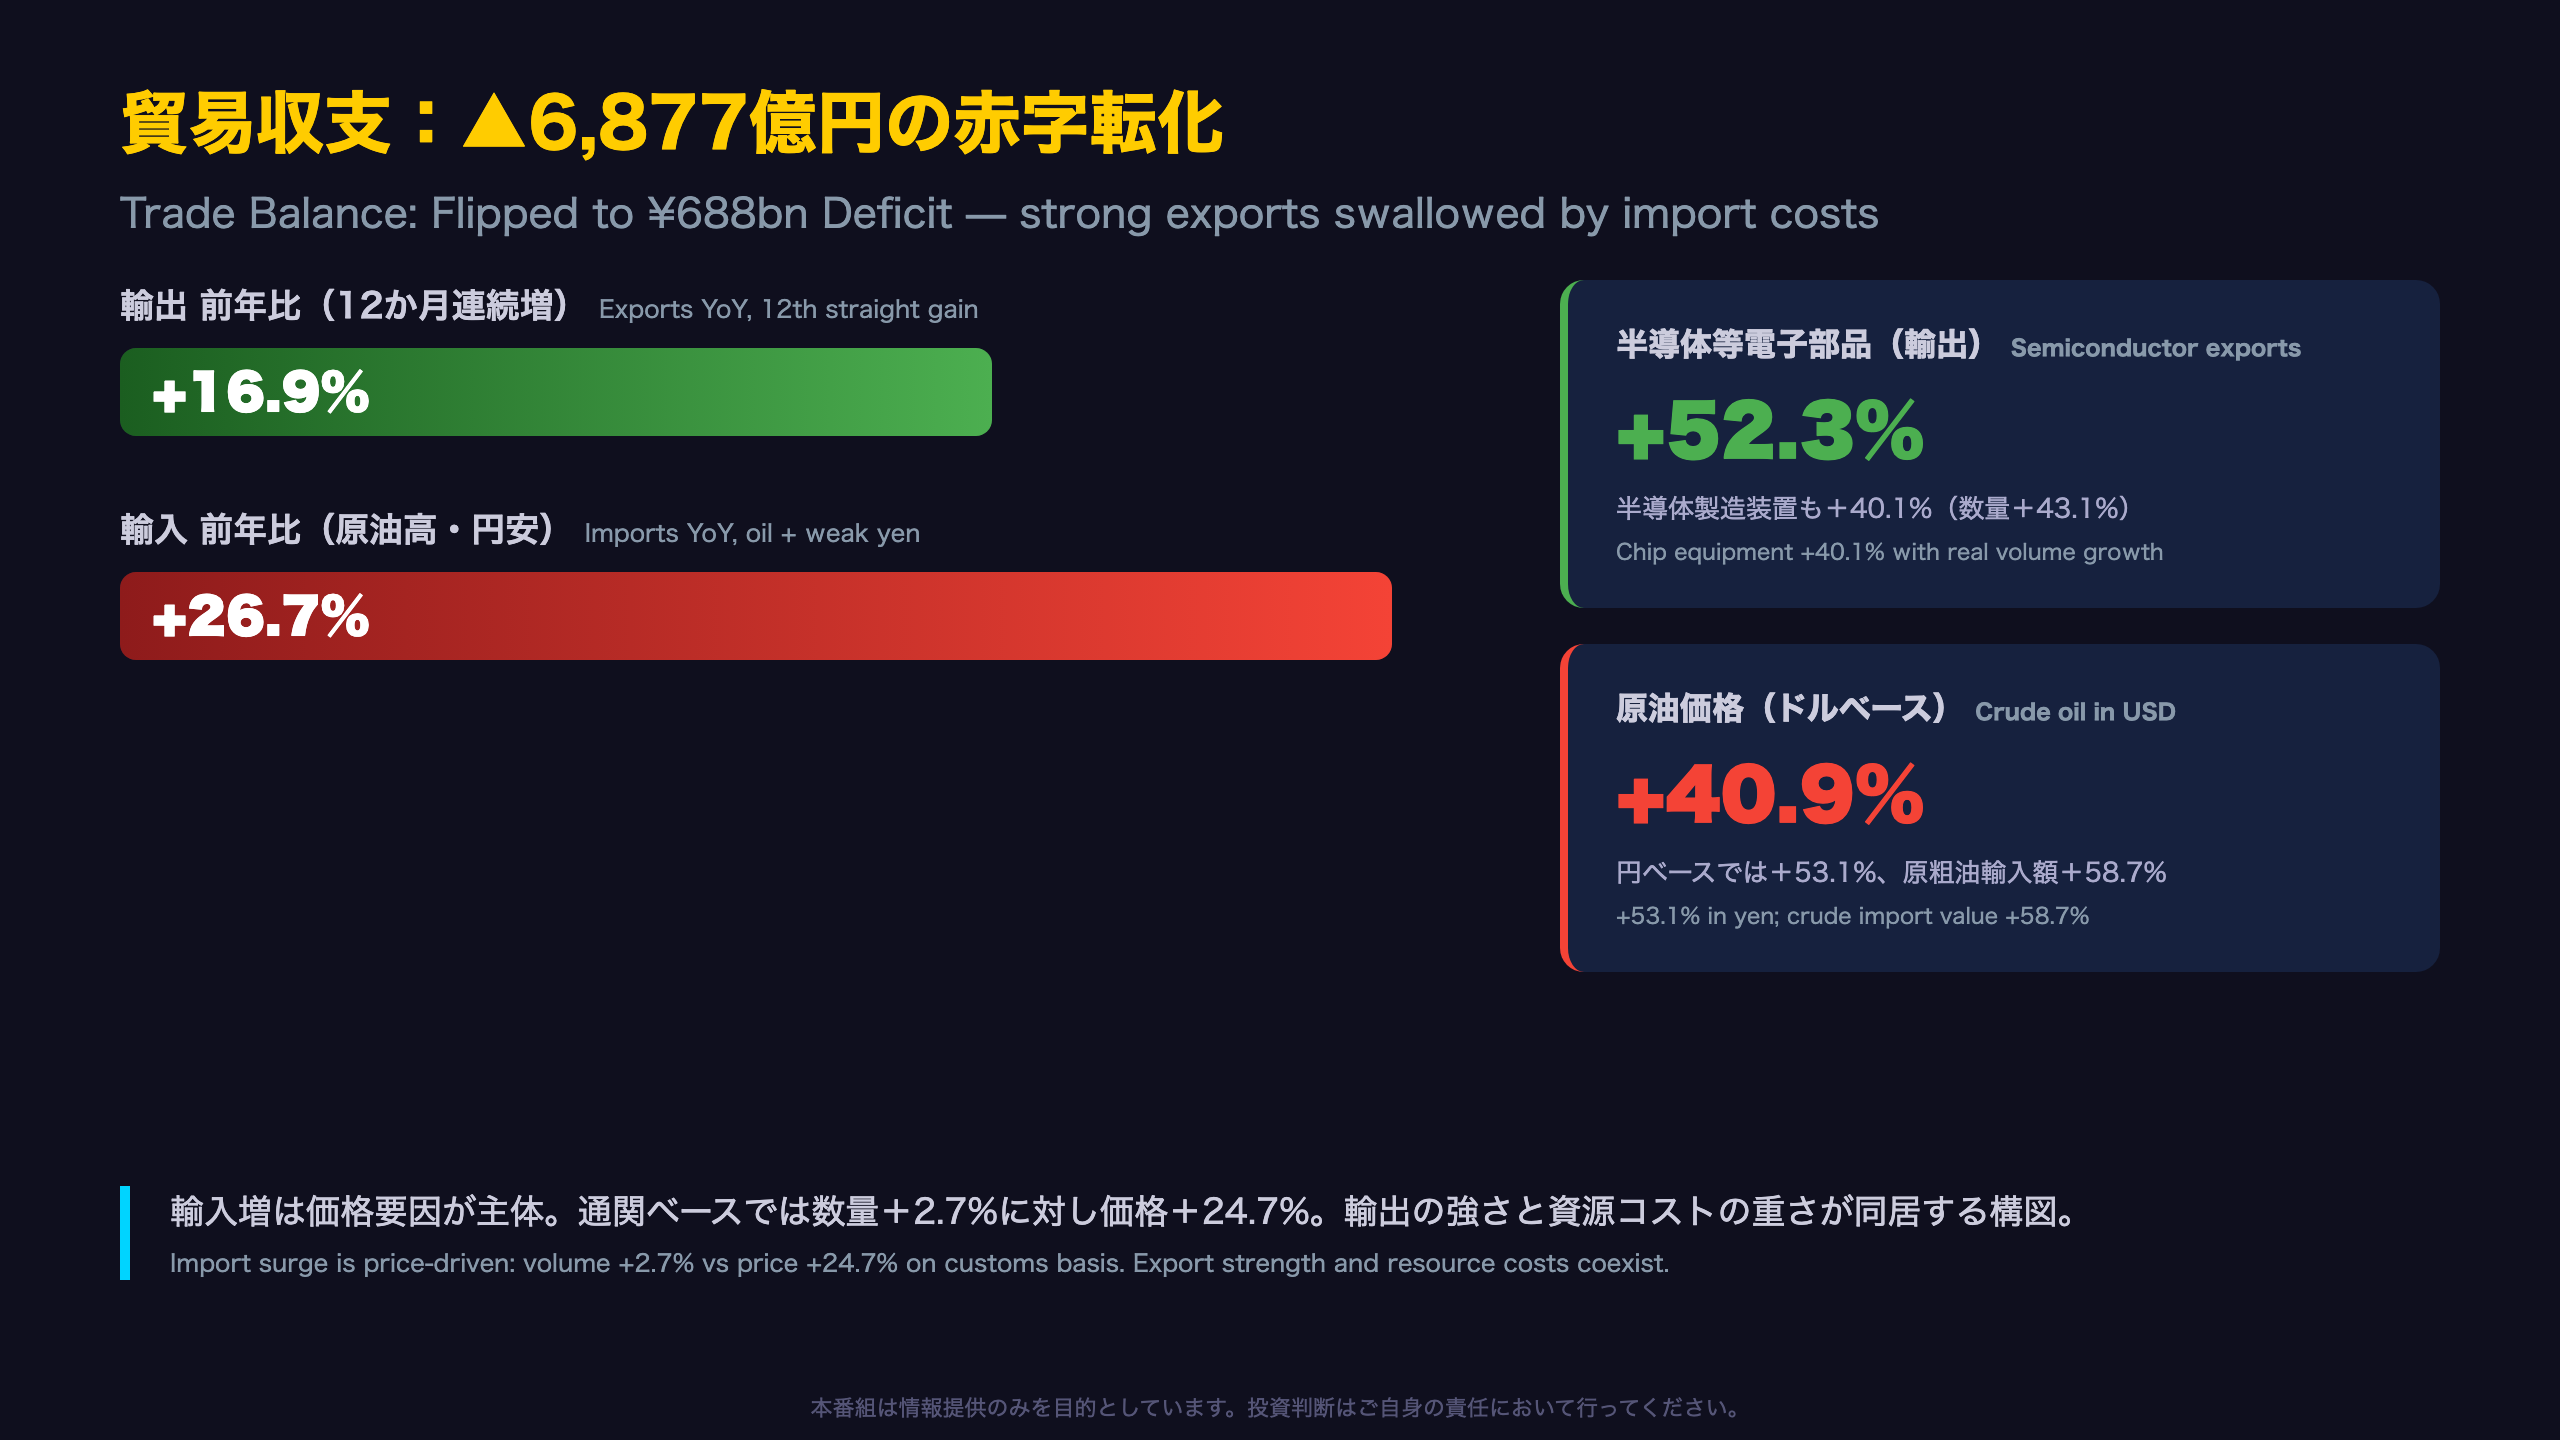
📈 Strength: Primary income surged to ¥5.13tn on overseas investment returns. Exports rose for a 12th straight month, with semiconductors up 52.3%.
📉 Weakness: Imports jumped 26.7% on oil prices (+40.9% in USD) and a weak yen. Inbound visitors fell 9.6% YoY.
⚠️ A striking ¥15.1tn drop in FX reserves marked the financial account.
We analyze Japan’s structural shift from trading nation to investment nation—both sides, no spin.
The Ultimate Summary:貿易赤字転化でも経常黒字は4兆円超へ拡大
Japan’s August Paradox: Trade Deficit, Bigger Surplus
Japan’s Ministry of Finance (MOF)—which compiles the country’s balance of payments statistics jointly with the Bank of Japan—released flash data for August showing two seemingly contradictory facts. The current account surplus expanded to ¥4.06 trillion (+¥434 billion year-on-year), while the trade balance flipped back into a ¥688 billion deficit, a swing of over ¥800 billion versus a year earlier.
Why both can be true
Unlike the US, which runs chronic current account deficits, Japan’s external surplus is no longer driven by merchandise trade. The engine is primary income—dividends, interest, and reinvested earnings from Japan’s roughly four decades of accumulated overseas direct and portfolio investment. In August, primary income hit ¥5.13 trillion, up ¥911 billion YoY, dwarfing the trade gap.
Context for global investors
This structure matters for FX markets. A surplus built on investment income is less yen-supportive than a trade surplus, because a large share of overseas earnings is reinvested abroad rather than converted back into yen. That helps explain why the yen can stay weak (the monthly average was ¥158.74 per dollar) even as Japan posts headline surpluses that would, on paper, suggest currency strength.
The month-on-month improvement was substantial too: the surplus rose from ¥2.99 trillion in July, helped by a sharply narrower services deficit. The following sections break down the strengths and the soft spots.
貿易収支の分解:強い輸出を飲み込んだ資源コスト
Price, Not Volume, Flipped the Trade Balance
Japan’s customs-cleared trade statistics (compiled by MOF’s Customs Bureau, the equivalent of US Census trade data) reveal the anatomy of August’s deficit.
Import breakdown (+28.0% YoY, customs basis)
- Volume: +2.7% vs Price: +24.7% — the surge is overwhelmingly a price phenomenon
- Crude oil: +58.7% in value, but volume up only 3.6%
- Semiconductors/electronic components: +82.1%
- Computers and peripherals: +54.2% in value despite volume falling 27.6% — suggesting sharply higher unit prices, possibly AI-related hardware
Export breakdown (+19.3% YoY)
- Semiconductors/components: +52.3%
- Chip-making equipment: +40.1%, with volume up 43.1% — genuine demand, not a price illusion
- Autos: +16.5% (volume +6.1%); exports to North America: +27.4%
For global investors, the equipment-volume figure is the standout: Japan’s capital-goods exporters (think Tokyo Electron, Advantest peers) are capturing the global semiconductor capex cycle in physical shipment terms.
The oil variable
Dollar-based crude averaged $101.67/barrel in August, down from $114.35 in July, with the YoY gain narrowing from +60.2% to +40.9%. If energy prices stabilize, the price-driven import bulge could fade in coming months—a key swing factor for whether the trade deficit persists. Compare this with the US, where energy independence mutes this channel; Japan’s near-total energy import dependence makes its trade balance unusually sensitive to oil and the yen.
第一次所得5.1兆円の牽引力とインバウンドの死角
The Income Engine and a Crack in the Tourism Story
Primary income: Japan’s real profit center
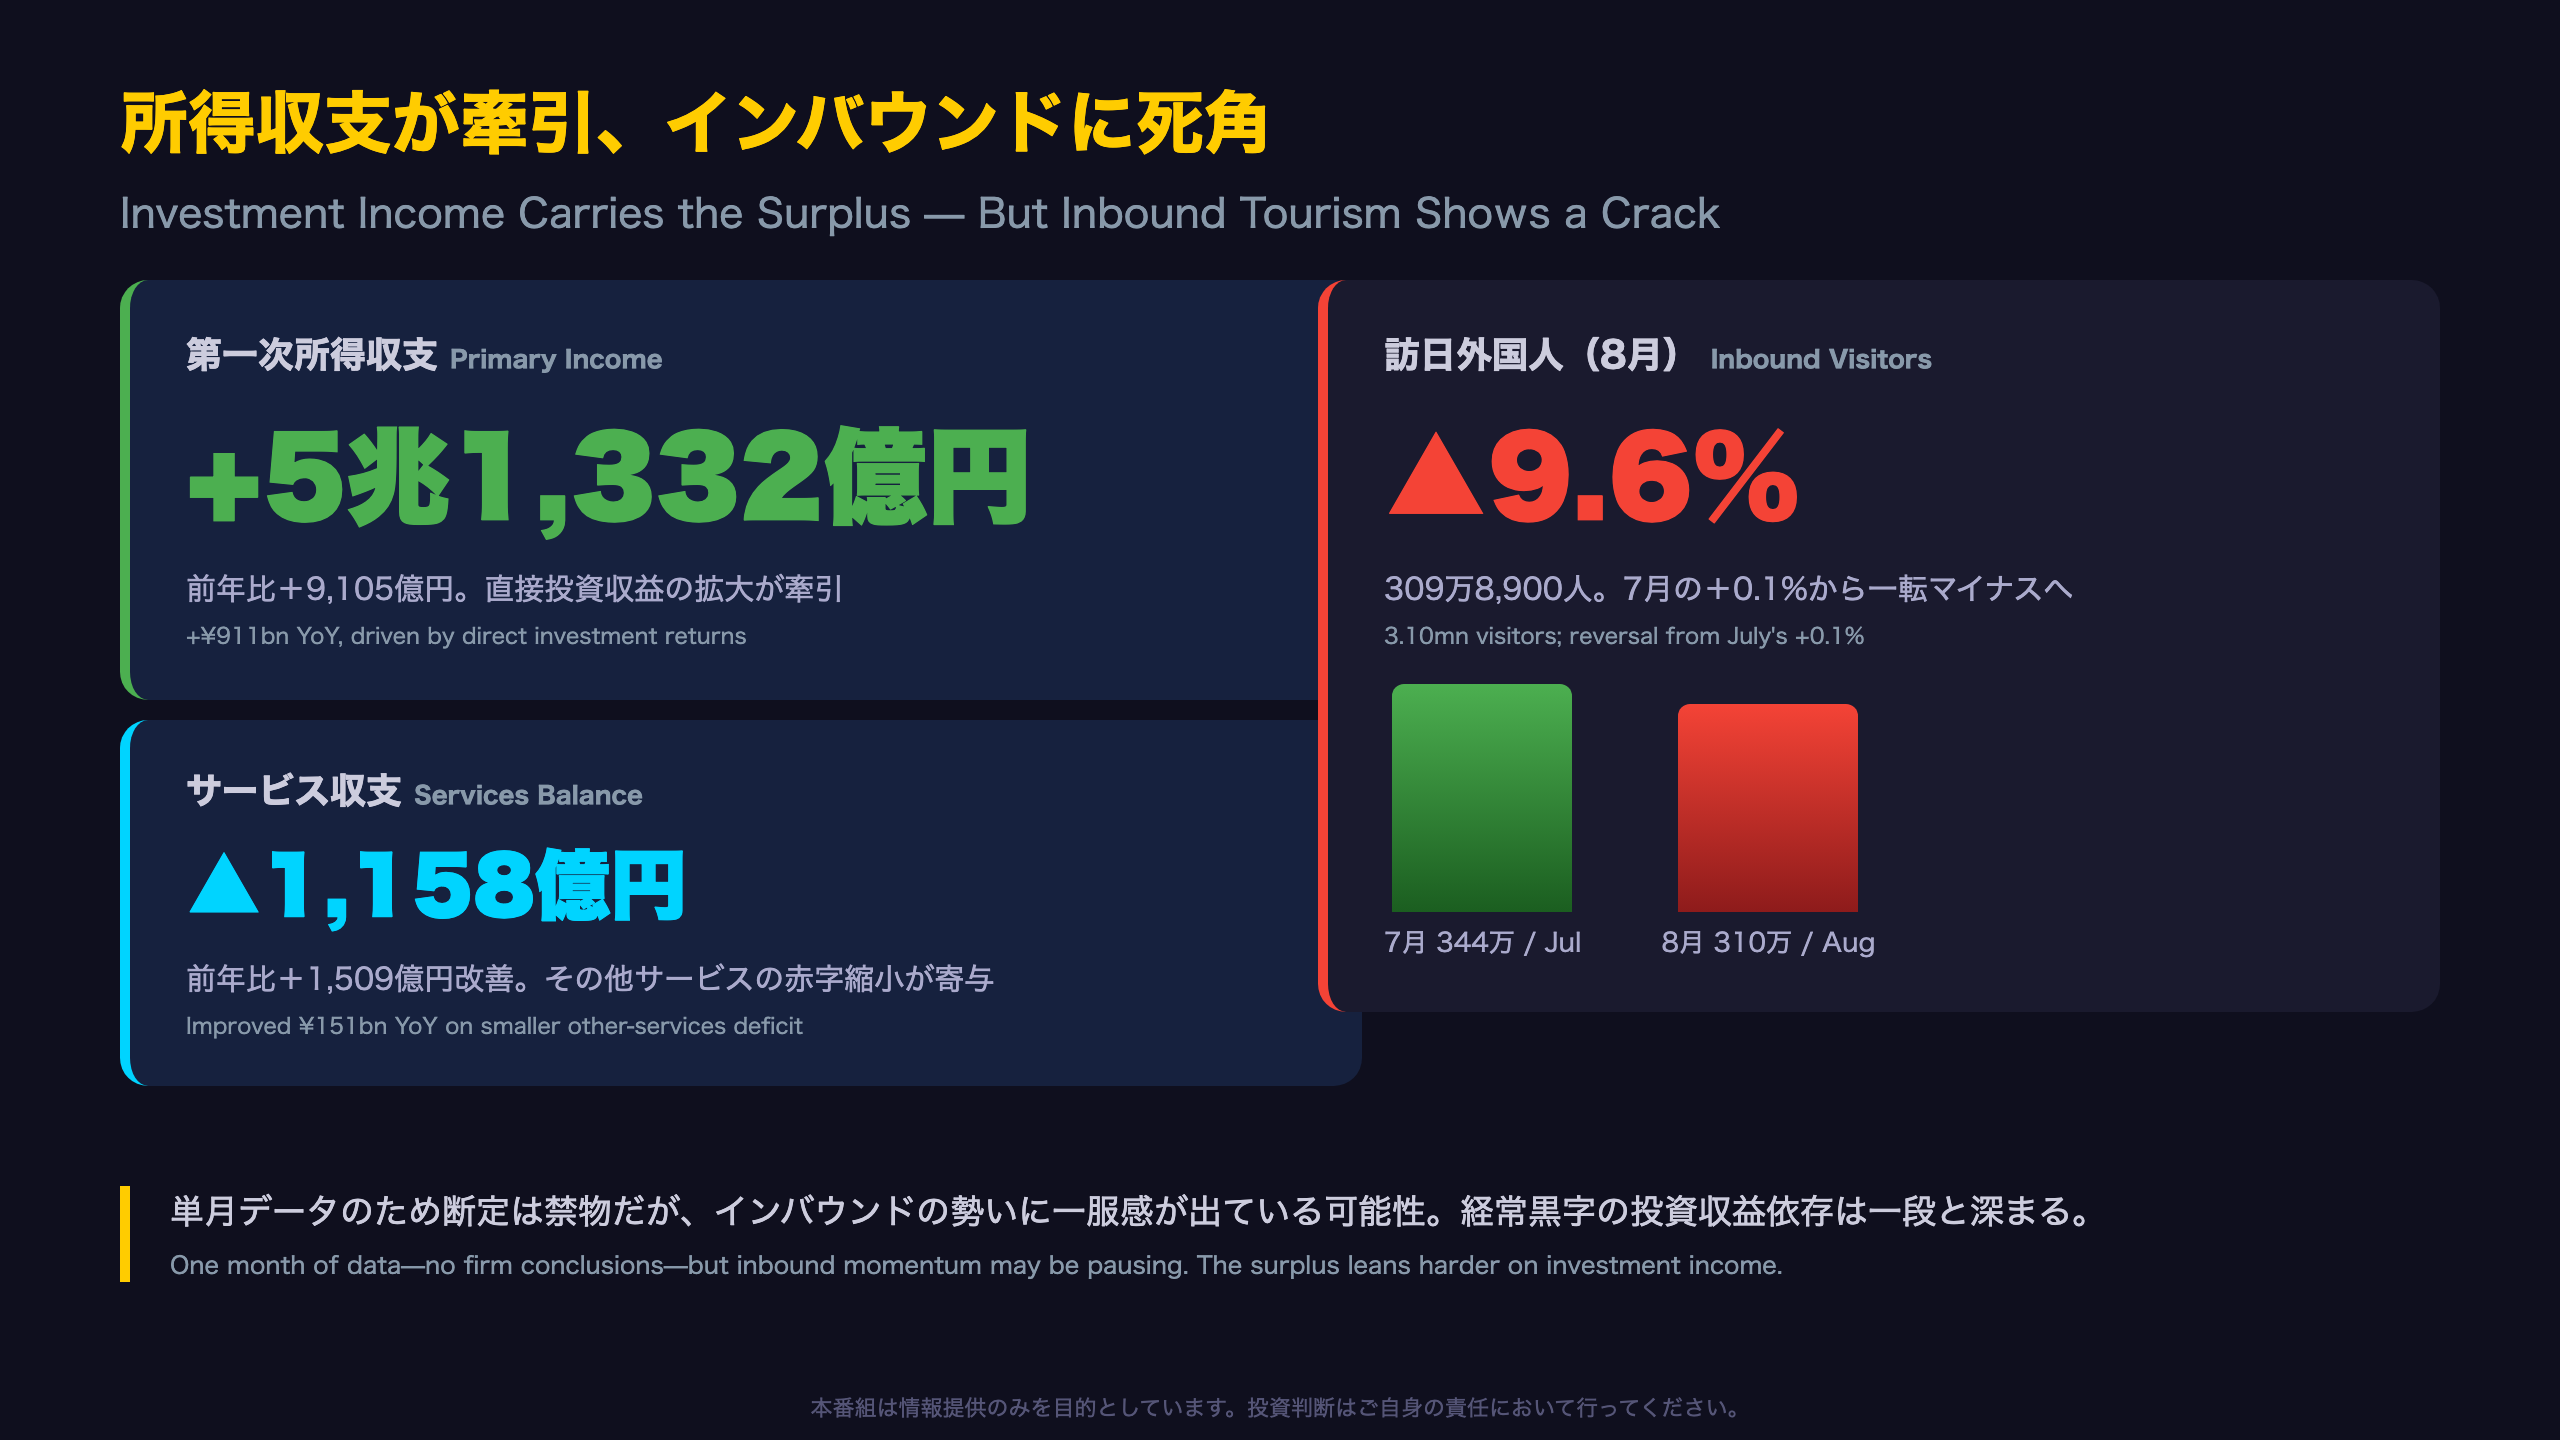
Primary income—dividends, bond coupons, and reinvested earnings from overseas holdings—reached ¥5.13 trillion in August, up ¥844 billion from July alone. MOF attributes the gain to \”expanded direct investment income,\” meaning returns from Japanese companies’ foreign subsidiaries. For context: Japan has been the world’s largest net creditor nation for over three decades, and this line item is where that stock of wealth shows up as monthly cash flow. The weak yen (¥158.74/USD average, 7.5% weaker YoY) likely inflated the yen value of foreign-currency earnings, though MOF does not quantify the FX effect.
Services: a notably smaller deficit
The services deficit narrowed to ¥116 billion from ¥513 billion in July. Interestingly, MOF credits \”other services\”—the category containing Japan’s much-discussed \”digital deficit\” (payments to foreign cloud and software providers)—rather than travel. The flash release gives no sub-item detail, so whether this is a durable improvement or monthly noise remains open.
The inbound warning light
Foreign visitors fell 9.6% YoY to 3.10 million, after July’s flat reading (+0.1%). Two straight months without growth suggests the post-pandemic tourism boom—a key services-account tailwind and a major revenue source for Japanese retailers, hotels, and railways—may be plateauing. One month is not a trend, and the release offers no explanation, but this is now a line item worth monitoring for investors in Japan’s consumer and travel sectors.
金融収支の特異点:外貨準備▲15兆円の大変動
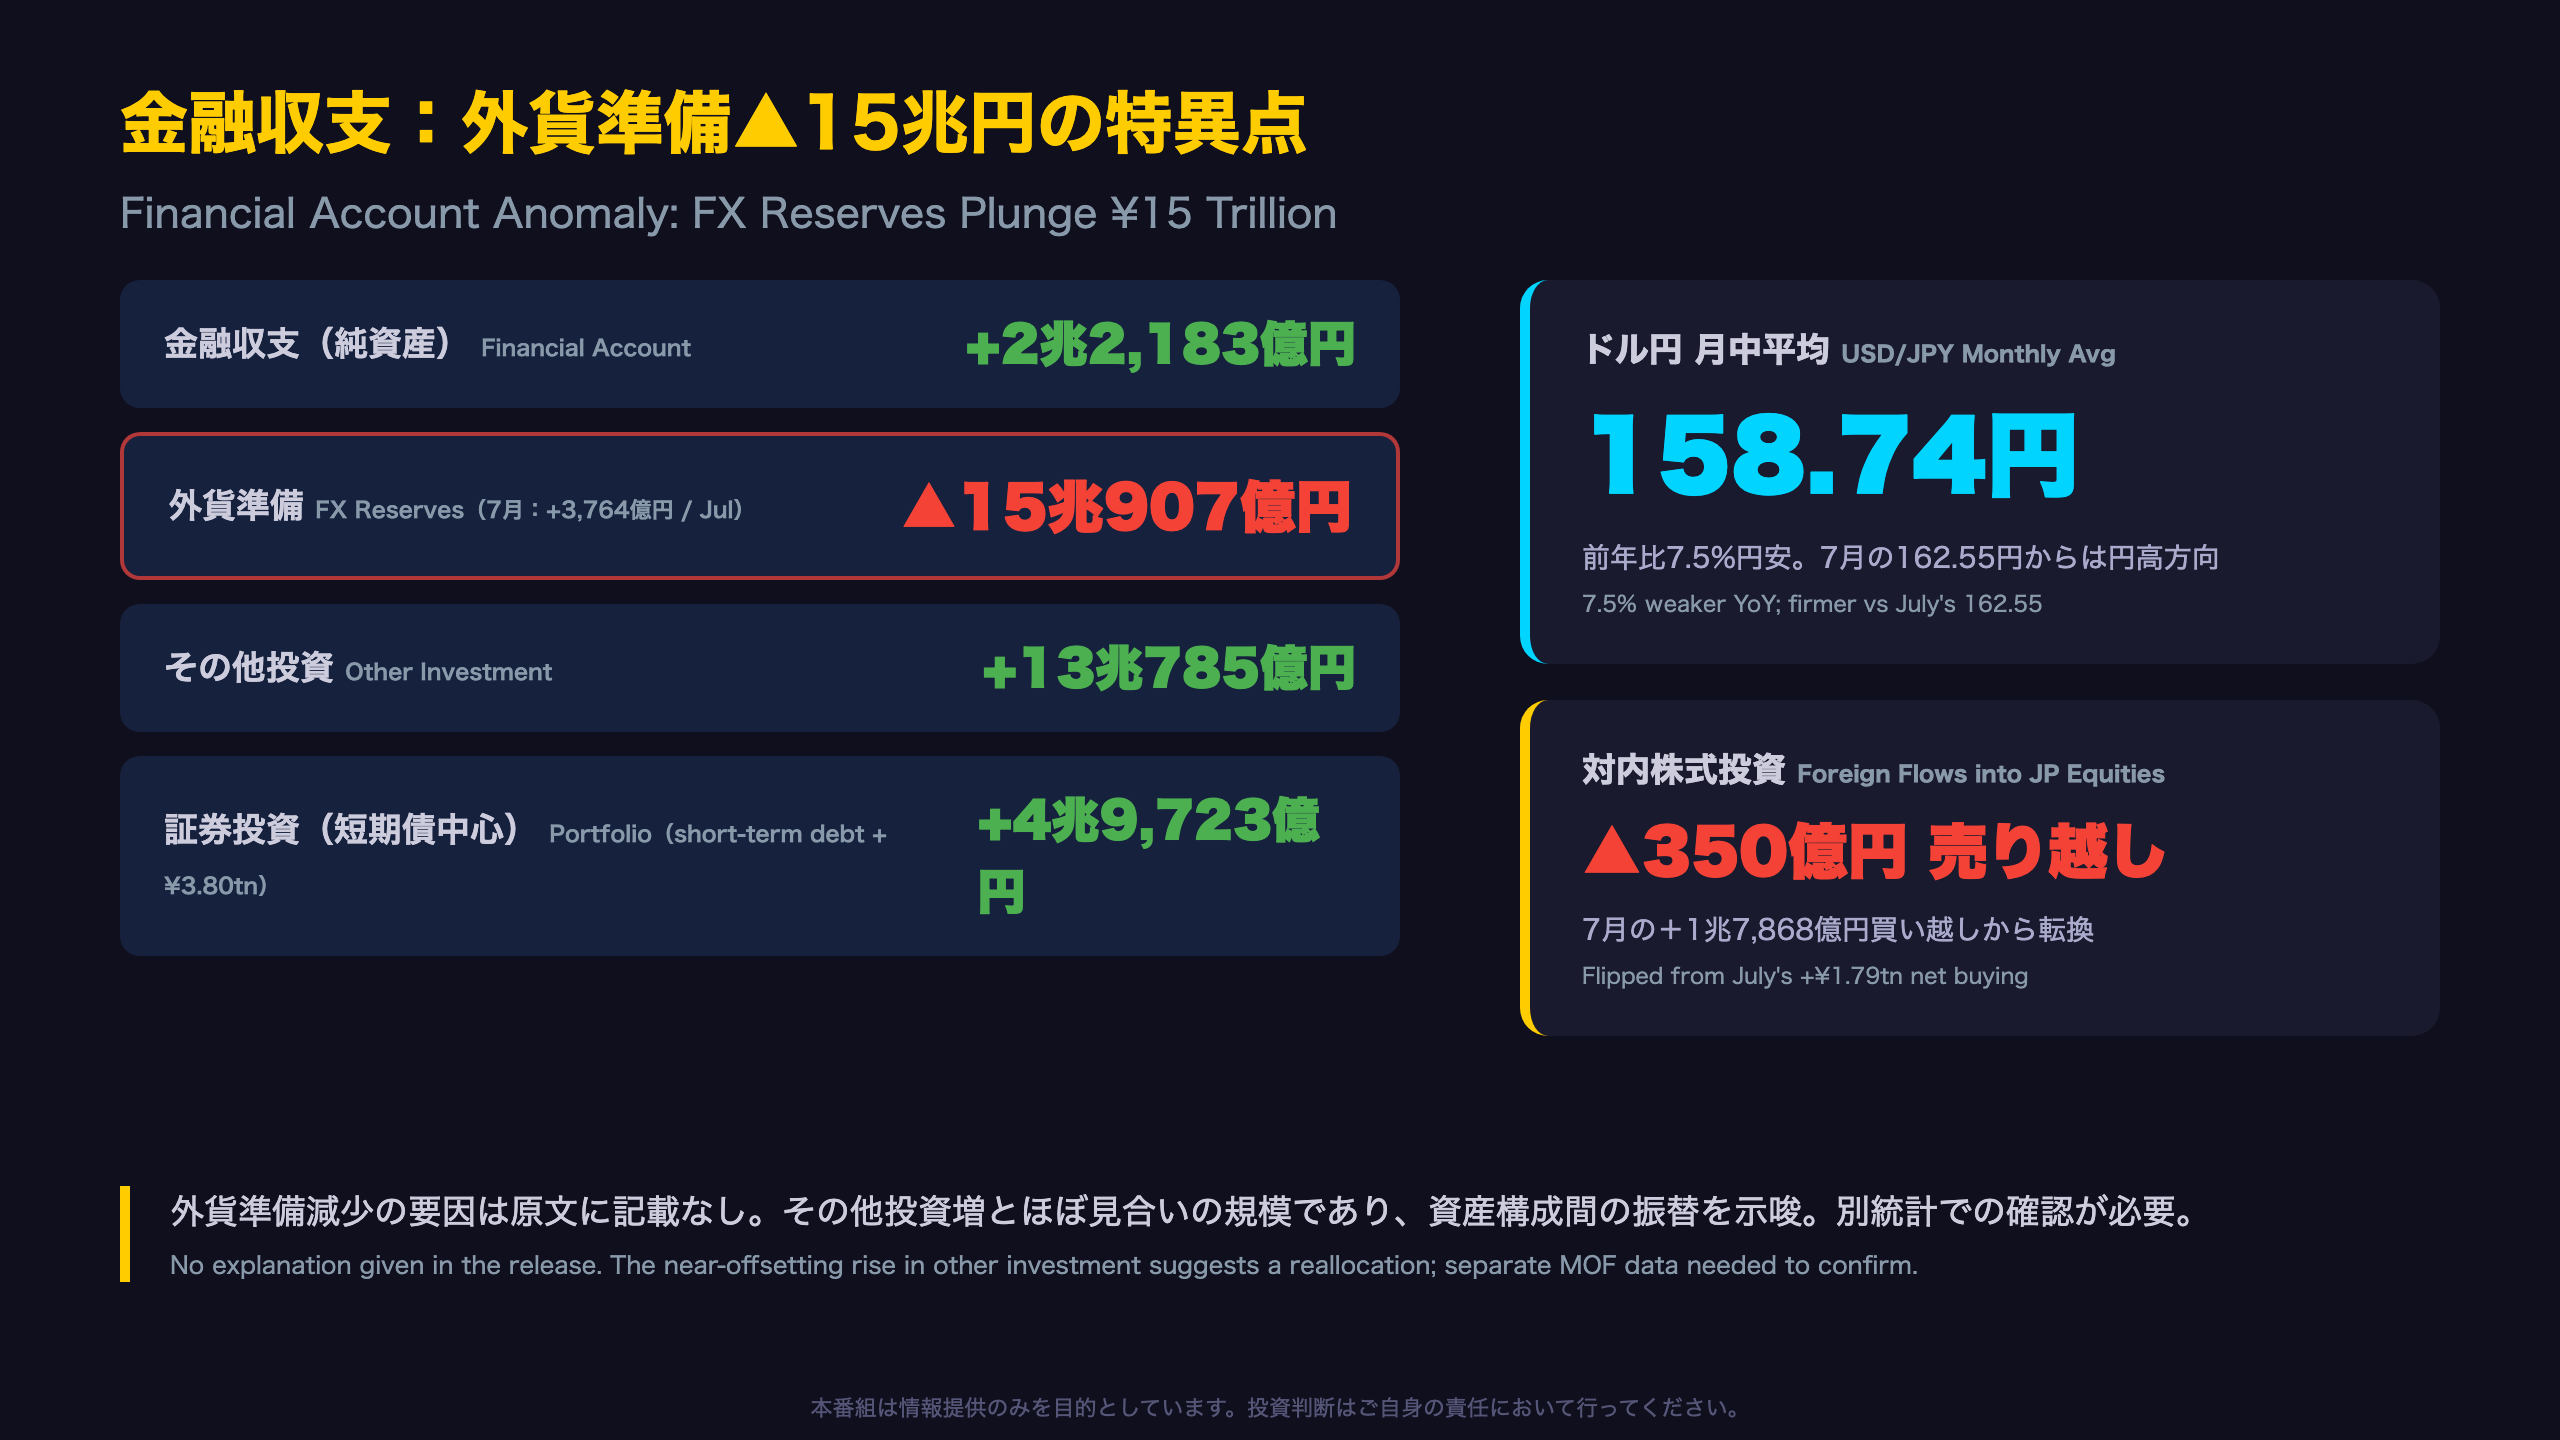
Decoding the ¥15 Trillion Reserve Drawdown
An extraordinary single-month move
The standout anomaly in August’s financial account is the ¥15.09 trillion decline in foreign exchange reserves—versus +¥376 billion in July and +¥287 billion in June. For scale, Japan’s total reserves stand at roughly $1.2 trillion equivalent, making this one of the largest monthly swings on record in flow terms. The MOF flash release offers zero explanation, noting only that the financial account rose on \”an increase in net assets in other investment.\”
The near-mirror-image rise in \”other investment\” (+¥13.08 trillion) suggests a reallocation between asset categories rather than an outright loss of external assets—but confirming whether this reflects currency intervention requires MOF’s separate monthly intervention disclosure, which this release does not cover. US readers should note: unlike the Fed, Japan’s MOF (not the BOJ) holds authority over FX intervention, with the BOJ acting as its agent.
FX and portfolio flow context
The yen averaged 158.74 per dollar in August—7.5% weaker YoY but about ¥3.8 stronger than July’s 162.55 average.
Portfolio flows shifted notably: foreign investors flipped to a small net sale of Japanese equities (-¥35bn) after July’s hefty +¥1.79tn net purchase, while Japanese investment trusts accelerated purchases of foreign equities (+¥1.39tn). That latter flow—retail money moving abroad through mutual funds—is a structural yen headwind frequently cited in FX analysis, though one month cannot confirm a trend. Short-term debt inflows of ¥3.80tn dominated the portfolio account.
総括:投資立国の強さと三つの注視点
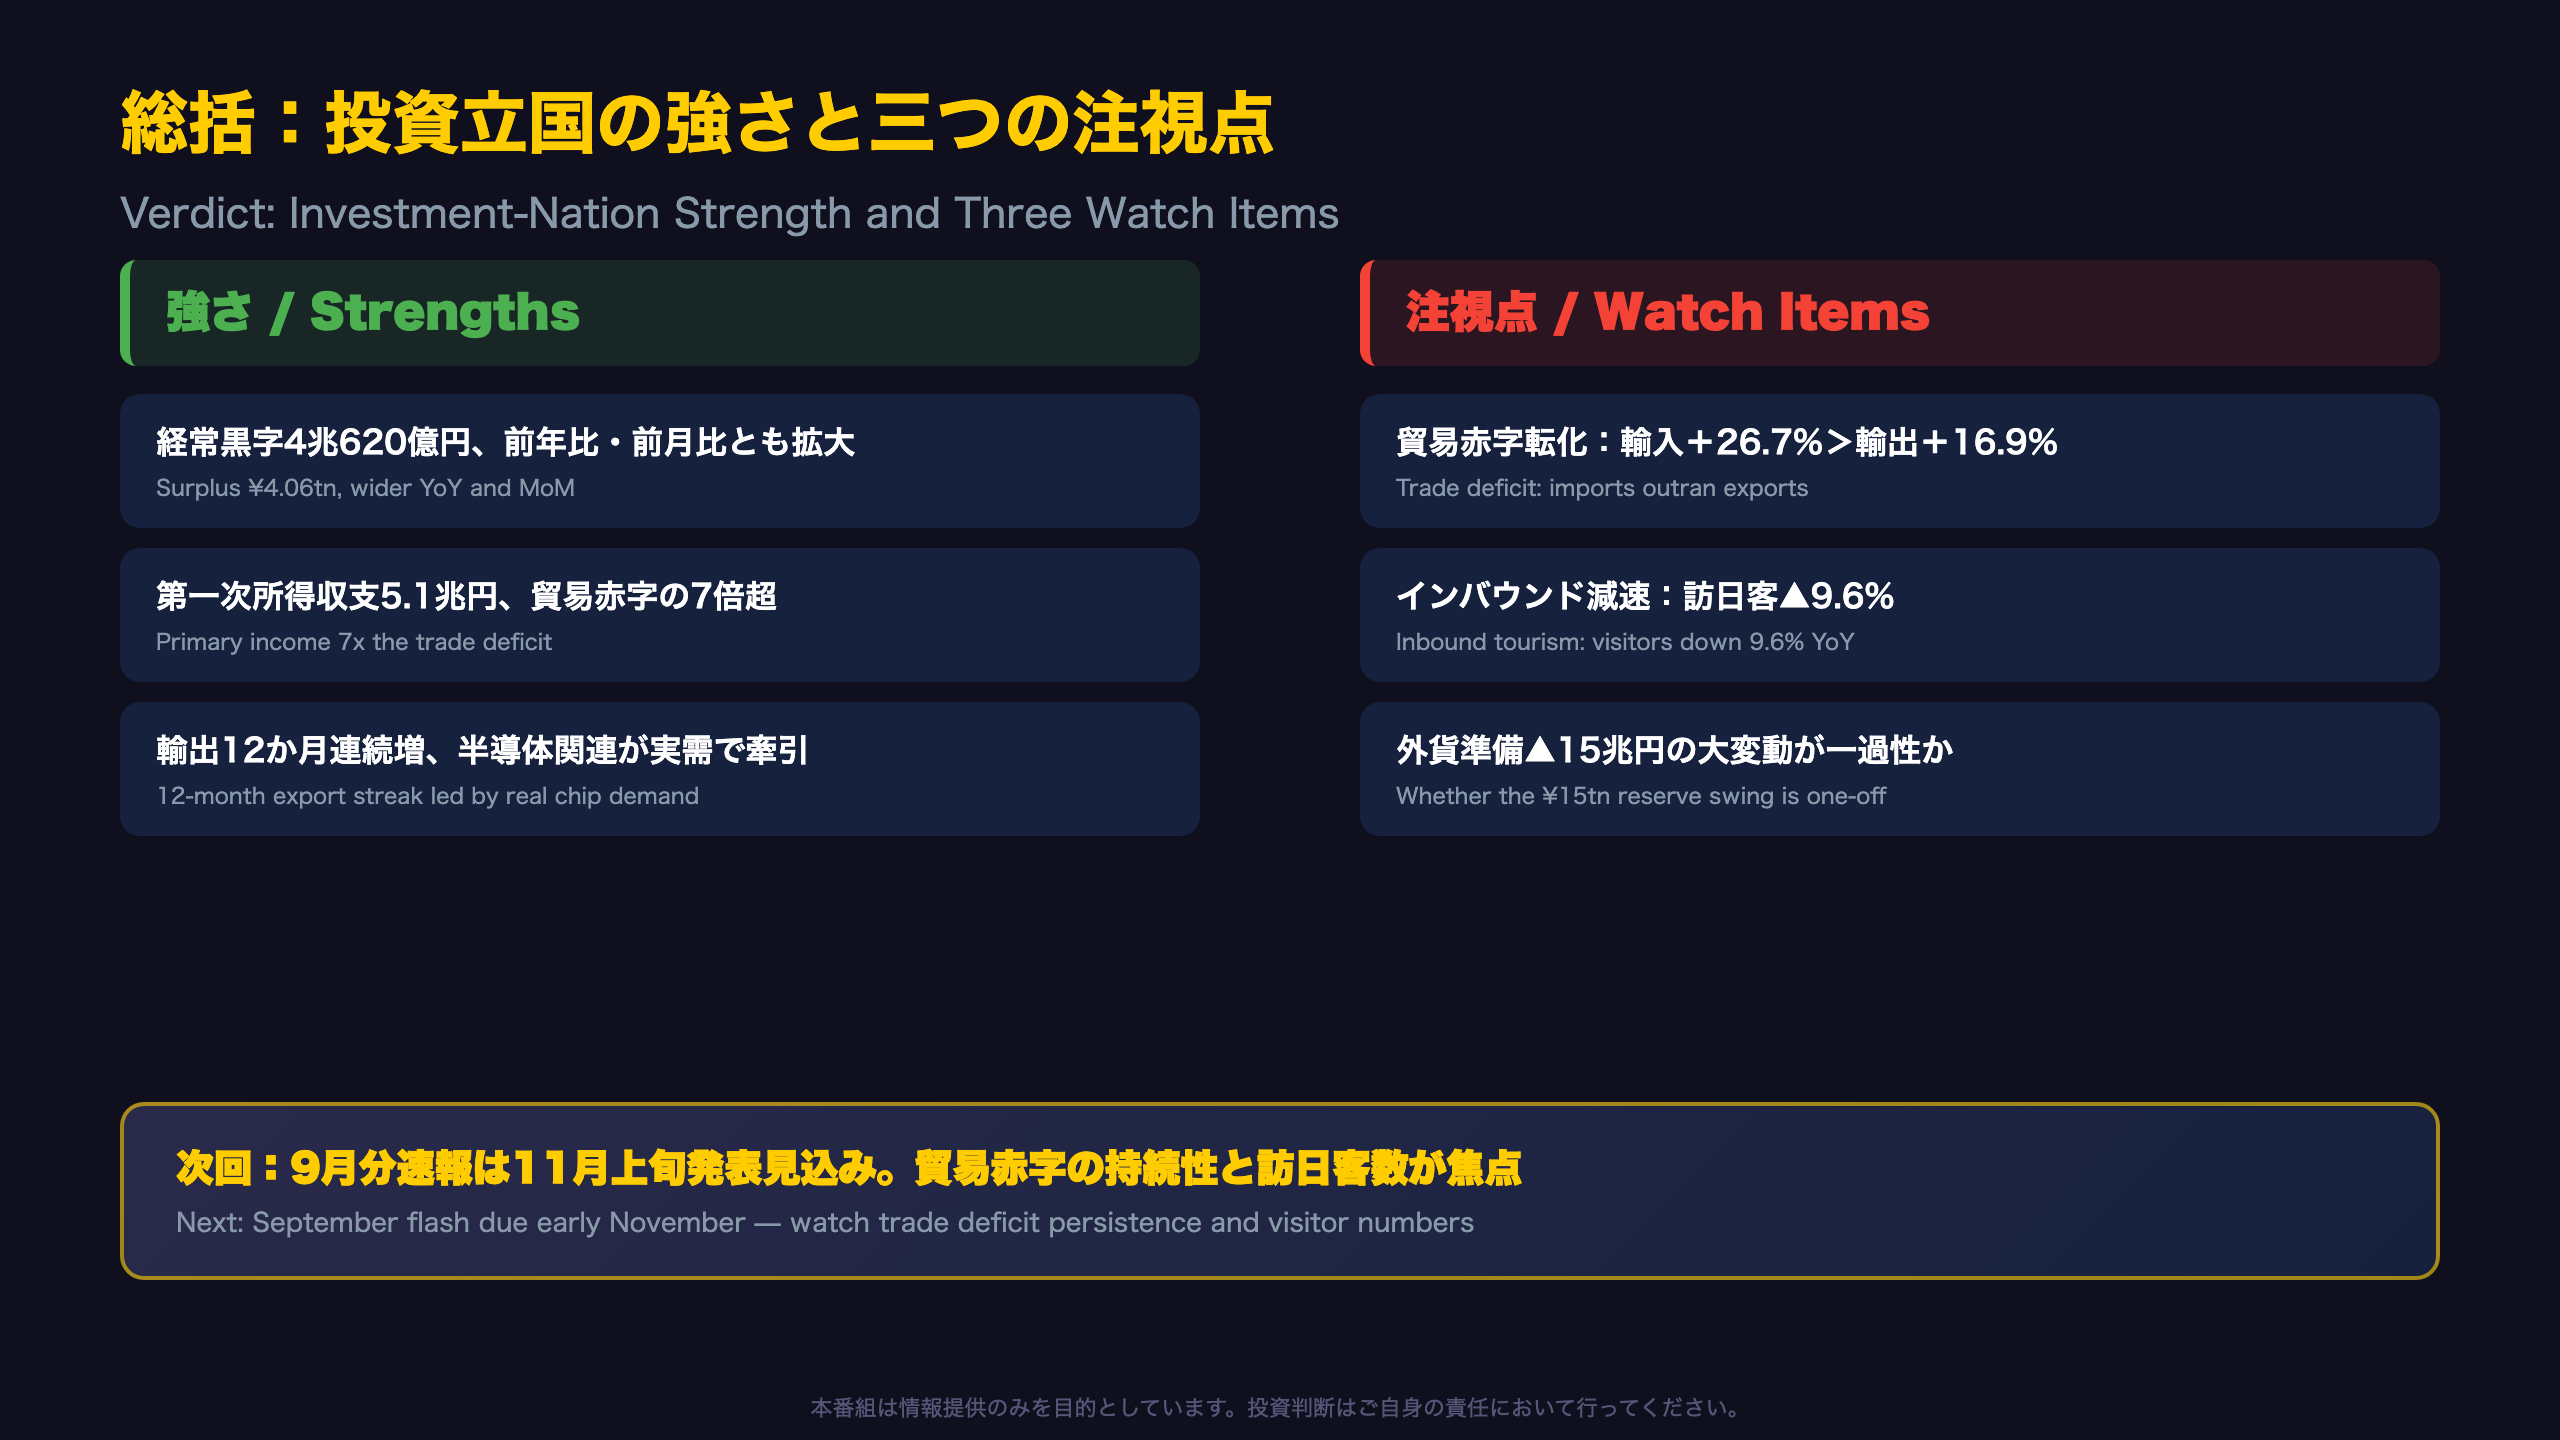
Japan’s External Balance Sheet: Strengths vs. Watch Items
The resilience case
- Current account surplus of ¥4.06tn, expanding both YoY and MoM
- Primary income of ¥5.13tn—more than seven times the trade deficit
- Exports up 12 straight months, with chip equipment volumes up 43.1% (real demand, not just price)
- Services deficit narrowed by ¥151bn YoY
The risk case
- Trade balance back in deficit as imports (+26.7%) outran exports (+16.9%)
- Crude oil up 53.1% YoY in yen terms
- Inbound visitors down 9.6%—two straight months without growth
- Violent capital-flow swings: FX reserves -¥15tn; foreigners flipped to net sellers of Japanese stocks
What it means for markets
For FX, the data reinforces a familiar asymmetry: Japan’s surplus is income-based and partially reinvested abroad, so it provides less mechanical yen support than headline figures imply. For equities, the 12-month export streak and chip-equipment volume growth support the Japan tech-capex theme, while the inbound slowdown is a caution flag for retail, hotel, and railway names. For rates watchers, the reserve drawdown—unexplained in this release—will draw scrutiny when MOF publishes its separate intervention data.
Next up
The September flash report is expected in early November, following MOF’s usual schedule (roughly five weeks after month-end). Key checks: whether the trade deficit persists as oil’s YoY base effect fades, whether inbound visitor declines extend to a third month, and whether August’s reserve swing proves one-off. Cross-referencing MOF’s seasonally adjusted series will help separate trend from noise.
Disclaimer: This article is for informational purposes only. All investment decisions are made solely at your own risk.







