📺 Watch the Full Video Analysis
This article was automatically generated by the NFC Market Live AI analysis system. (Updated: 2026-10-08 17:51 JST)
📄 Primary Source
財務省
https://www.mof.go.jp/policy/international_policy/reference/itn_transactions_in_securities/month.pdf
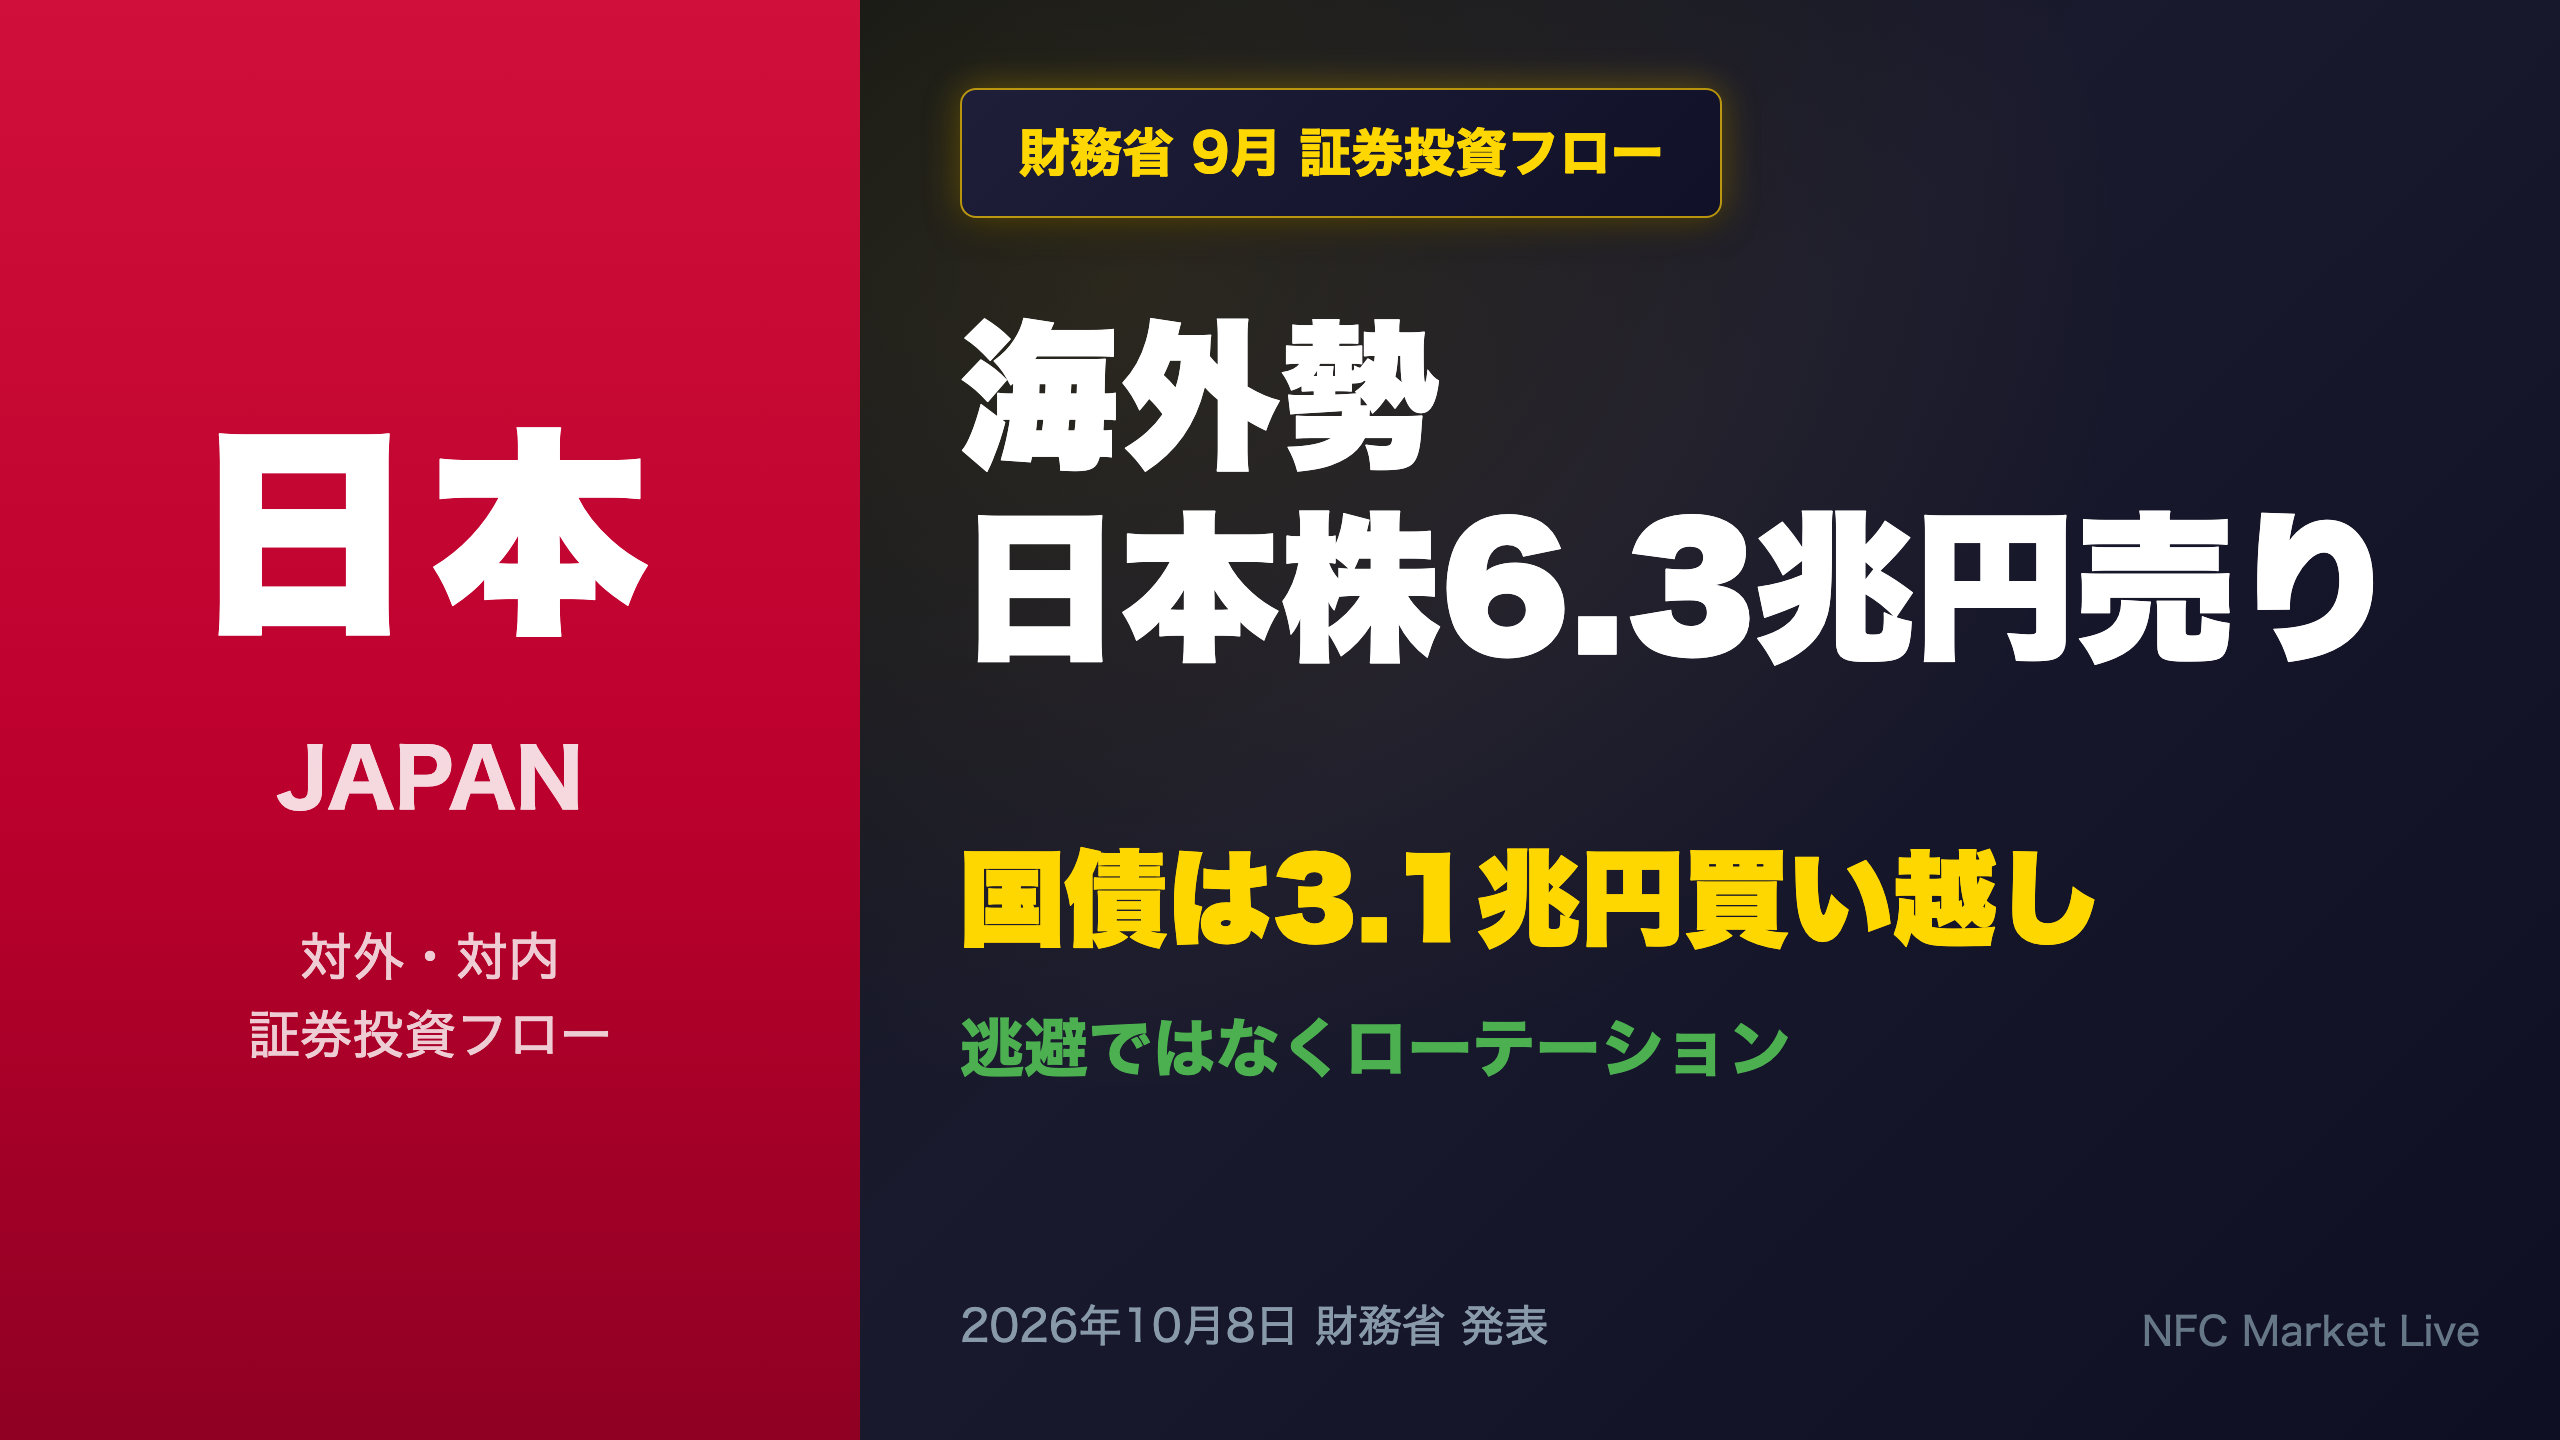
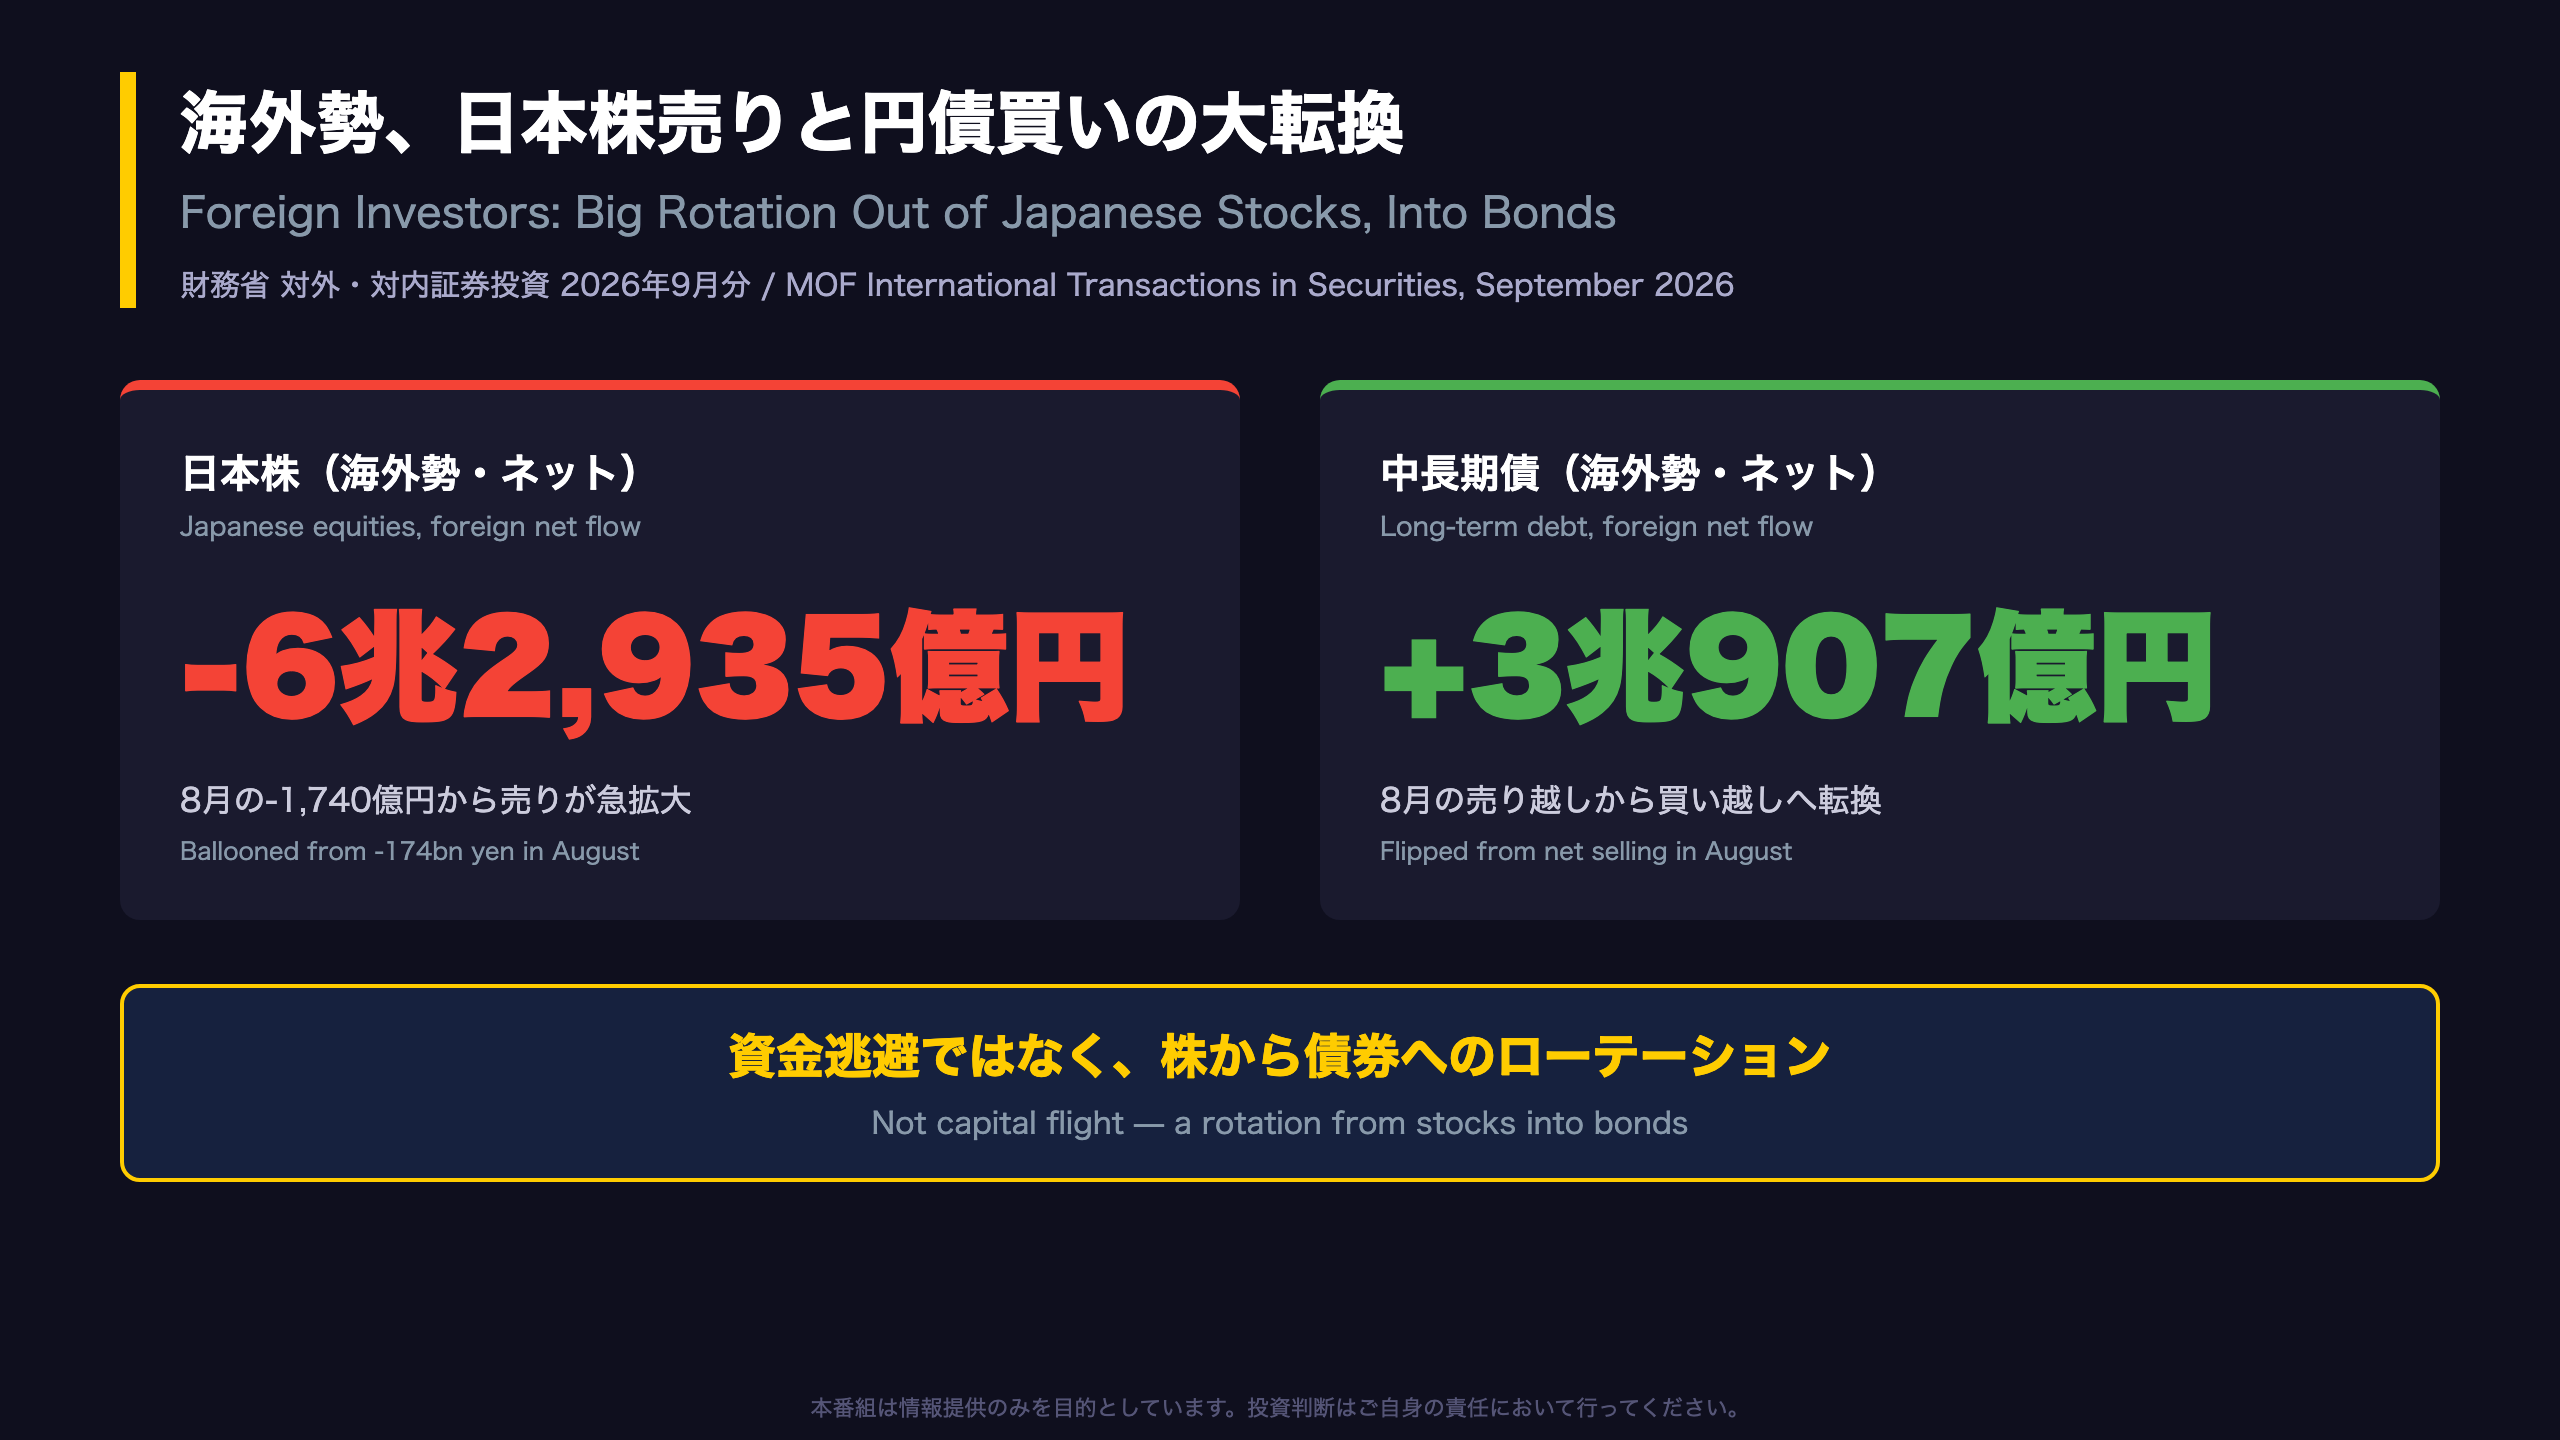
📊 Japan’s MOF reported that foreign investors sold a net ¥6.29 trillion of Japanese equities in September 2026 — with ¥6.1 trillion of selling packed into just ten days mid-month.
📈 Yet the same investors bought a net ¥3.09 trillion of Japanese long-term bonds, flipping from August’s net sales. This looks like rotation, not capital flight.
💡 Domestically, investment trusts kept buying ¥1.4T of foreign equities, while Japanese banks cut foreign bond holdings by ¥2.5T.
⚠️ Headwind for Japanese equity supply-demand, tailwind for JGBs. October data due in early November.
The Ultimate Summary:海外勢、日本株売りと円債買いの大転換
What This Report Is
Japan’s Ministry of Finance (MOF) publishes monthly \”International Transactions in Securities,\” compiled from reports by designated major investors — banks, broker-dealers, insurers, investment trust managers and asset managers. It is a contract-basis flow statistic and a key leading input for Japan’s balance of payments, broadly comparable in role to the U.S. TIC data.
The Headline
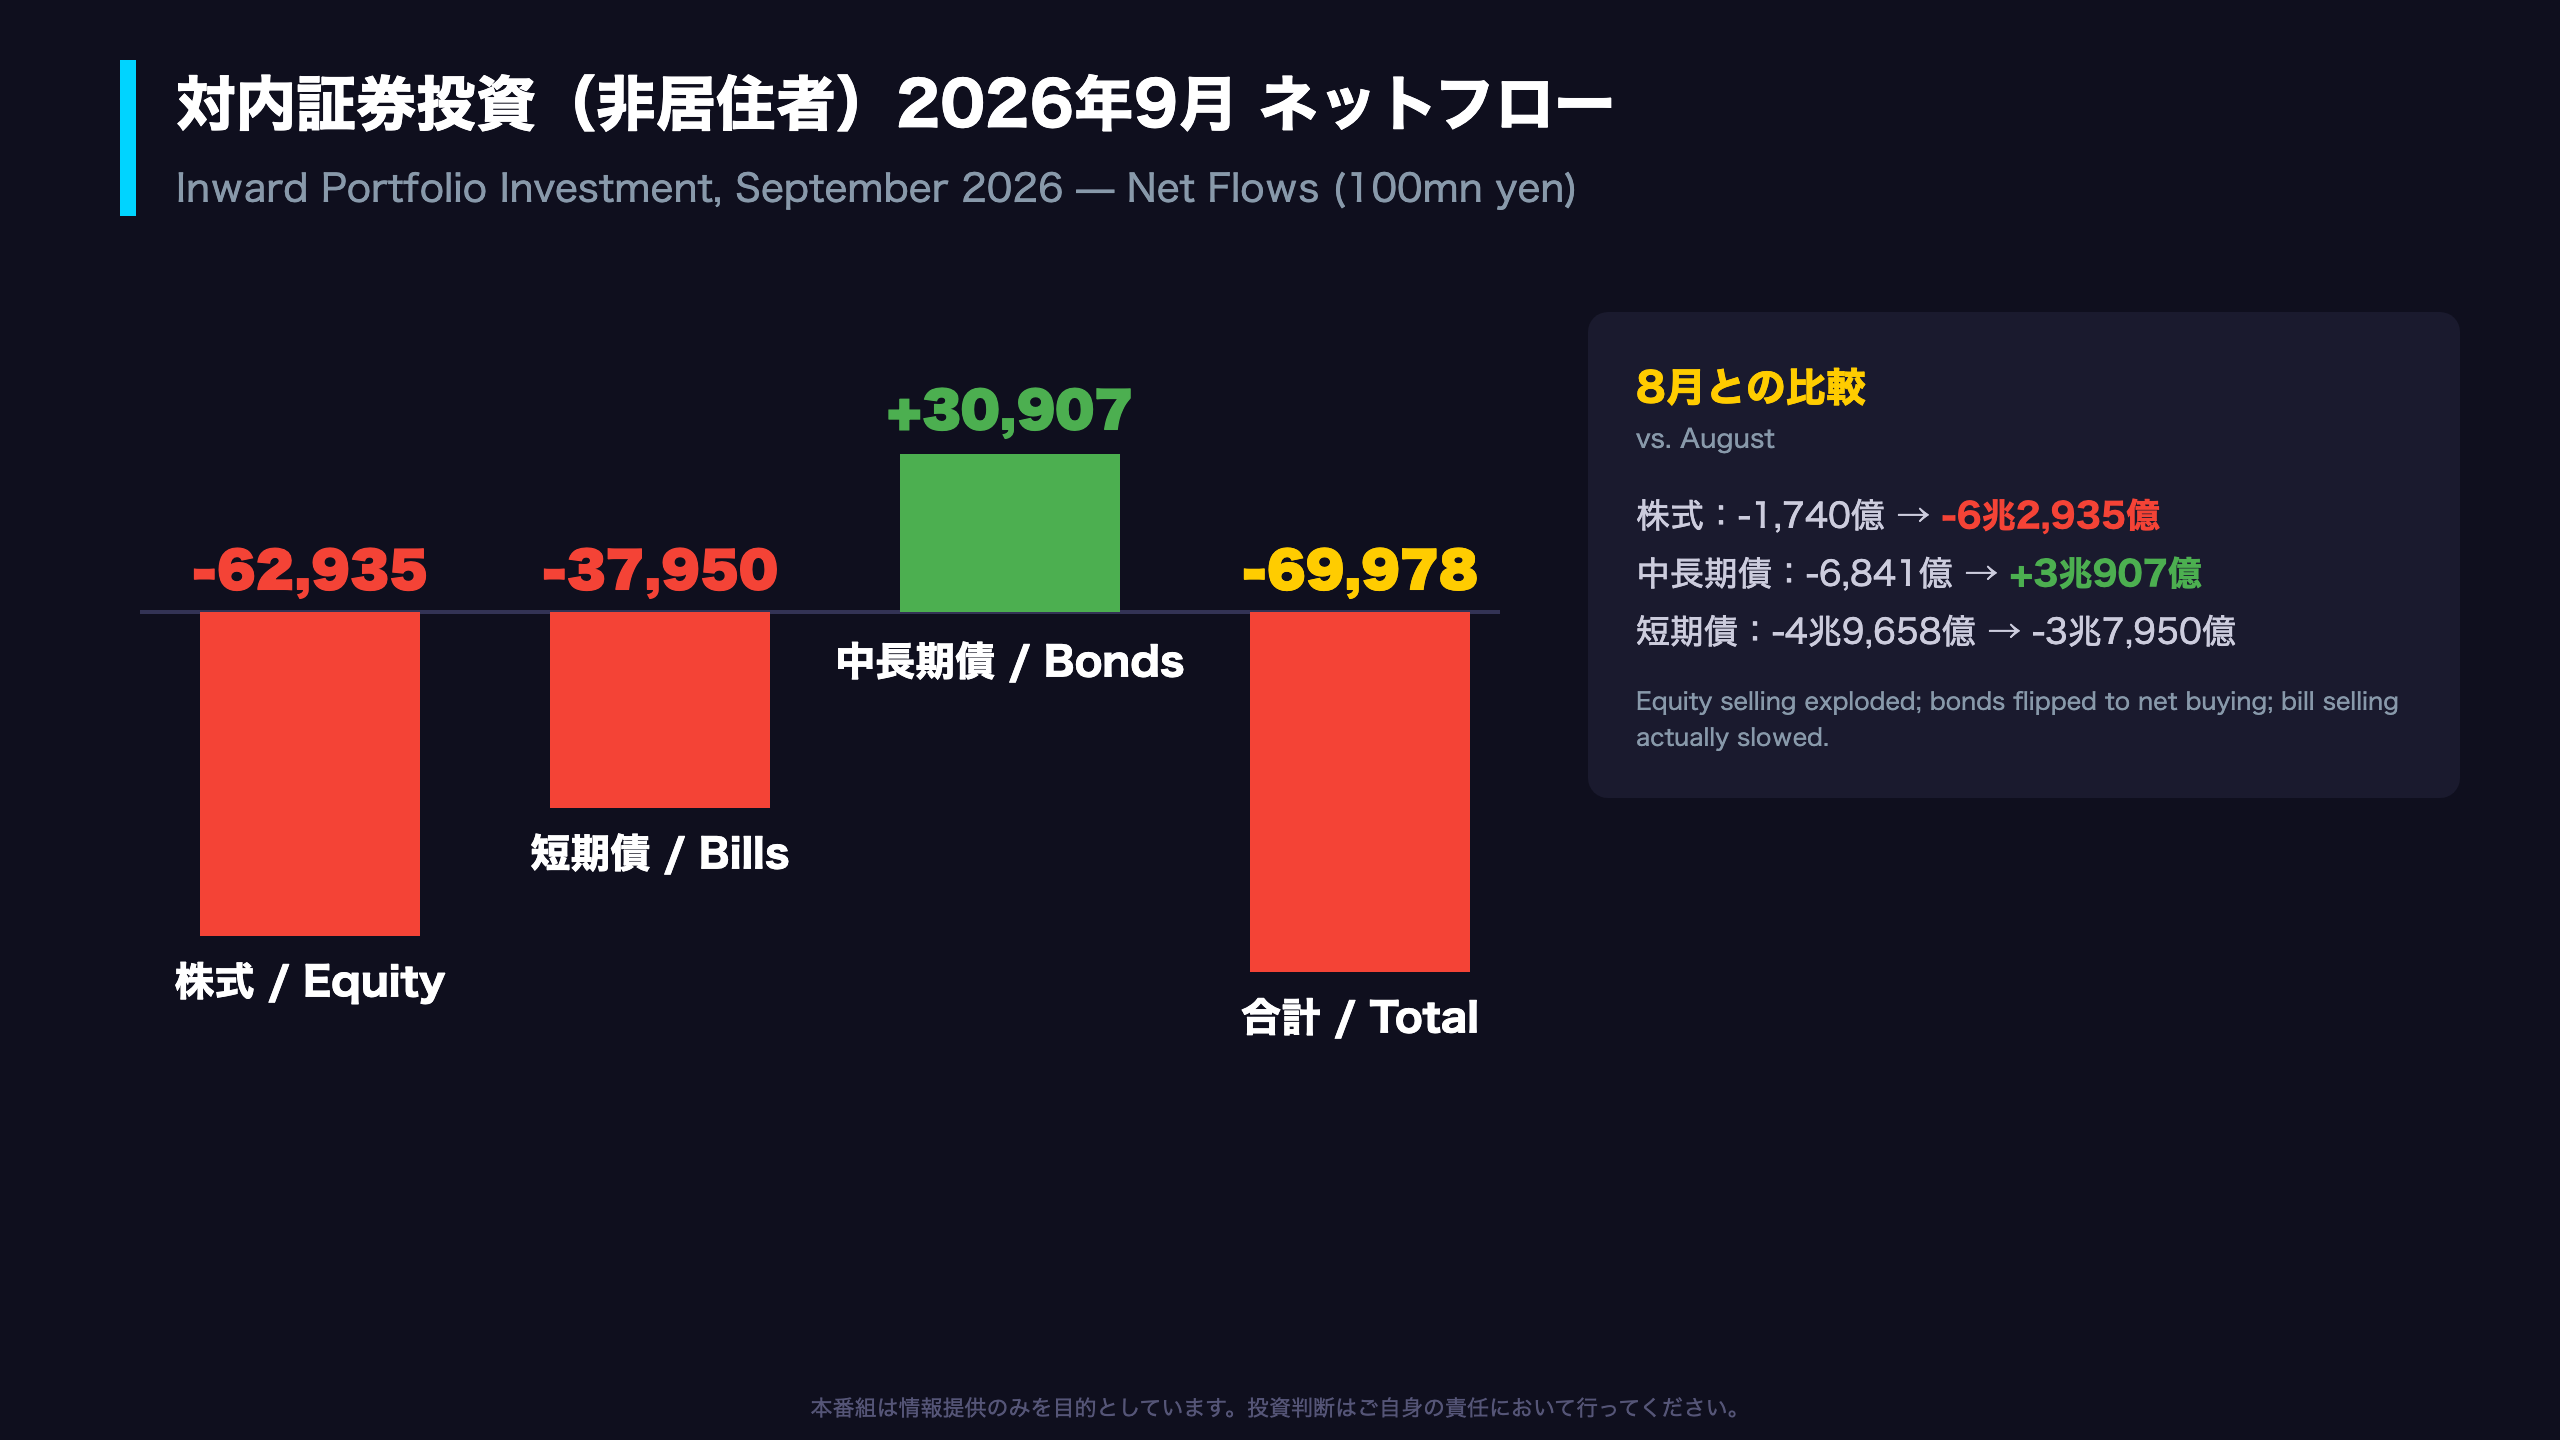
In September 2026, foreign investors sold a net ¥6.29 trillion of Japanese equities — a dramatic swing from August’s near-flat ¥174 billion net sale, roughly a 36-fold expansion in selling. Yet the same month saw ¥3.09 trillion of net foreign buying of Japanese long-term debt, reversing August’s ¥684 billion of net sales. Short-term debt recorded ¥3.8 trillion of net disposals, though that was actually smaller than August’s ¥5.0 trillion.
Why It Matters
A ¥6-trillion-plus monthly equity outflow is enormous by historical standards and a clear supply-demand headwind for the Nikkei and TOPIX. But the simultaneous rotation into JGBs argues against a wholesale \”sell Japan\” narrative: foreign money stayed in yen assets, just in a different asset class. For FX, bond inflows can be yen-supportive even as equity outflows weigh on sentiment. The composition — rotation rather than exit — is the single most important takeaway from this release.
対内証券投資の全体像:売りと買いが同居する7兆円流出
Dissecting the Inward Flows
On a gross basis, foreign trading in Japanese equities was massive: ¥141.9 trillion in acquisitions against ¥148.2 trillion in disposals — roughly ¥290 trillion of total turnover. The net sale of ¥6.3 trillion, while huge, equals only about 2% of gross turnover, meaning the market was far from one-way selling.
Reading the Short-Term Debt Line
Short-term debt (mostly T-bills) posted ¥3.79 trillion of net disposals — but this was actually smaller than August’s ¥4.97 trillion. For context, foreign T-bill flows in Japan are heavily influenced by FX swap-related cash management, making this the most volatile and least signal-rich line in the report. Single-month readings should not be extrapolated.
The Bond Reversal
Long-term debt flipped from -¥684 billion in August to +¥3.09 trillion. Notably, the ten-day breakdown shows ¥2.96 trillion of that buying occurred in early September — before the equity selling peaked — which suggests a defensive repositioning rather than a reaction.
Two Readings
Bullish: foreign demand for JGBs at current yield levels is demonstrably alive. Bearish: total inward flows of -¥7.0 trillion follow August’s -¥5.8 trillion, marking two consecutive months of large outflows; if sustained, that would weigh on demand for yen assets. Both readings are defensible — the October data will arbitrate.
旬別分析:売り越しの97%が中旬10日間に集中
The Ten-Day Breakdown: A Time-Limited Shock
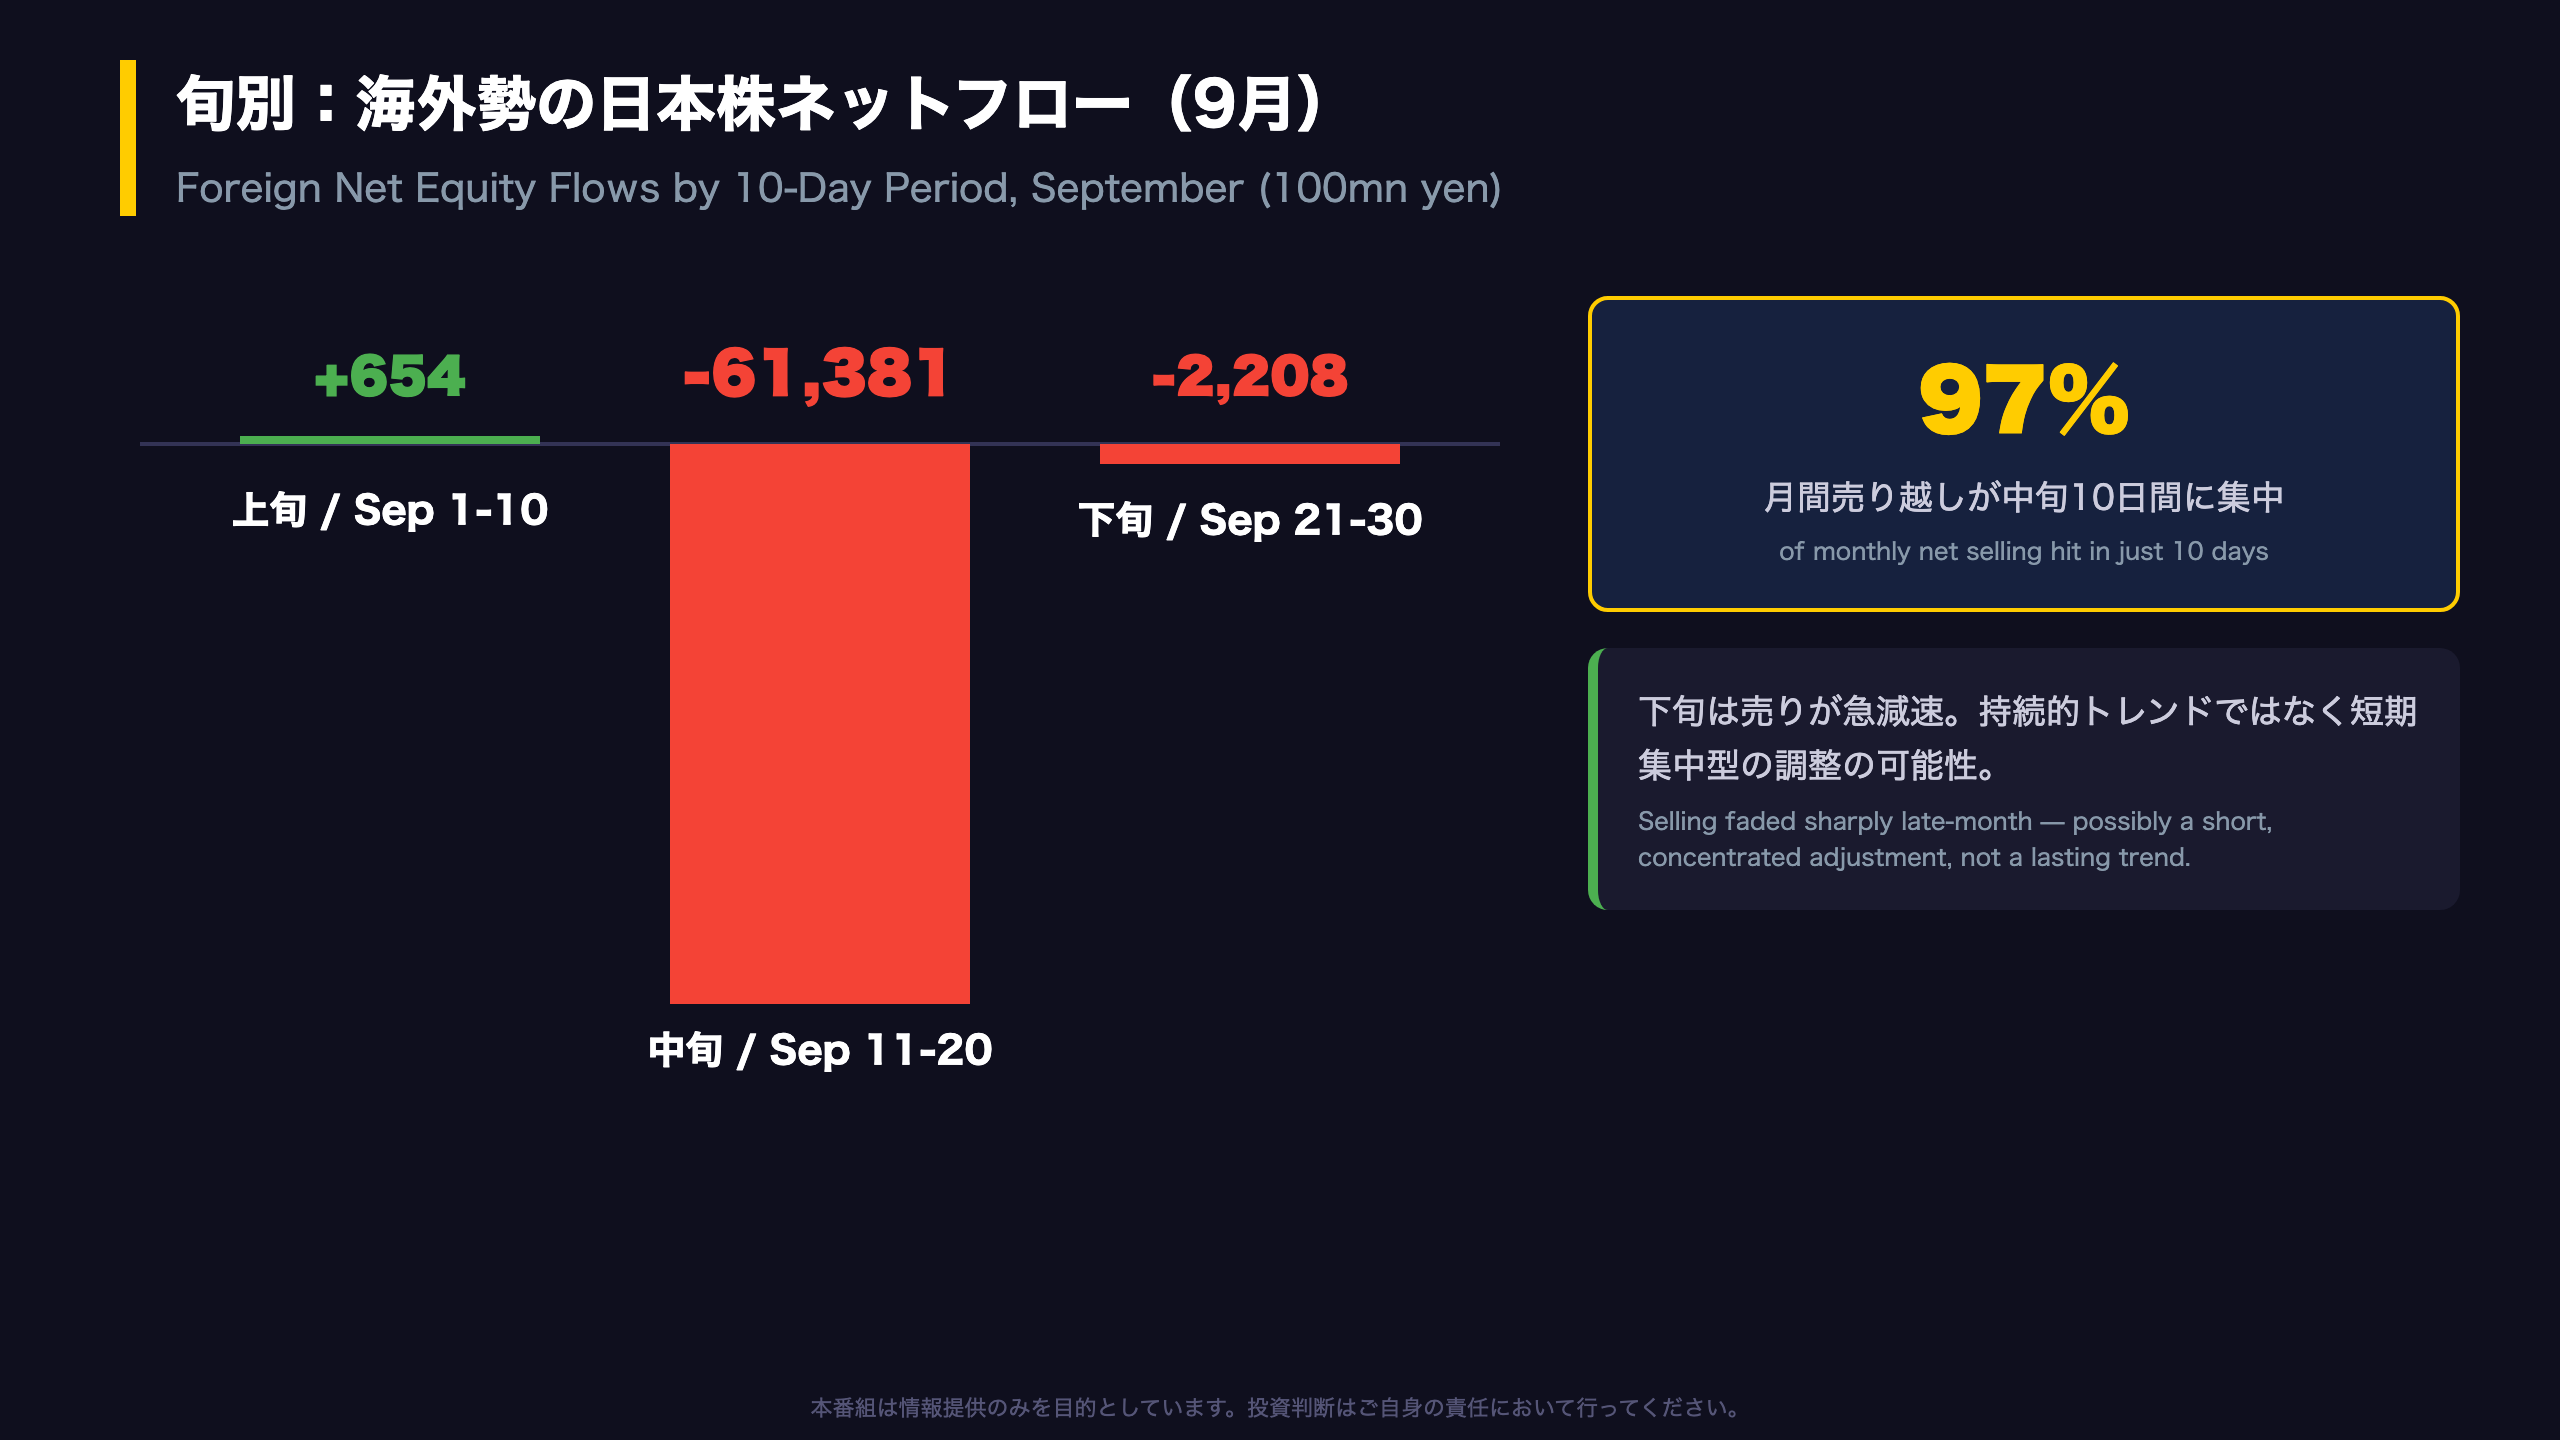
Unlike the U.S. TIC data, Japan’s MOF securities statistics provide ten-day (\”jun\”) splits within each month — a granularity that proves decisive here. Foreign net flows into Japanese equities ran: early September +¥65bn, mid-September -¥6.14 trillion, late September -¥221bn. Roughly 97% of the month’s net selling landed in one ten-day window.
Bonds Were Bought First
Foreign buying of Japanese long-term debt was concentrated in early September (+¥2.96 trillion), before the equity selling peaked. Mid-month bond flows were flat (-¥33bn) and late-month flows modestly positive (+¥168bn). The sequencing — bonds first, then equity sales — is consistent with a deliberate defensive rotation rather than panic liquidation.
Quarter-End Effects in Bills
Short-term debt saw its largest net disposal in late September (-¥5.52 trillion), plausibly linked to quarter-end balance-sheet management and maturing bill positions, though the statistic itself cannot confirm motives.
What We Cannot Know
This report does not identify seller nationality, type, or intent. Calling this \”foreigners abandoning Japanese stocks\” would overreach the data. What is verifiable: enormous gross two-way turnover (¥43.9T bought vs ¥50.0T sold mid-month) and an extreme temporal concentration of net selling — followed by near-silence in the final ten days.
対外証券投資:国内勢は外債売り・外国株買いの選別
The Resident Side of the Ledger
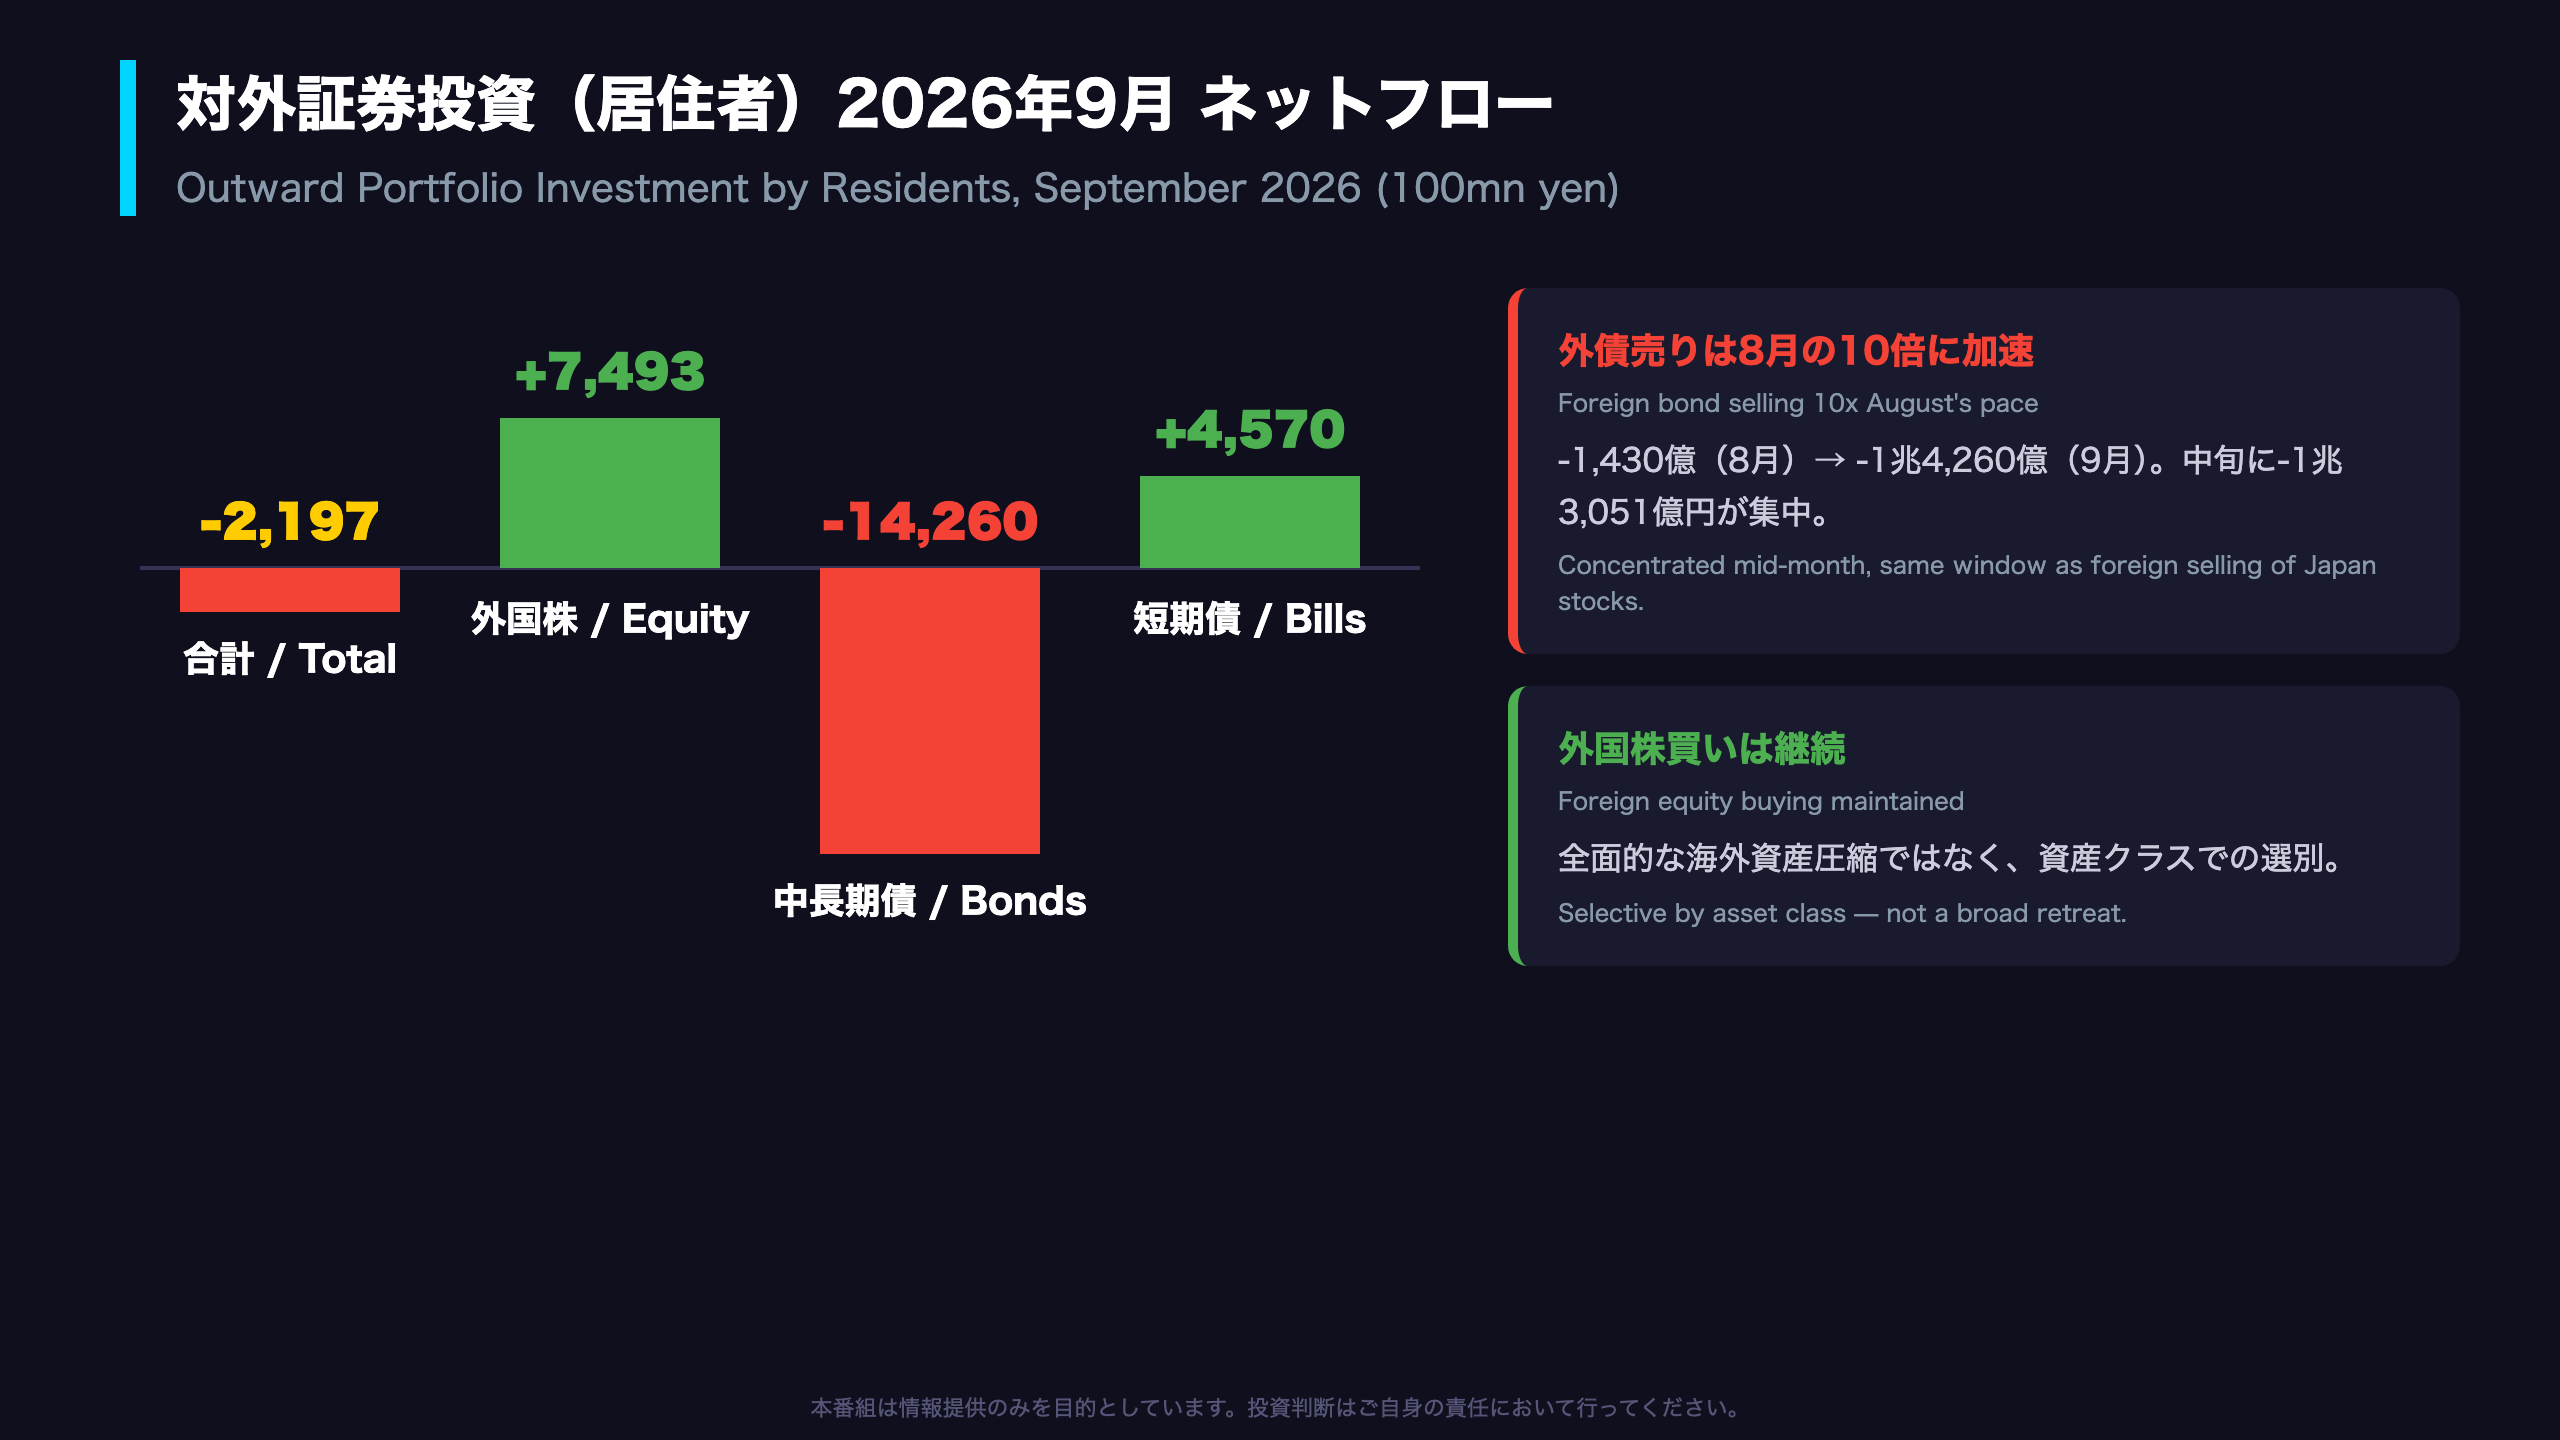
Japanese residents’ outward portfolio investment flipped to a net disposal of ¥220 billion in September, from net buying of ¥137 billion in August. The report’s appendix — unique among major flow statistics — breaks this down by investor type, which the next slide covers; here we focus on asset class.
Foreign Bonds: A Tenfold Acceleration in Selling
Residents sold a net ¥1.43 trillion of foreign long-term bonds, versus just ¥143 billion in August. The ten-day split shows early-month buying (+¥628bn) reversing to heavy mid-month selling (-¥1.31T) — the same window in which foreigners dumped Japanese equities. One plausible reading: global bond positions were being trimmed on both sides of the border simultaneously, though the statistic cannot confirm the motive.
Foreign Equities: Still Being Bought
Residents maintained net purchases of foreign equities (+¥749bn), with buying resurging late-month (+¥833bn in the final ten days) after a brief mid-month pause. This is the household/NISA channel at work — structurally persistent demand for overseas stocks.
FX Implications
If the foreign bond sales represent repatriation, they imply yen-buying demand. However, if the bonds were currency-hedged, unwinding them has limited spot-FX impact. The MOF data does not distinguish hedged from unhedged positions, so firm conclusions on dollar-yen should be resisted. The key fact: this was selective de-risking, not wholesale retreat from overseas assets.
部門別:外債を売る銀行、買い続ける年金と家計
Inside the Investor-Type Appendix
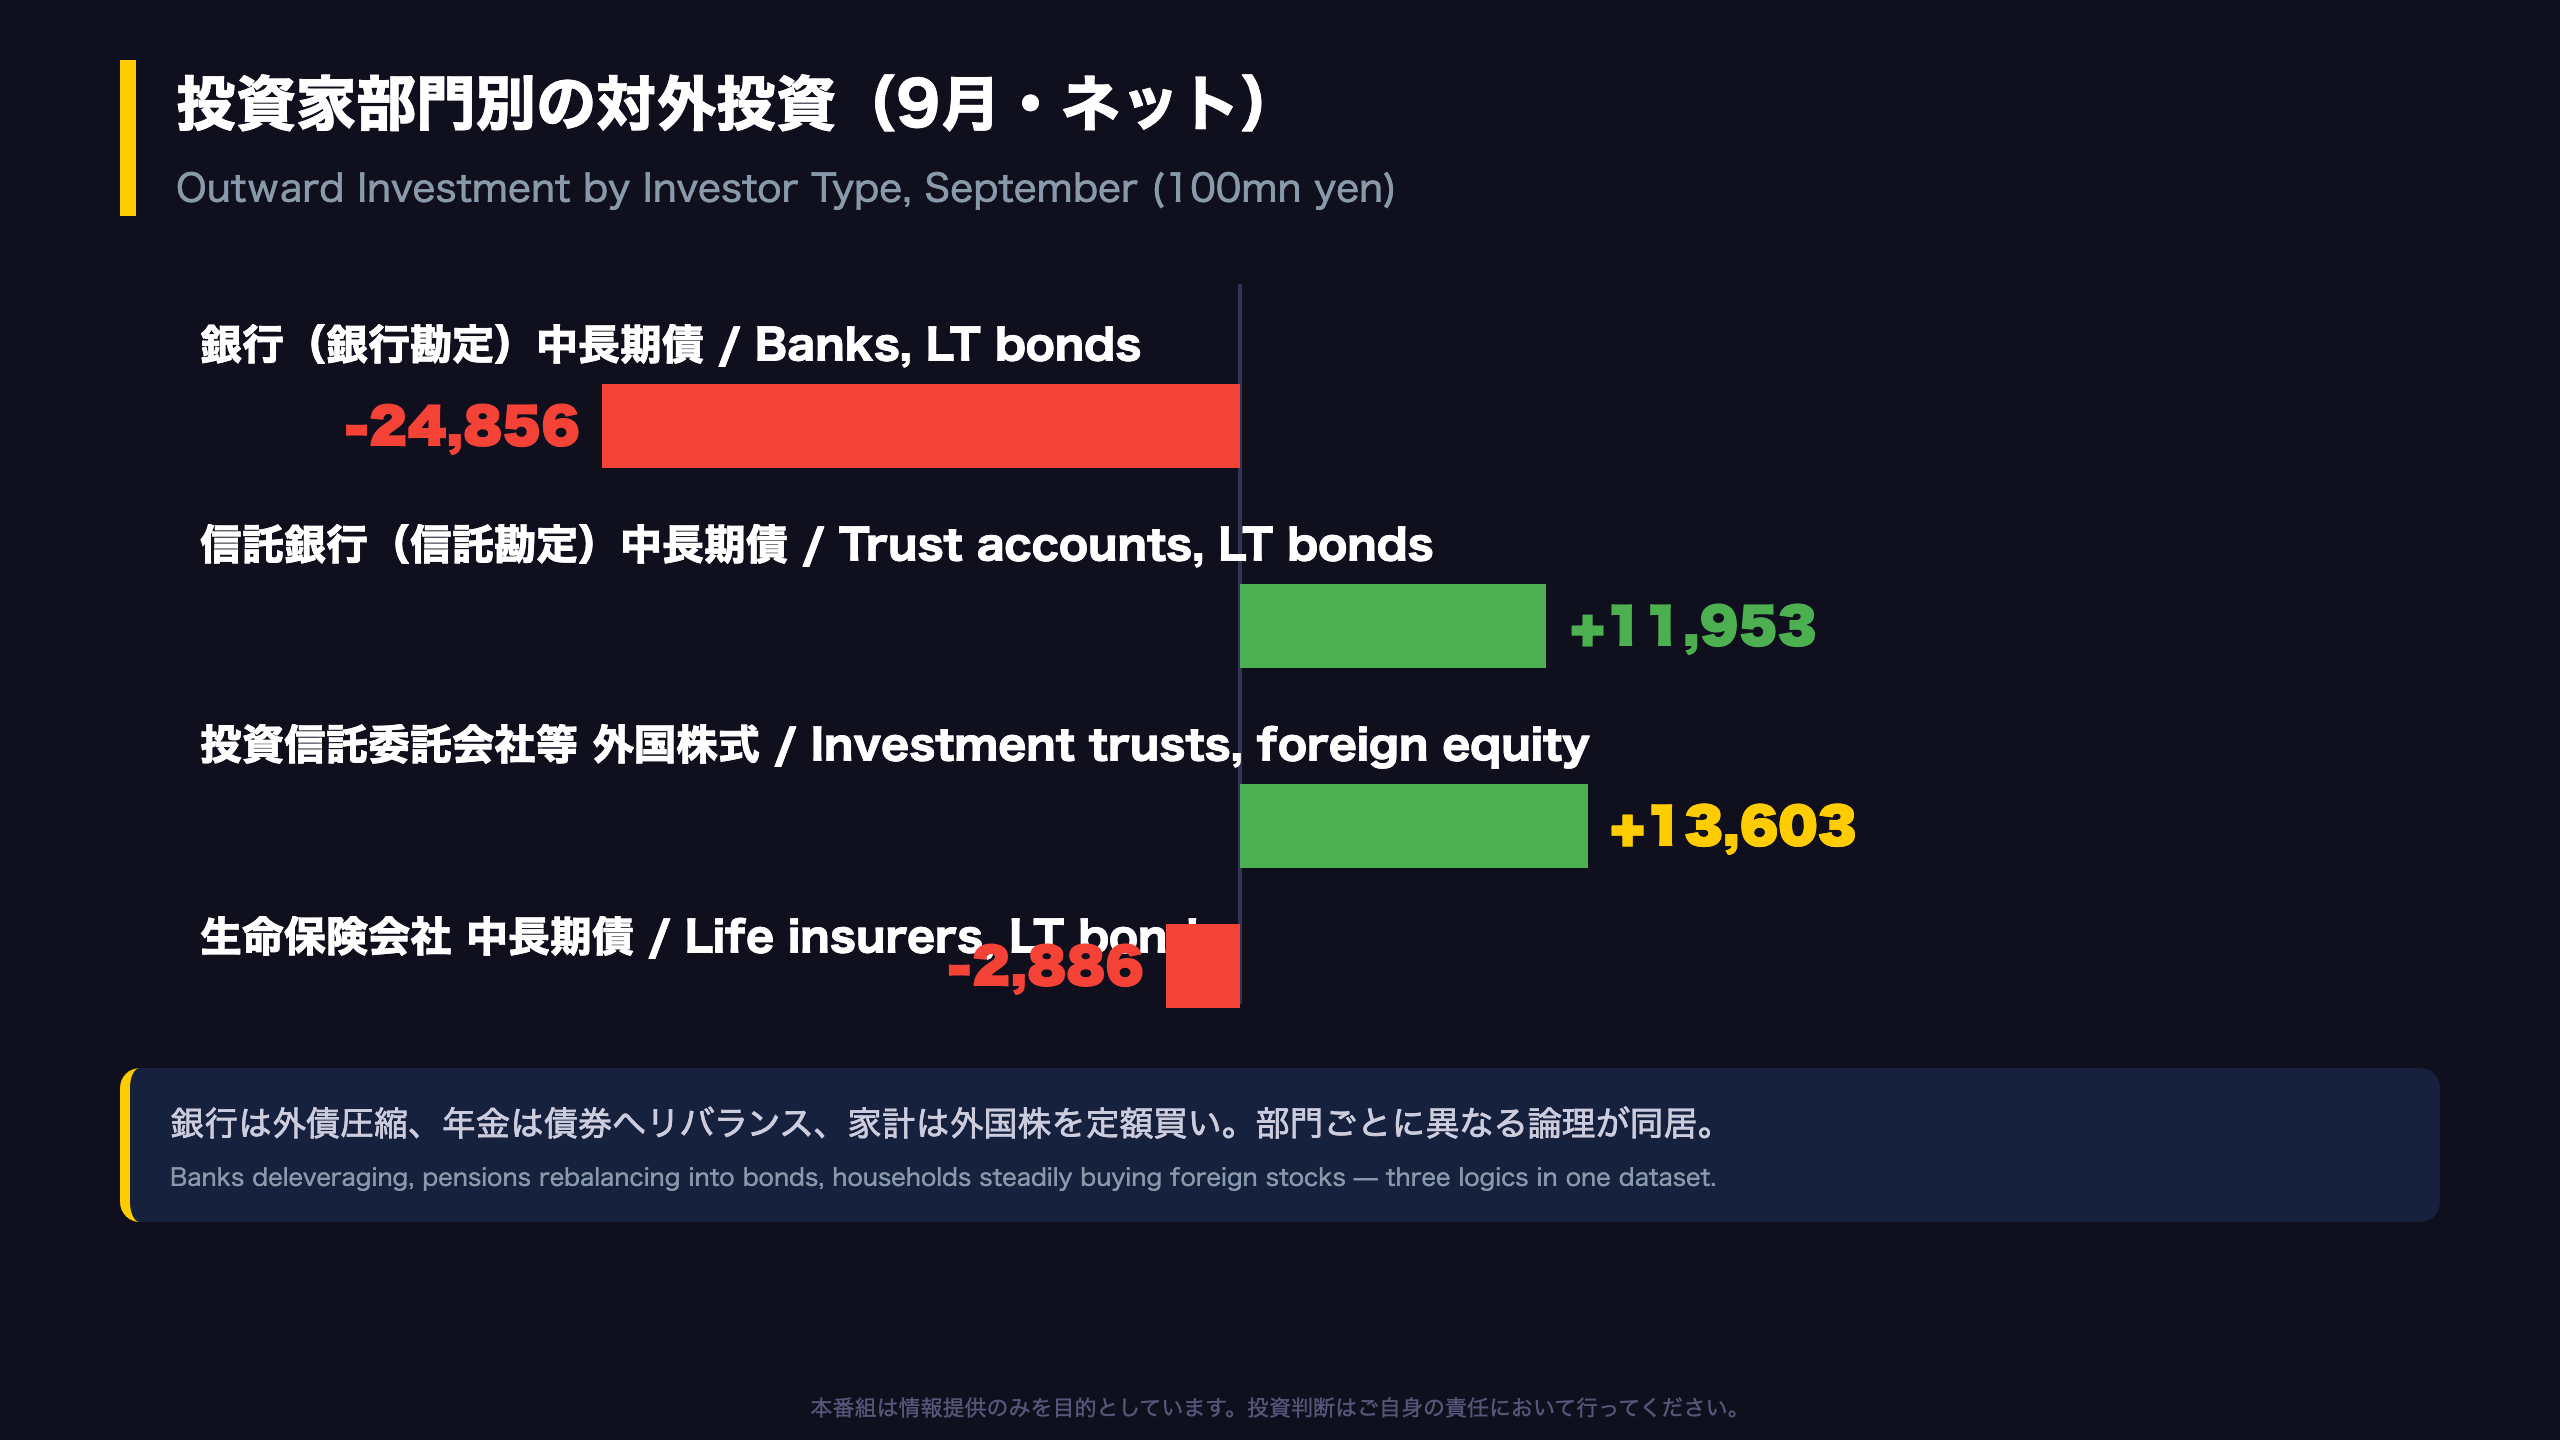
A distinctive feature of Japan’s MOF flow data is the appendix breaking outward investment down by investor type — banks, trust accounts (a proxy for pension money, including flows connected to Japan’s giant public and corporate pension complex), insurers, broker-dealers, and investment trust managers (the vehicle for retail flows, including the tax-advantaged NISA program).
Banks: Targeted Deleveraging
Banks’ banking accounts sold a net ¥2.49 trillion of foreign long-term bonds — nearly double August’s ¥1.31 trillion — while flipping short-term debt from -¥1.05T to +¥283bn. The pattern points to a deliberate reduction of duration-bearing foreign bond exposure rather than across-the-board de-risking.
Pensions: Classic Rebalancing
Trust banks’ trust accounts sold ¥488 billion of foreign equities while buying ¥1.20 trillion of foreign bonds. In August the same accounts were equity buyers (+¥567bn). Selling equities and buying bonds after market strength is textbook pension rebalancing behavior.
Retail: The Steady Bid
Investment trust managers bought ¥1.36 trillion of foreign equities, nearly identical to August’s ¥1.35 trillion. This is the structural household channel — contribution-driven, largely insensitive to monthly market noise, and a persistent source of yen-selling flow worth watching for FX investors.
Three sectors, three logics: bank balance-sheet management, pension rebalancing, and retail accumulation — all coexisting within one month’s data.
総括:非対称なフローが示す強さと弱さ
Scorecard and What to Watch
Strengths
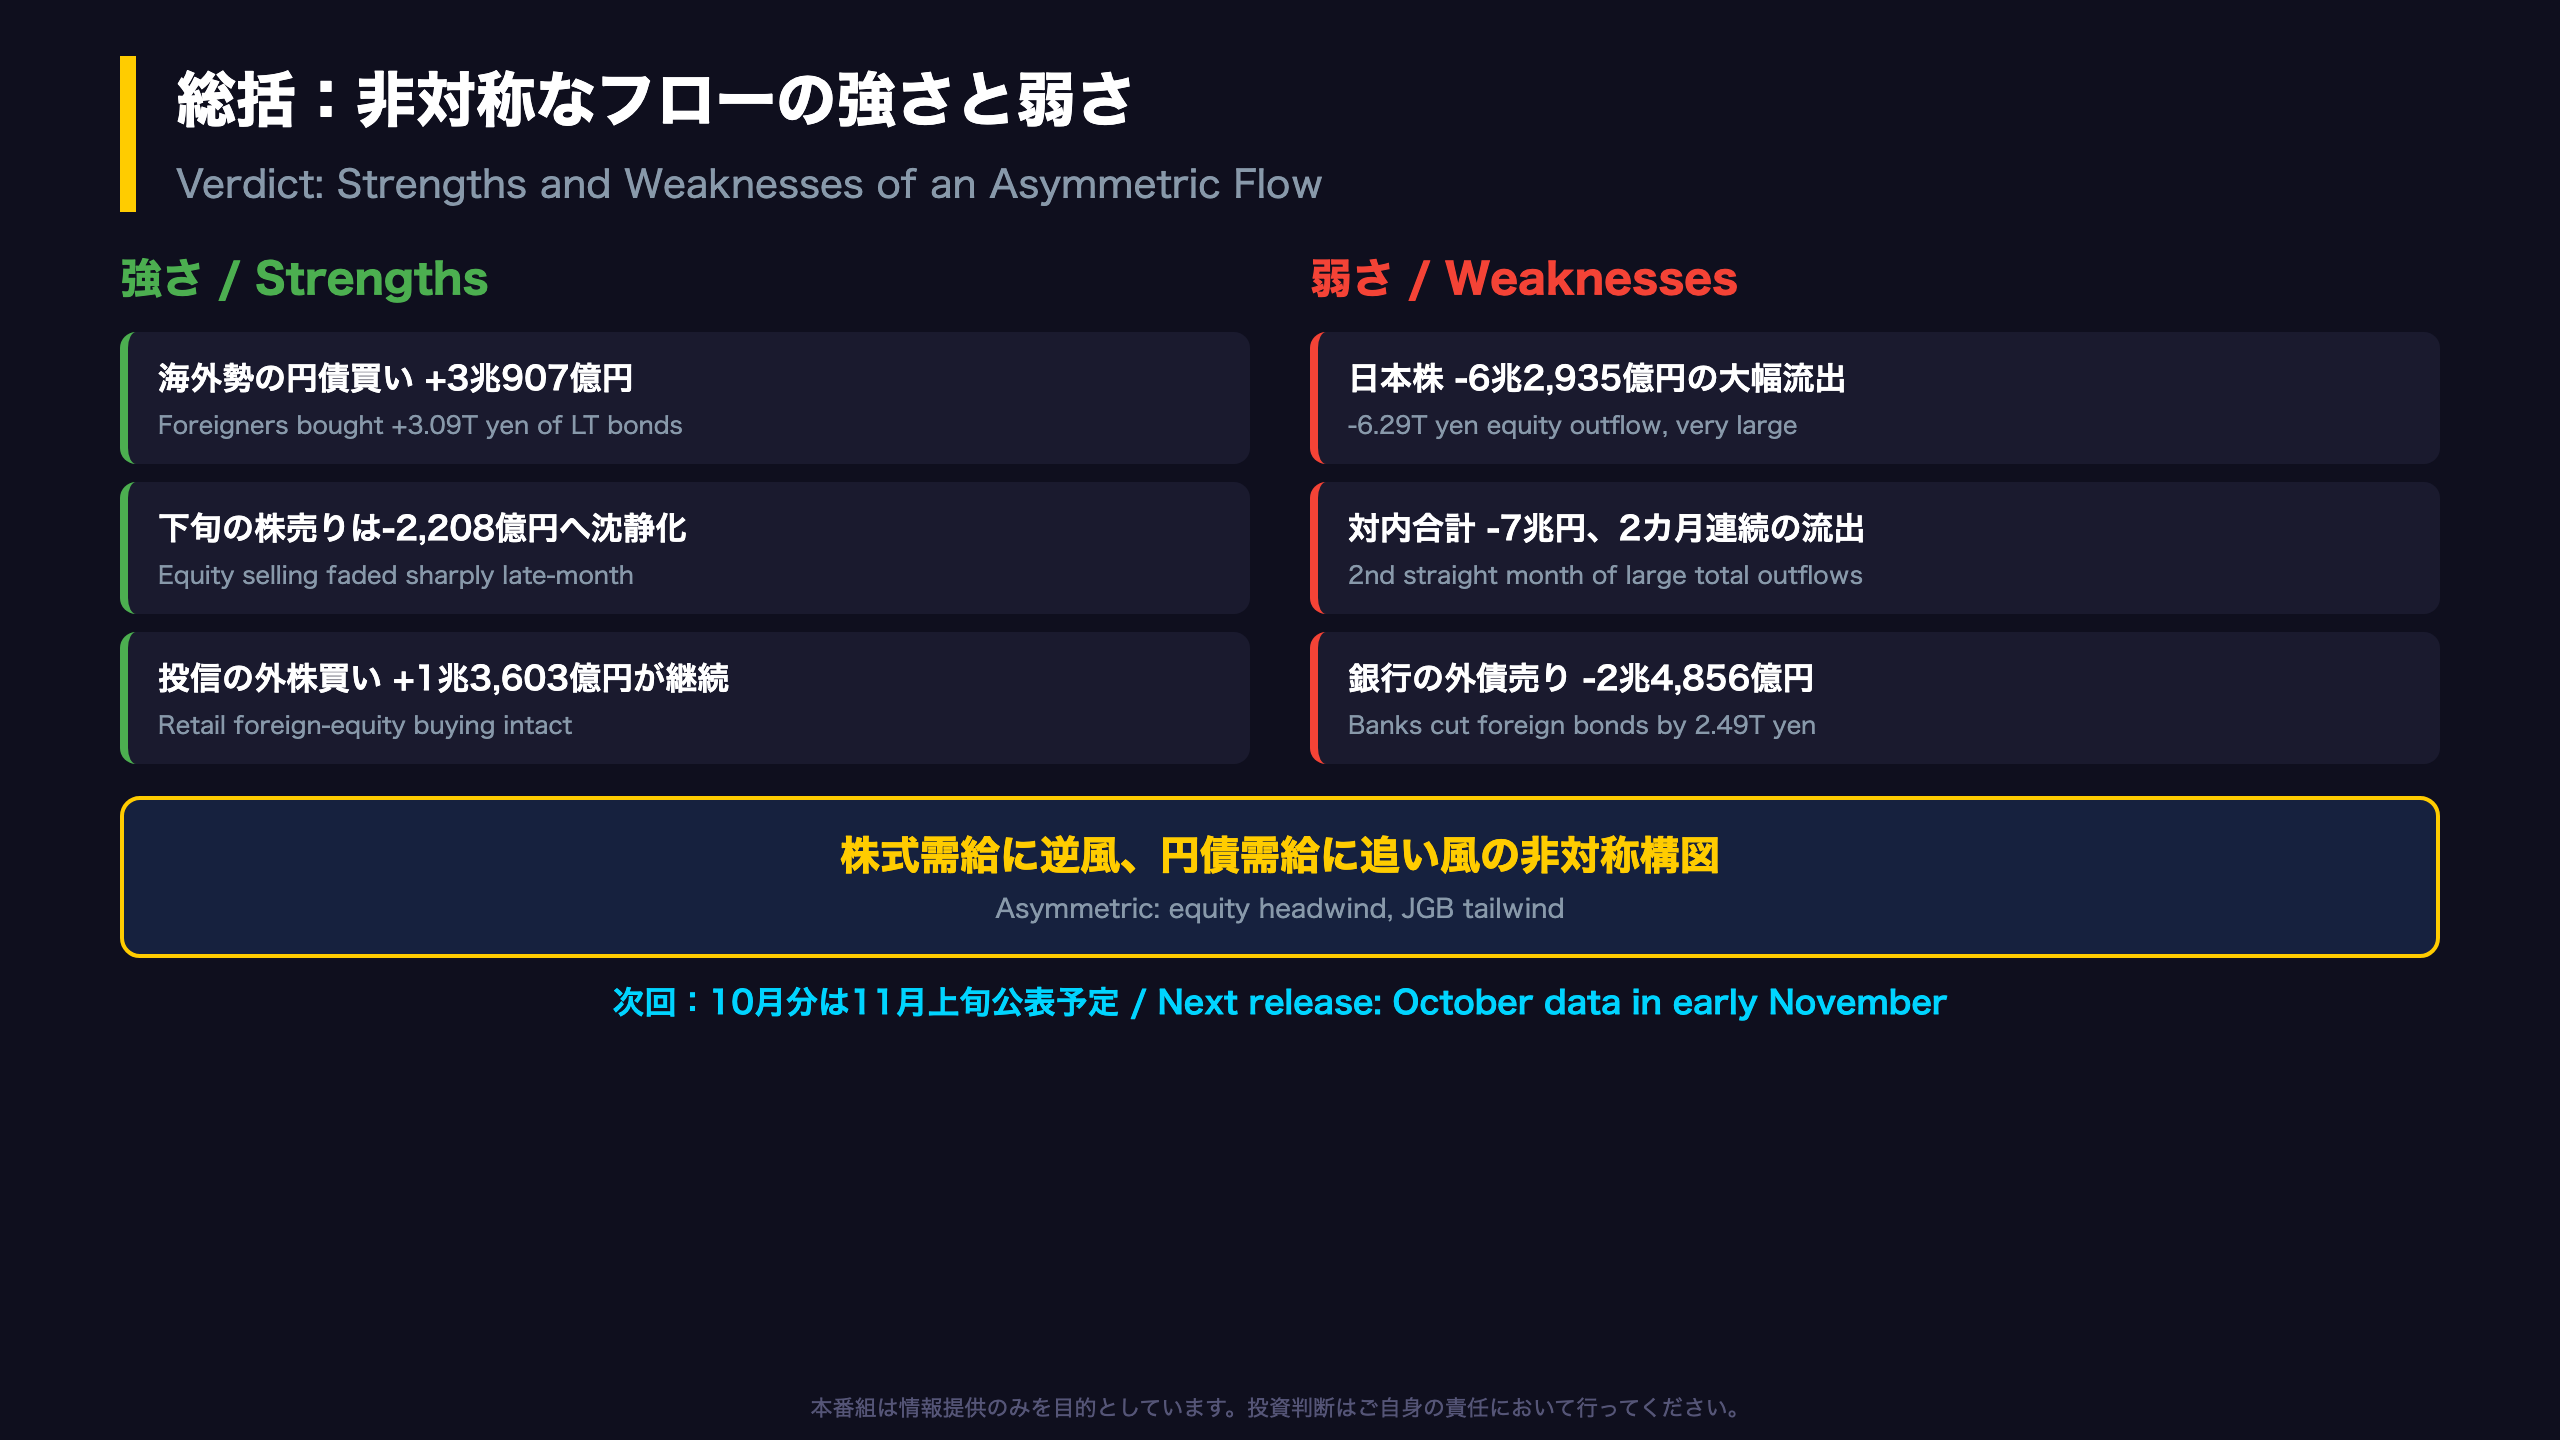
- Foreign buying of long-term Japanese debt: +¥3.09 trillion — demand for JGBs at current yields is real
- Equity selling collapsed to -¥221 billion in the final ten days — pressure looks time-limited
- Investment trust buying of foreign equities: +¥1.36 trillion — the retail channel is unshaken
Weaknesses
- Japanese equities: -¥6.29 trillion, an exceptionally large single-month net sale
- Total inward flows: -¥6.99 trillion, the second consecutive month of large outflows after August’s -¥5.8 trillion
- Banks cut foreign long-term bonds by ¥2.49 trillion, signaling ongoing balance-sheet adjustment
Scenario Map
If October’s data shows equity selling shrinking sharply, the September episode reads as a one-off position adjustment. If multi-trillion-yen selling resumes, the structural underweight-Japan hypothesis gains credibility and deserves testing. Either way, whether foreign bond buying persists will be the cleanest gauge of overall demand for yen assets.
For Global Investors
Japan’s MOF also publishes a weekly version of this report, allowing flow confirmation well ahead of the monthly release. With its ten-day splits and investor-type appendix, this dataset offers granularity that the U.S. TIC data lacks — making it one of the highest-resolution public tools for tracking foreign positioning in the world’s third-largest equity market. October figures are due in early November.
Disclaimer: This article is for informational purposes only. All investment decisions are made solely at your own risk.







