📺 Watch the Full Video Analysis
This article was automatically generated by the NFC Market Live AI analysis system. (Updated: 2026-10-05 14:14 JST)
📄 Primary Source
内閣府経済社会総合研究所
https://www.esri.cao.go.jp/jp/stat/shouhi/gaiyou.pdf, https://www.esri.cao.go.jp/jp/stat/shouhi/honbun.pdf
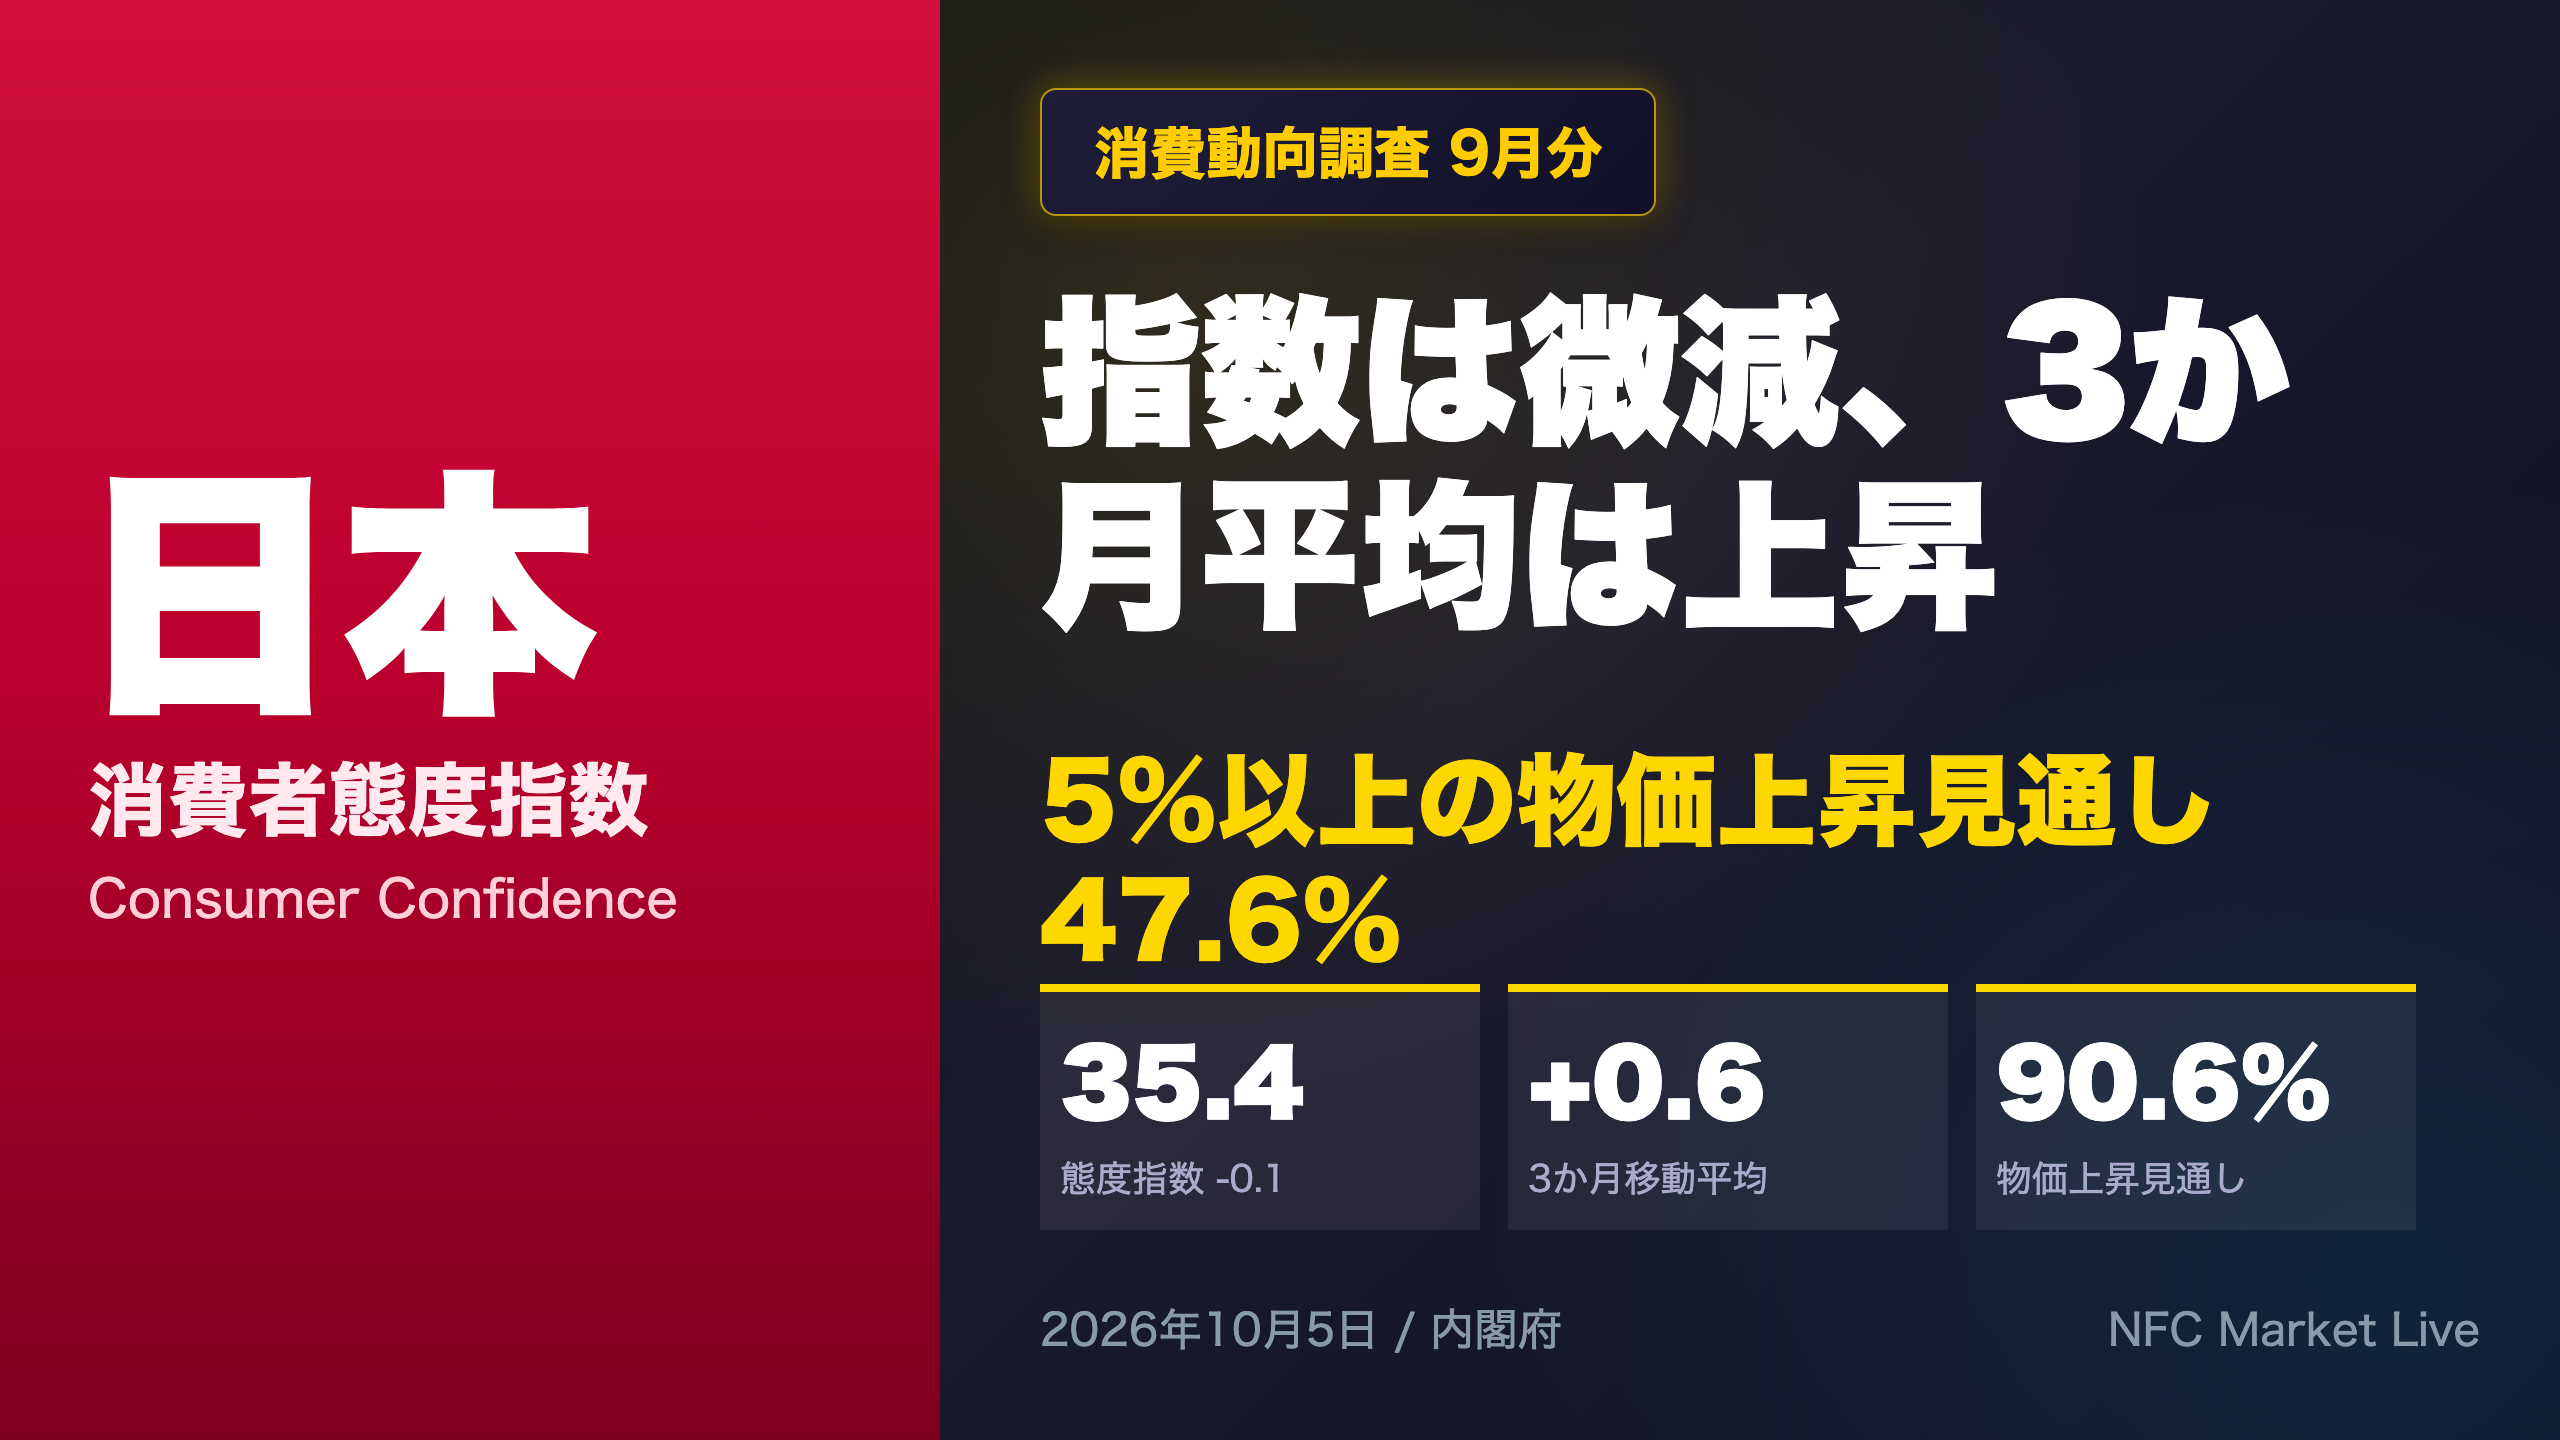
📊 Deep dive into Japan’s September Consumer Confidence Survey from the Cabinet Office.
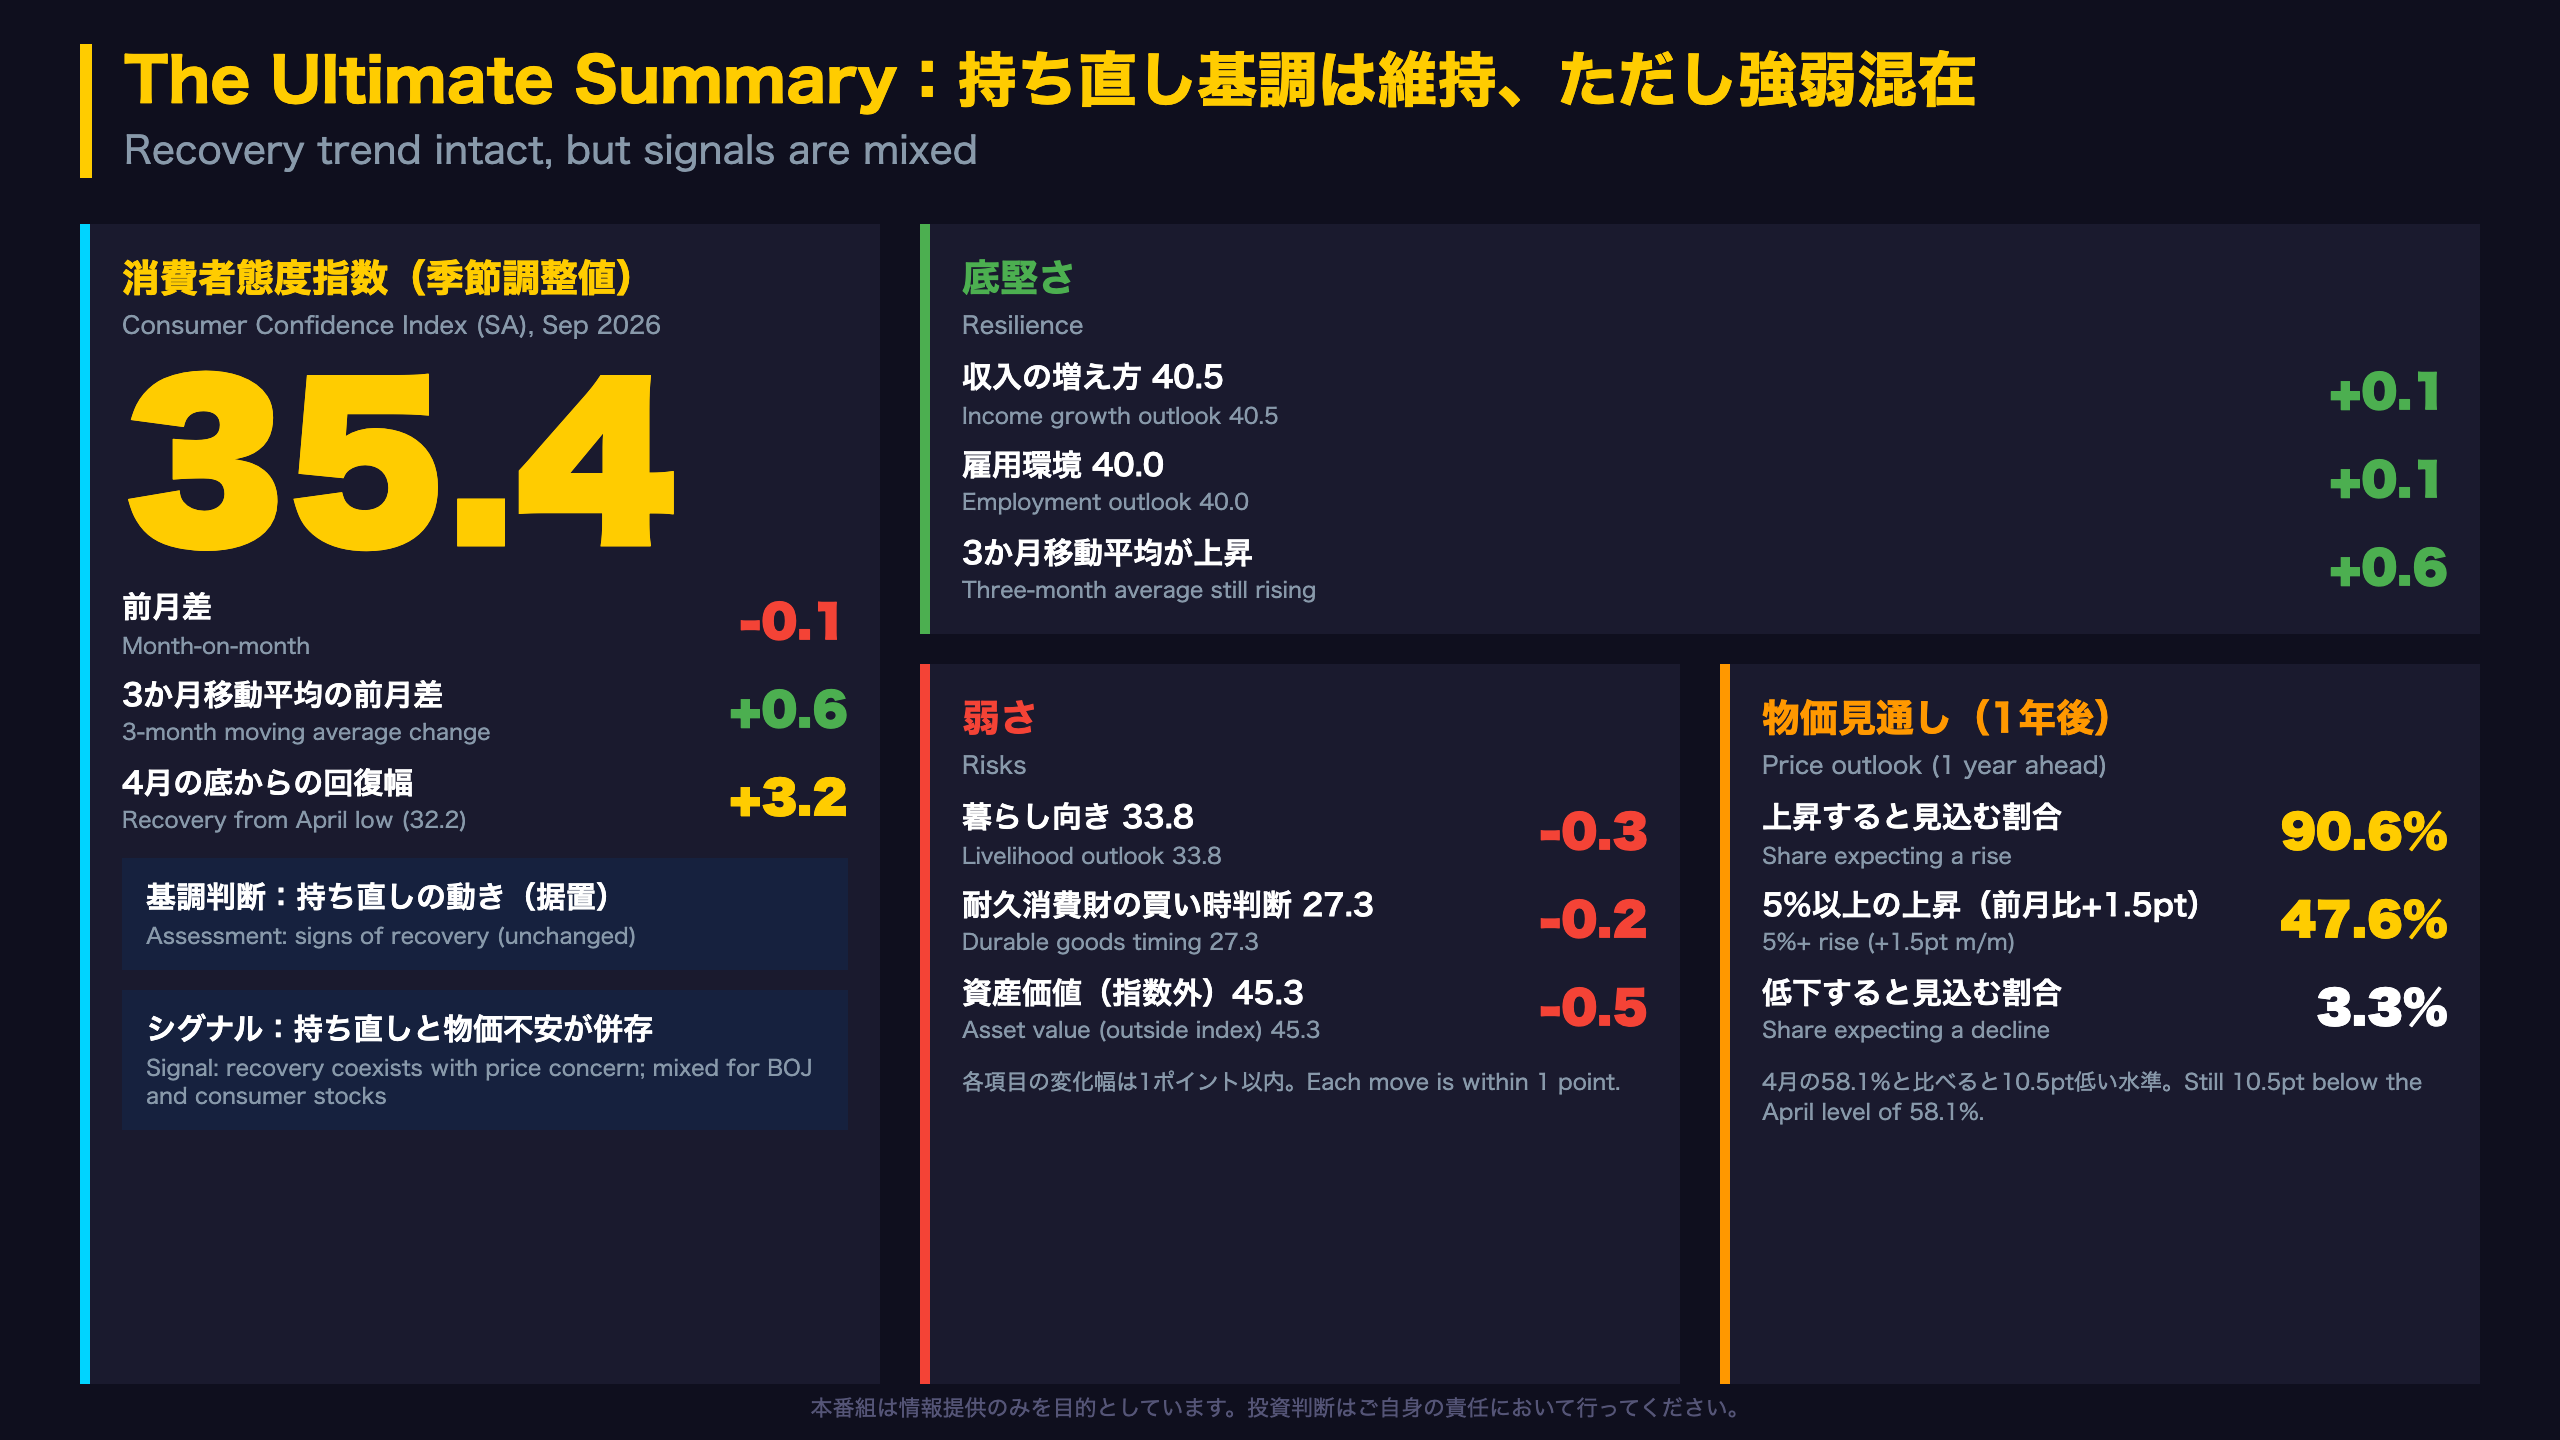
The index slipped 0.1 to 35.4, but the 3-month moving average rose 0.6 and the official view stayed at ‘showing signs of recovery’.
📈 Income (40.5) and employment (40.0) outlooks each edged up 0.1.
📉 Livelihood (33.8), durable goods timing (27.3) and asset value (45.3) fell.
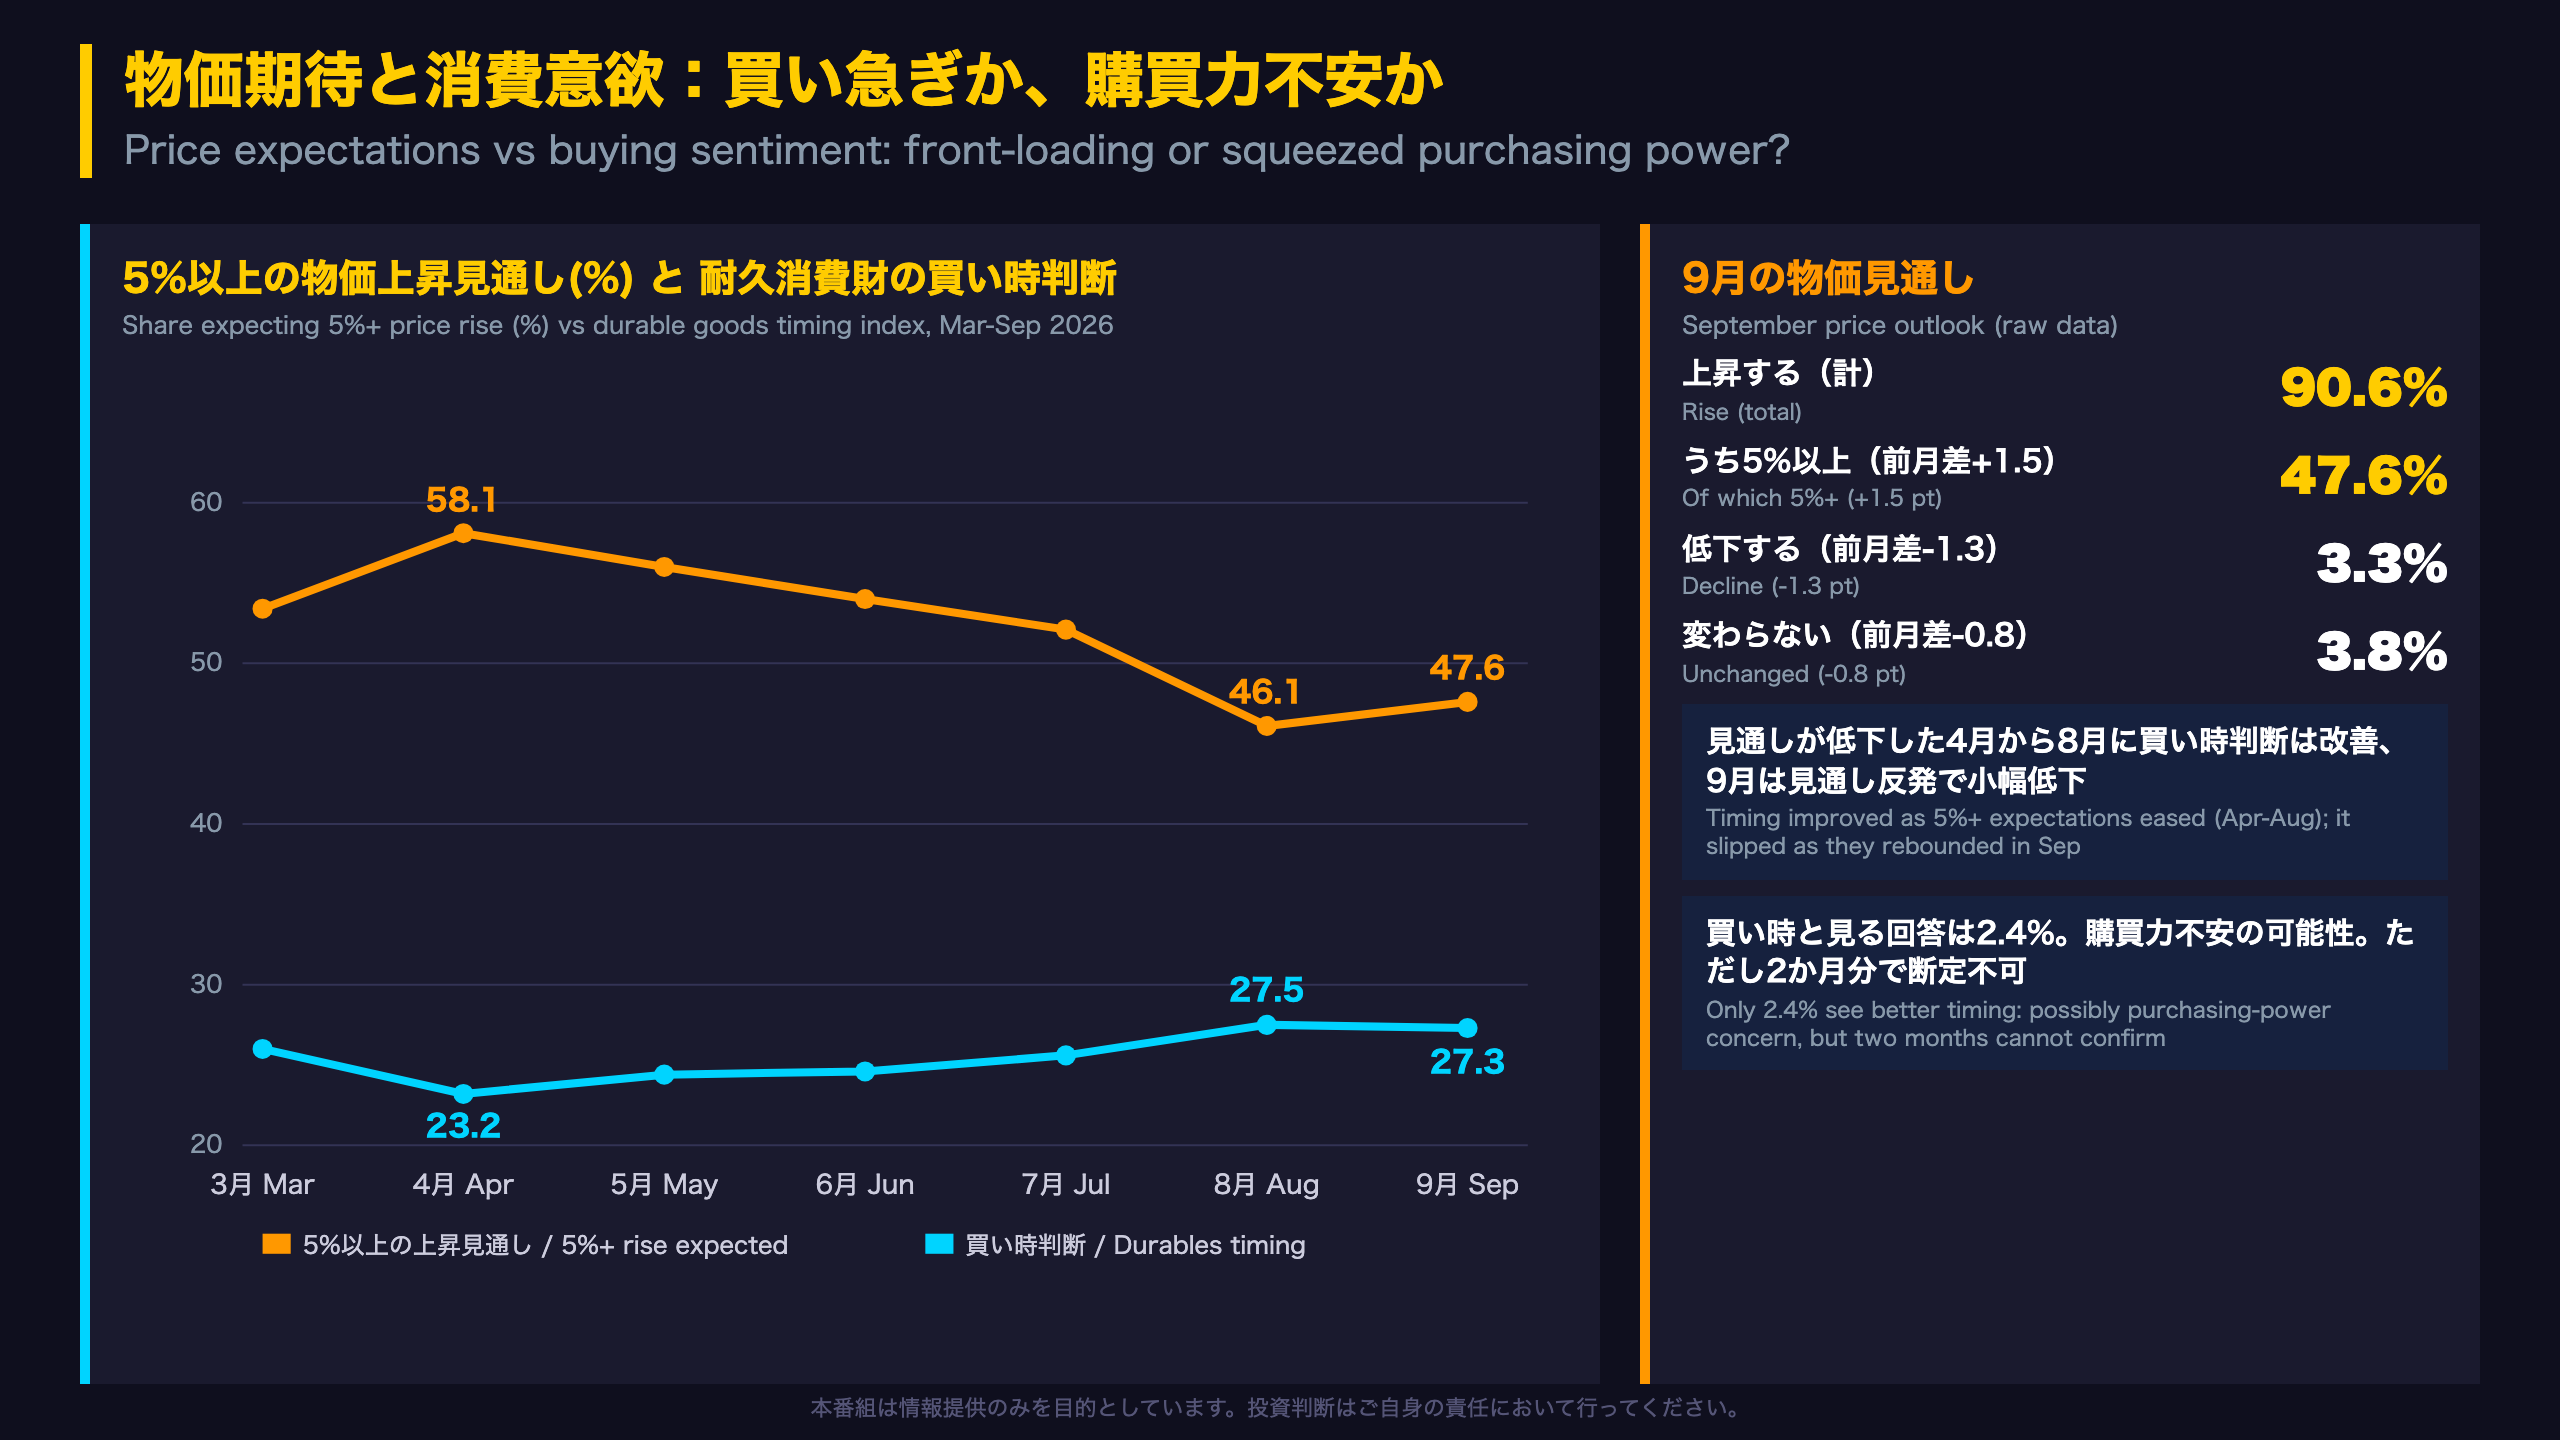
💡 Share expecting prices to rise 5%+ in a year: 47.6% (+1.5pt); any rise: 90.6%.
⚠️ A mixed picture: gradual recovery alongside elevated price expectations. Next up: the October survey.
The Ultimate Summary:持ち直し基調は維持、ただし強弱混在
What the survey measures
Japan’s Consumer Confidence Survey is compiled monthly by the Cabinet Office’s Economic and Social Research Institute. The September edition draws on 4,372 valid two-or-more-person household responses (81.3% response rate). Households rate the next six months on a five-step scale for livelihood, income growth, employment and the timing for buying durable goods. Answers are scored 1, 0.75, 0.5, 0.25 and 0, so an index of 50 means ‘no change expected’; readings in the 30s mean pessimistic answers outnumber optimistic ones. The headline index is a simple average of the four items.
September snapshot
- Index: 35.4 (-0.1 vs August’s 35.5)
- Three-month moving average: +0.6
- Official view: ‘showing signs of recovery’ (unchanged)
- Trough in April at 32.2, so the index is 3.2 points above its 2026 low but still below February’s 39.7
How it differs from US gauges
The University of Michigan and Conference Board surveys are widely followed in the US and mix current conditions with expectations. Japan’s index is entirely forward-looking (six months) and excludes asset values and price expectations, which are reported separately. Levels are therefore not directly comparable across countries.
Market read
The headline move of 0.1 point is negligible, and the report gives no margin of error. The more informative signals are mixed: the rising three-month average and steady income and jobs sentiment on one side, versus weaker livelihood, durables and asset-value readings and a higher share expecting 5%+ price increases on the other. For Bank of Japan watchers and consumer-sector investors this is one input among many, not a directional call. The October survey is next; the report does not state its release date.
4指標の分解:小幅低下を主導したのは暮らし向きと買い時判断
How the headline index is built
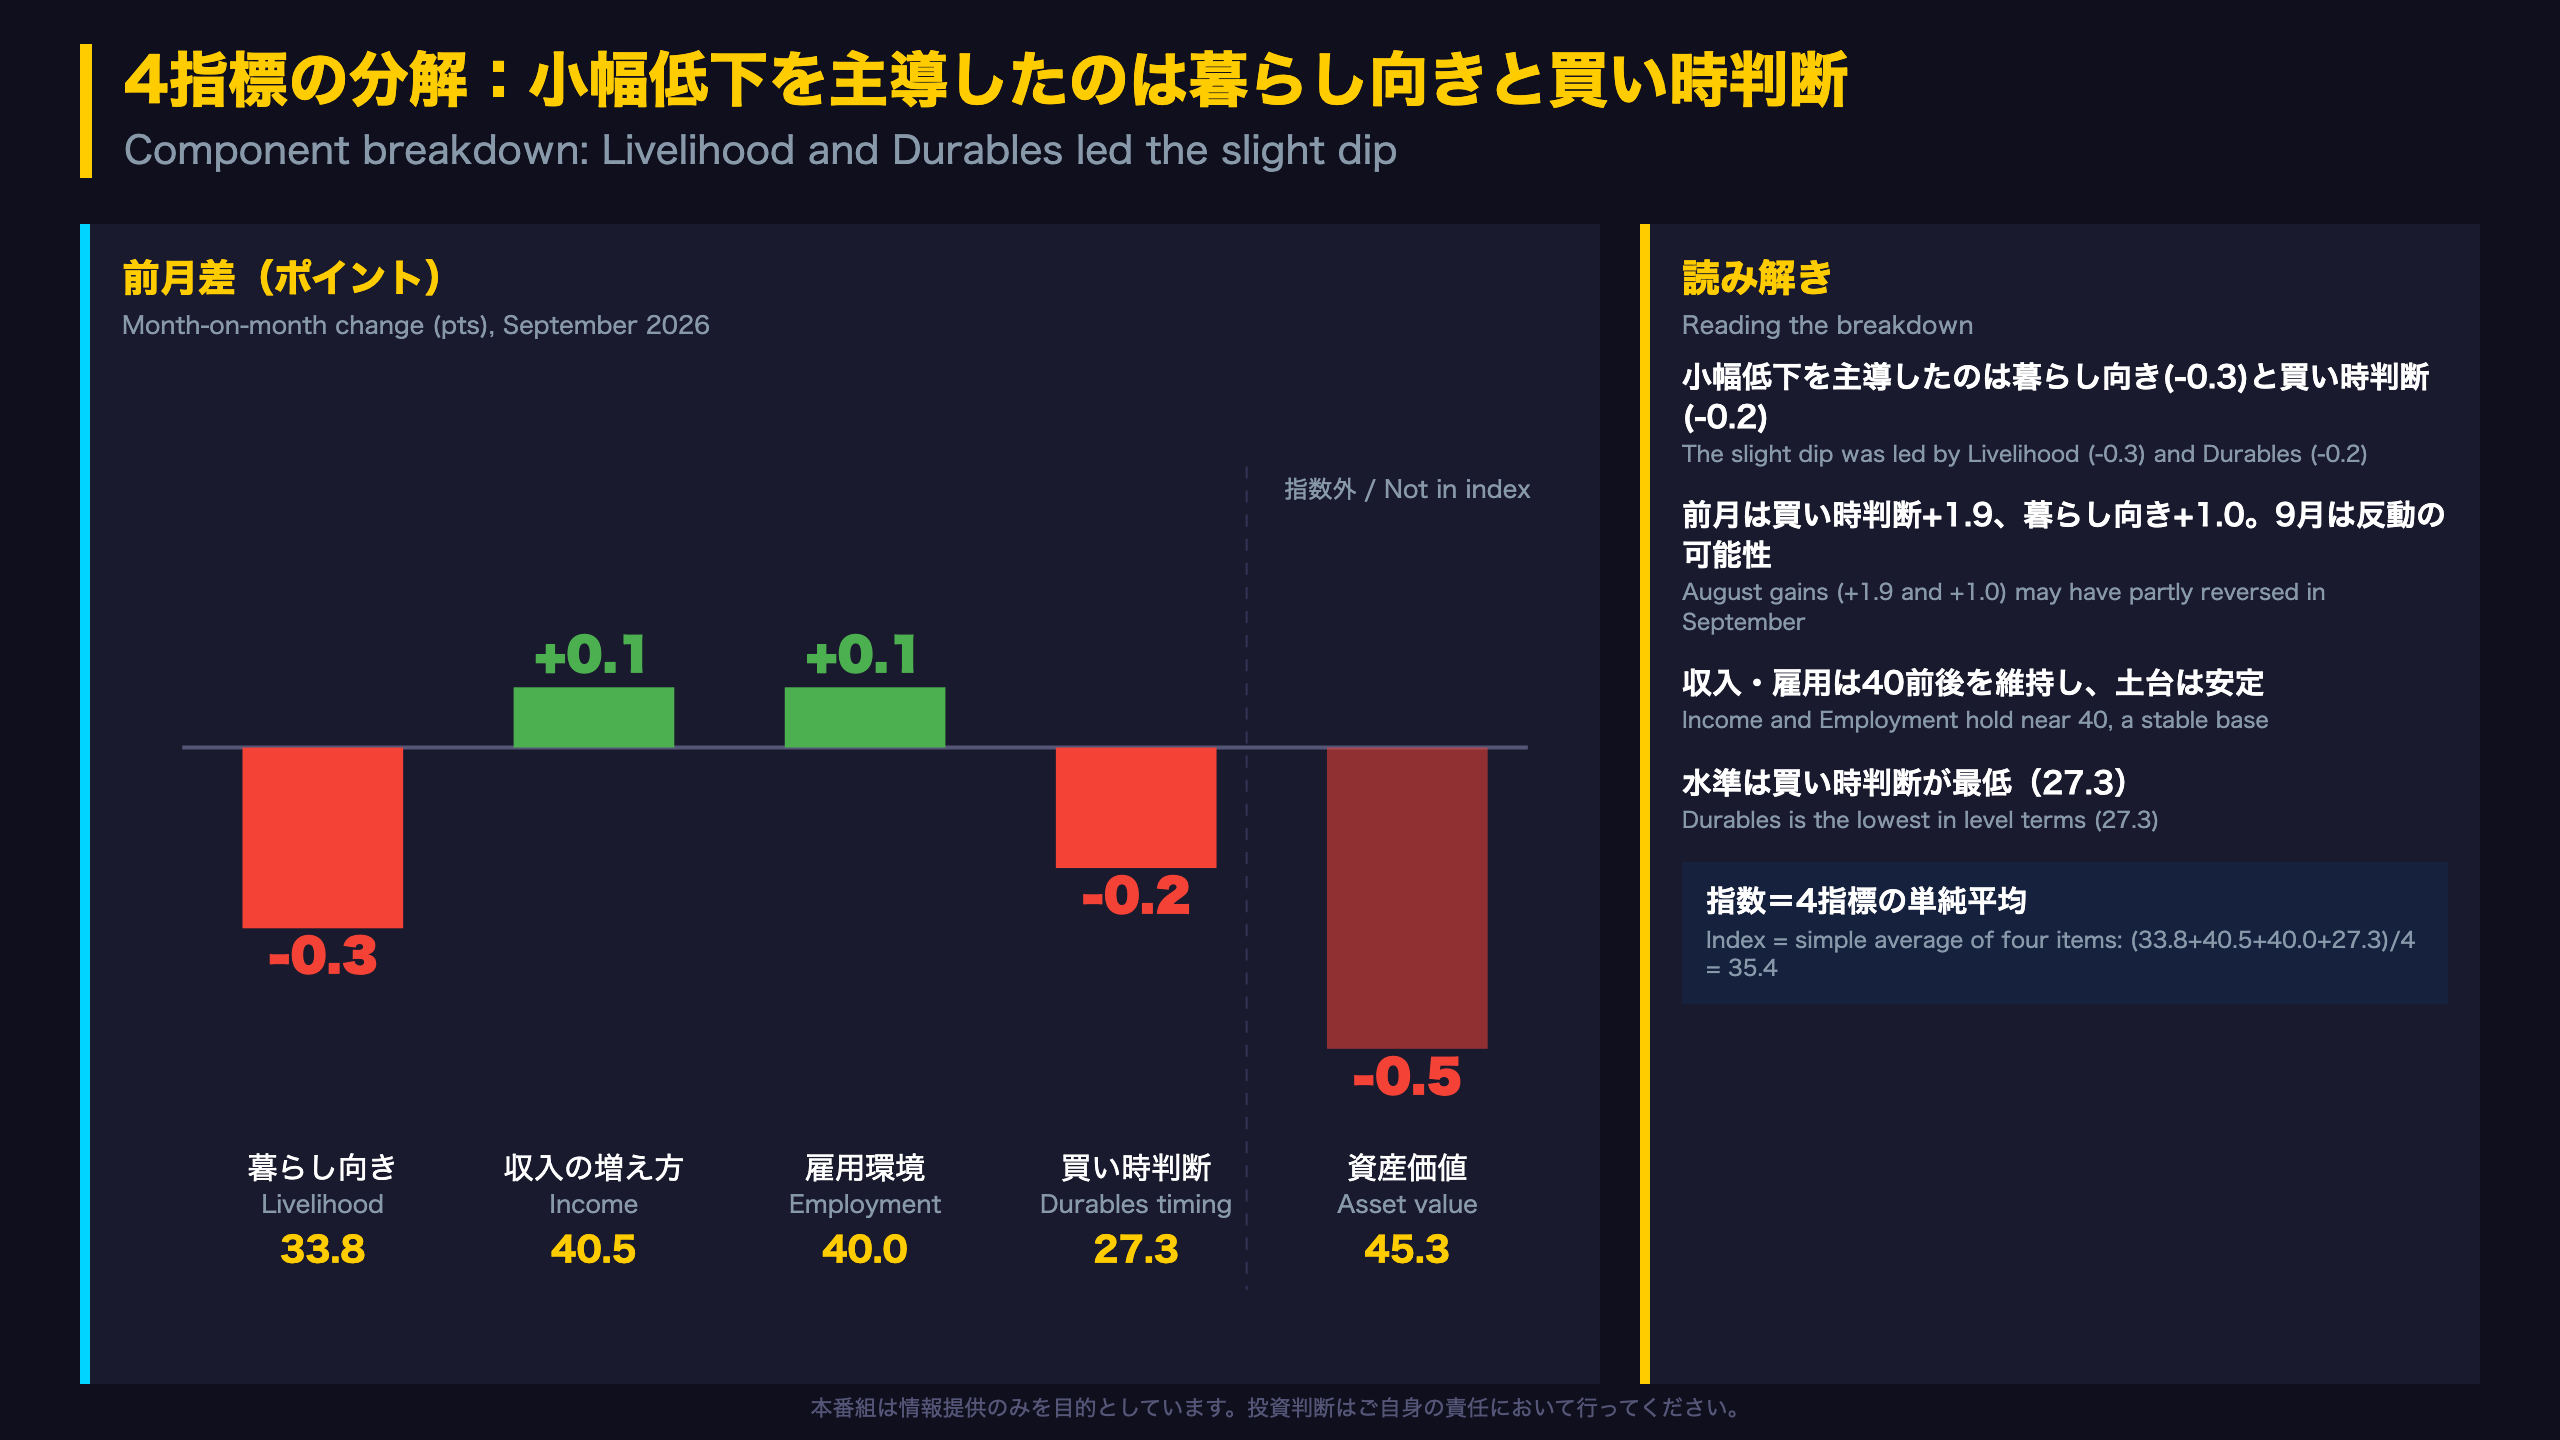
Japan’s Consumer Confidence Index is a simple average of four sub-indices: livelihood, income growth, employment and the timing for buying durable goods. September’s reading was (33.8 + 40.5 + 40.0 + 27.3) / 4 = 35.4. Because it is an equal-weighted average, each component’s monthly change feeds into the headline at one quarter of its size. The Cabinet Office also publishes an asset value gauge, but it is deliberately excluded from the headline.
Component scoreboard (seasonally adjusted)
- Livelihood 33.8 (-0.3): the biggest drag, after +1.0 in August
- Income growth 40.5 (+0.1)
- Employment 40.0 (+0.1): up from 37.4 in April
- Durables timing 27.3 (-0.2): lowest of the four, after a +1.9 jump in August
Why it matters
With 50 equal to ‘no change expected’, every component sits below neutral, durables most of all. In the US, the Michigan survey separates ‘buying conditions for durables’ as well, and it too tends to be the most volatile sub-item. Japan’s durables reading rebounded from 23.2 in April to 27.5 in August; September’s -0.2 is a small step back, not a reversal of that improvement.
Market angle
Consumer-facing sectors such as retail and services are sensitive to the livelihood and durables readings, while employment and income outlooks speak to the stability of the household base. The mixed pattern in September (stable jobs and pay, softer spending intentions) is consistent with a gradual rather than abrupt recovery, though one month of 0.1 to 0.3 point moves is too small to draw firm conclusions. The next survey covers October; the release date is not stated in the report.
回答分布の裏側:悲観の「濃度」と「広がり」
Beyond the average: the five-step distribution
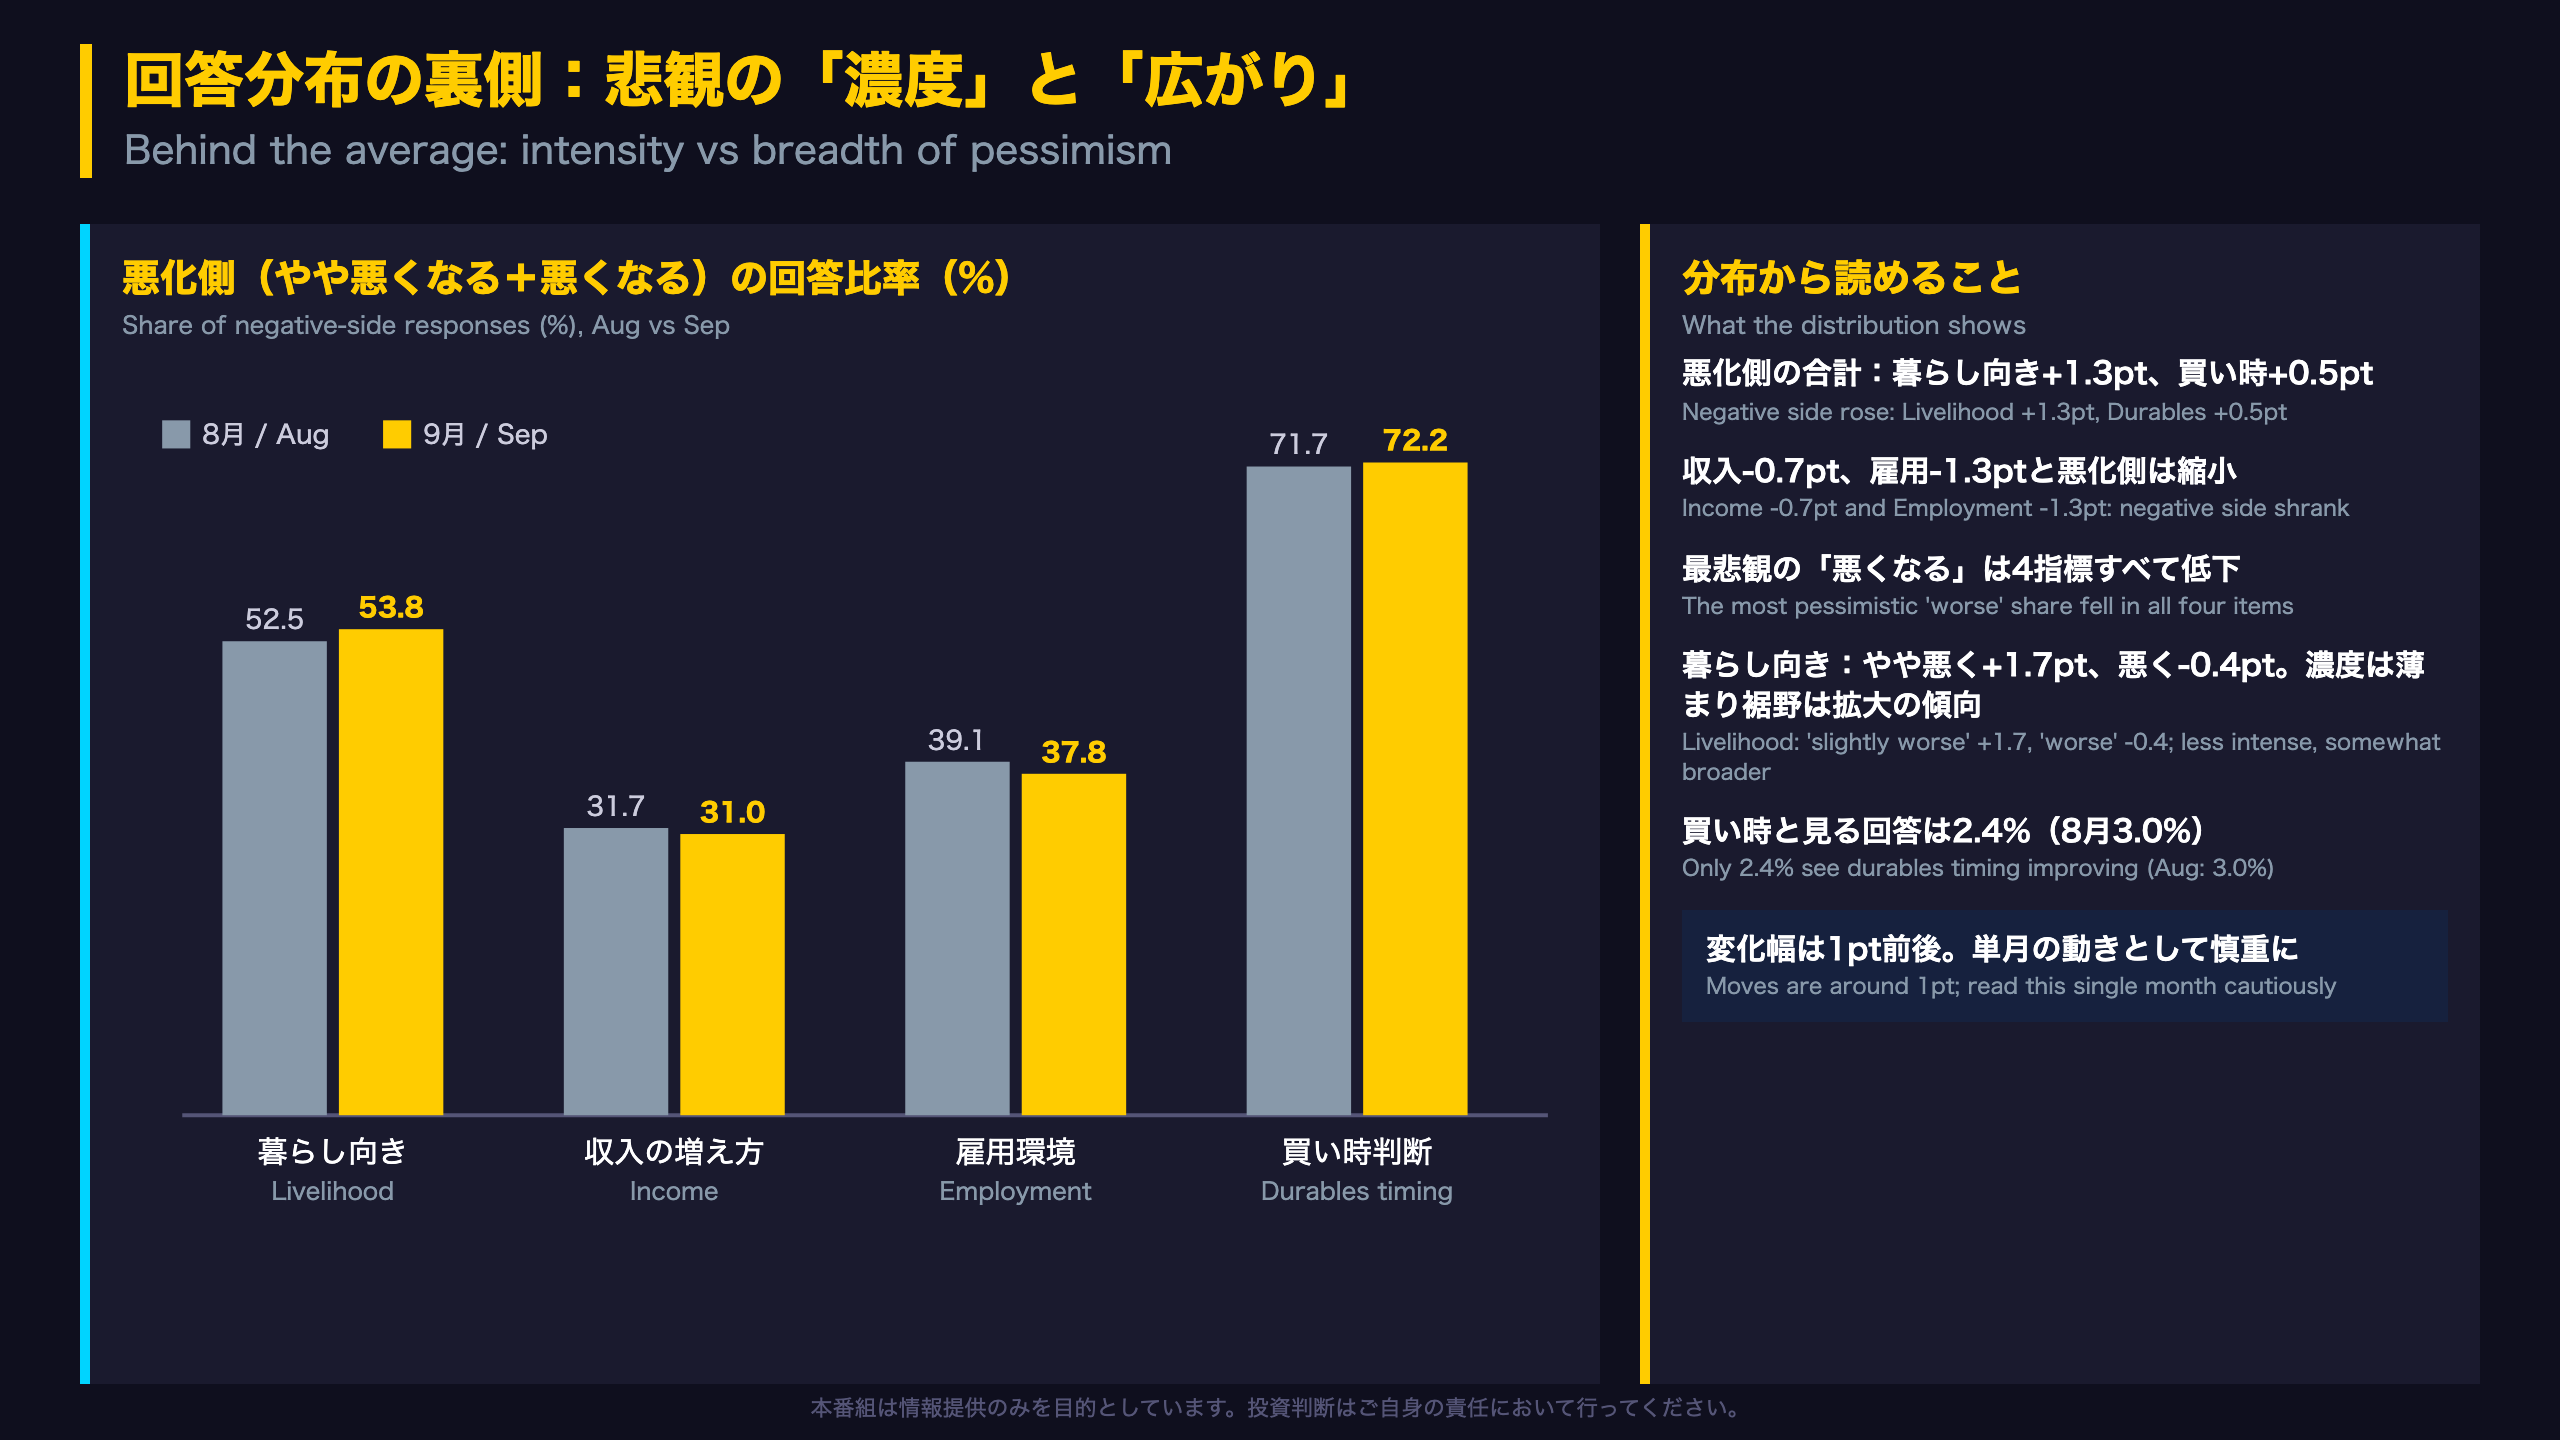
Each sub-index is built from five-step answers weighted 1, 0.75, 0.5, 0.25 and 0. Two identical index values can therefore hide different distributions. Below, the raw response shares are grouped into improving, unchanged and worsening camps (the grouping is our own aggregation of the report’s table).
| Item | Worsening side Aug to Sep | Unchanged Aug to Sep |
|---|---|---|
| Livelihood | 52.5% to 53.8% | 43.2% to 42.2% |
| Income | 31.7% to 31.0% | 62.8% to 63.0% |
| Employment | 39.1% to 37.8% | 54.8% to 55.7% |
| Durables timing | 71.7% to 72.2% | 25.3% to 25.4% |
Key observations
- The most pessimistic answer (‘worse’) fell in all four items: livelihood 16.1% to 15.7%, income 12.3% to 11.7%, employment 9.9% to 9.8%, durables 21.6% to 20.8%.
- Livelihood shows a shift in intensity: ‘slightly worse’ rose 1.7 points while ‘worse’ dipped 0.4 point, which suggests less severe but somewhat broader caution.
- Durables remain thin on optimism: only 2.4% expect timing to improve, leaving little evidence of front-loaded purchases.
Context for non-Japan readers
The Cabinet Office reports these shares from roughly 4,372 two-plus-person households each month, but does not publish a margin of error in this release. Moves of one point or less are therefore best treated as noise-level unless they persist. In comparison, US surveys such as the Michigan index typically report net balances; Japan’s distribution table lets investors see how much of the pessimism is mild versus severe.
Market angle
For consumer-sector investors, the distribution suggests no sharp deterioration in September, but also no broad improvement in spending intentions. This is one month of data; persistence over the next surveys matters more than this single shift.
物価期待と消費意欲:買い急ぎか、購買力不安か
Anatomy of Japan’s price expectations
The Cabinet Office asks households how much the prices of goods they regularly buy will change over the next year. The September results (raw, not seasonally adjusted):
- Rise (total): 90.6% (+1.6 pt)
- Rise of 5% or more: 47.6% (+1.5 pt), still the single most common answer
- Rise of 2% to under 5%: 31.7%; under 2%: 11.3%
- Unchanged: 3.8% (-0.8); decline: 3.3% (-1.3); don’t know: 2.3%
Time-series context
The 5%+ share peaked at 58.1% in April, slid to 46.1% in August (-6.0 pt) and bounced to 47.6% in September, so it remains 10.5 points below the April high. February was an outlier month, with the ‘rise’ total at 85.6%.
Rush to buy or squeezed purchasing power?
Economists often ask whether higher expected inflation pulls purchases forward or erodes real purchasing power. The durables timing gauge (seasonally adjusted) went 23.2 in April, 27.5 in August and 27.3 in September, i.e. it improved while 5%+ expectations eased and edged down when they rebounded. That pattern is consistent with purchasing-power concern rather than front-loading, and only 2.4% of households see durables timing improving. But two months is thin evidence, so treat this as a hypothesis, not a conclusion.
International comparison and market angle
The closest US analogue is the University of Michigan’s 1-year inflation expectation, which reports a median figure; Japan’s survey reports a full distribution, showing nearly 9 in 10 households expect rising prices. For the Bank of Japan, household expectations are one of several inputs alongside wages and market-based measures. For consumer-sector investors, elevated expectations alongside soft buying sentiment suggest a cautious spending backdrop. The October survey is next; its release date is not stated in the report.
資産価値の乖離:態度指数は持ち直し、資産価値は2か月連続低下
Where asset value fits
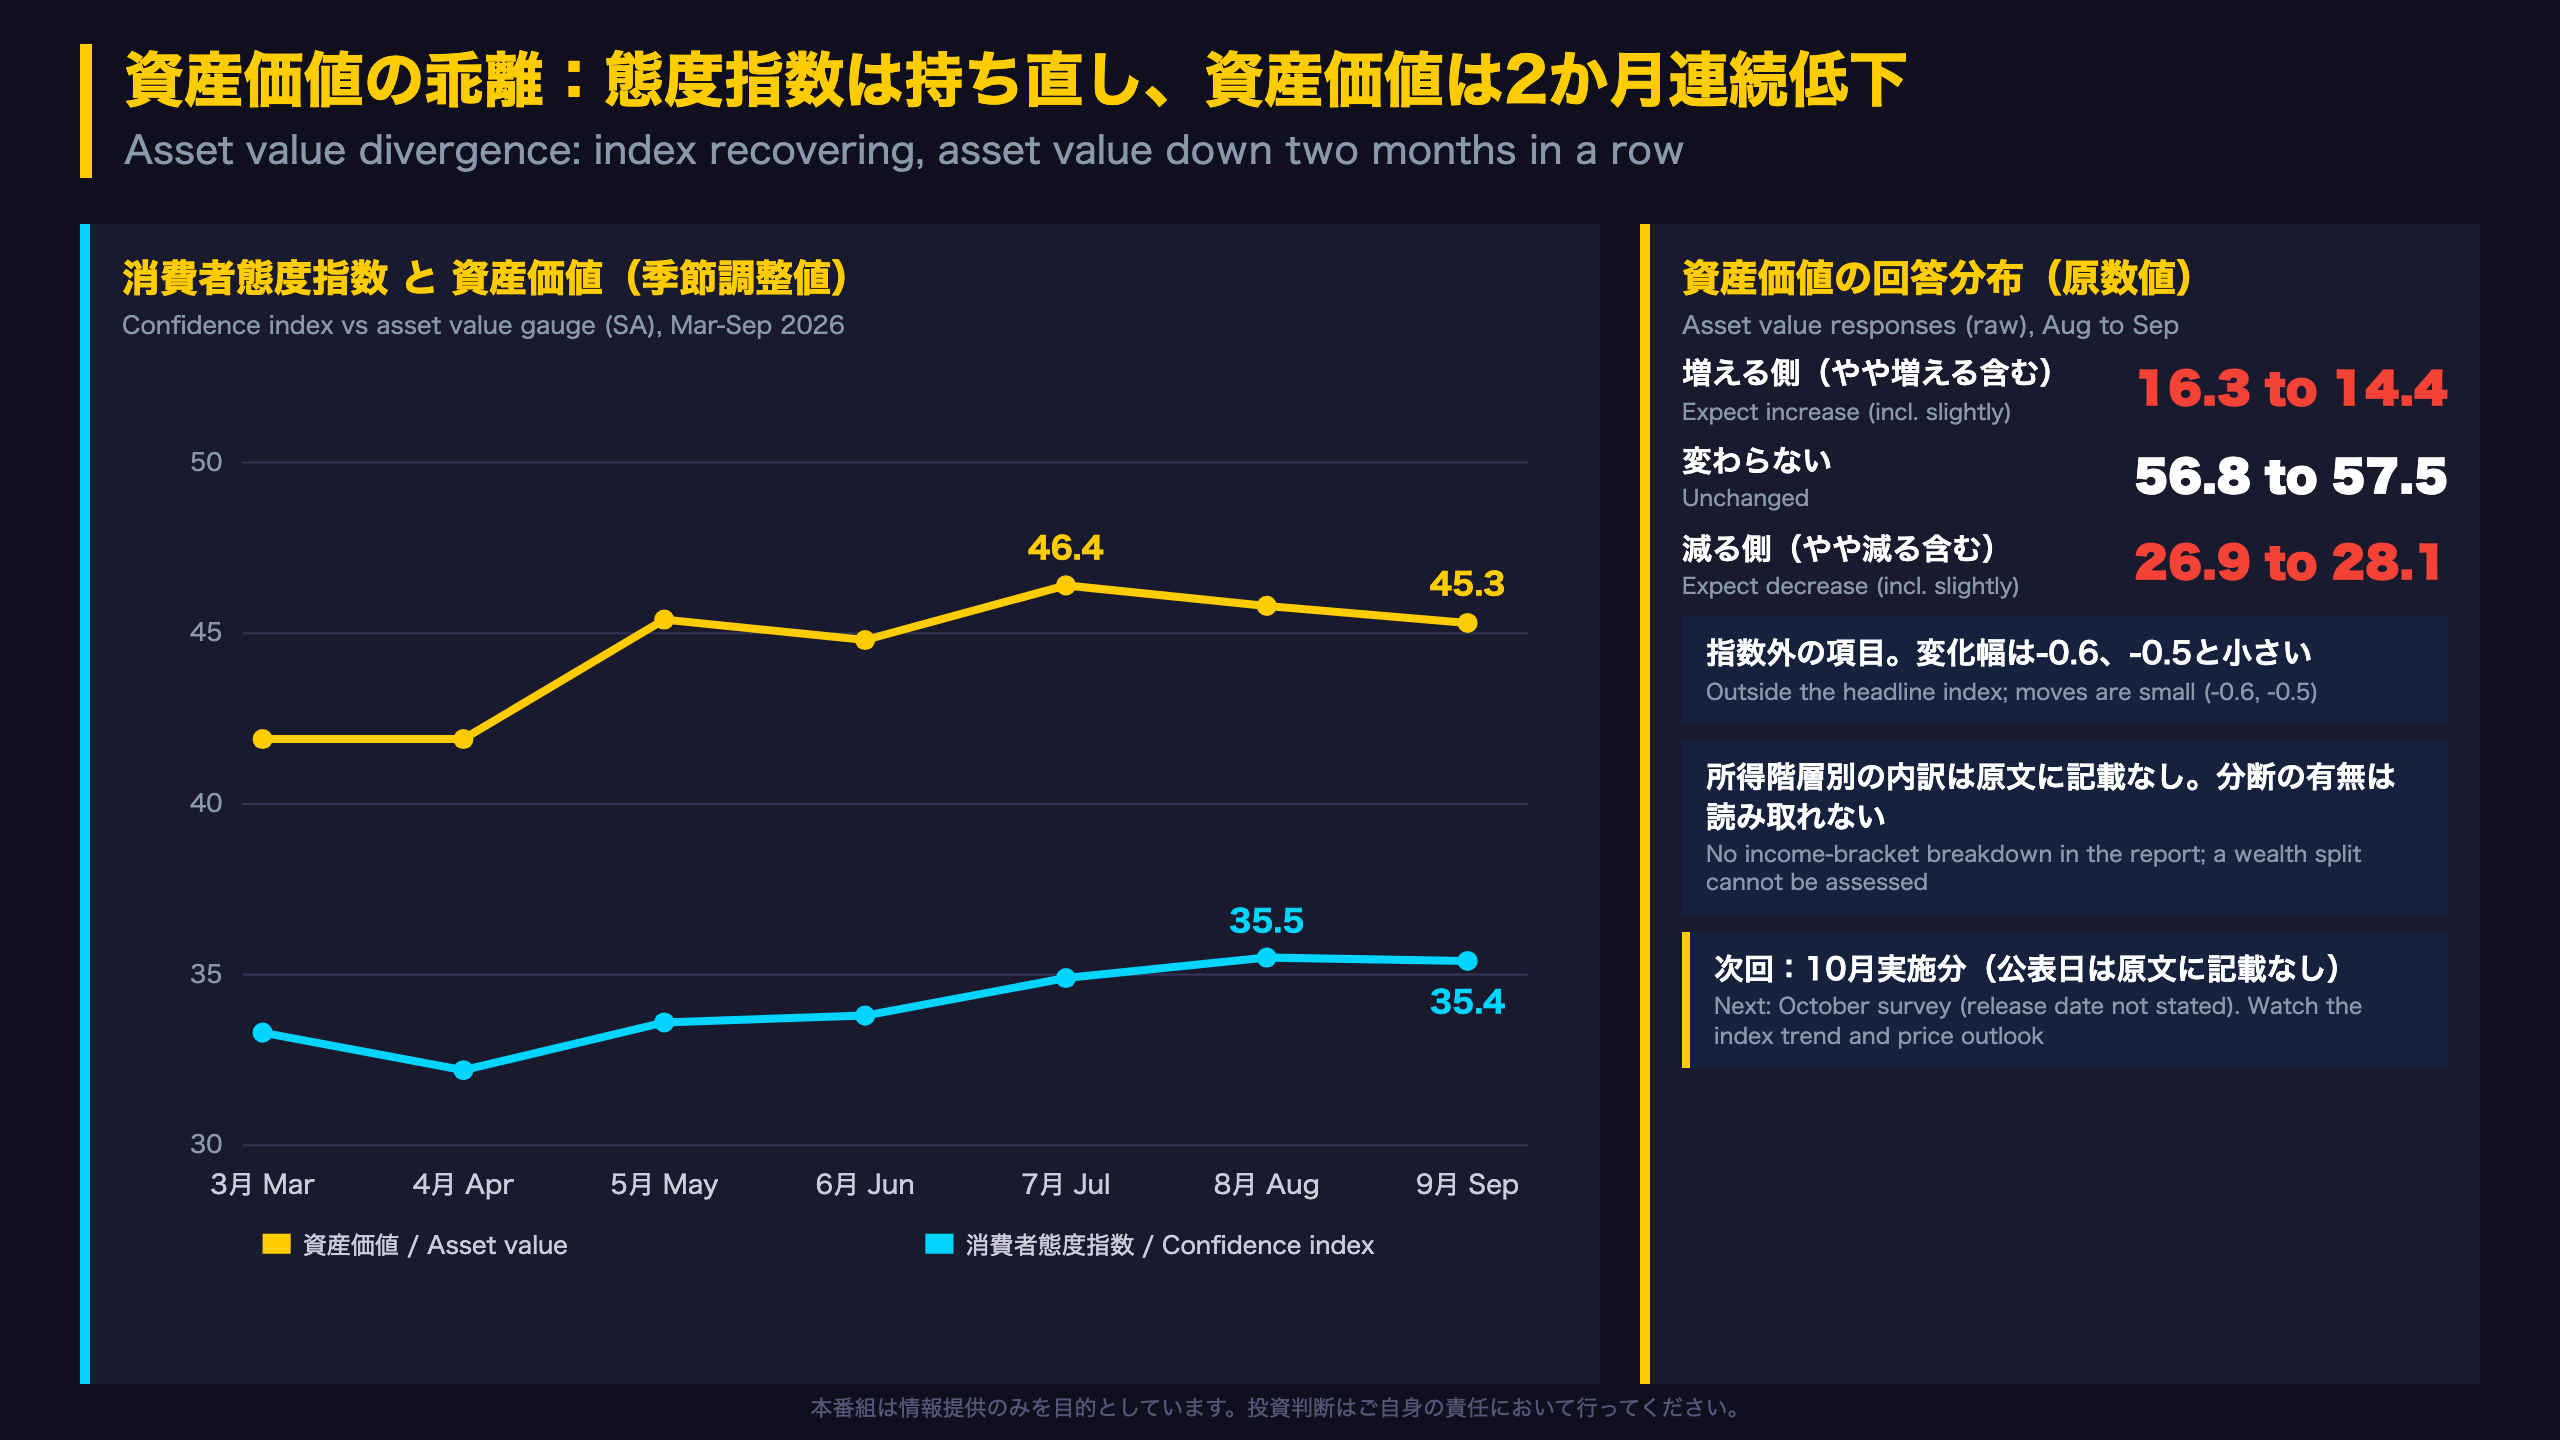
The ‘asset value’ question asks households whether the value of assets they own, such as stocks and land, will rise or fall over the next six months. It is not part of the headline Consumer Confidence Index, and the Cabinet Office seasonally adjusts it with the X-11 default rather than the X-12-ARIMA models used for the four main items.
The numbers
| Month (2026) | Mar | Apr | May | Jun | Jul | Aug | Sep |
|---|---|---|---|---|---|---|---|
| Confidence index | 33.3 | 32.2 | 33.6 | 33.8 | 34.9 | 35.5 | 35.4 |
| Asset value | 41.9 | 41.9 | 45.4 | 44.8 | 46.4 | 45.8 | 45.3 |
Asset value has declined two months in a row (-0.6, then -0.5), even as the index’s three-month average keeps rising. It remains 3.4 points above the March and April level of 41.9, and 3.2 points below February’s 48.5. In the raw data, the share expecting assets to rise (including slightly) fell from 16.3% to 14.4%, while the share expecting a decline rose from 26.9% to 28.1% (our own aggregation).
Is there a wealth divide?
One may be tempted to read a split between asset-owning households and the middle class. The report offers no breakdown by income or asset holdings, so that cannot be tested here. The moves are also only 0.5 to 0.6 point.
International comparison and market angle
The US Michigan survey does not publish a stand-alone asset-value sentiment index, so Japan’s series is a useful extra lens on potential wealth effects. For investors, a softer asset-value reading alongside a recovering confidence index is a mixed signal for consumer-related equities and for how the Bank of Japan weighs household conditions; it is one data point, not a forecast. The October survey is next; its release date is not stated in the report.
Disclaimer: This article is for informational purposes only. All investment decisions are made solely at your own risk.







