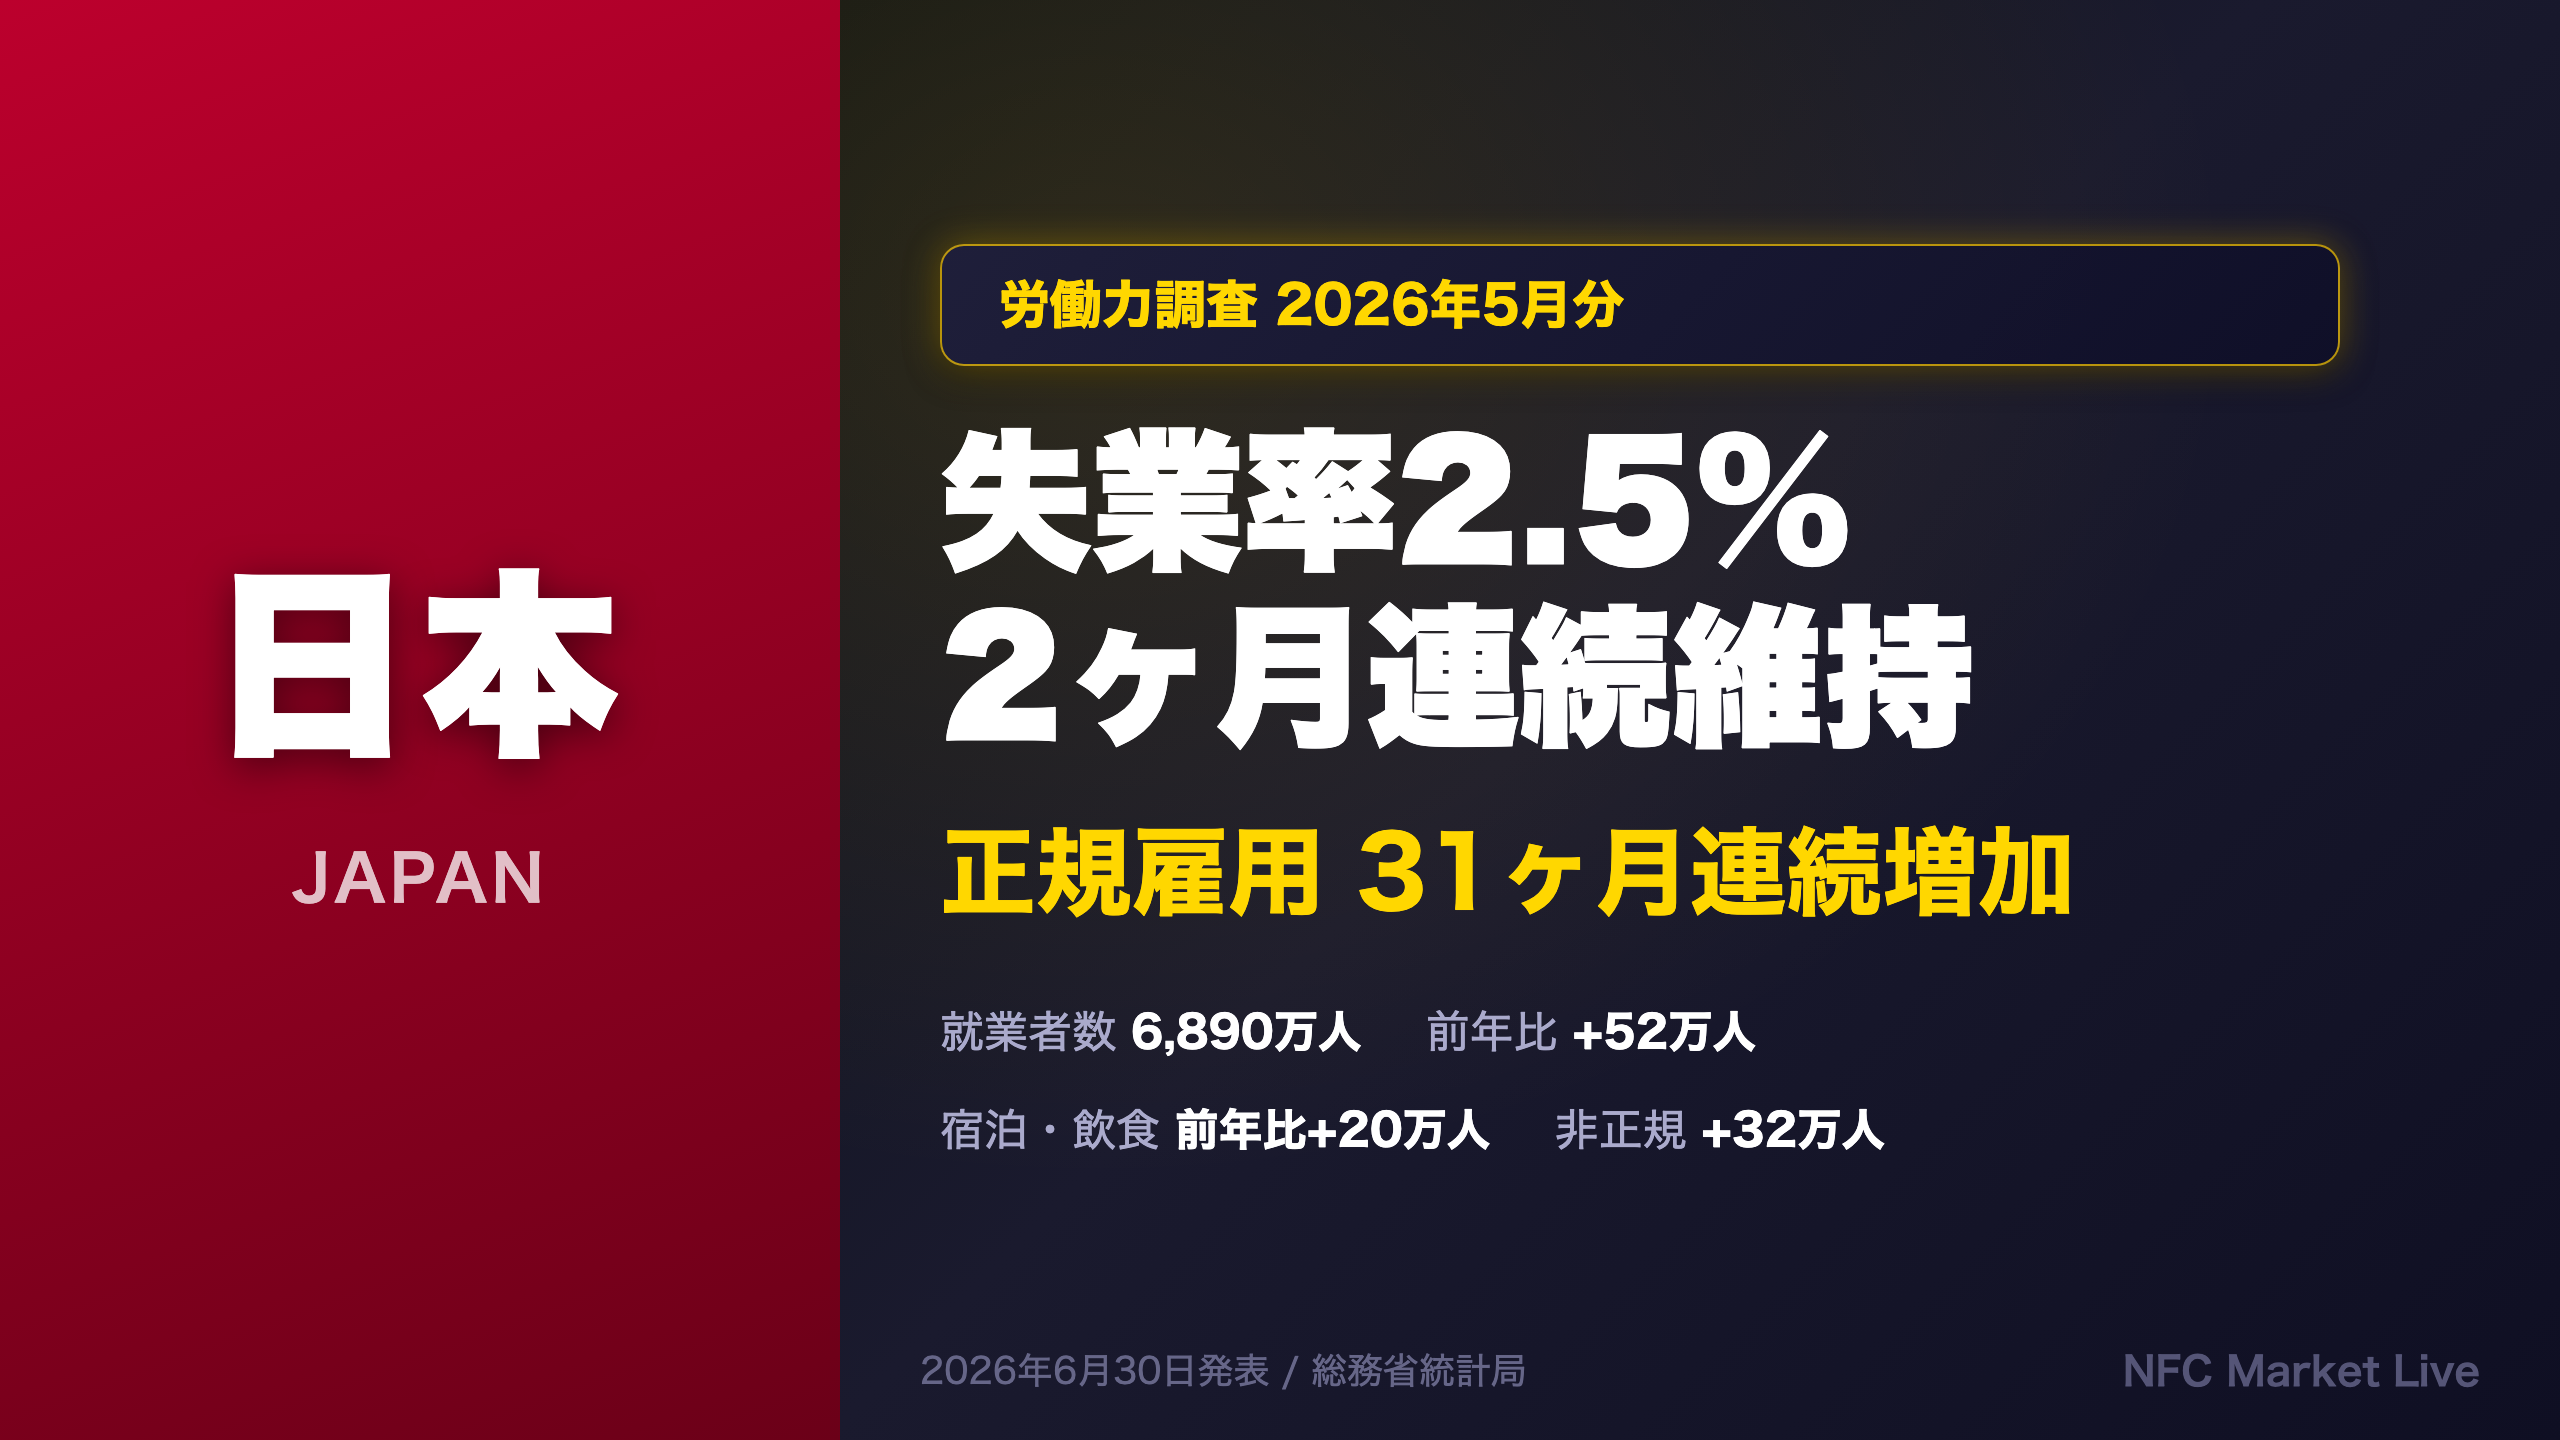
📺 Watch the Full Video Analysis
This article was automatically generated by the NFC Market Live AI analysis system. (Updated: 2026-06-30 08:44 JST)
📄 Primary Source
総務省統計局
https://www.stat.go.jp/data/roudou/sokuhou/tsuki/pdf/gaiyou.pdf
Deep dive into Japan’s May 2026 Labour Force Survey. Unemployment held at 2.5% (seasonally adjusted), with 68.9 million employed (+520K YoY). Regular employment rose for the 31st consecutive month. We analyze labor market tightness in hospitality/food services, implications for services inflation, and what this means for the BOJ’s rate hike path.
The Ultimate Summary:労働市場タイトネスとインフレ・日銀利上げへの示唆
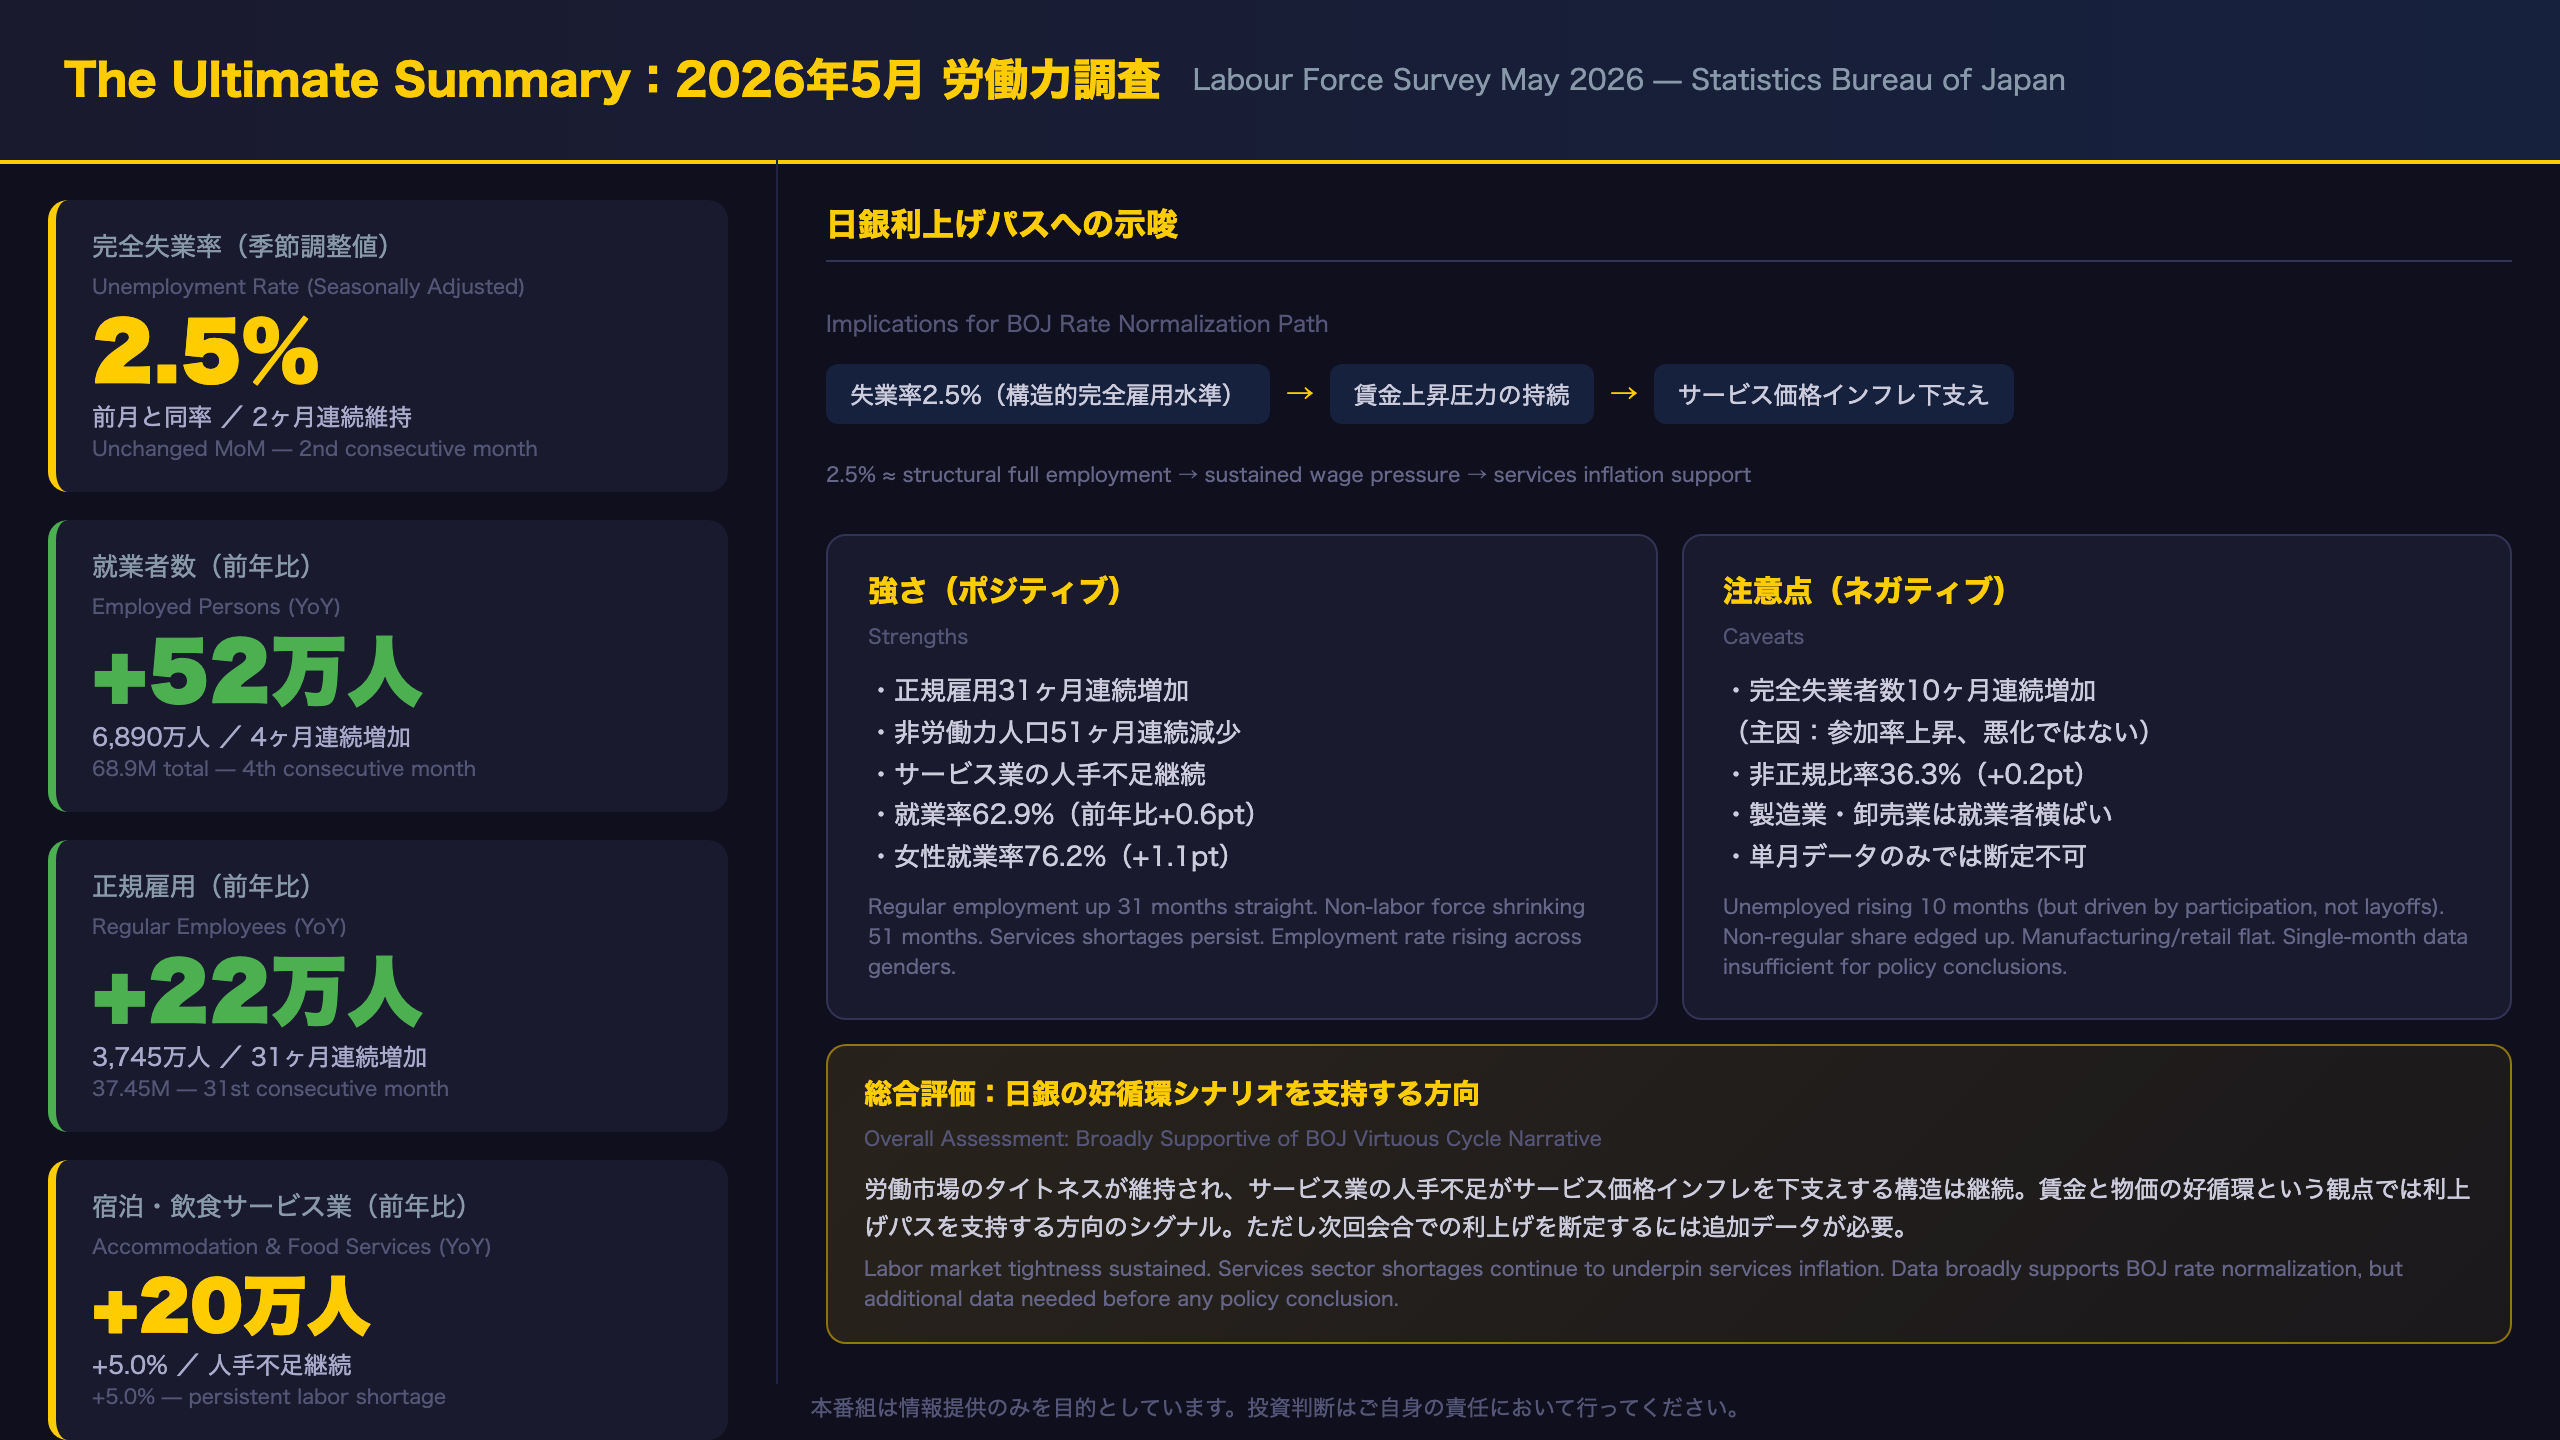
Japan Labour Force Survey May 2026: Structural Tightness Beneath the Headlines
What the Statistics Bureau Measures
The Labour Force Survey (Roudouryoku Chosa) is Japan’s primary monthly employment report, published by the Statistics Bureau of the Ministry of Internal Affairs and Communications. It is the Japanese equivalent of the U.S. Bureau of Labor Statistics’ Current Population Survey, covering approximately 40,000 households nationwide. The seasonally adjusted unemployment rate is the headline figure most closely watched by markets and the Bank of Japan (BOJ).
Unemployment Rate: Holding at a Near-Historic Low
The seasonally adjusted unemployment rate held at 2.5% in May 2026, unchanged from April. To put this in international context: the U.S. unemployment rate has been running around 4.0–4.5% in 2025–2026, and the Eurozone around 6%. Japan’s 2.5% is near the lower bound of what economists consider its structural full employment rate, estimated at roughly 2.5–3.0%. The monthly trajectory in 2026 — 2.7% (Jan) → 2.6% (Feb) → 2.7% (Mar) → 2.5% (Apr) → 2.5% (May) — suggests the labor market has stabilized at a very tight level.
The “Unemployed Rising” Paradox Explained
The number of unemployed rose by 20,000 year-on-year to 1.85 million, the tenth consecutive month of increase. This sounds alarming but is actually a positive signal. The breakdown shows that “new job seekers” (people entering the labor market for the first time or re-entering) accounted for the largest increase (+60,000 YoY), while “involuntary separations” (layoffs) were flat year-on-year. Simultaneously, the non-labor force population fell by 700,000 YoY — the 51st consecutive monthly decline. This is a textbook labor market activation dynamic: as job prospects improve, discouraged workers re-enter the labor force, temporarily pushing up the unemployed count before they find jobs.
Regular Employment: 31 Consecutive Months of Growth
Regular (full-time, permanent) employees reached 37.45 million, up 220,000 YoY for the 31st straight month. This is significant because regular employment in Japan carries substantially higher wages, benefits, and job security than non-regular employment. The sustained expansion of regular employment is a key input for the BOJ’s assessment of whether wage growth is becoming structural rather than cyclical.
Services Sector Labor Shortages: The Inflation Link
Accommodation and food services added 200,000 workers YoY (+5.0%), the largest sectoral gain. Healthcare and welfare added 180,000 (+1.9%). These sectors are characterized by high labor intensity and limited scope for automation, meaning labor shortages translate directly into wage cost pressures and, ultimately, services price inflation. Japan’s services CPI has been running above 2% — the BOJ’s target — and tight labor markets in these sectors are a structural driver of that persistence.
Market Implications for English-Speaking Investors
For JPY and JGB markets: sustained labor market tightness at 2.5% unemployment, combined with persistent services sector labor shortages, supports the BOJ’s gradual rate normalization narrative. The data does not trigger an immediate rate hike signal on its own, but it removes a potential dovish argument. Watch for the June data (due July 31) and the BOJ’s July Outlook Report for the next major catalyst.
就業者・雇用形態の深掘り:正規31ヶ月連続増加の意味
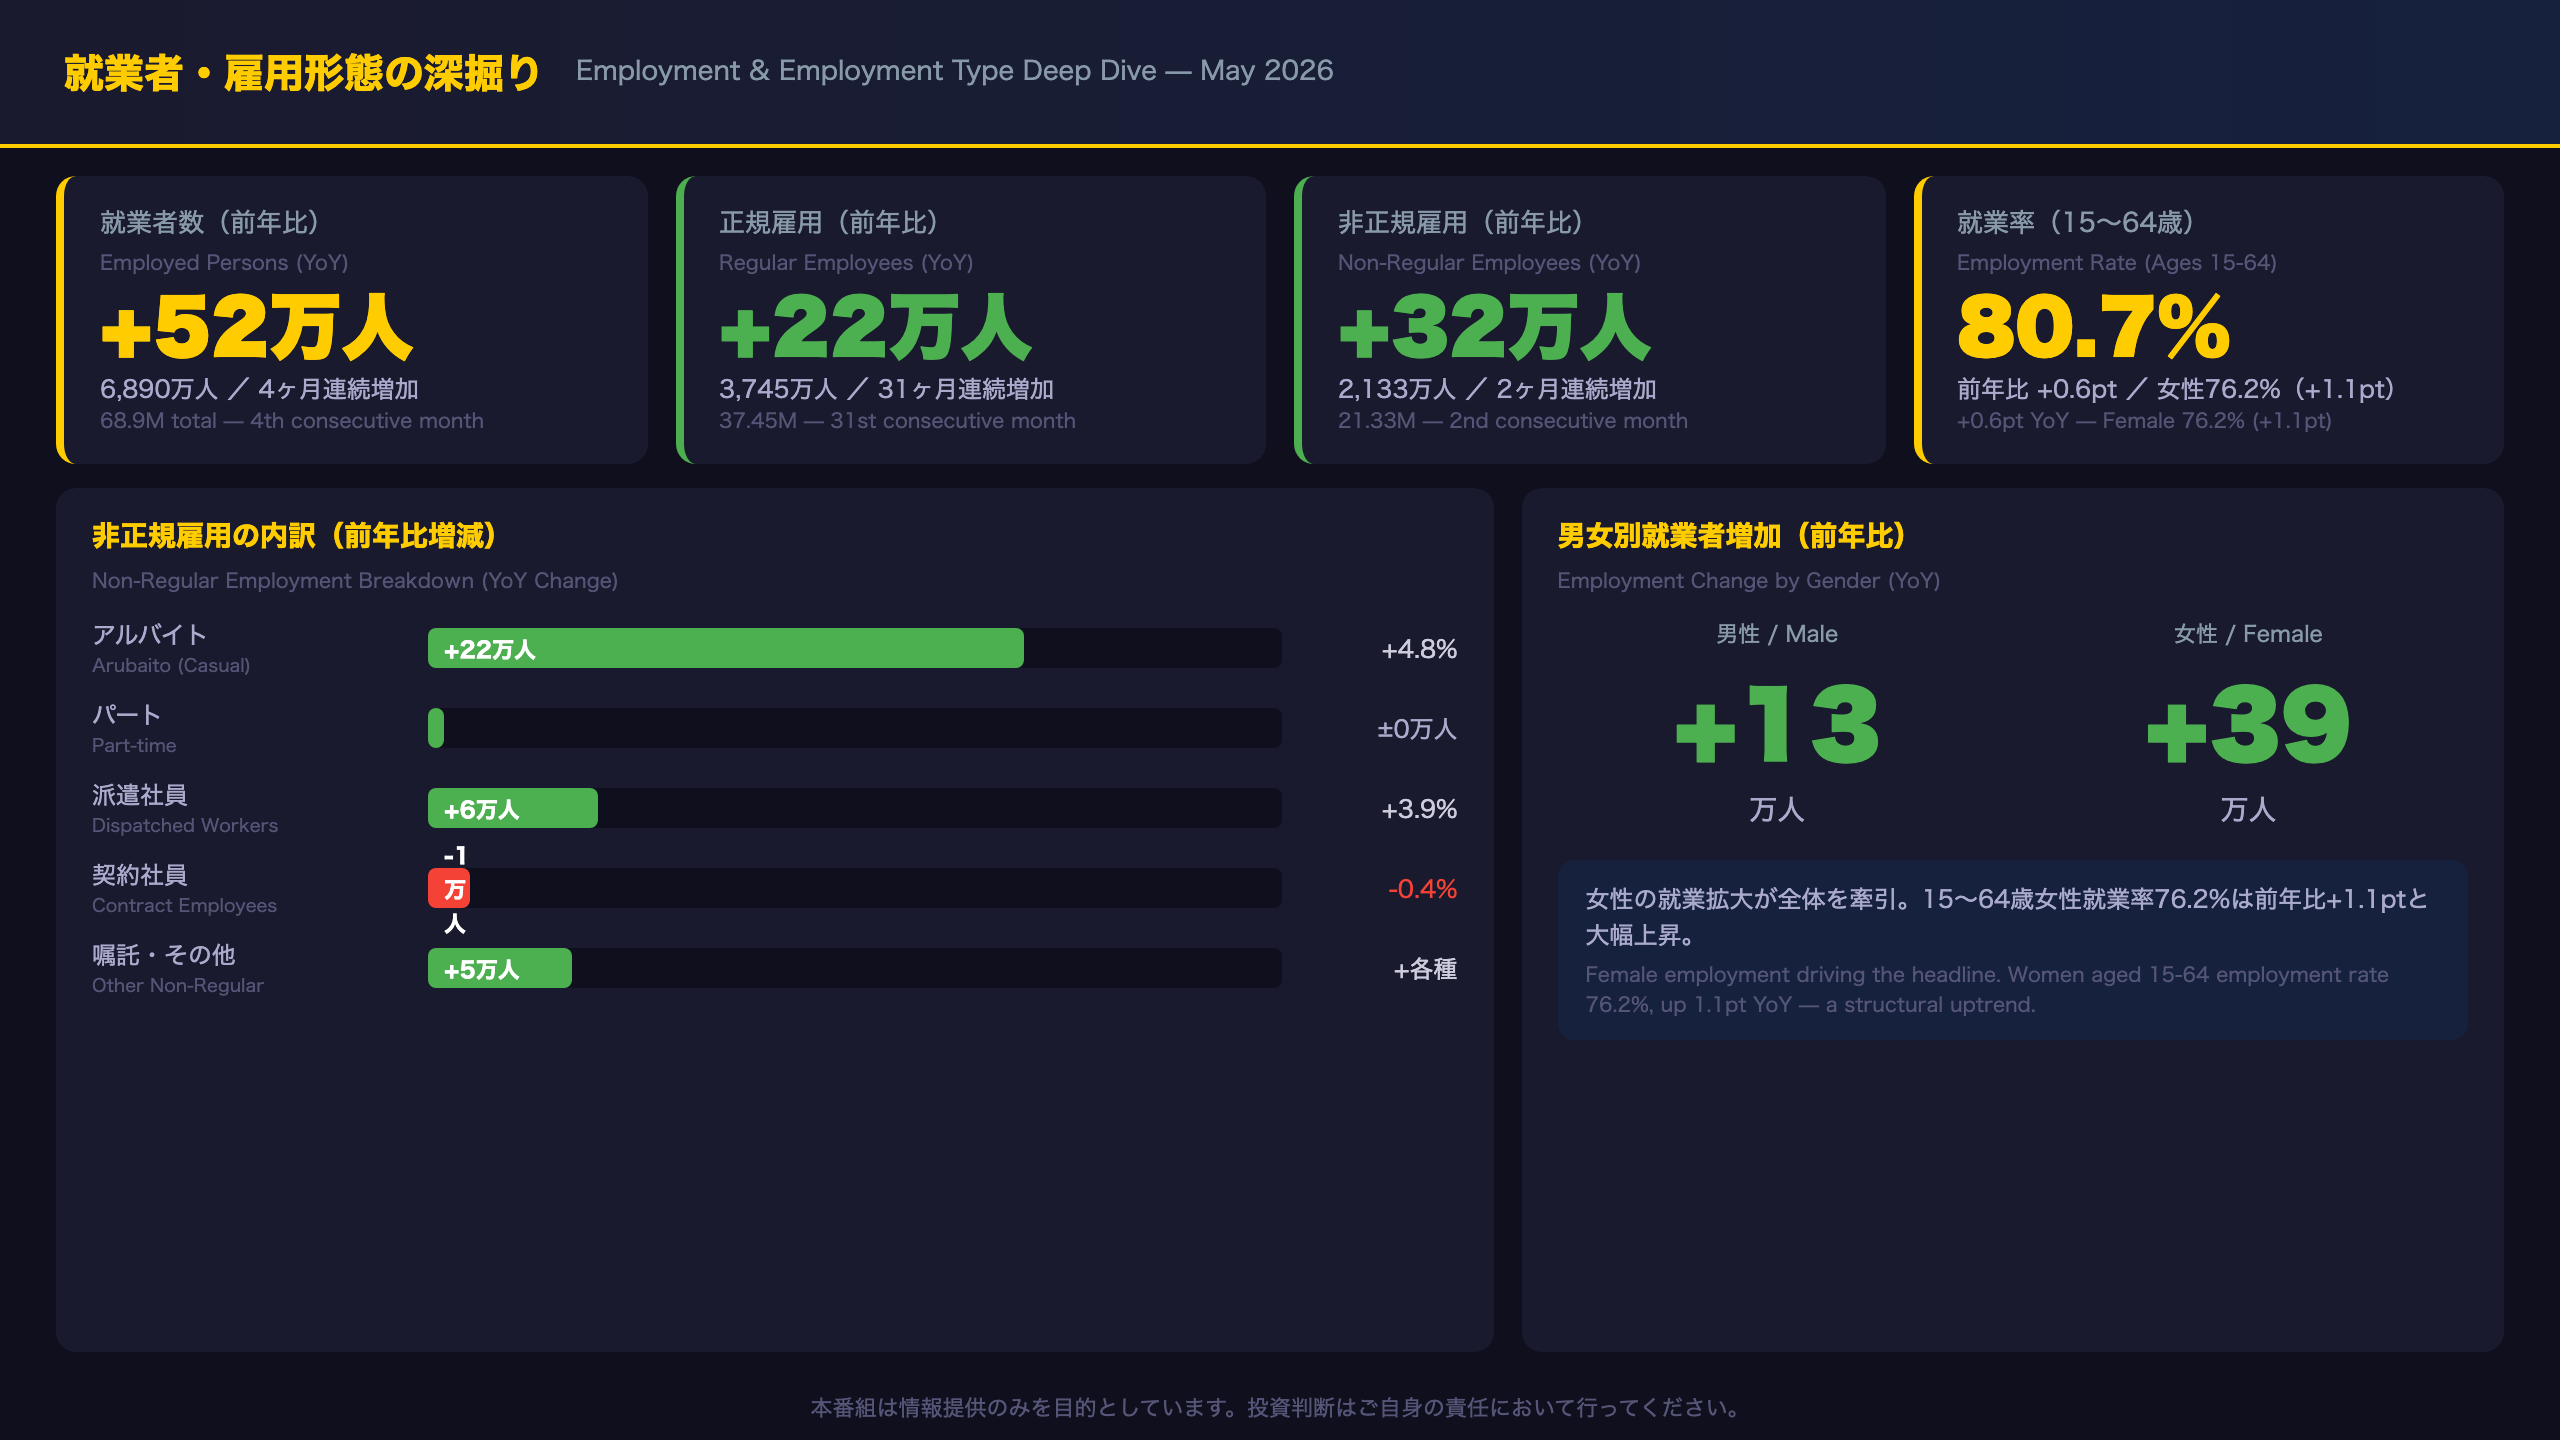
Employment Type Deep Dive: What the Regular/Non-Regular Expansion Tells Us
Japan’s Employment Classification System
Japan’s labour statistics distinguish sharply between “regular employees” (seiki shain) — permanent, full-time workers with strong job protections and typically higher wages — and “non-regular employees” (hiseiki shain), which includes part-timers, arubaito (casual workers), dispatched workers, and contract employees. This distinction matters enormously for wage dynamics: regular employees receive annual wage increases through the shunto (spring wage negotiation) process, while non-regular wages are more market-driven.
31 Consecutive Months: A Structural Shift
Regular employment has now risen for 31 consecutive months, reaching 37.45 million. The pace of increase — 220,000 in May — is consistent with the trend seen since mid-2024. This sustained expansion suggests that Japanese companies are increasingly converting non-regular positions to regular ones, partly in response to government policy incentives and partly due to competitive pressure to retain workers in a tight labor market.
Non-Regular Breakdown: Arubaito Surge
Within non-regular employment, arubaito (casual/part-time workers, typically younger) rose by 220,000 YoY (+4.8%), the largest subcategory increase. This likely reflects the acute labor shortages in accommodation, food services, and retail — sectors that rely heavily on casual labor. Dispatched workers rose 60,000 (+3.9%), while contract employees edged down 10,000 (-0.4%).
Female Employment Driving the Headline
Female employment rose 390,000 YoY versus 130,000 for males. The female employment rate for ages 15–64 reached 76.2%, up 1.1 percentage points YoY. Japan’s female labor force participation has been on a structural uptrend since the mid-2010s, driven by policy reforms (childcare expansion, equal pay legislation) and demographic necessity. This trend appears intact.
Comparison with April: Moderation in Pace
The YoY employment gain moderated from 640,000 in April to 520,000 in May. On a seasonally adjusted basis, employment rose 60,000 MoM — a continuation of the uptrend rather than a reversal. The moderation in the YoY figure partly reflects a higher base from May 2025.
産業別就業者:サービス業の人手不足とインフレへの連鎖
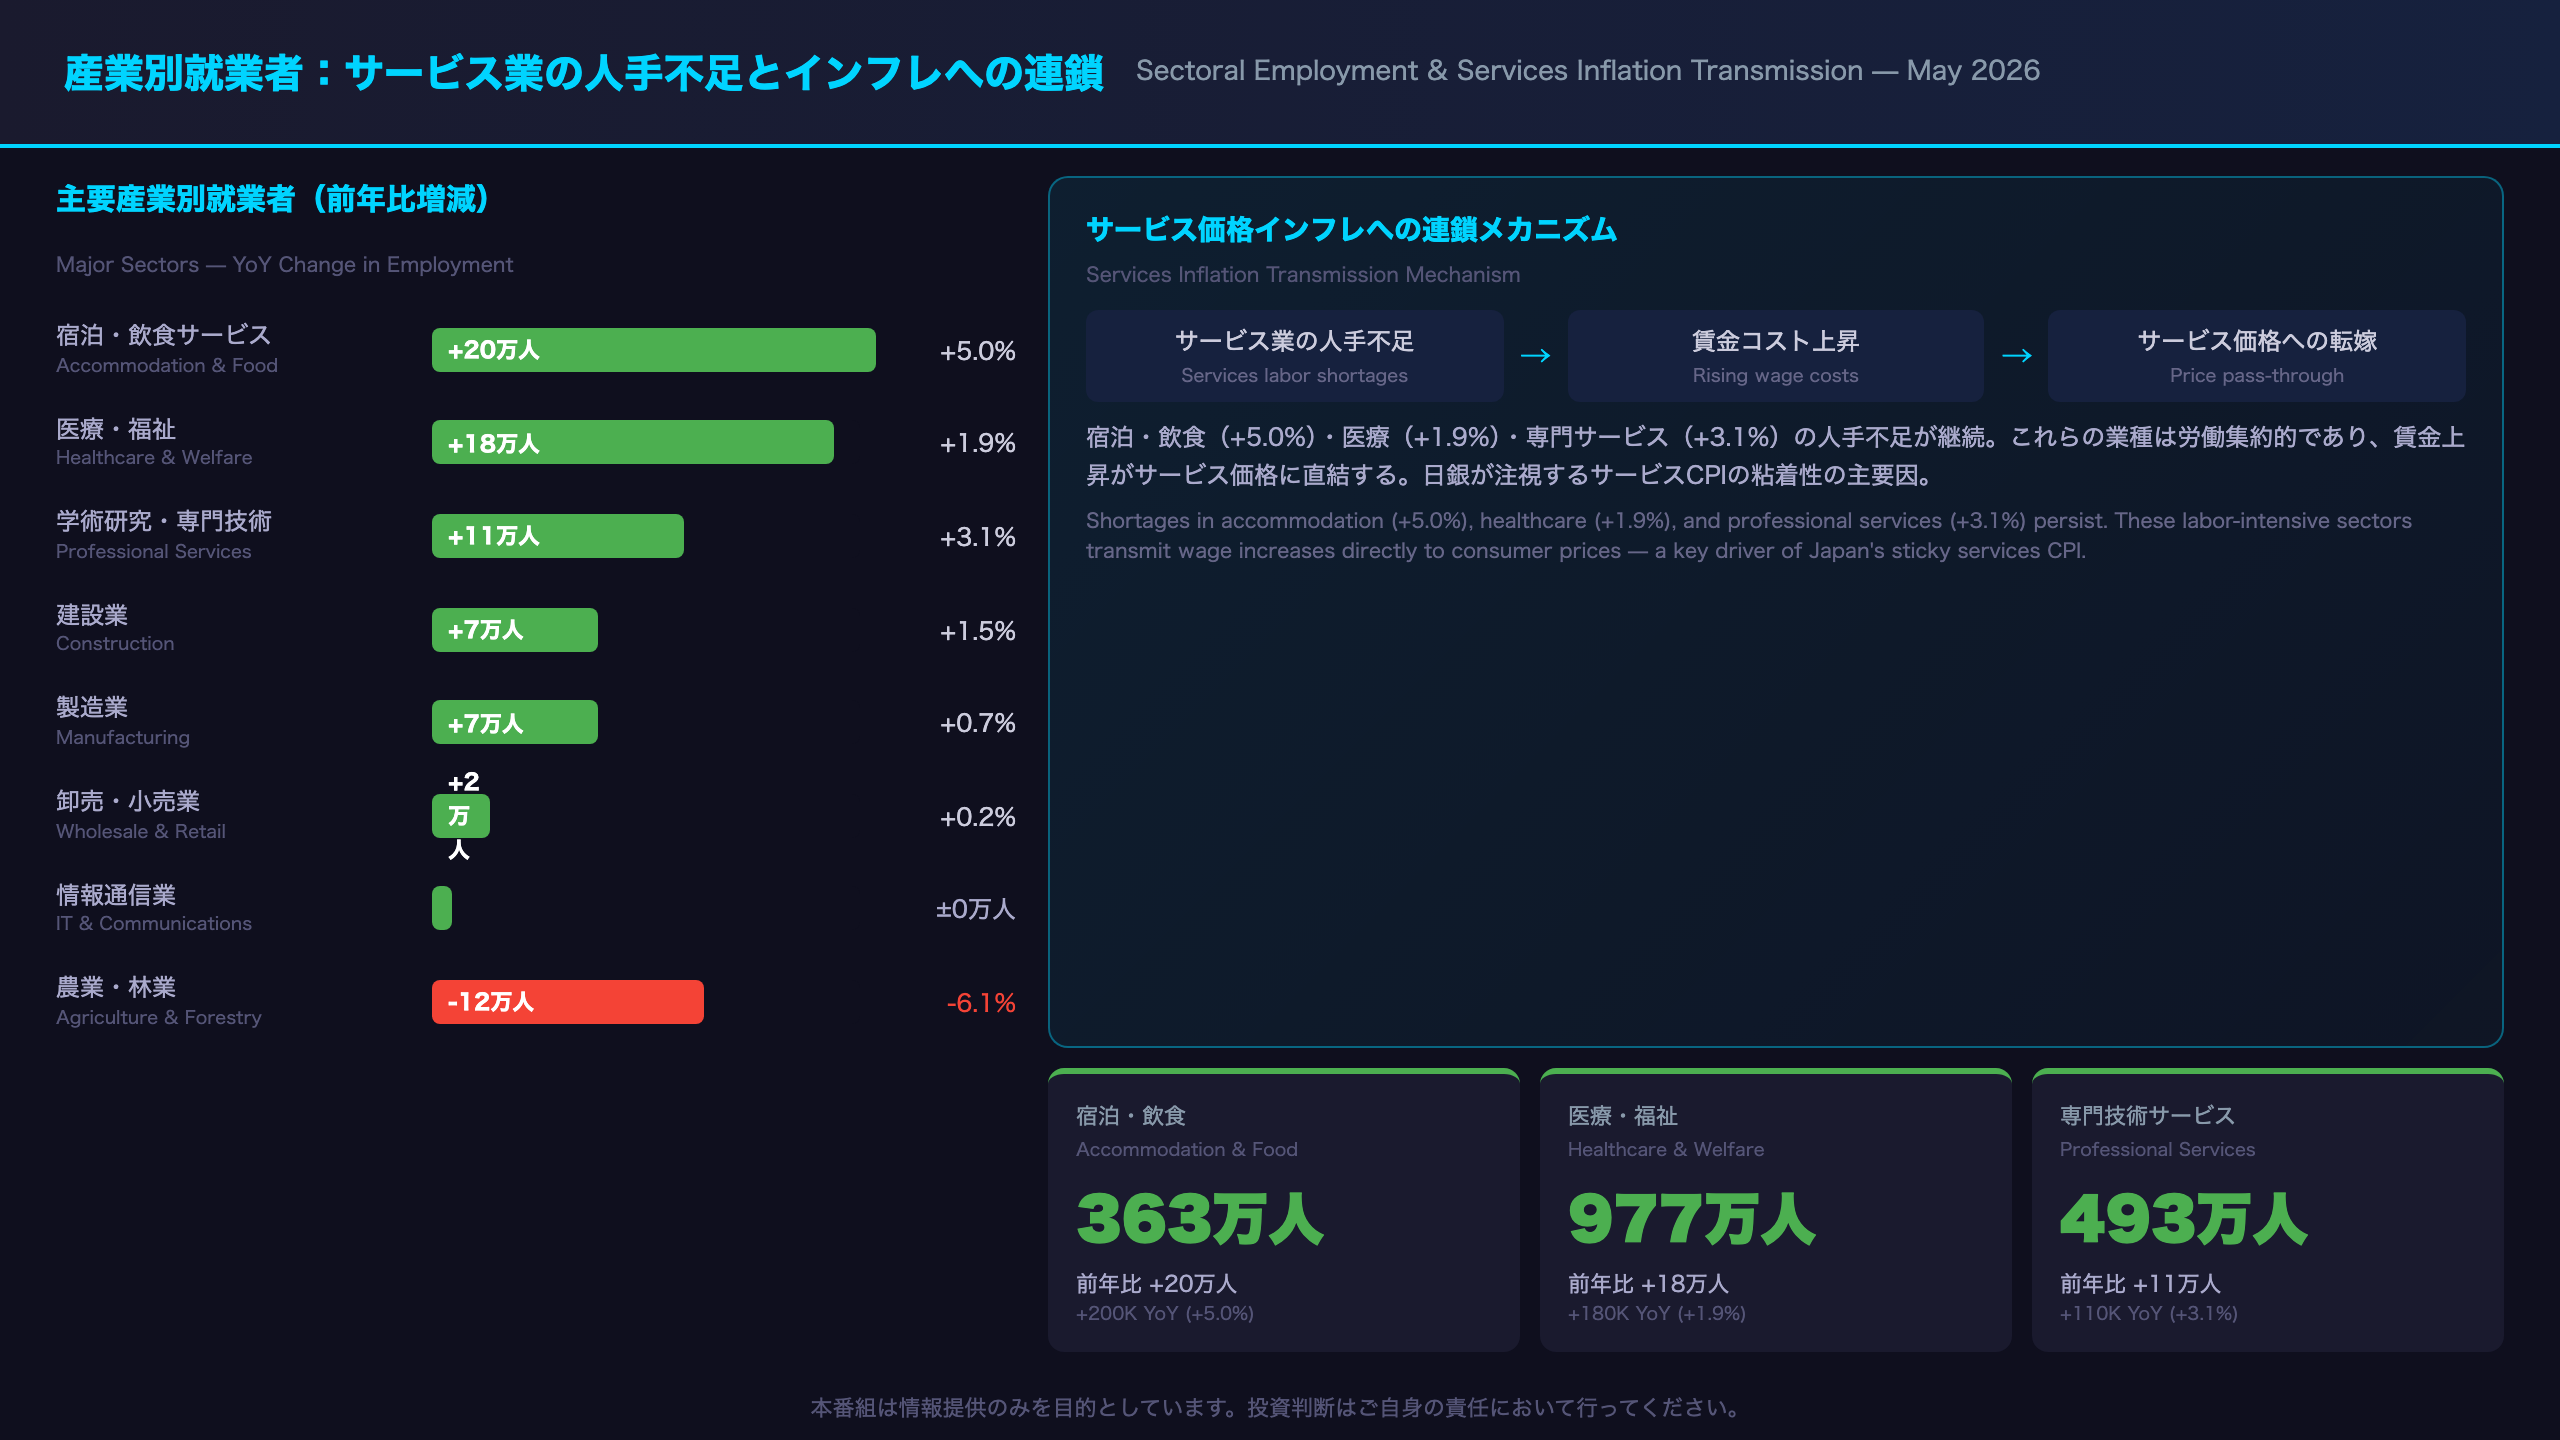
Sectoral Employment: Services Concentration and Its Inflation Implications
Accommodation & Food Services: The Inflation Bellwether
Accommodation and food services employment reached 3.63 million, up 200,000 YoY (+5.8% in May vs. +9.0% in April). Despite the moderation from April’s surge, this sector continues to post the largest absolute employment gain of any industry. The sector was among the hardest hit during the COVID-19 pandemic and is now experiencing acute labor shortages driven by the recovery in inbound tourism (Japan received a record number of foreign visitors in 2024–2025) and domestic consumption. Labor shortages in this sector are directly inflationary: restaurants and hotels raise menu prices and room rates to cover higher labor costs.
Healthcare & Welfare: Structural Shortage
Healthcare and welfare employment reached 9.77 million, up 180,000 YoY (+1.9%). Japan’s rapidly aging population creates inexorable demand growth in this sector, while supply-side constraints — training requirements, licensing, and relatively lower wages compared to other professional sectors — limit the pace of workforce expansion. Wage increases in this sector are partly determined by government-set reimbursement rates (kaigo hoshu for nursing care, shinryo hoshu for medical services), making policy decisions a key variable.
Manufacturing and Distribution: Near-Stagnation
Manufacturing employment rose only 70,000 YoY (+0.7%) to 10.35 million. Global demand uncertainty and ongoing automation investment are likely constraining headcount growth. Wholesale and retail trade was essentially flat, up just 20,000 (+0.2%). Information and communications was unchanged YoY.
The Services Inflation Transmission Mechanism
The divergence between services sector employment growth (accommodation +5%, healthcare +1.9%, professional services +3.1%) and manufacturing/distribution near-stagnation is a structural driver of Japan’s services CPI persistence. The transmission mechanism: labor shortages → wage increases → price pass-through to consumers. Japan’s services CPI has been running above 2% for several consecutive months, and this employment data suggests the underlying driver remains intact. For the BOJ, which explicitly monitors services inflation as a key indicator of whether the wage-price virtuous cycle is taking hold, this is a supportive signal.
完全失業者の動向:10ヶ月連続増加の正しい読み方
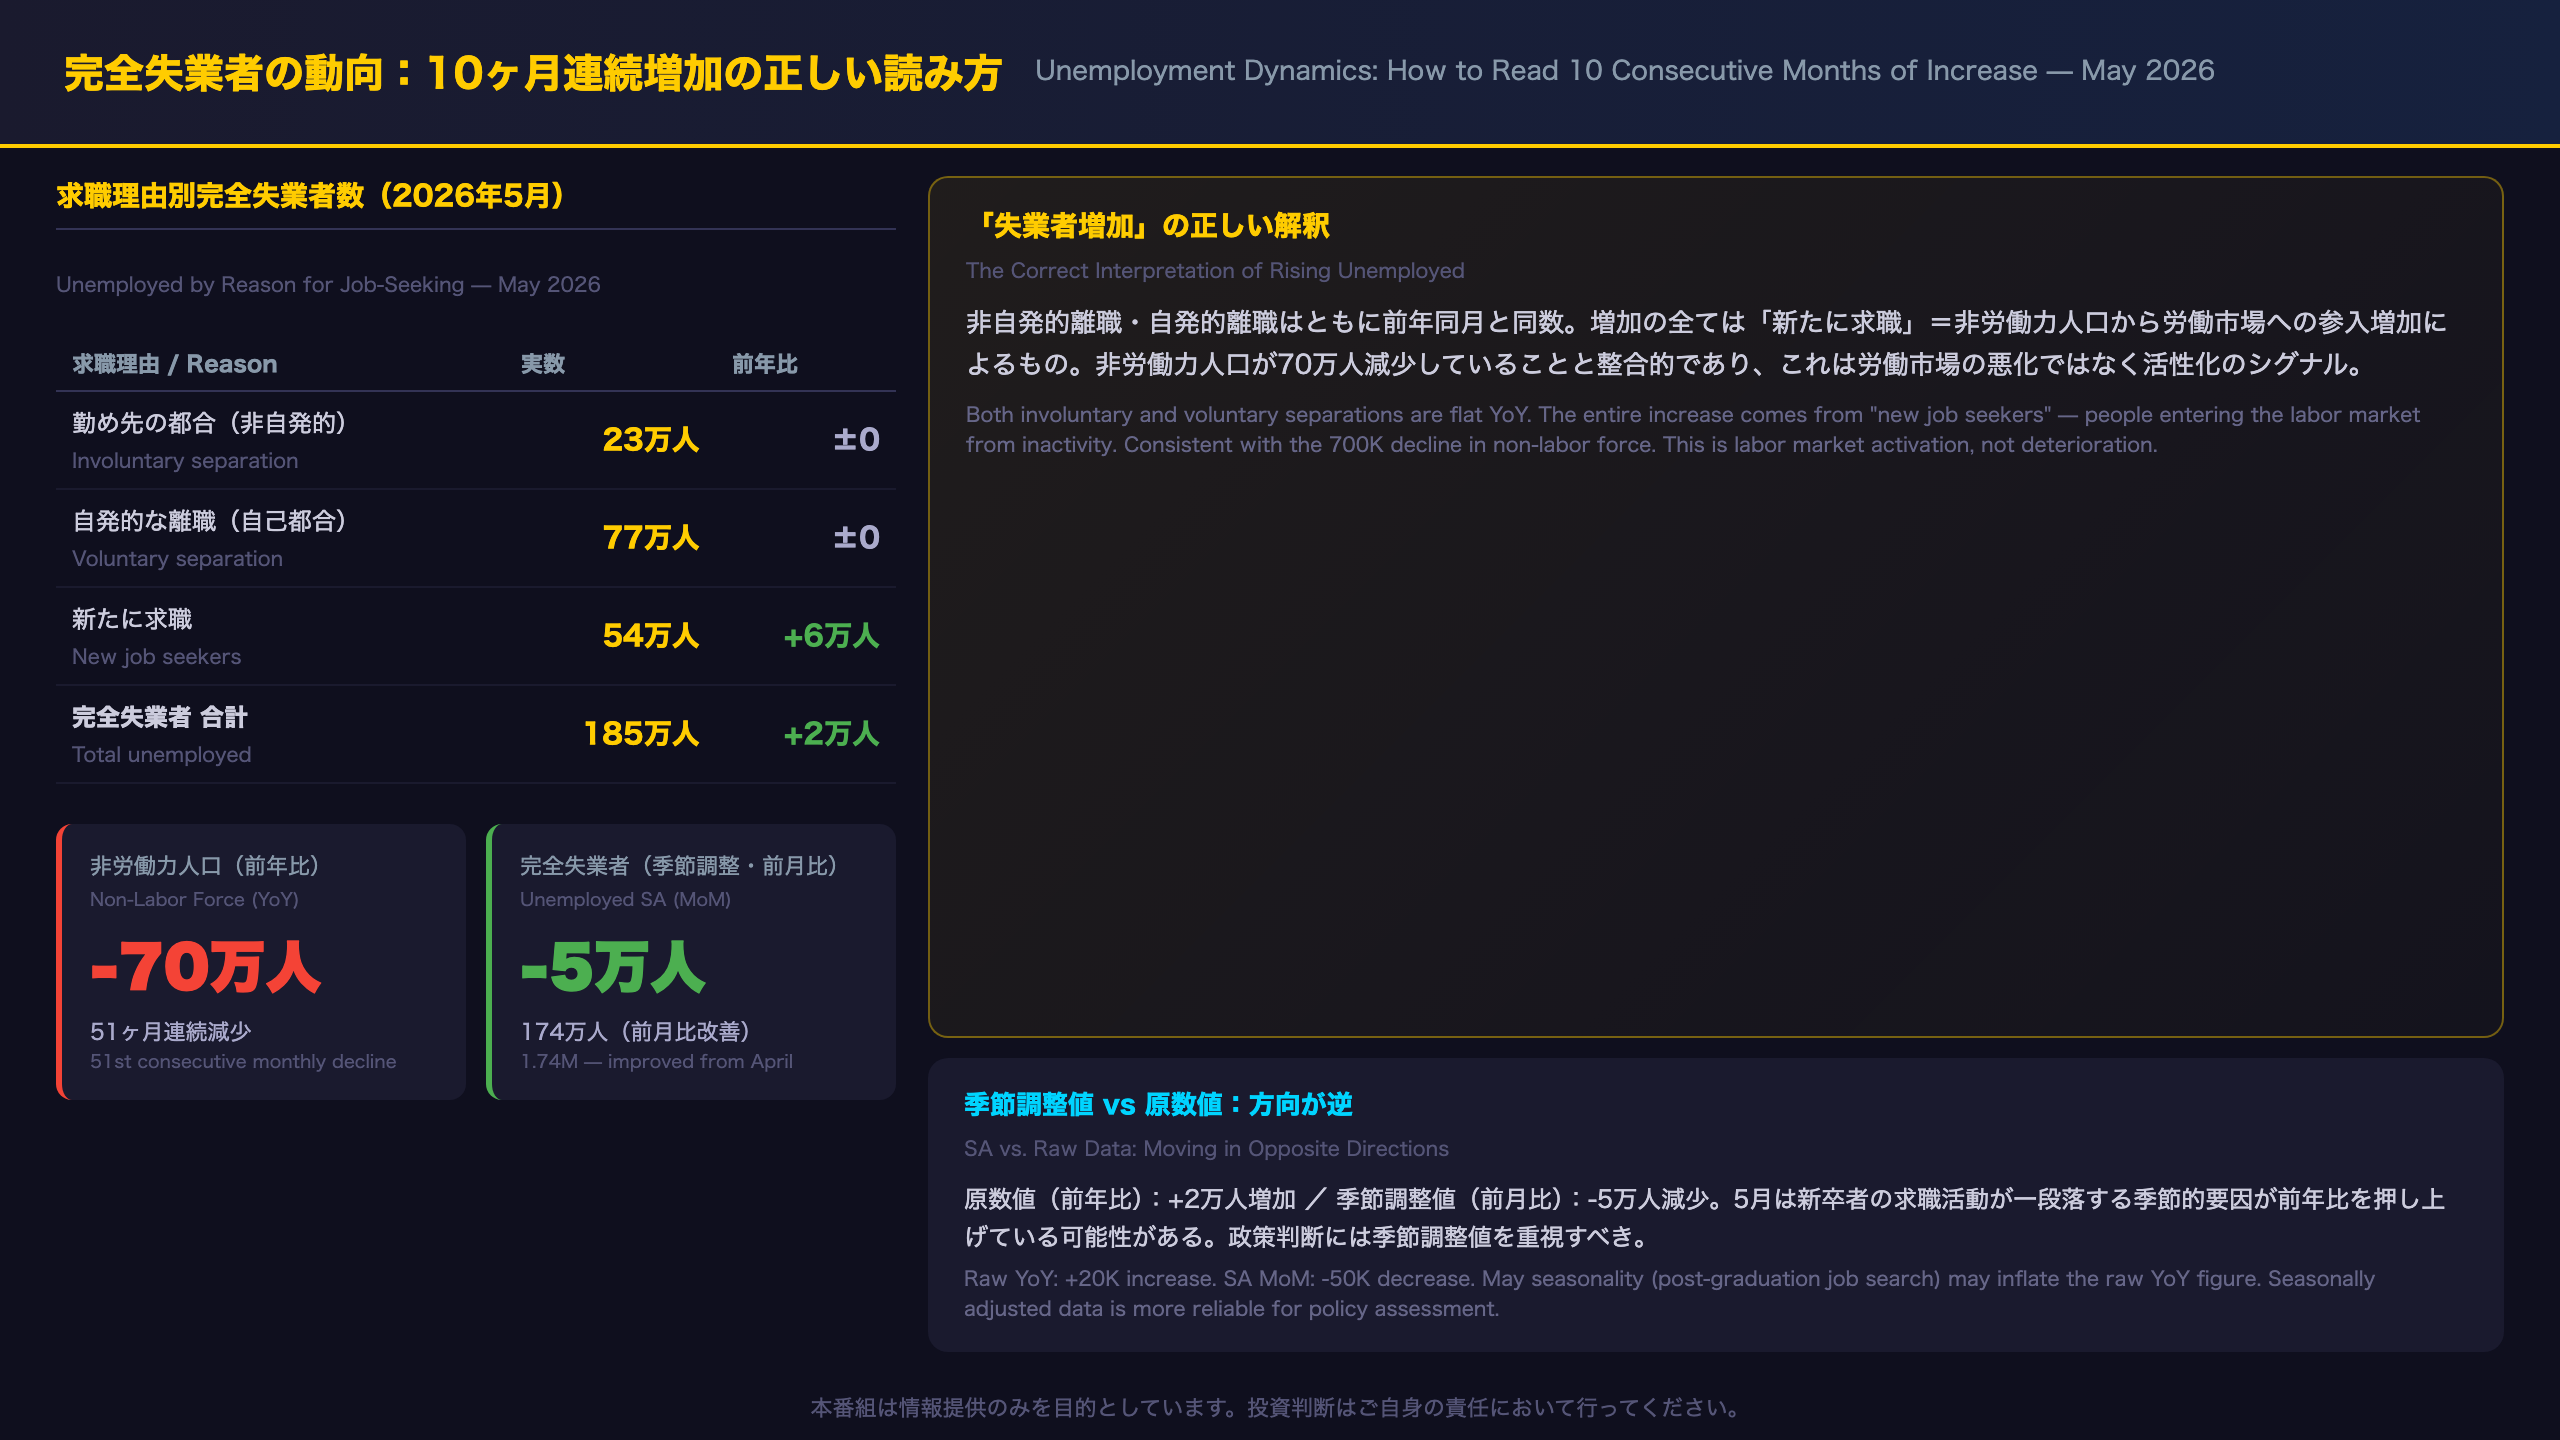
Unemployed Rising for 10 Months: Deterioration or Activation?
The Job-Seeking Reason Breakdown Is Everything
The headline “unemployed rising for 10 consecutive months” is technically accurate but potentially misleading without context. The breakdown by reason for job-seeking tells a very different story:
| Reason | May 2026 | YoY Change |
|---|---|---|
| Involuntary separation (employer circumstances) | 230K | Flat |
| Voluntary separation (own choice) | 770K | Flat |
| New job seekers (entering labor market) | 540K | +60K |
The entire year-on-year increase is attributable to new job seekers — people who were previously outside the labor force and are now actively looking for work. Involuntary separations (layoffs) are flat, meaning there is no deterioration in job security.
Seasonally Adjusted vs. Raw Year-on-Year: A Critical Divergence
On a seasonally adjusted basis, the unemployed count fell by 50,000 from April to 1.74 million in May. This moves in the opposite direction from the raw year-on-year comparison (+20,000). The divergence reflects seasonal patterns: May typically sees an influx of new job seekers (recent graduates, people re-entering after spring), which inflates the raw year-on-year comparison. The seasonally adjusted figure is the more reliable indicator of underlying trend.
Non-Labor Force Decline: The Structural Story
The non-labor force population fell 700,000 YoY to 38.8 million — the 51st consecutive monthly decline. This is a structural trend driven by rising labor force participation among women, older workers, and youth. As these groups enter the labor market, they first appear as “unemployed” before finding jobs, temporarily pushing up the unemployed count. This is a healthy dynamic, not a sign of labor market stress.
International Context
Japan’s 2.5% unemployment rate compares favorably with the U.S. (approximately 4.0–4.5%), the Eurozone (approximately 6%), and the UK (approximately 4.5%). Japan’s low unemployment reflects both structural factors (lifetime employment culture, low layoff rates) and cyclical tightness. The BOJ’s assessment of labor market conditions focuses on the unemployment rate and the job-offers-to-applicants ratio (from the Ministry of Health, Labour and Welfare’s Employment Security Statistics, released separately) rather than the absolute level of unemployed.
市場インプリケーション:日銀利上げパスと円・金利への示唆
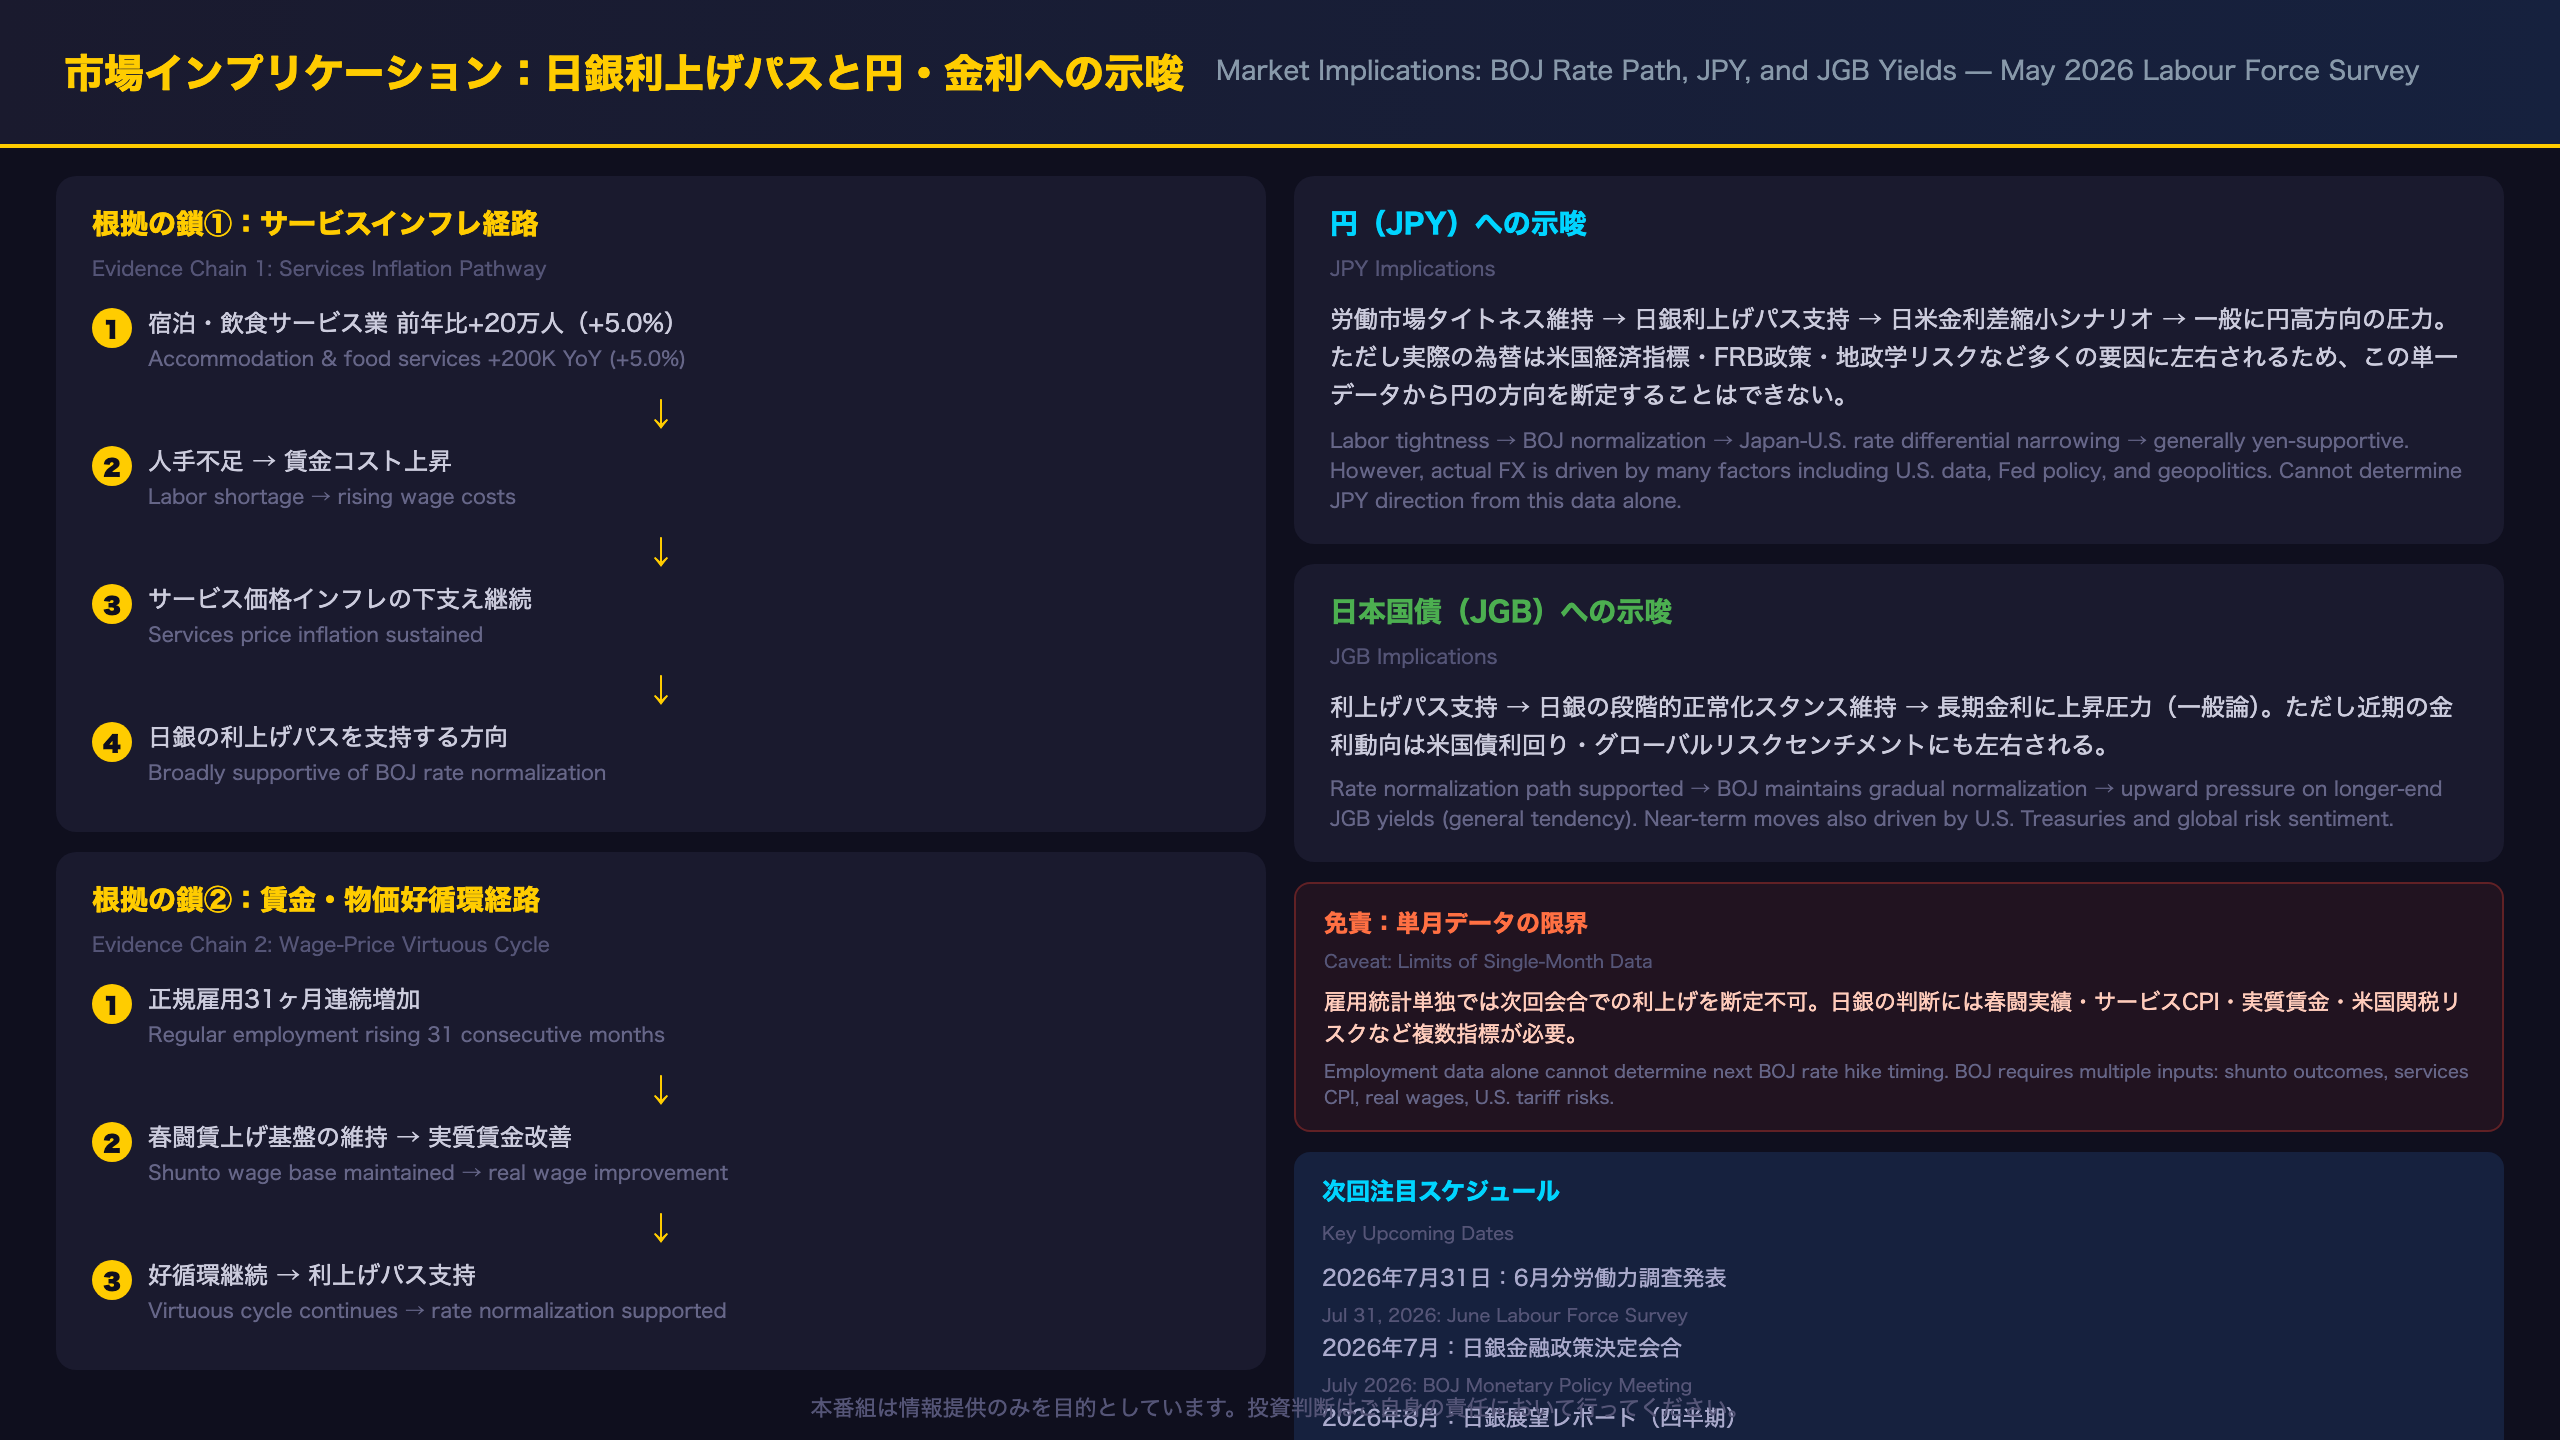
Market Implications: The “Chain of Evidence” for BOJ, JPY, and JGBs
BOJ Rate Path: The Evidence Chain
Chain 1 (Services Inflation):
Accommodation & food services employment +200K YoY (+5.0%) → labor shortage-driven wage cost increases → services price inflation sustained → contributes to BOJ’s 2% inflation target achievement → broadly supportive of rate normalization
Chain 2 (Wage-Price Virtuous Cycle):
Regular employment rising for 31 consecutive months → sustained base for shunto wage negotiations → real wage improvement → consumption persistence → virtuous cycle continuation → supportive of rate normalization
Important Caveats:
– Single-month employment data alone is insufficient to predict the timing of the next BOJ rate hike
– BOJ’s policy decision requires multiple inputs: shunto outcomes, services CPI trajectory, real wage dynamics, and global risk factors
– U.S. tariff policy and geopolitical risks affecting Japanese exports and corporate earnings must also be considered
JPY Implications
Evidence Chain: Labor market tightness sustained → BOJ rate normalization supported → Japan-U.S. interest rate differential narrowing scenario → generally yen-supportive pressure
Caveat: The actual exchange rate is determined by many factors including U.S. economic data, Fed policy, and geopolitical risks. It is not possible to determine the direction of the yen from this single data point. This is a general tendency, not a forecast.
JGB Implications
Evidence Chain: Labor market tightness → BOJ maintains gradual normalization stance → upward pressure on longer-end JGB yields over time
Caveat: Near-term JGB yield movements are also influenced by global risk sentiment, U.S. Treasury yields, and BOJ’s yield curve control (or its successor framework). Single-month employment data is one input among many.
Key Upcoming Dates
- July 31, 2026: June Labour Force Survey release
- July 2026: BOJ Monetary Policy Meeting
- August 2026: BOJ Quarterly Outlook Report (Tenbo Report)
Disclaimer: This article is for informational purposes only. All investment decisions are made solely at your own risk.







