📺 Watch the Full Video Analysis
This article was automatically generated by the NFC Market Live AI analysis system. (Updated: 2026-07-07 08:42 JST)
📄 Primary Source
厚生労働省
https://www.mhlw.go.jp/toukei/itiran/roudou/monthly/r08/2605p/dl/pdf2605p.pdf
A deep dive into Japan’s May 2026 Monthly Labour Survey from the Ministry of Health, Labour and Welfare (MHLW). 📊 Real wages rose 1.4% YoY, marking a 5th straight month of gains. 📈 But nominal wage growth decelerated to 3.2% from 3.5%, while inflation accelerated. 💡 We break down base pay, bonuses, working hours, part-time labor dynamics, and how Japan’s real wage trend now compares to the US, UK, and Germany. ⚠️ What does this mean for the Bank of Japan’s next rate decision?
実質賃金5ヶ月連続プラス、されど伸び率は鈍化
Overview: A Mixed Signal from Japan’s Wage Data
Japan’s Ministry of Health, Labour and Welfare (MHLW) is a government body that compiles the Monthly Labour Survey (毎月勤労統計調査), one of the most closely watched inputs for the Bank of Japan’s (BOJ) policy decisions. Unlike the U.S. Bureau of Labor Statistics’ payroll report, this survey focuses specifically on wage levels, hours worked, and employment counts across roughly 33,000 sampled establishments with 5+ employees.
Key Figures (All Workers, Establishments with 5+ Employees)
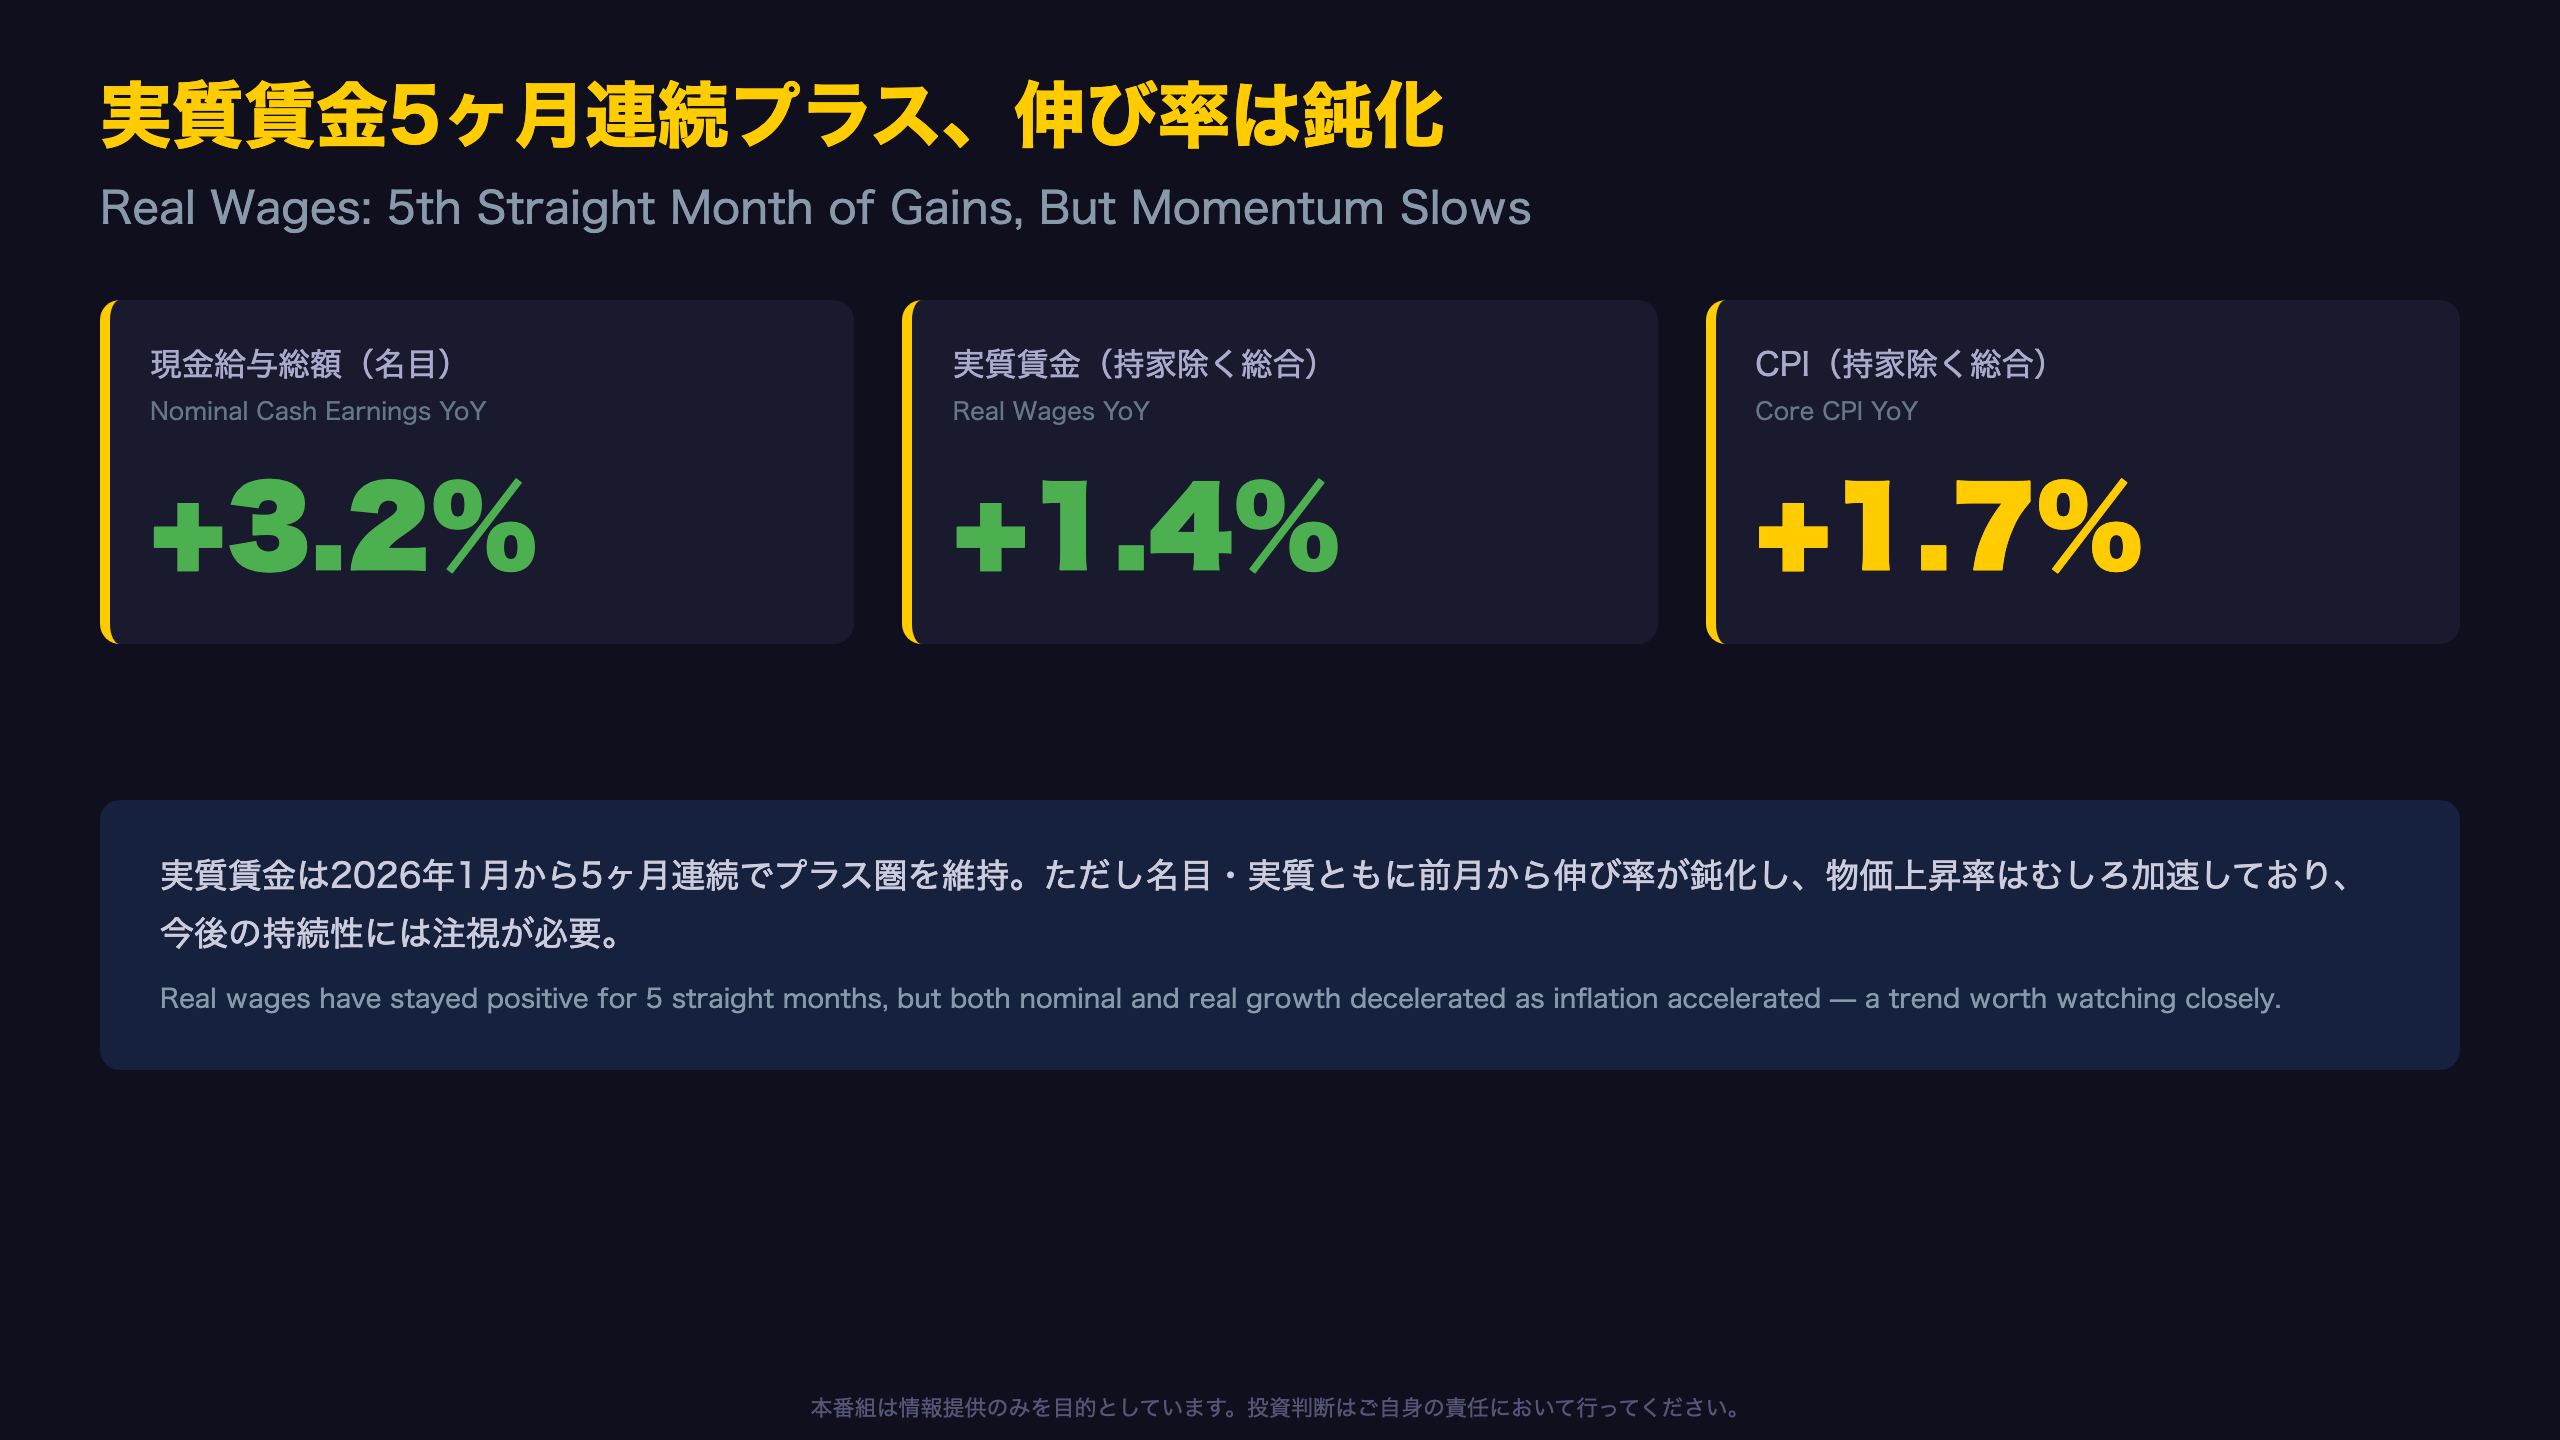
- Total cash earnings: 311,165 yen (+3.2% YoY), down from April’s +3.5%
- Real wages (ex-imputed rent CPI): +1.4% YoY, down from a revised +2.0% in April
- Real wages (headline CPI basis): +1.7% YoY
- Core CPI (ex-imputed rent): +1.7% YoY, accelerating from +1.5%
Why This Matters Internationally
Unlike the U.S., where real wage growth (per the Bureau of Labor Statistics) has recently turned negative (-0.7% hourly, -0.4% weekly as of May 2026), Japan’s real wages have now outperformed the U.S. for several consecutive months — a genuine reversal of the historical pattern where Japan lagged G7 peers on real income growth.
Market Implications
For USD/JPY and JGB traders, sustained positive real wages strengthen the case for the BOJ’s “virtuous cycle” thesis (wages driving demand-pull inflation), a precondition officials have cited for further policy normalization. However, the deceleration in both nominal and real wage growth over two consecutive months, combined with reaccelerating inflation, means this single data point cannot yet confirm a durable trend — the next release (June data, due August 5) will be critical.
実質賃金「5ヶ月連続プラス」の重み
Quantifying the Rarity of This Streak
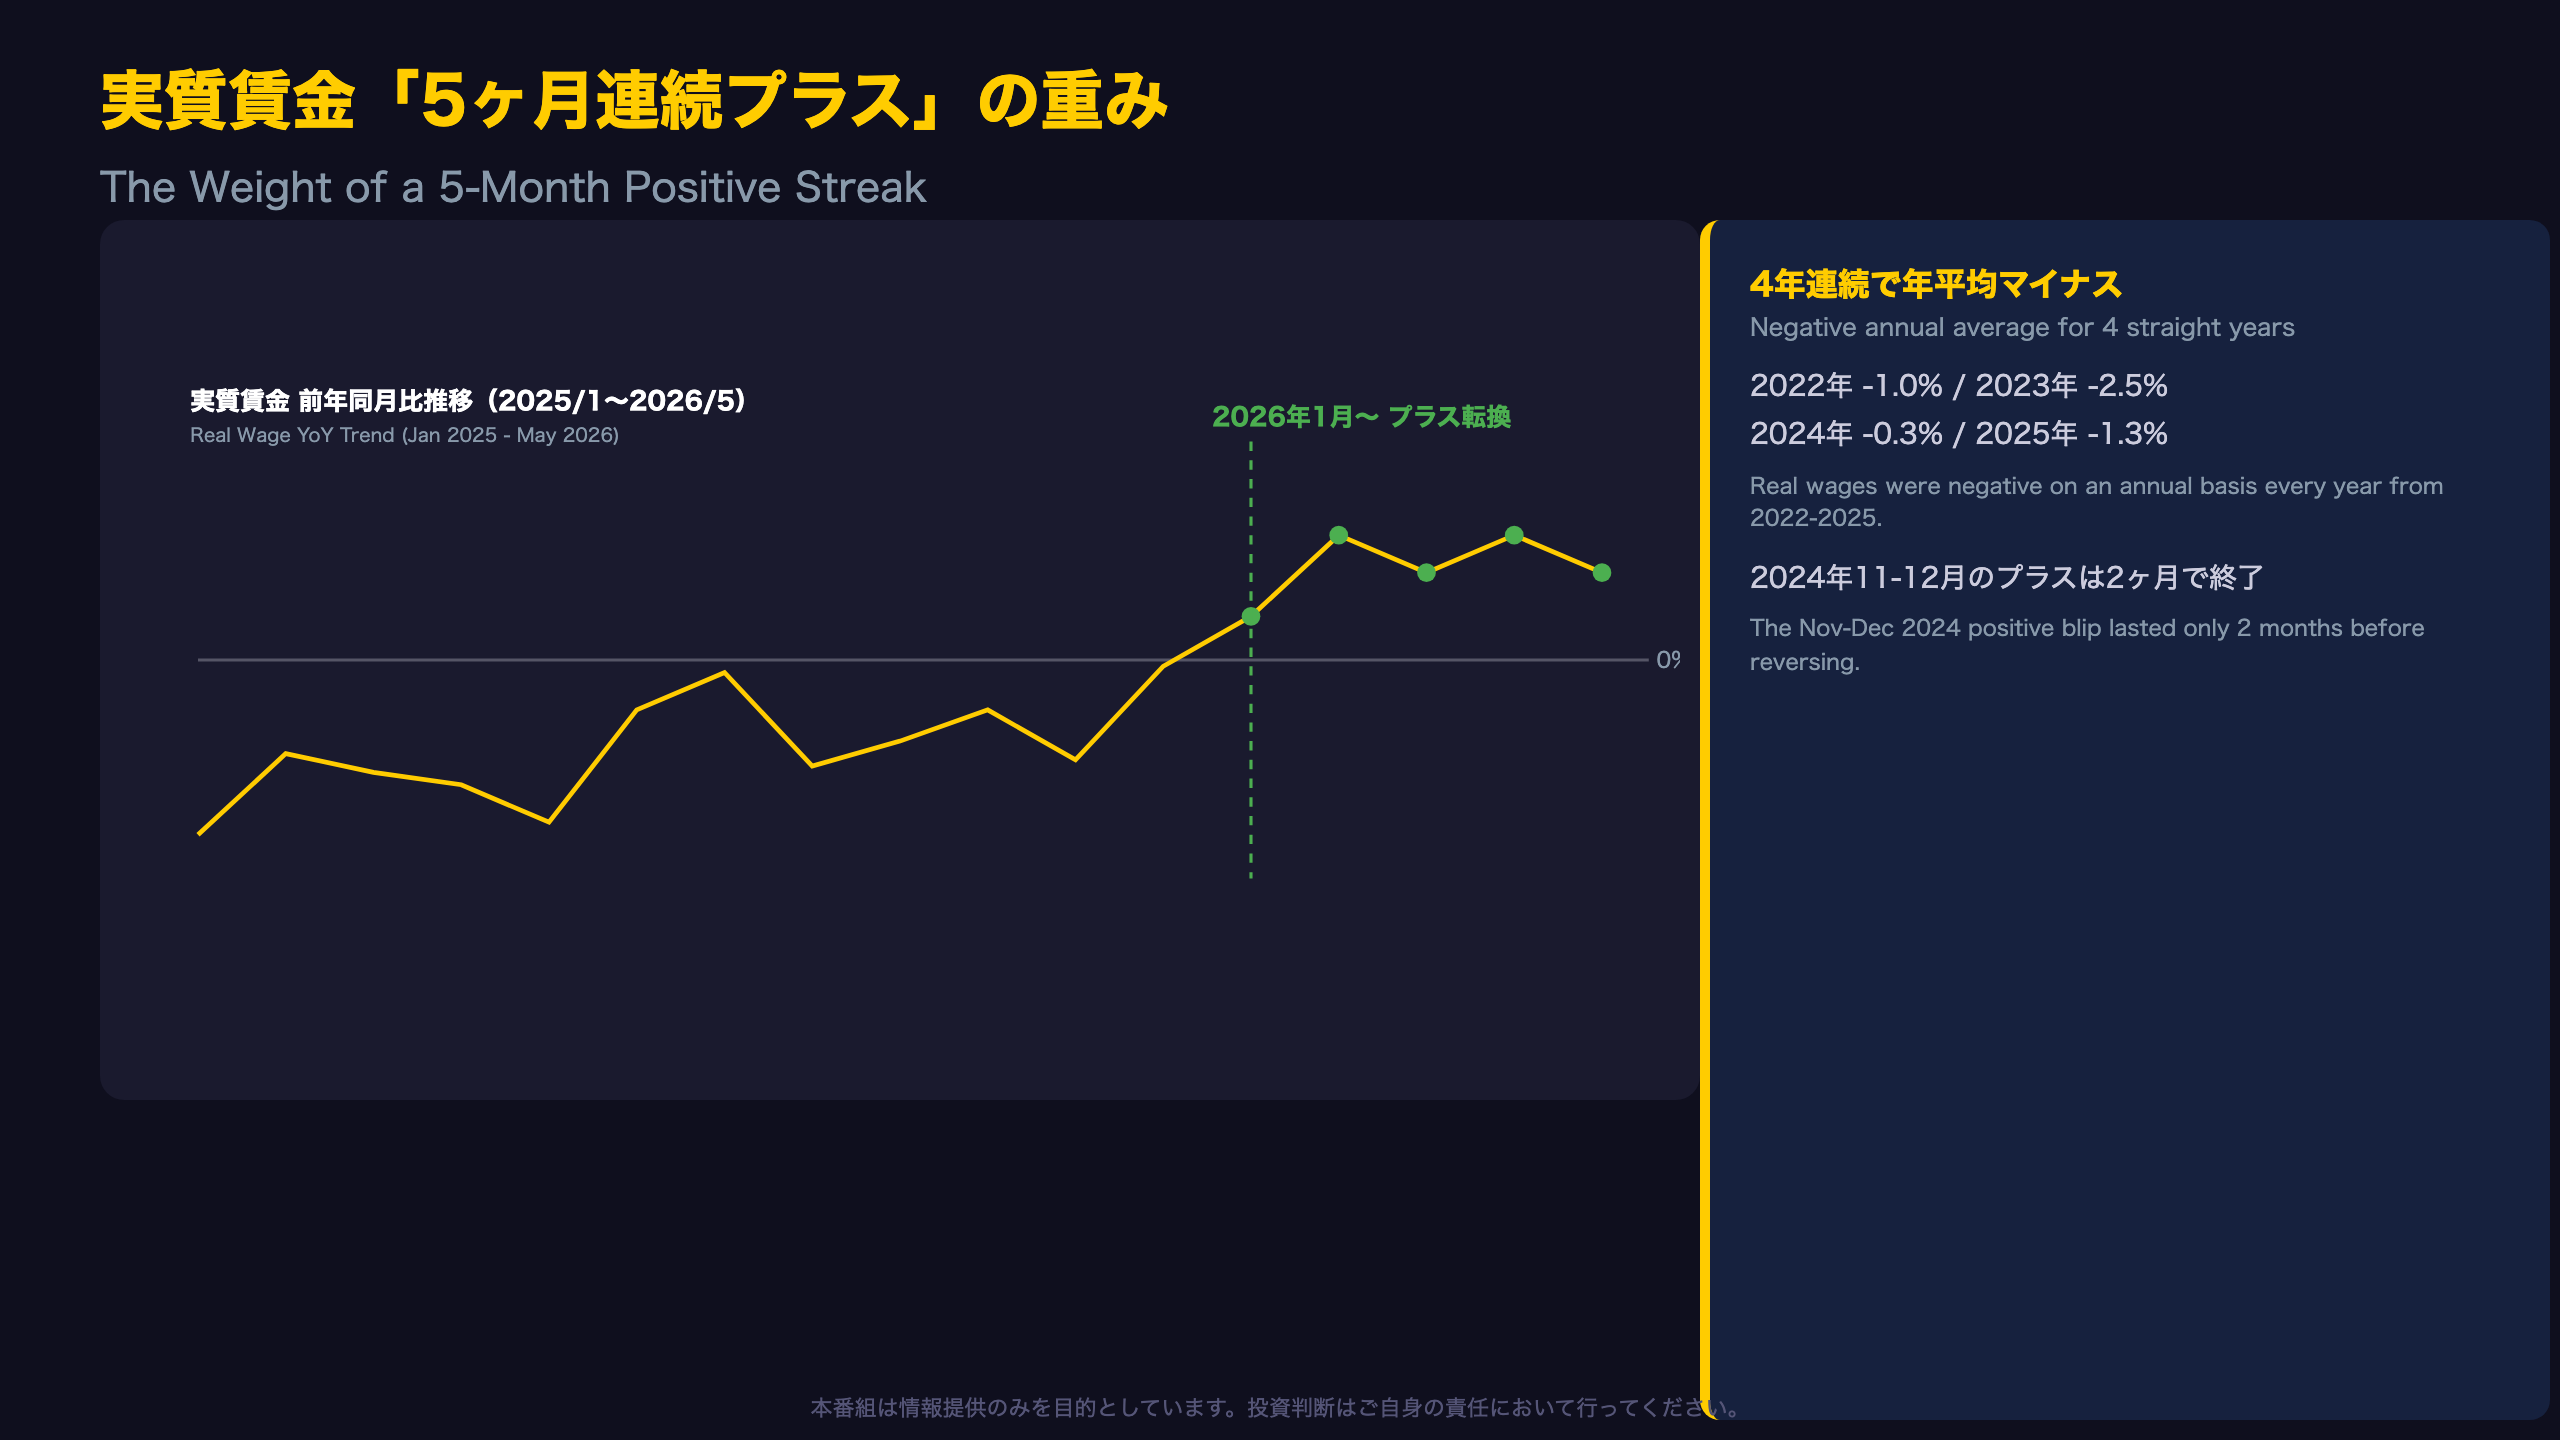
Tracking Japan’s real wage growth (deflated by CPI excluding imputed rent) month by month reveals just how unusual the current five-month positive streak is.
Monthly Trajectory (Jan 2025 – May 2026)
- Jan–Dec 2025: Real wages were negative in every single month, ranging from -2.8% to -0.1%
- Jan 2026: Turned positive at +0.7%
- Feb–May 2026: +2.0%, +1.4%, +2.0% (revised), +1.4%
Looking at annual averages, Japan’s real wages were negative in 2022 (-1.0%), 2023 (-2.5%), and 2025 (-1.3%), and essentially flat in 2024 (-0.3%). Even the brief positive blip in November-December 2024 (+0.5%, +0.3%) reversed sharply back to -2.8% by January 2025.
Not a Smooth Trend
The five-month streak isn’t monotonic — it peaked at +2.0% in February, dipped to +1.4% in March, rebounded to +2.0% in April (after revision), and eased back to +1.4% in May. Notably, May’s slowdown coincided with both decelerating nominal wage growth (3.5% → 3.2%) and accelerating core CPI (1.5% → 1.7%) — a combination that, if it persists into June, could push real wage growth below 1%.
A Statistical Caveat Worth Noting
MHLW’s own footnotes disclose that the January 2026 sample rotation (for establishments with 30+ employees) introduced a downward bias of approximately -0.5% in total cash earnings and -0.3% in scheduled earnings. This means the true underlying wage trend could be modestly stronger than the headline figures suggest — an important nuance for anyone comparing year-over-year growth rates across this rotation boundary.
所定内給与は高水準も鈍化、ボーナスは堅調
Breaking Down the Components of Wage Growth
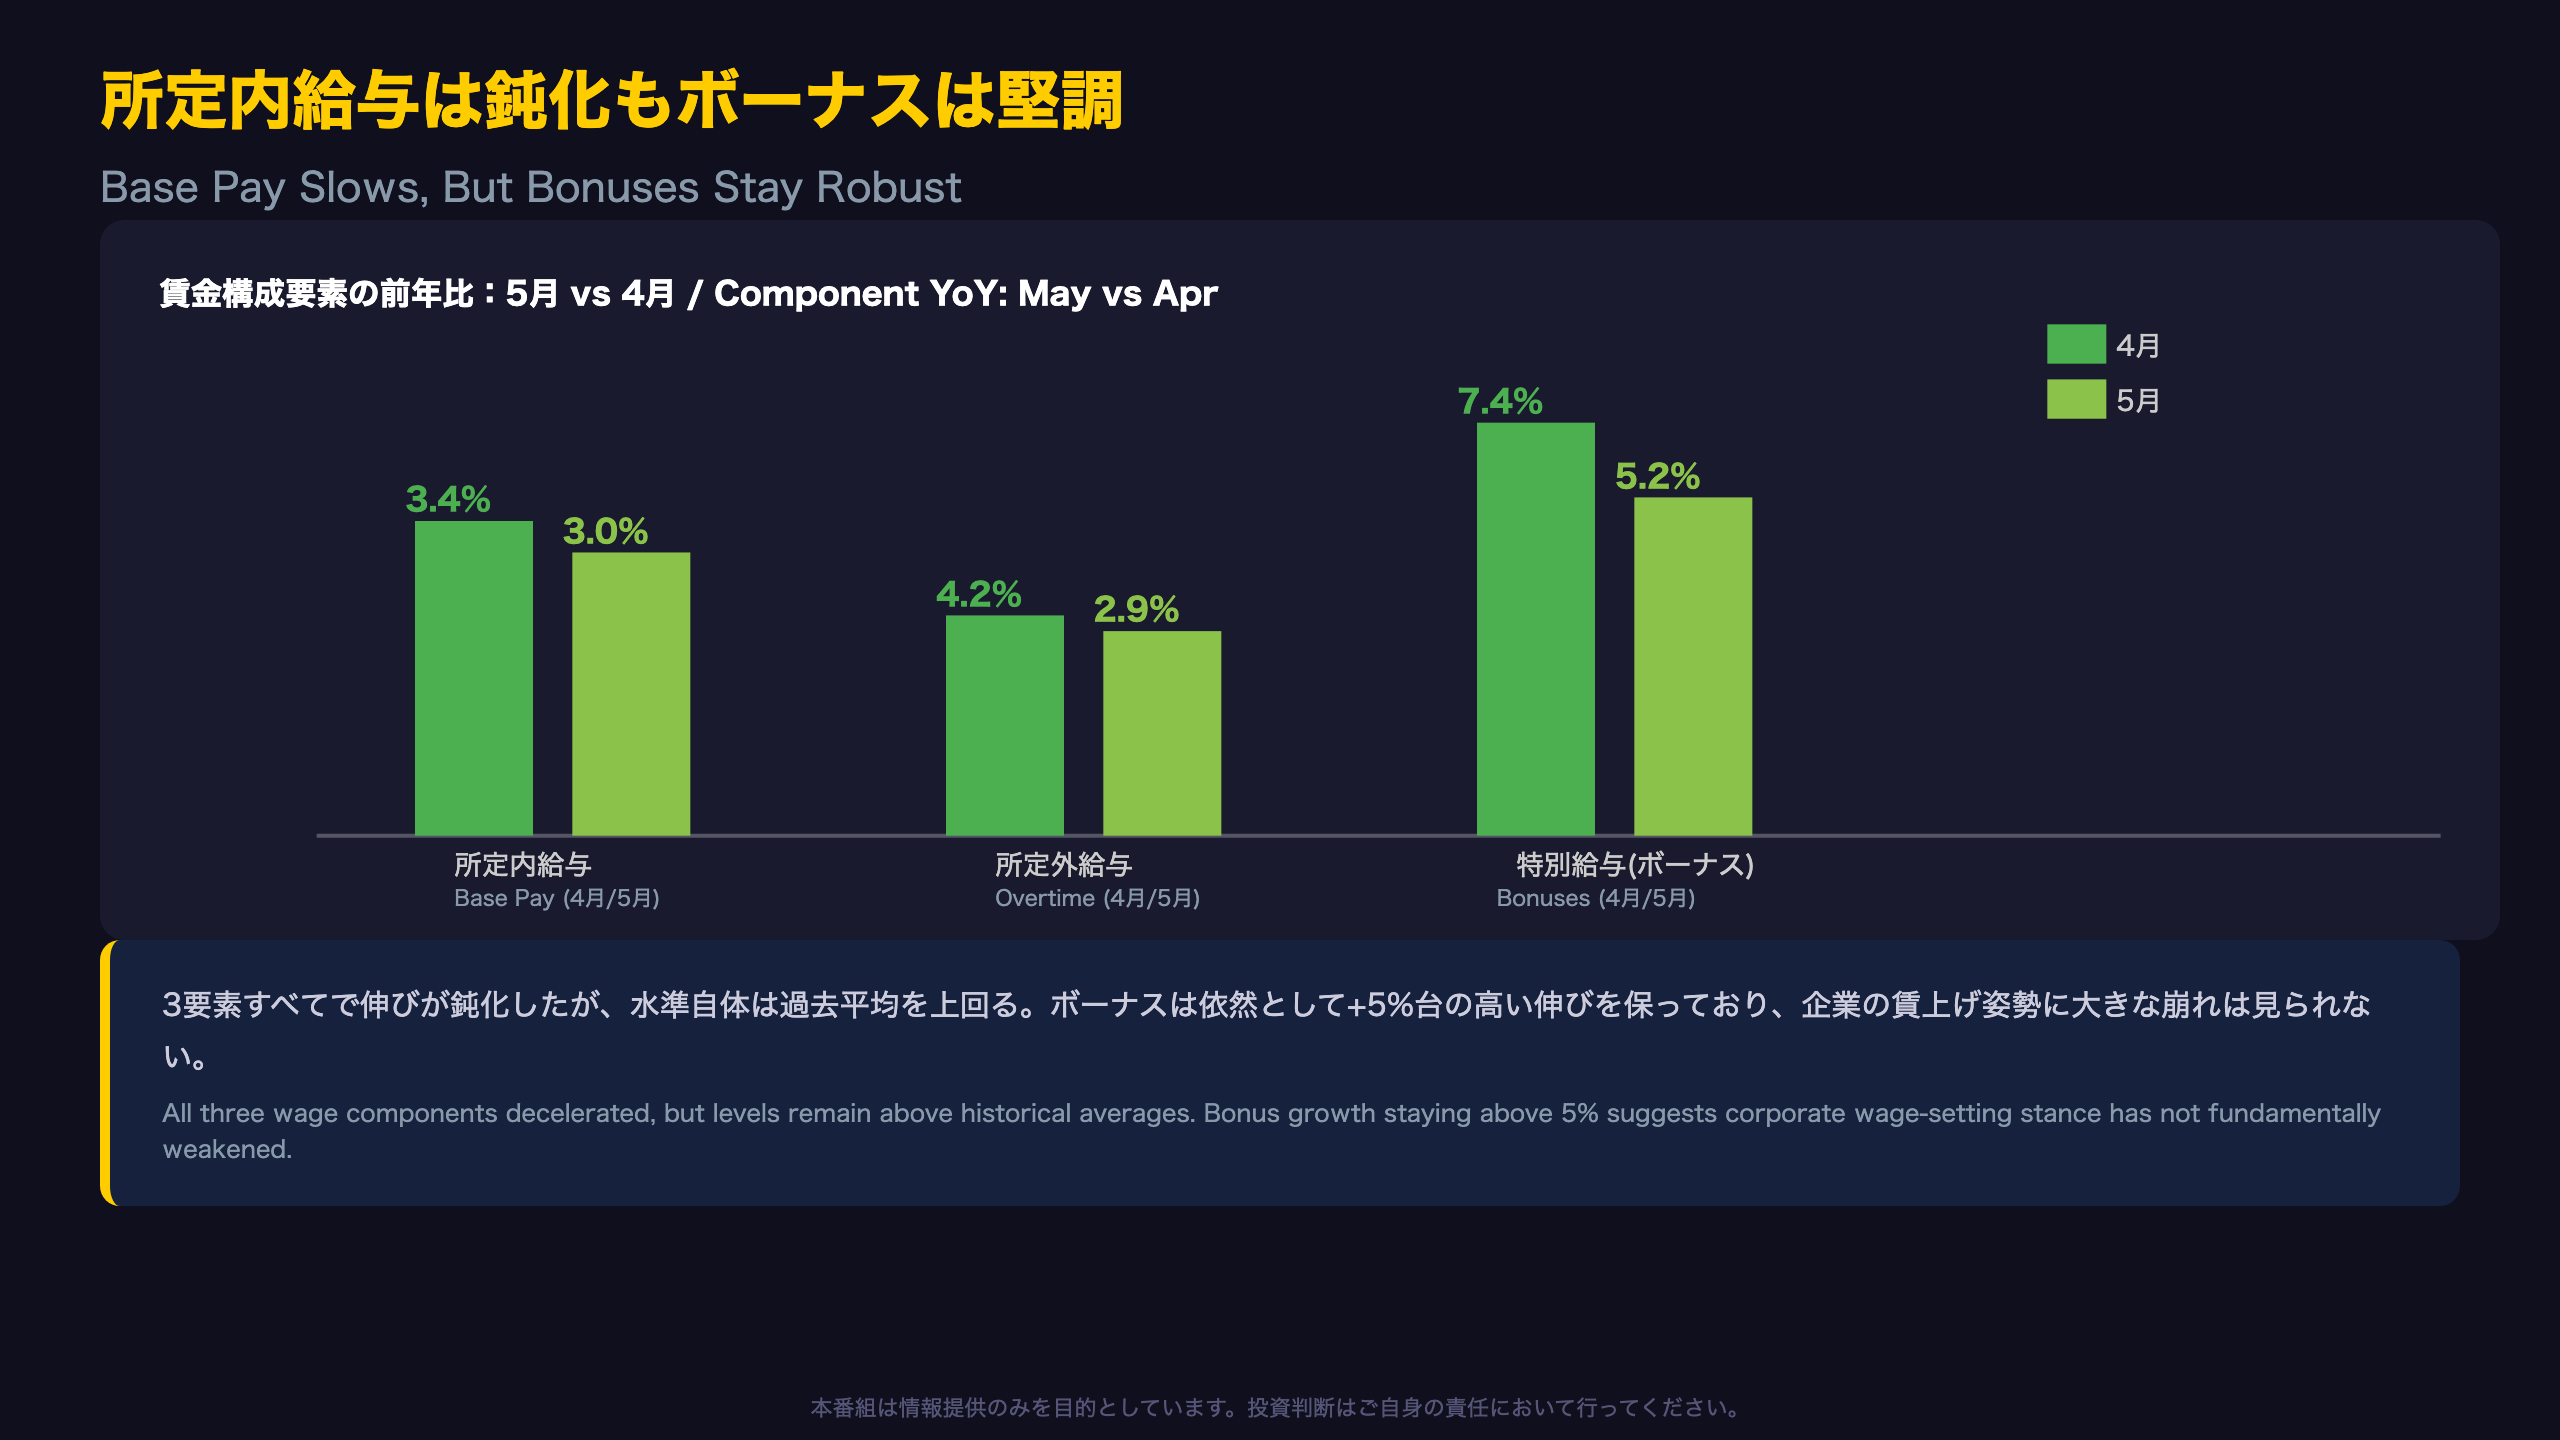
Japan’s “total cash earnings” figure is composed of three parts: scheduled earnings (base pay), overtime pay, and special payments (mostly bonuses). This month’s release showed deceleration across all three, though from historically elevated levels.
The Three Components
- Scheduled earnings (base pay): 275,942 yen, +3.0% YoY, down from April’s +3.4%
- Overtime pay: 20,003 yen, +2.9% YoY, down from April’s +4.2%
- Special payments (bonuses): 15,220 yen, +5.2% YoY, down sharply from April’s +7.4%
Why Base Pay Matters Most to the BOJ
Unlike overtime pay or bonuses, which are more volatile and cyclical, scheduled earnings (所定内給与) most directly reflect the outcome of Japan’s annual “Shunto” spring wage negotiations between unions and employers — the mechanism the BOJ watches most closely as evidence of a durable wage-price cycle. At +3.0%, base pay growth remains well above the 2024 and 2025 annual averages of roughly +2.0%, even after this month’s deceleration.
The “Same-Sample” Check
To strip out the effect of survey sample rotation, MHLW also publishes a “common establishment” (共通事業所) series using only businesses surveyed in both the current and prior year. On this basis, scheduled earnings rose 2.5% — slightly below the headline 3.0%, but still confirming a solid, broad-based wage increase trend independent of sample composition effects.
What to Watch Next
Whether base pay growth holds above the 3% threshold in June’s data (due August 5) will be a key signal for whether this deceleration is a blip or the start of a more durable slowdown, particularly as summer bonus payments — a seasonally volatile component — roll off their spring peak.
総実労働時間-3.8%の裏側:暦要因とパートの就業調整
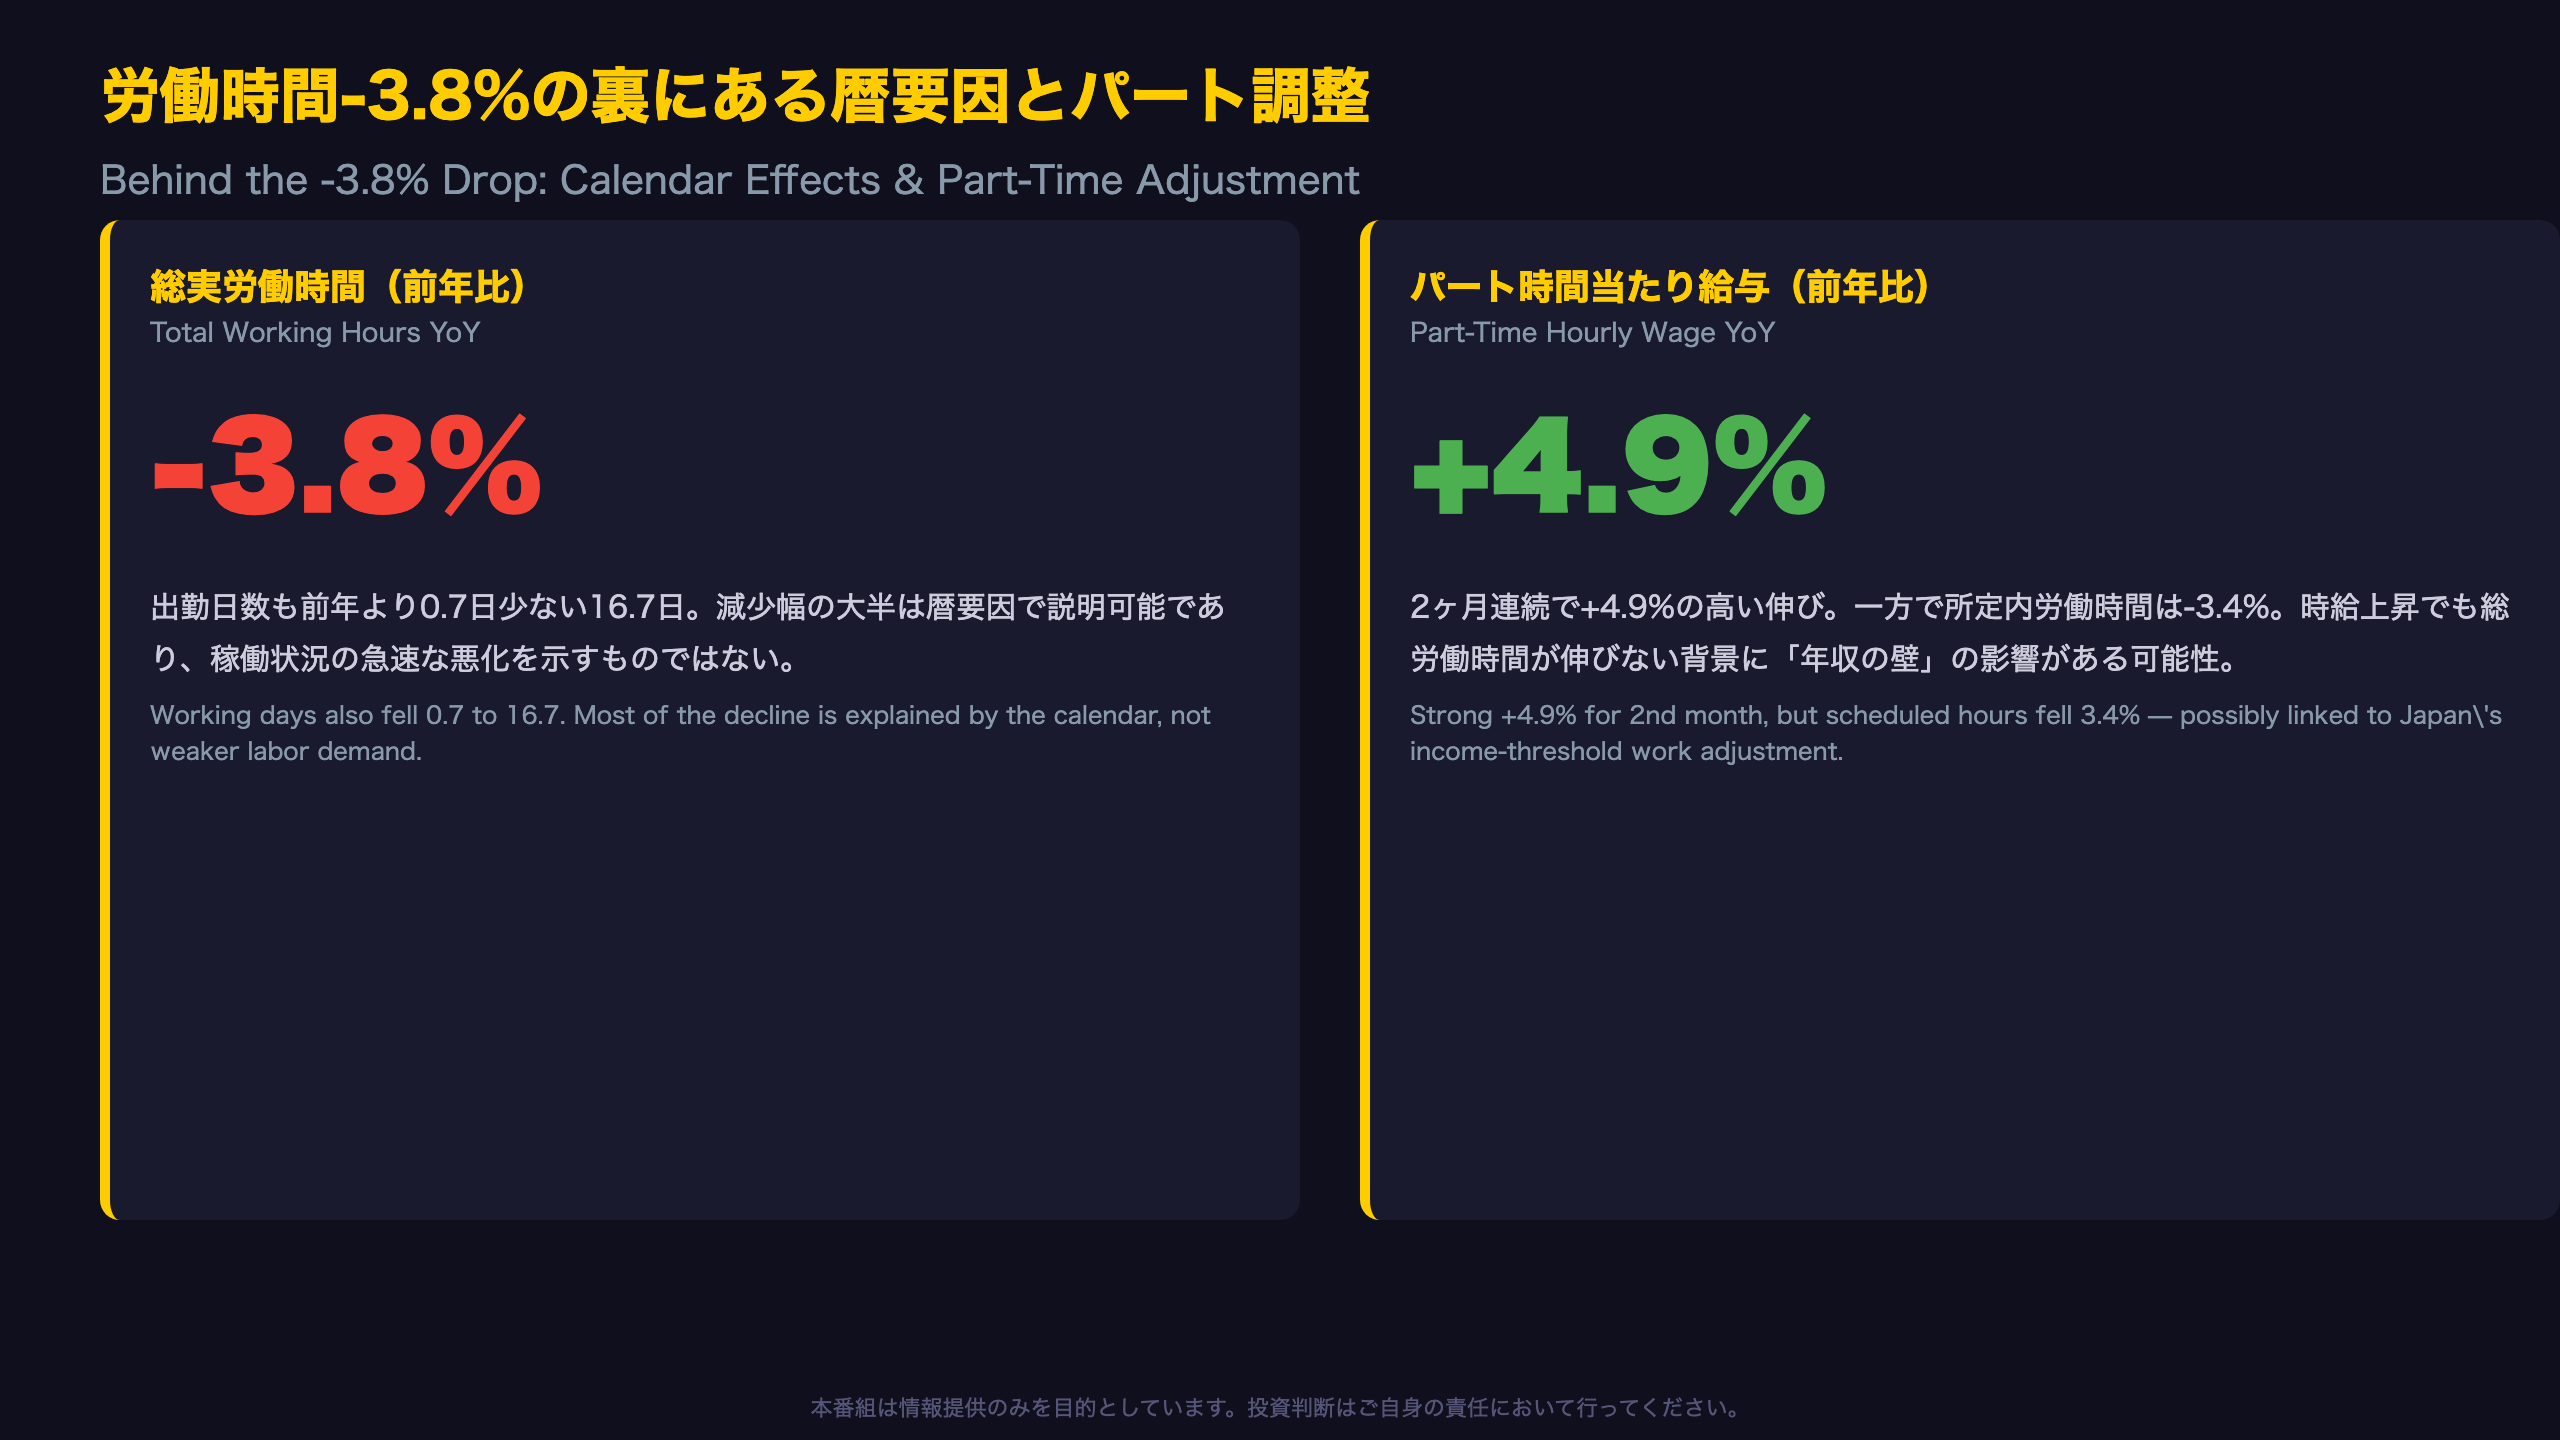
Unpacking the Sharp Drop in Working Hours
Total actual working hours fell 3.8% year-on-year in May — the steepest monthly decline in the recent data series. But taking this figure at face value as a sign of collapsing labor demand would be premature.
The Calendar Effect, Quantified
MHLW’s Table 2 shows that the number of working days in May fell to 16.7, down 0.7 days from a year earlier — a decline of roughly 4.0% in percentage terms. This is broadly consistent with the 3.8% drop in total working hours, suggesting that most of the decline reflects how holidays and weekdays fell on the calendar this year versus last, rather than a genuine deterioration in labor demand.
The Puzzle of Rising Hourly Pay but Falling Hours for Part-Timers
Part-time workers’ scheduled hours fell 3.4% year-on-year, even as their hourly wage (scheduled earnings divided by scheduled hours) rose to 1,452 yen, up 4.9% — matching April’s pace for a second consecutive month of strong gains.
This pattern — rising hourly wages but stagnant or shrinking total hours and pay — is consistent with (though not conclusively proven by) Japan’s well-known “income wall” phenomenon, where part-time workers deliberately limit hours to stay under thresholds tied to social insurance enrollment and spousal tax deductions (commonly cited around 1.03 million or 1.06 million yen annually). As minimum wages rise, workers may need fewer hours to hit the same annual income cap, resulting in a natural drop in hours worked. This should be read as one plausible contributing factor rather than a confirmed causal explanation, since it rests on a single month’s data.
Industry Variation
Healthcare and welfare saw an even steeper 4.5% drop in total hours, above the all-industry average, hinting that labor-shortage-prone sectors may be facing additional pressures beyond the calendar effect alone.
実質賃金、日本が主要国の中で存在感
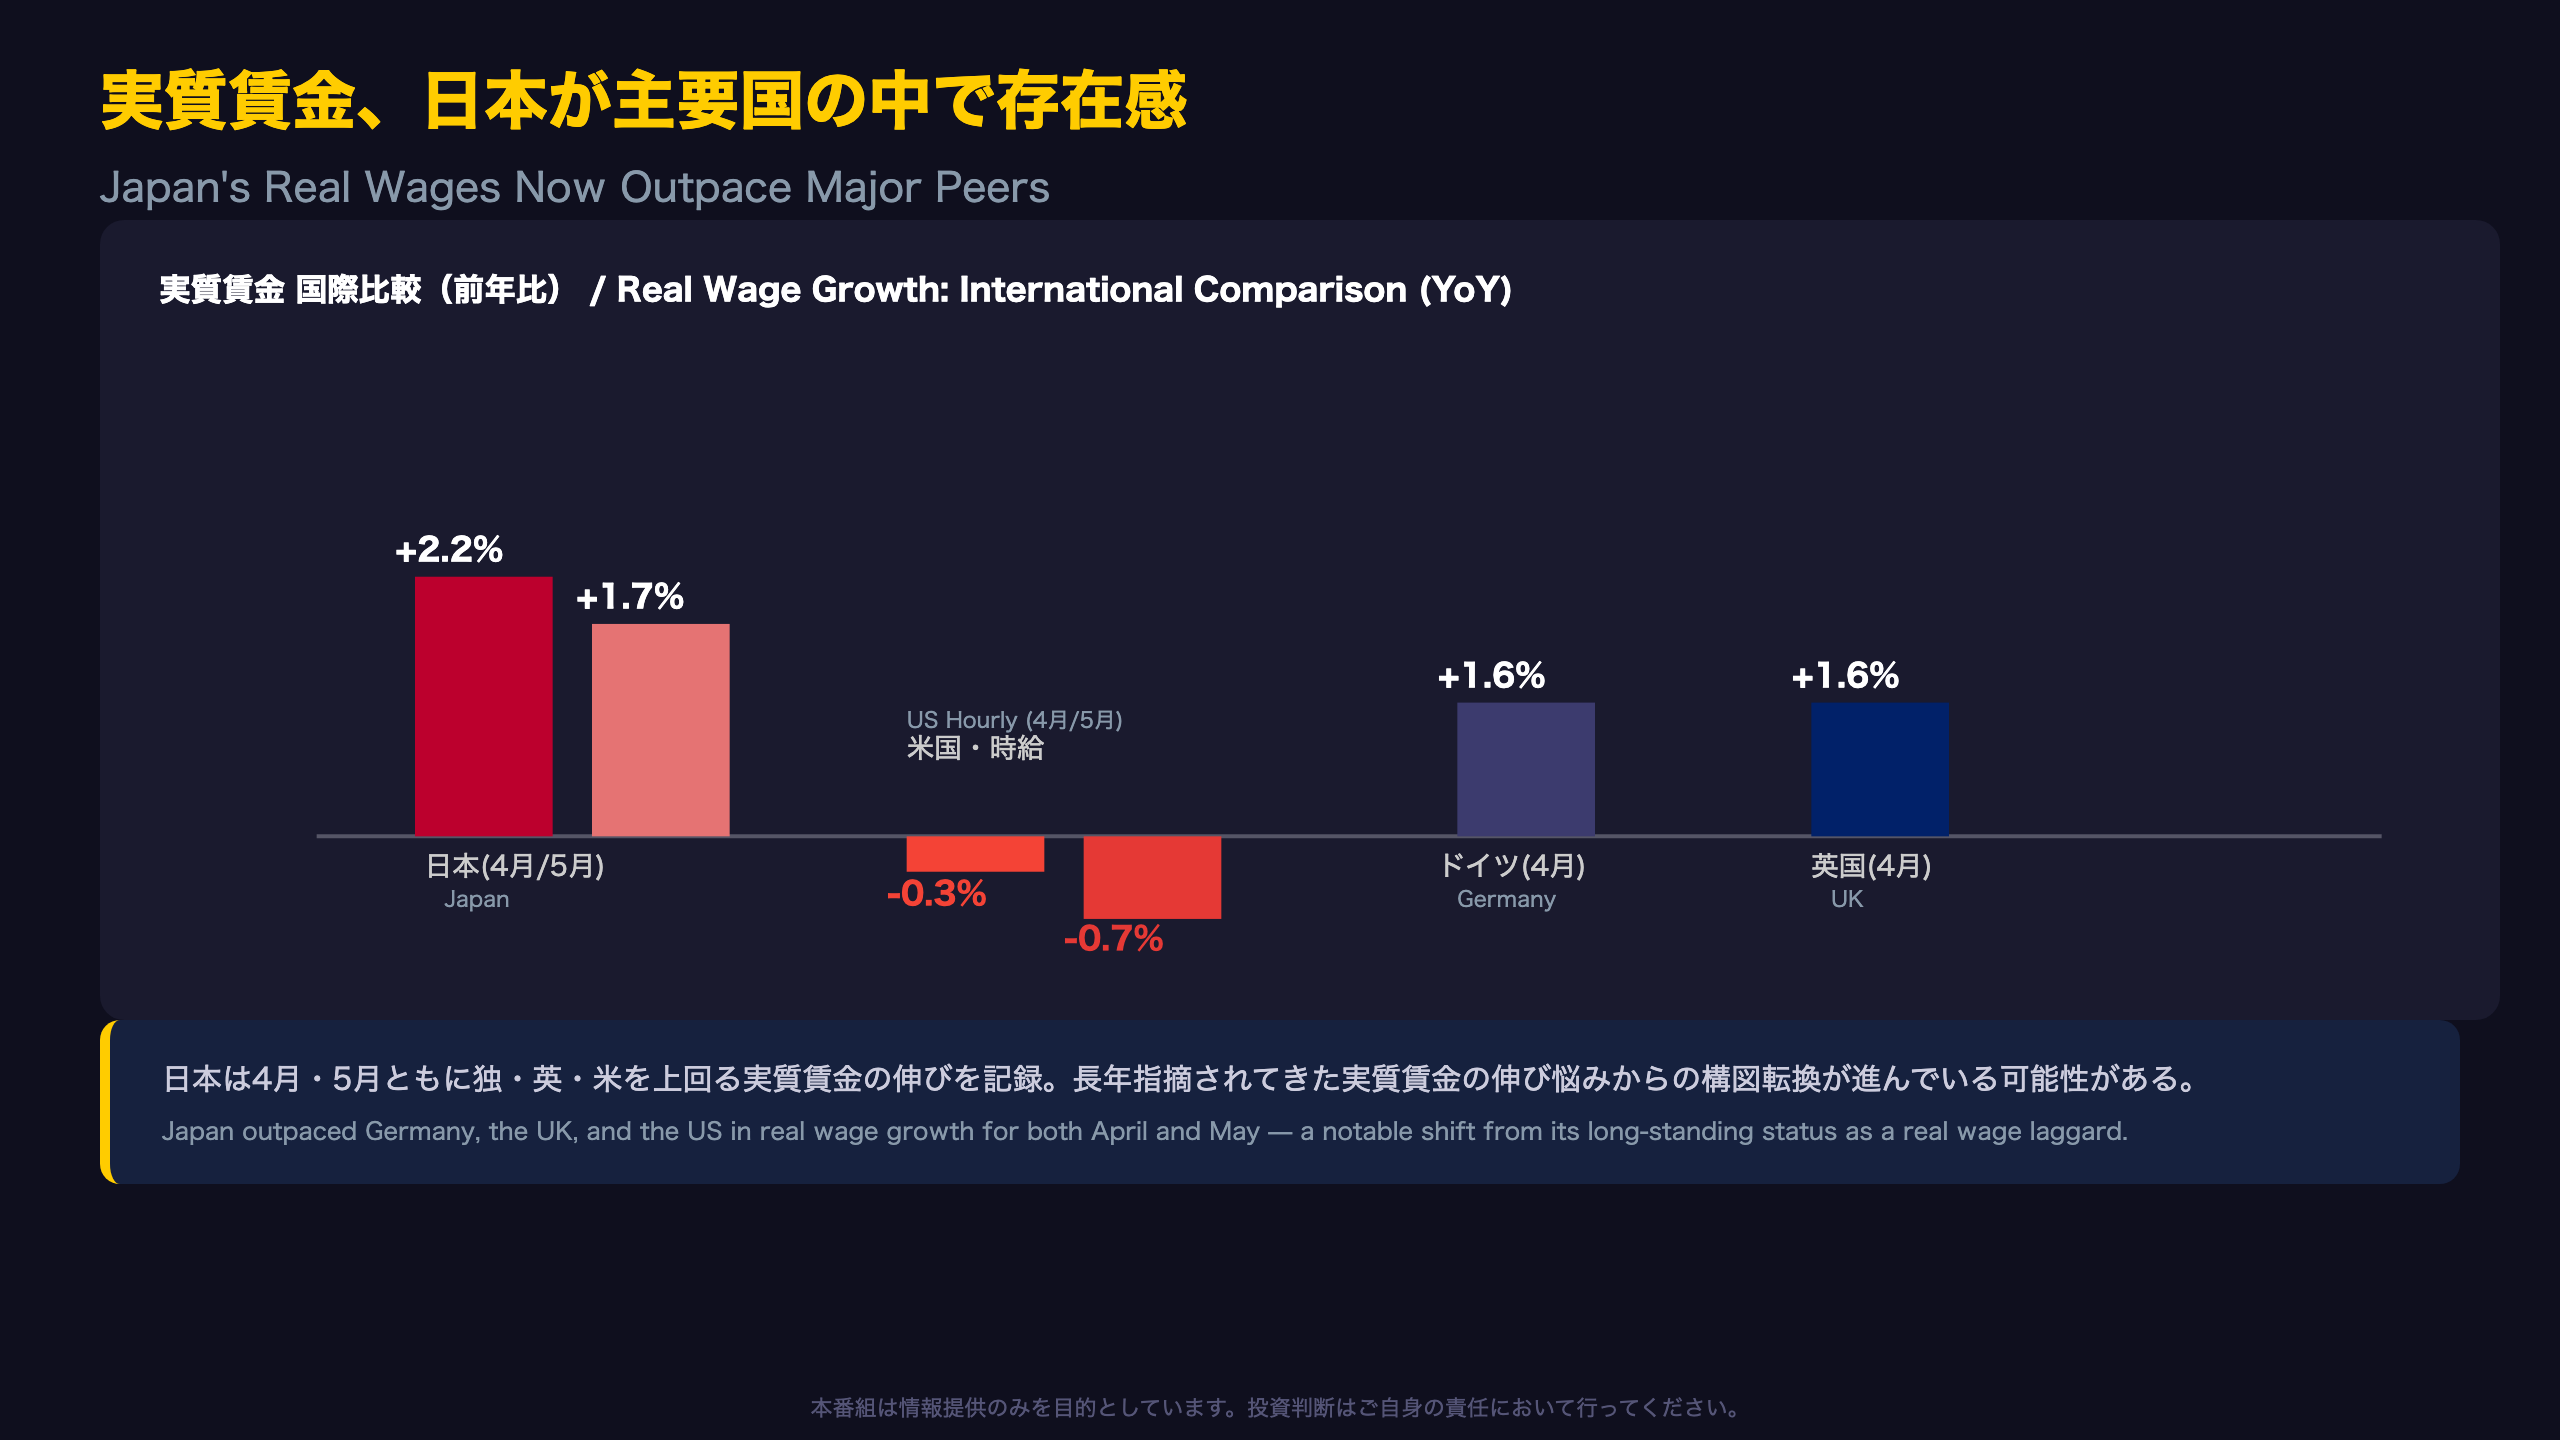
Japan Emerges as a Real Wage “Outperformer”
MHLW’s Table 6, “Real Wages of Major Countries Based on Official Publications,” offers a fascinating shift in the global wage picture, compiling headline figures released by each country’s own statistical agency.
Latest International Comparison (YoY)
- Japan: +2.2% (April) → +1.7% (May)
- United States (hourly): -0.3% (April) → -0.7% (May)
- United States (weekly): -0.2% (April) → -0.4% (May)
- United Kingdom: +1.6% (April, May not yet published)
- Germany: +1.6% (April, May not yet published)
Historical Context: Japan Was the Laggard
On an annual basis, Japan’s real wages (headline CPI basis) were -0.5% in 2022, -2.0% in 2023, roughly flat at 0.0% in 2024, and -0.8% in 2025 — largely negative or flat throughout, in stark contrast to the modestly positive trajectories of the US, UK, and Germany over the same period.
Why the Reversal?
Japan’s 2026 improvement reflects two forces working together: stronger pass-through from this year’s Shunto wage negotiations, and a gradual moderation in domestic CPI inflation since late 2025. The US, meanwhile, has swung into negative real wage territory — commonly attributed by market commentators to renewed inflationary pressures (tariff policy is often cited), though this report’s source data does not include detailed US CPI drivers, so no definitive causal claim can be made here.
A Methodological Caveat
Cross-country real wage comparisons should be read with caution, as each country’s headline figure uses different CPI baskets, seasonal adjustment methods, and wage definitions (hourly vs. weekly vs. monthly). Japan’s figure is calculated by deflating its nominal cash earnings index by the headline (“overall”) CPI, while the US, UK, and German figures are direct quotes from each country’s own statistical releases — not a like-for-like methodology.
日銀の利上げ判断への示唆
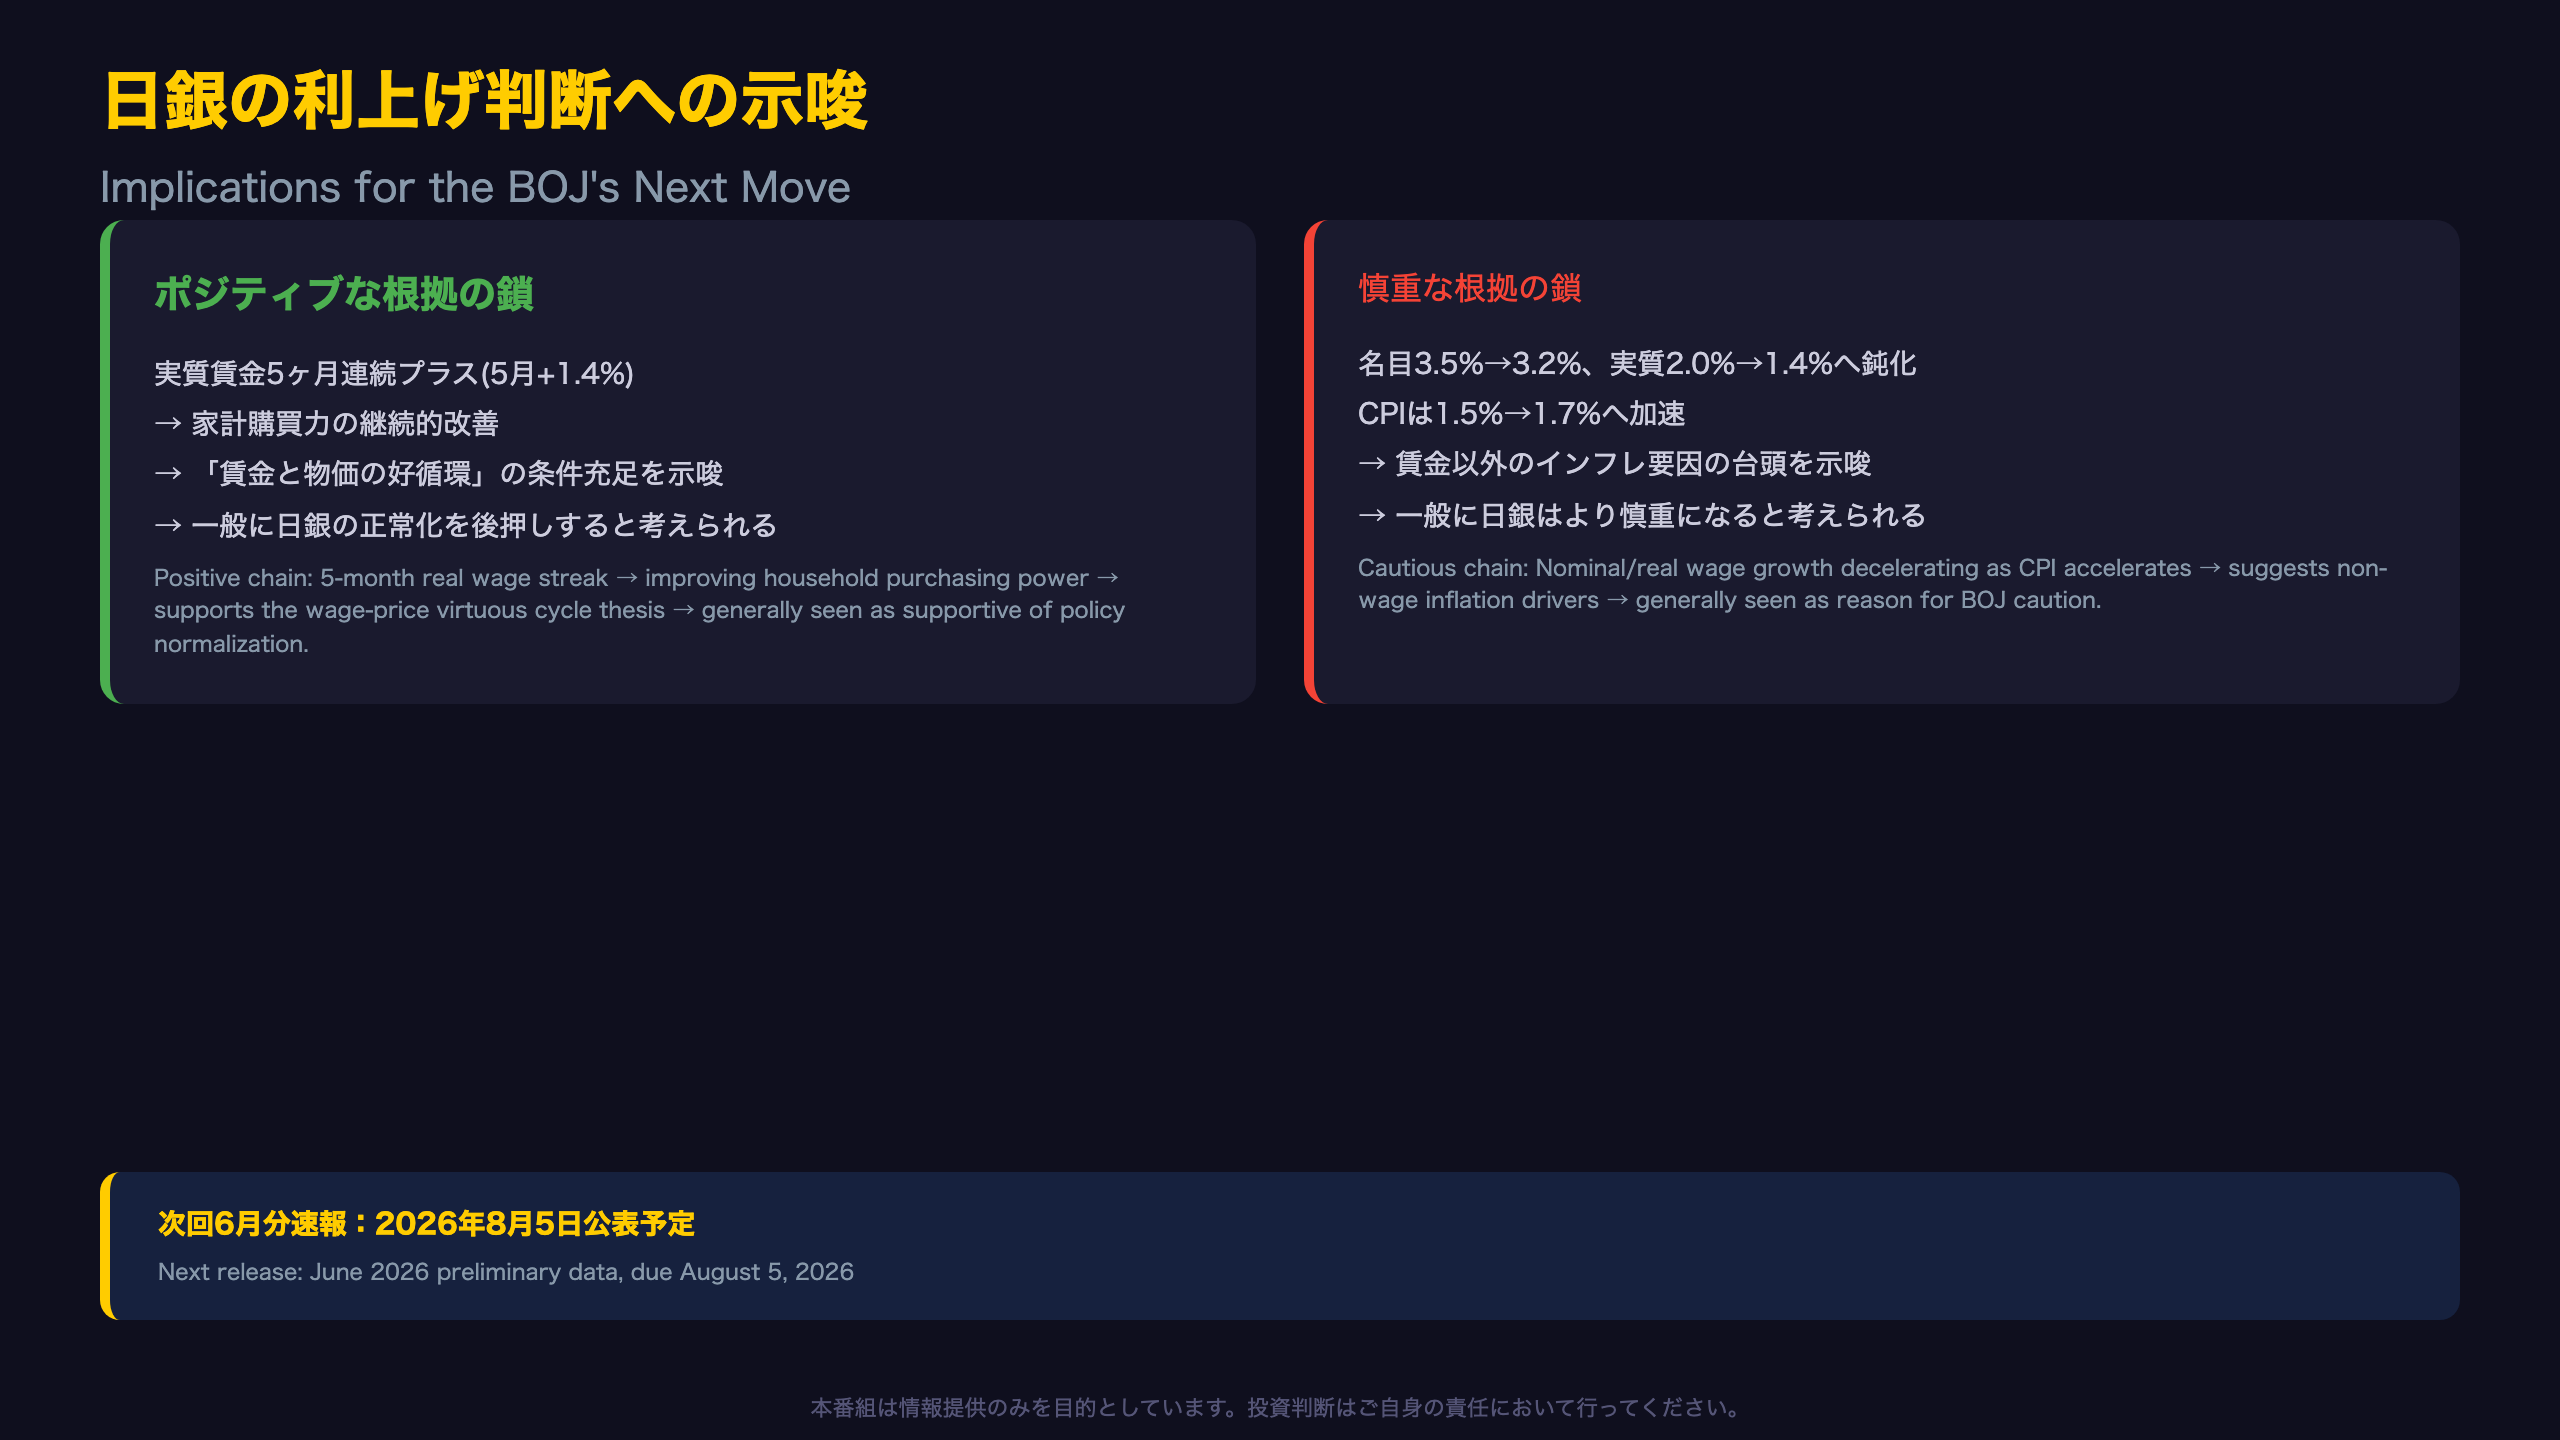
Tracing the Chain of Reasoning for Market Implications
The Bullish Chain
“Real wages have risen for five consecutive months through May 2026 (+1.4%)” → “This signals a sustained improvement in household purchasing power, satisfying one of the preconditions the BOJ has repeatedly cited for its ‘virtuous cycle’ between wages and prices” → “It is generally believed that confirmation of this virtuous cycle makes it easier for the BOJ to proceed with further policy normalization (additional rate hikes), though this single data release alone cannot pin down the timing of any such move.”
The Cautious Chain
“Nominal wage growth decelerated from 3.5% in April to 3.2% in May, and real wage growth slowed from 2.0% to 1.4%, even as core CPI (ex-imputed rent) accelerated from 1.5% to 1.7%” → “This suggests that factors other than wage-driven demand — such as import prices or energy costs — may increasingly be driving inflation rather than wages themselves” → “It is generally believed that persistent real wage deceleration would make the BOJ more cautious about further tightening, to avoid squeezing household budgets, though this too cannot be confirmed from a single month’s data.”
Transmission Channels to FX and Rates Markets
If the positive real wage trend holds, it would likely support resilient consumer spending and reinforce expectations of BOJ policy normalization — a dynamic that could, in theory, support higher JGB yields and yen appreciation. Conversely, a continuation of the deceleration trend could reinforce dovish expectations, potentially weighing on the yen and keeping rates lower for longer. These are general macroeconomic mechanisms, however, and this single data release cannot definitively determine the direction of FX or rates markets on its own.
What Comes Next
The next preliminary release, covering June 2026 data, is scheduled for August 5, 2026. Beyond that, the outcome of the 2027 Shunto spring wage negotiations will be the single biggest determinant of whether this five-month positive streak proves to be a temporary phenomenon or the start of a genuine structural shift in Japan’s wage-price dynamics — a question central to the BOJ’s medium-term policy path.
Disclaimer: This article is for informational purposes only. All investment decisions are made solely at your own risk.







