📺 Watch the Full Video Analysis
This article was automatically generated by the NFC Market Live AI analysis system. (Updated: 2026-08-17 13:59 JST)
📄 Primary Source
NFC Market Live
https://www.meti.go.jp/statistics/tyo/iip/result/pdf/press/b2020_202606kj.pdf, https://www.meti.go.jp/statistics/tyo/iip/result/pdf/press/b2020_202606nj.pdf
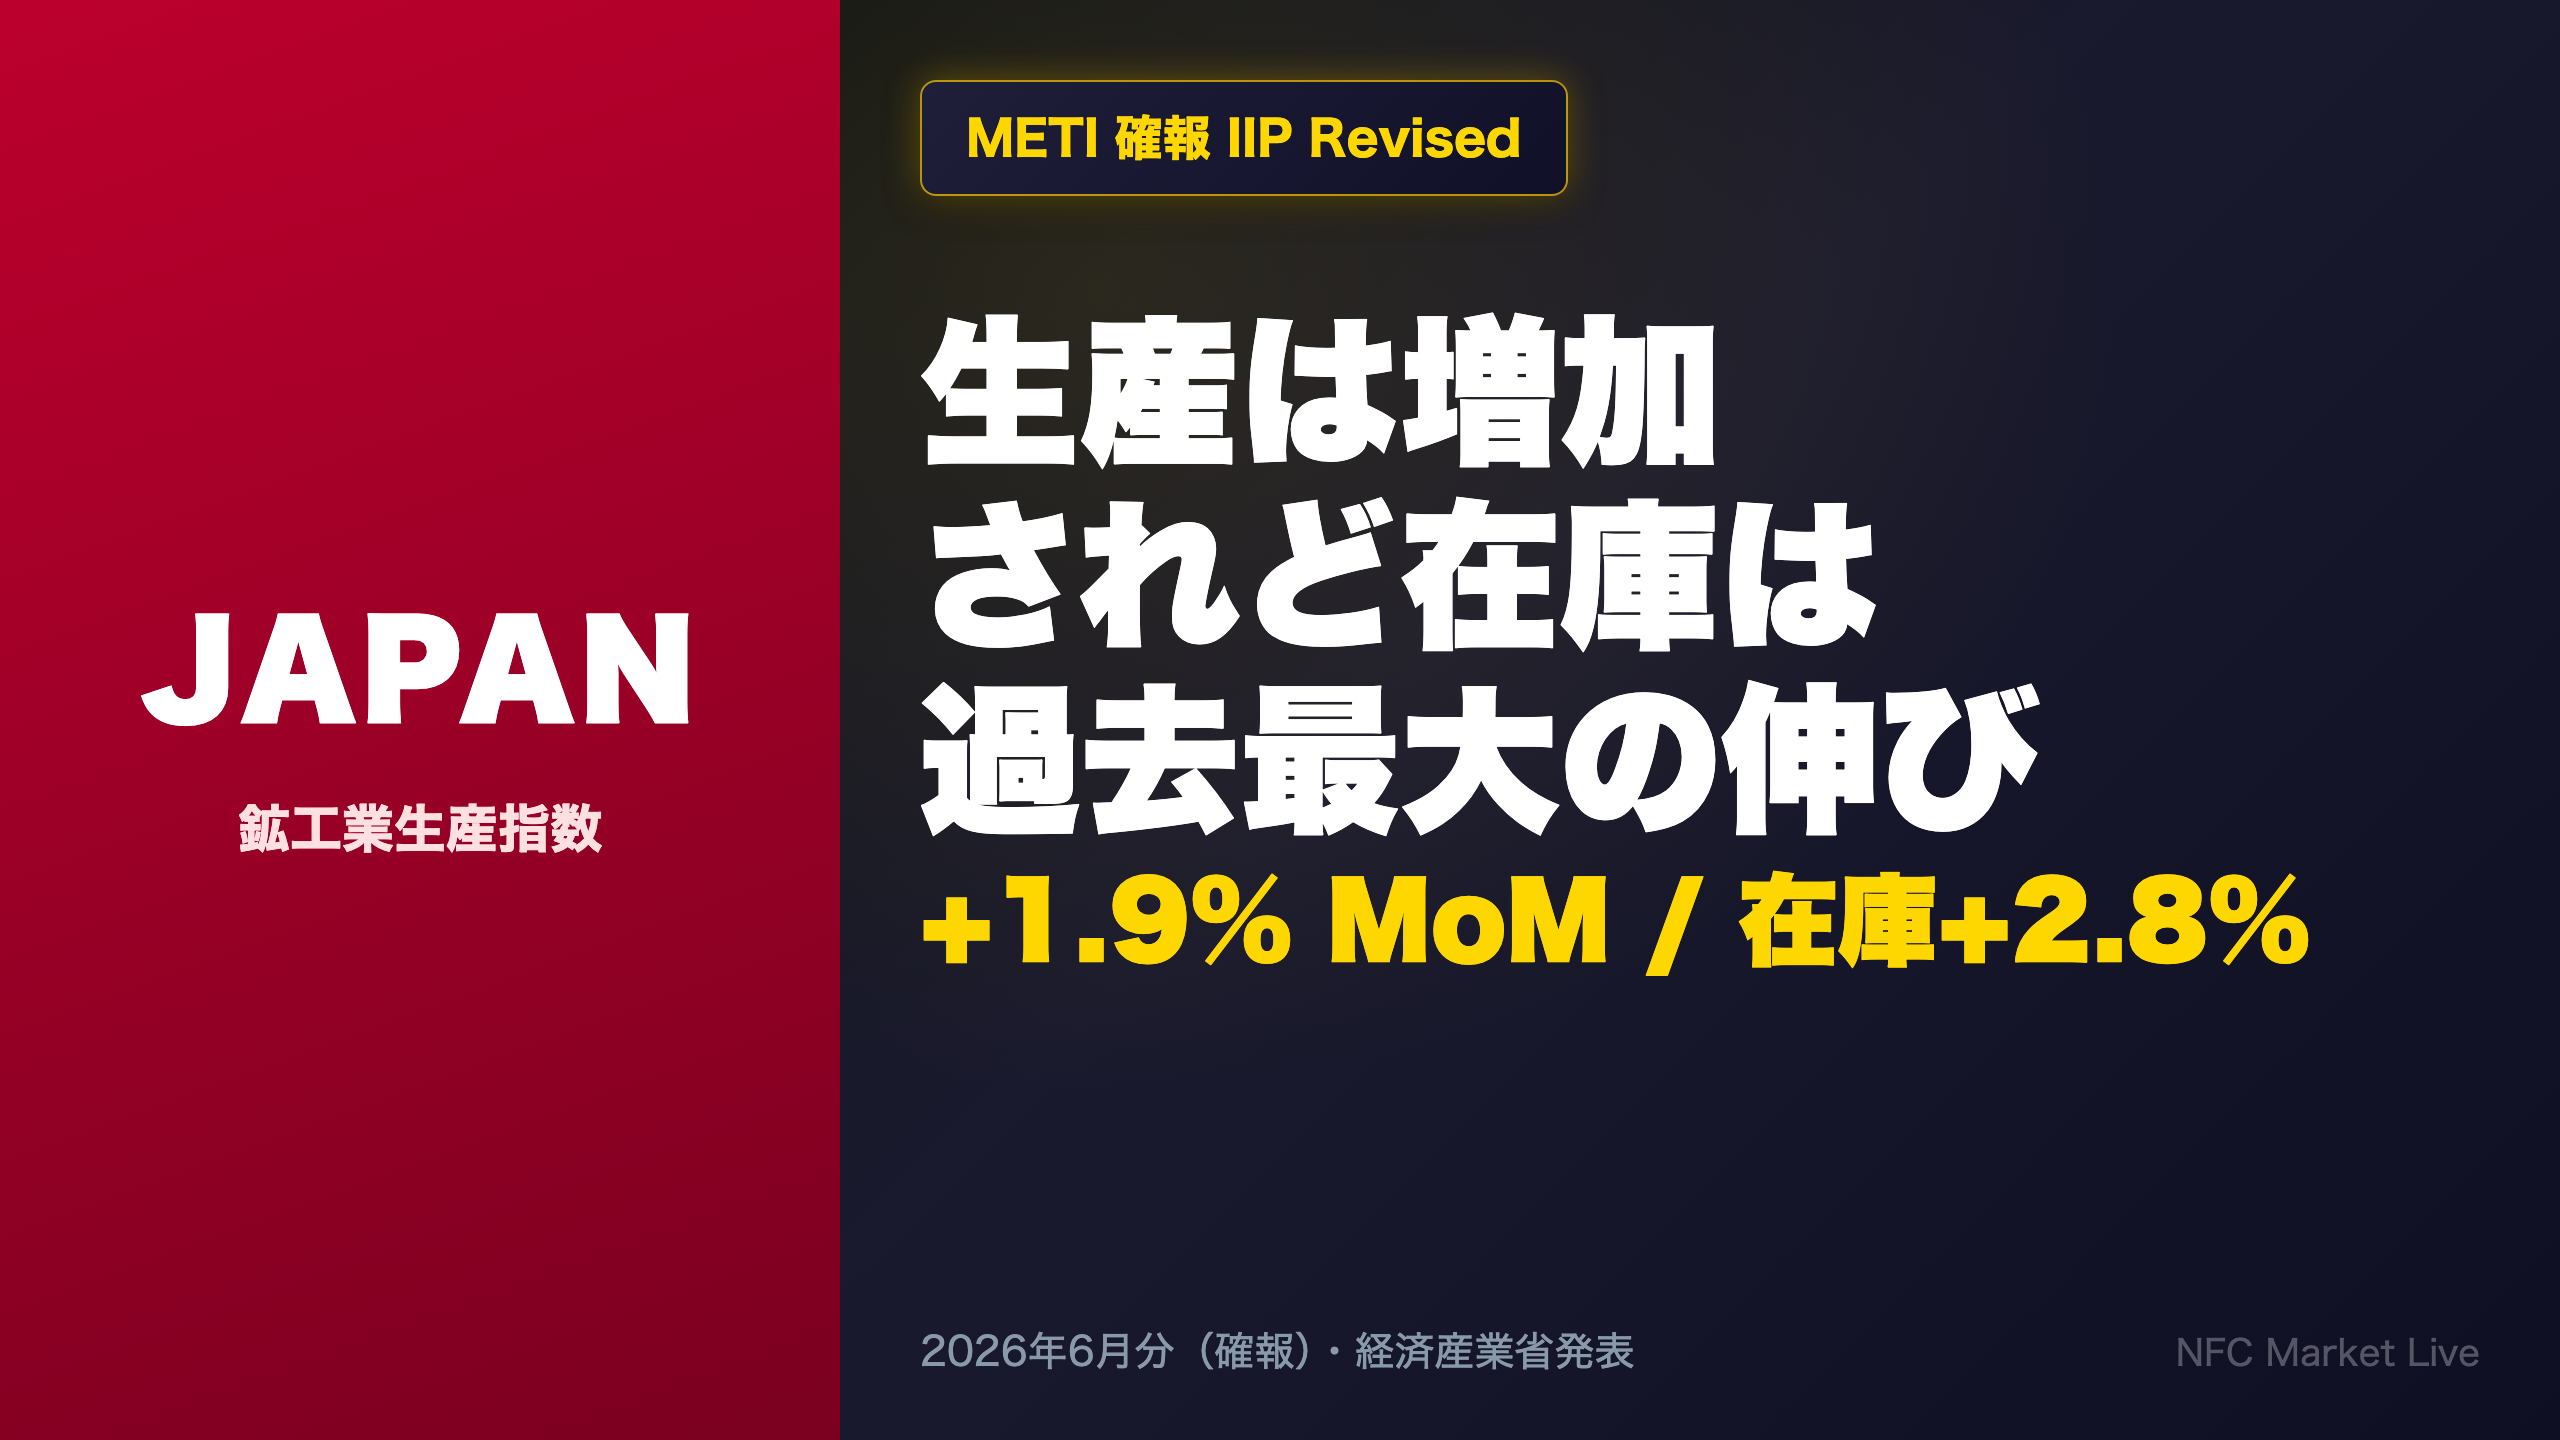
A deep dive into Japan’s June 2026 Indices of Industrial Production (Revised), released by METI.
📊 Output rose 1.9% MoM, marking a third straight monthly gain, revised up from the preliminary print.
📈 The driver: production machinery (+7.7%, led by semiconductor equipment) and electrical/info-communication machinery (+5.5%).
⚠️ But shipments fell for the first time in 3 months, while inventories jumped 2.8% MoM — the largest gain since the index’s 2020 base began.
💡 Autos and food show signs of unintended inventory buildup, even as capacity keeps shrinking for a 28th straight month.
We break down what’s really happening beneath the headline.
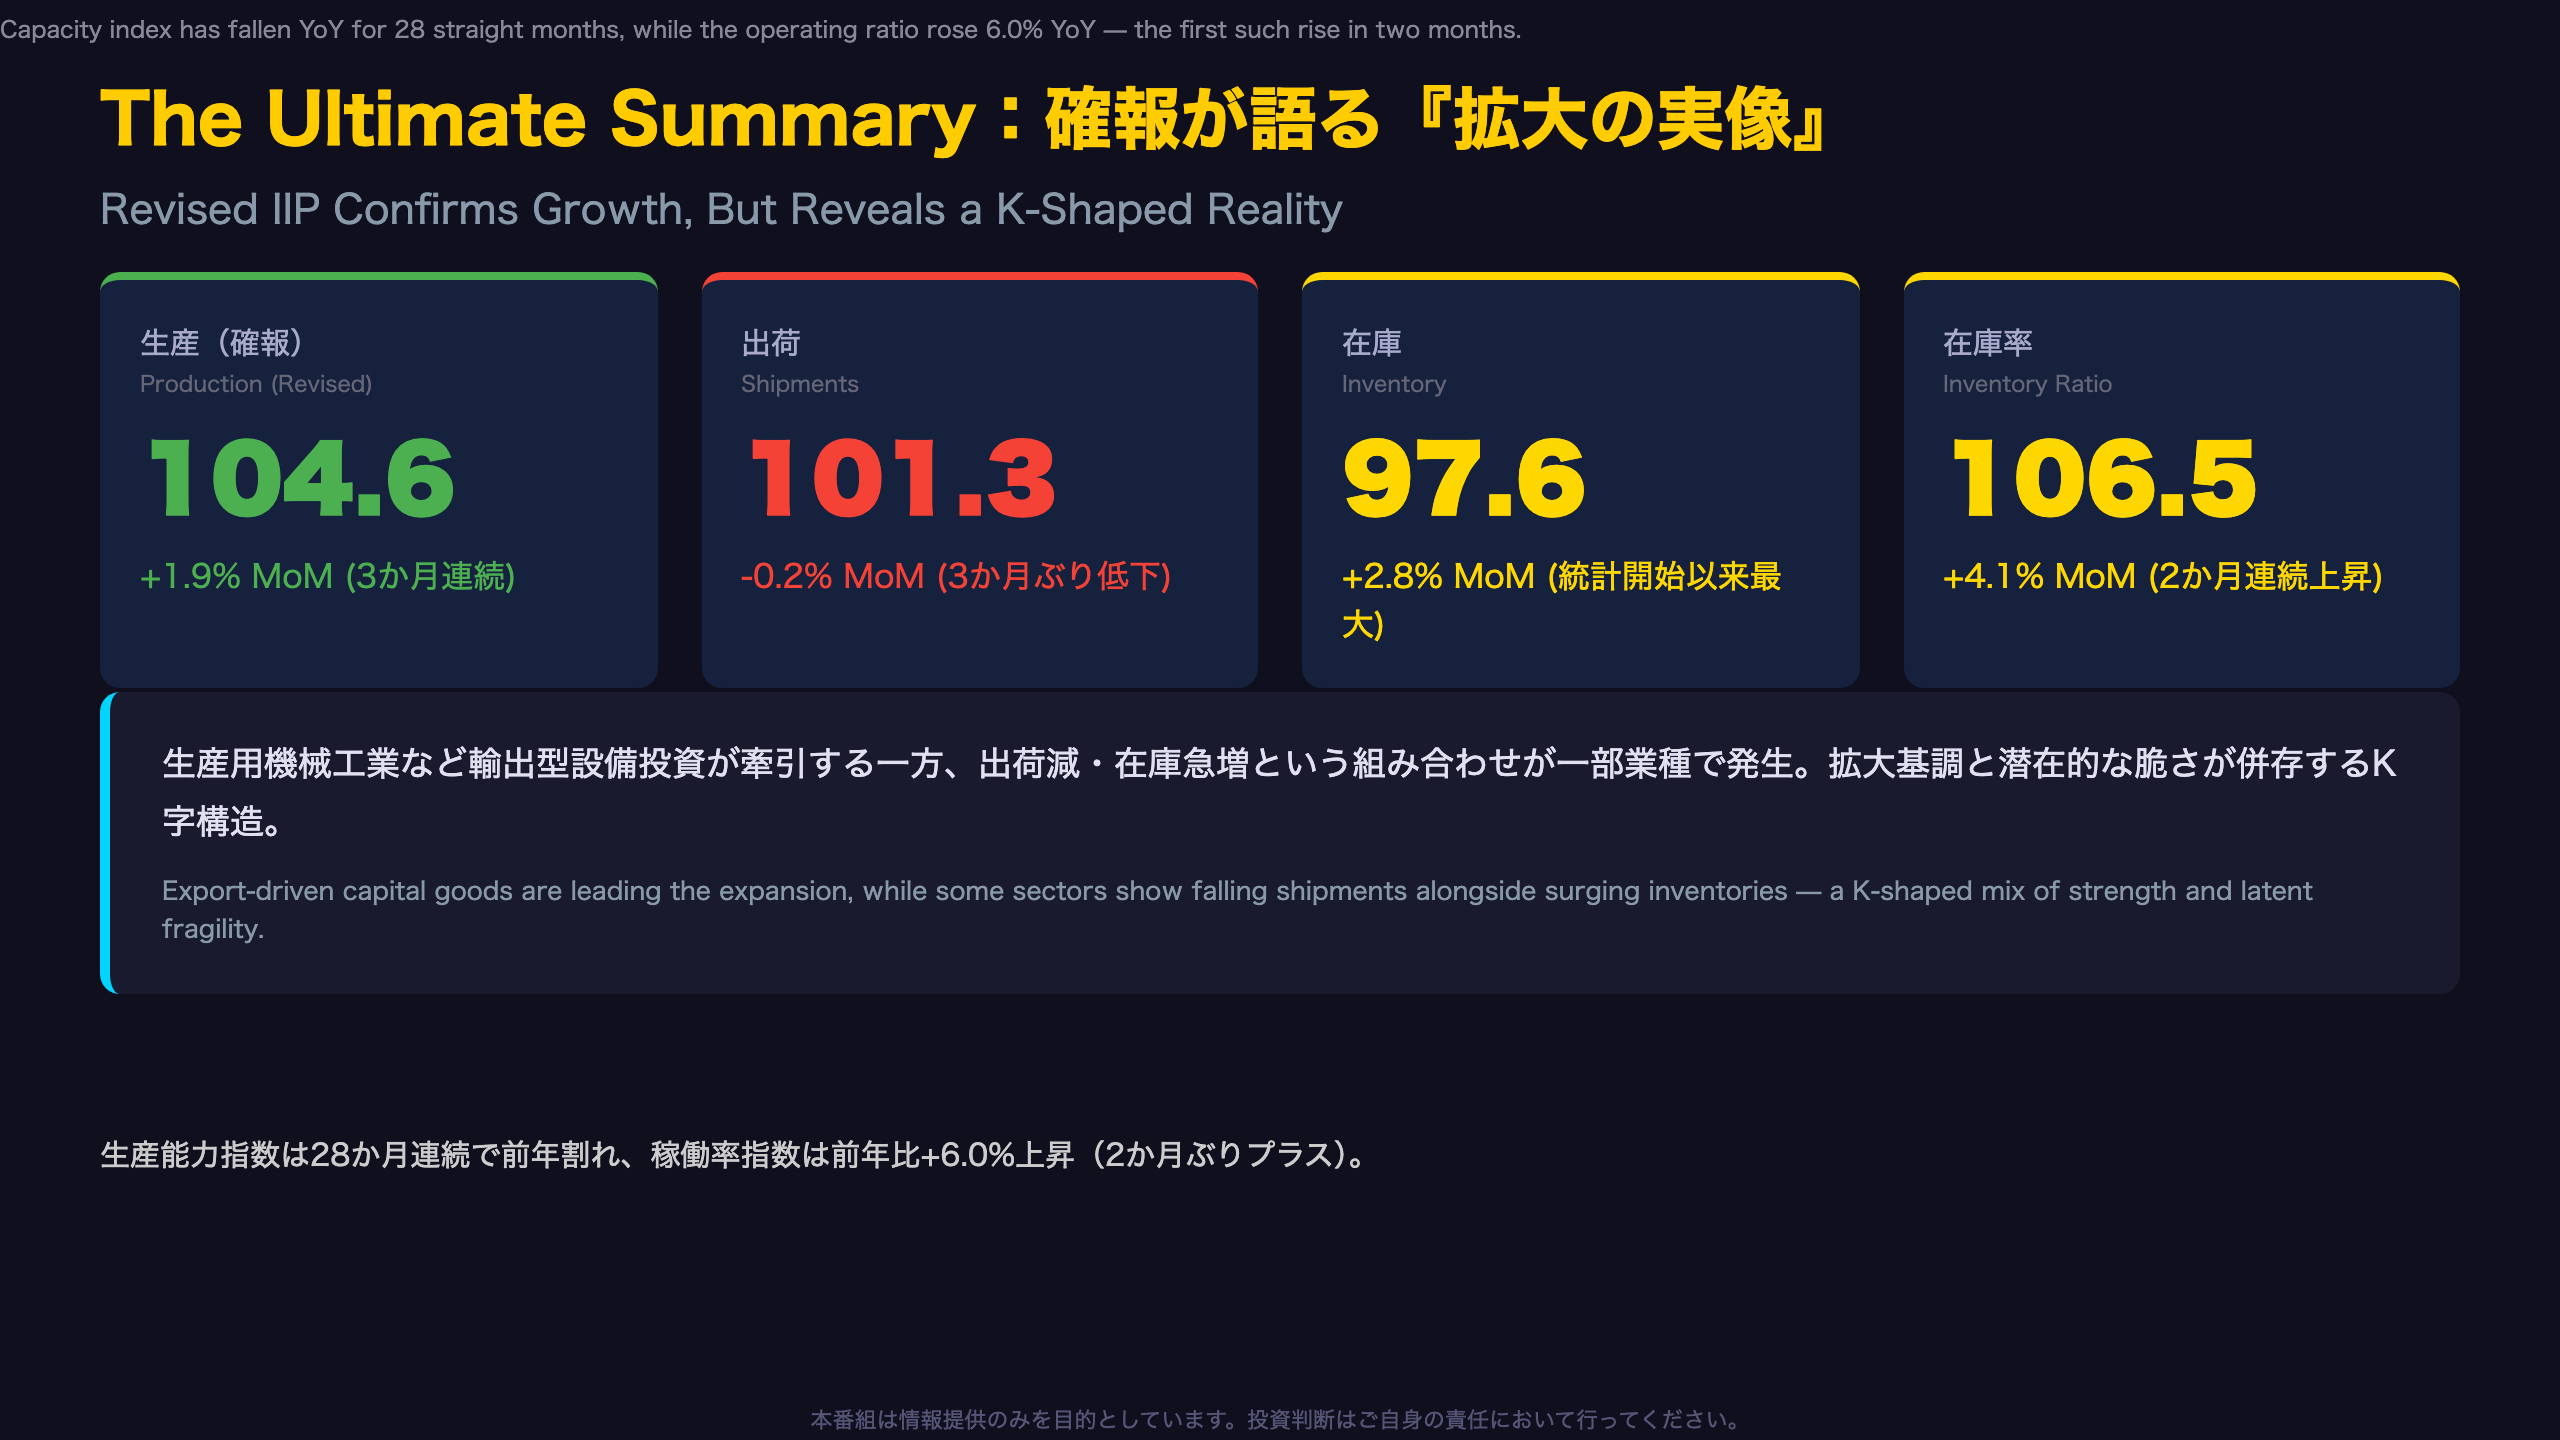
The Ultimate Summary:確報が語る『拡大の実像』
What the Revision Rewrote
Japan’s Ministry of Economy, Trade and Industry (METI) publishes the Indices of Industrial Production (IIP) twice for each reference month: a preliminary release about a month after the reference month, followed by a revised (“Kakuho”) release roughly a month later that incorporates fuller survey responses. For June 2026, the headline production index was revised from 103.9 (preliminary) to 104.6, with the +1.9% month-on-month gain marking a third consecutive increase under METI’s standing assessment that “production is moving sideways with fluctuations.”
METI explicitly attributed the upward revision to pharmaceuticals and spirits — sub-components of the foods and tobacco industry that were undercounted in the preliminary print. Shipments, inventories, and the inventory ratio were all revised higher as well, but the inventory print stands out: +2.8% month-on-month is the largest single-month gain recorded since this index series was rebased to 2020=100.
For international readers, IIP is Japan’s closest analogue to the US Federal Reserve’s Industrial Production Index or the ISM Manufacturing PMI’s output component, though IIP is a physical-volume index rather than a diffusion index. Unlike a simple growth print, the combination here — rising output, falling shipments, and record inventory growth — is genuinely ambiguous, and its true meaning depends heavily on which industries are driving each metric, which we unpack in the following slides.
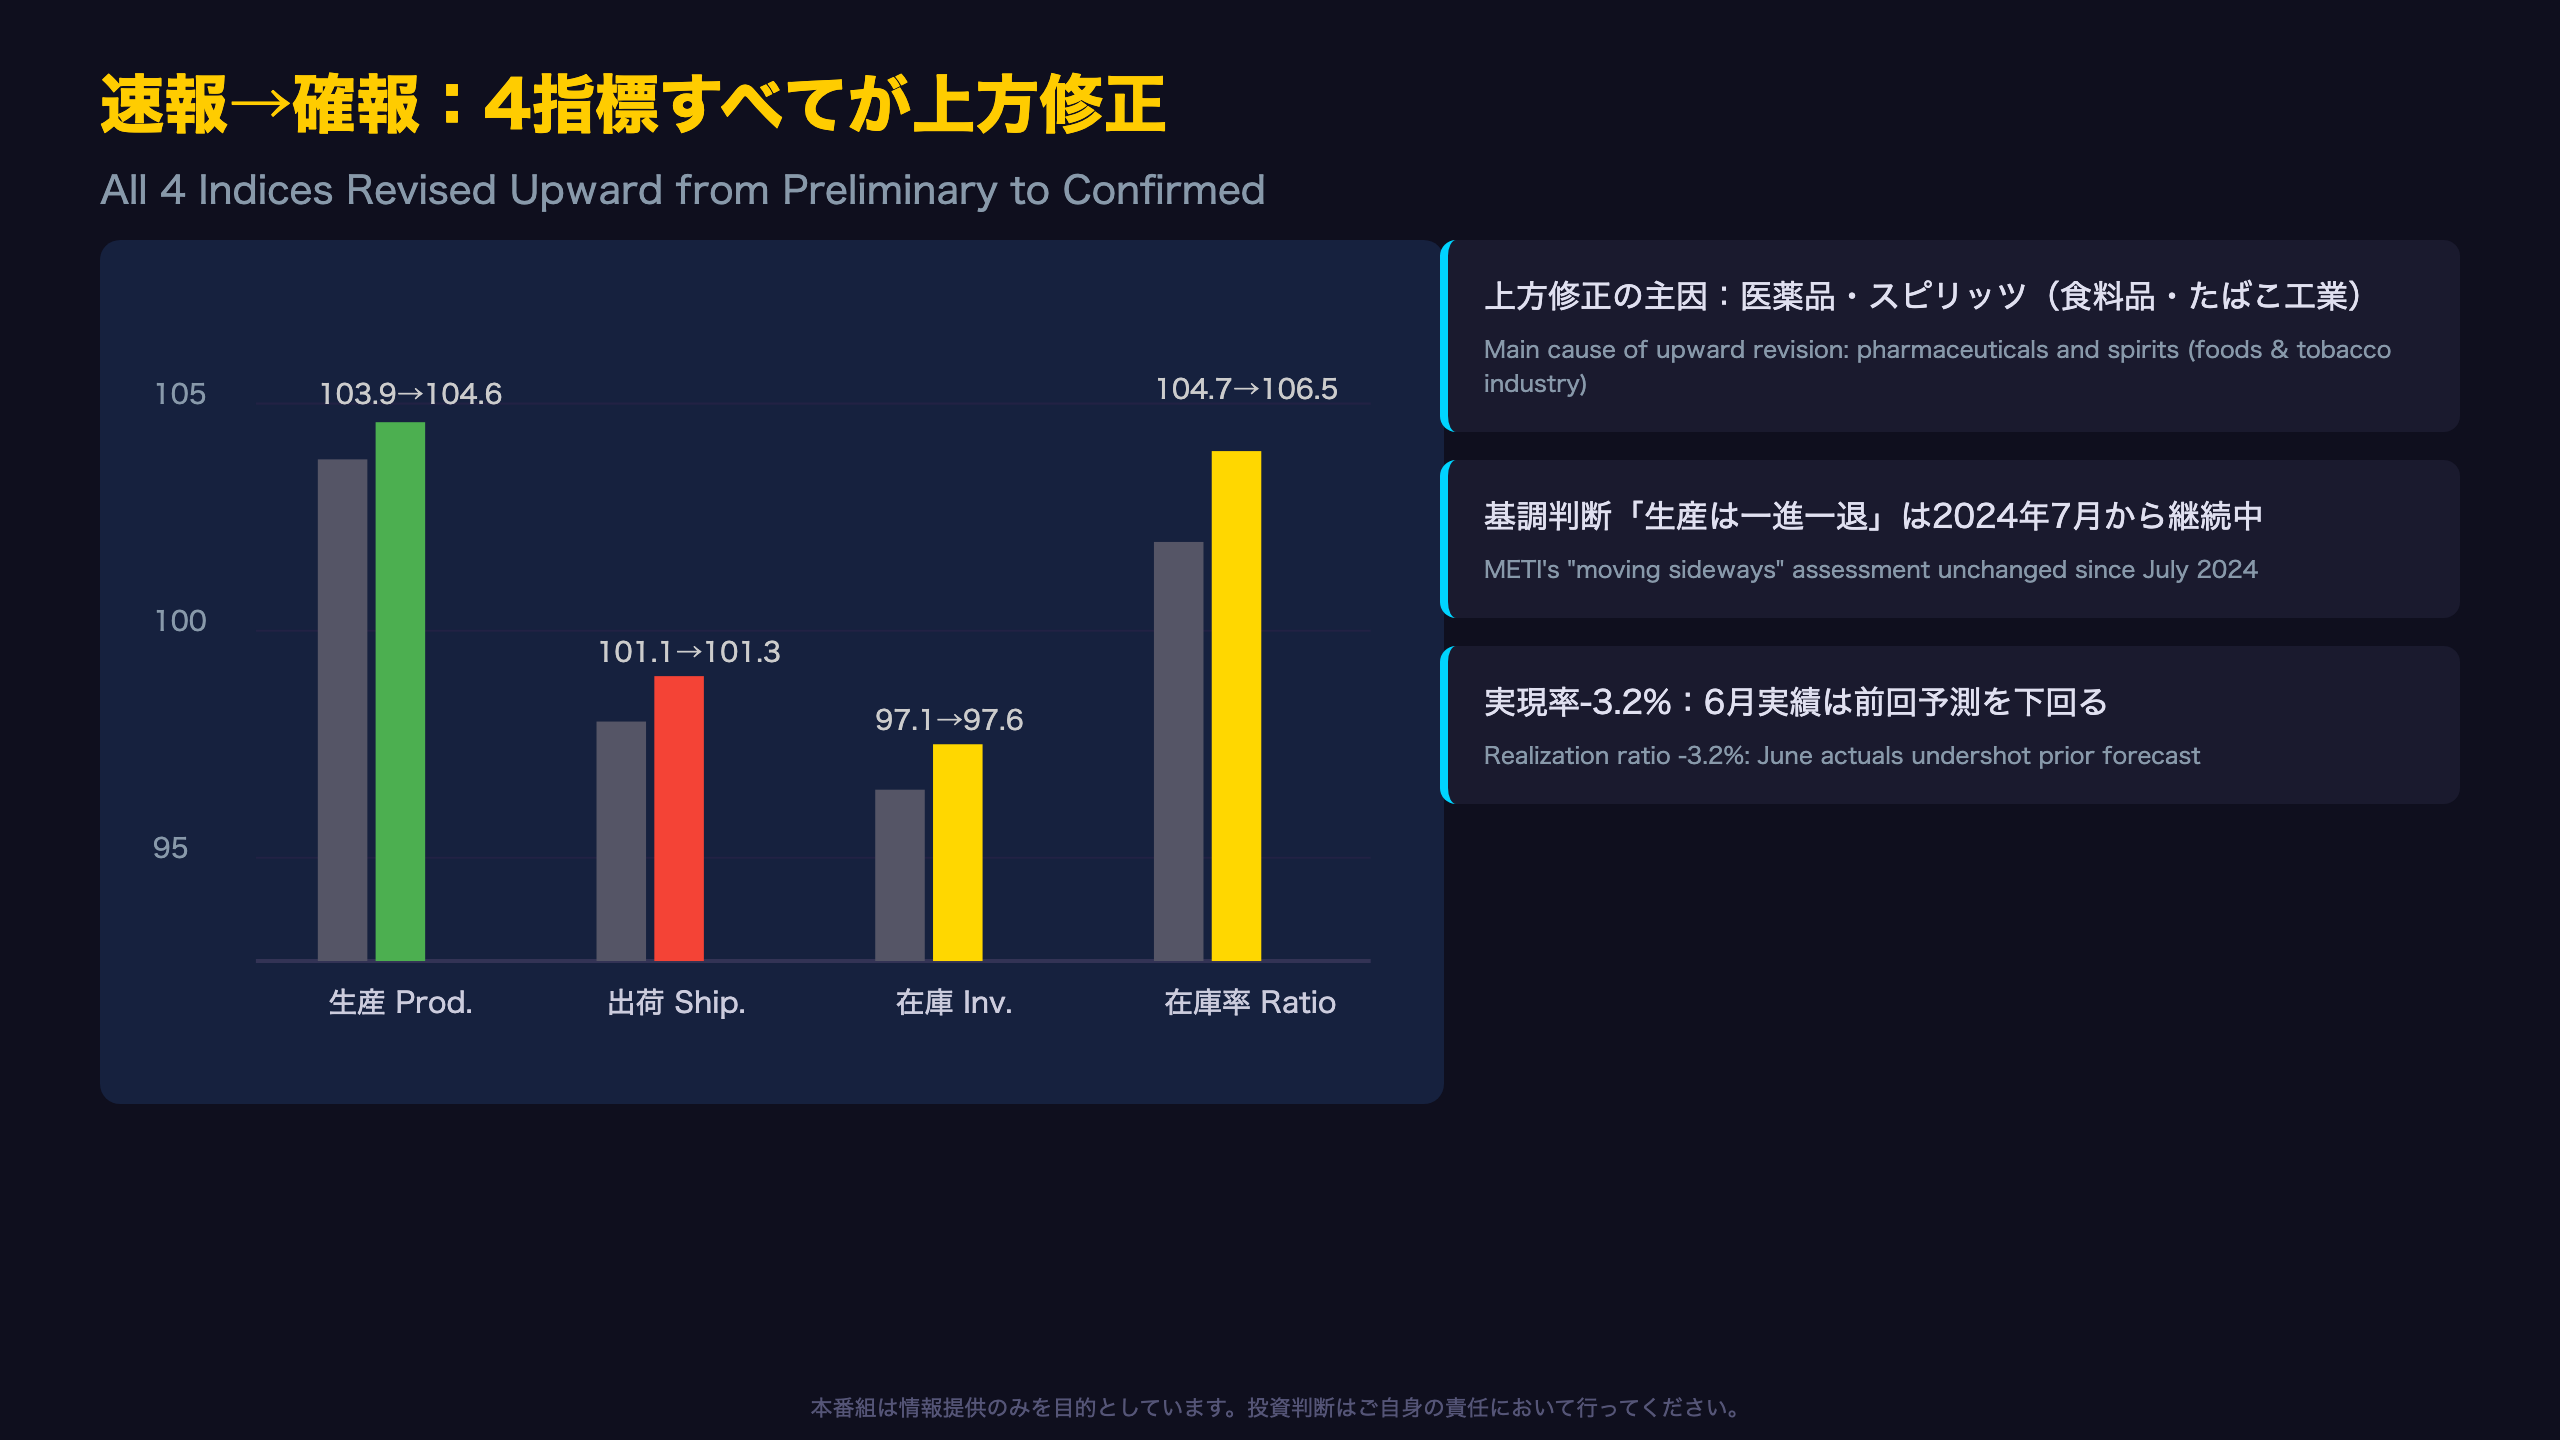
速報から確報へ:全指標が上方修正
Reading the Size of the Revision
The gap between Japan’s preliminary and revised IIP releases is rarely trivial, and this month’s revision was sizeable: production was revised up 0.7 points (103.9 to 104.6), while the inventory ratio was revised up 1.8 points (104.7 to 106.5). METI’s revised methodology incorporates a fuller company survey response than the preliminary snapshot, which is why revisions of this magnitude occur roughly once a month, about four to five weeks after the preliminary print.
METI’s stated reason was explicit: “the upward revision to production reflects pharmaceuticals and spirits,” pointing to the foods and tobacco industry, which climbed to the third-largest positive contributor at +2.8% month-on-month (+2.9% year-on-year) once fuller data arrived.
Context matters here: METI’s qualitative headline assessment — “production is moving sideways with fluctuations” (一進一退) — has been unchanged since July 2024, a full year-plus without an upgrade to a clearer expansionary characterization, unlike the brief “gradual recovery” (緩やかな持ち直しの動き) phase seen from March to June 2023. This is a useful reference point for readers used to the U.S. Federal Reserve’s more binary industrial production narratives.
One caution: the “realization ratio” — how June’s actual result compared with what firms had forecast a month earlier — came in at -3.2%, meaning actual production undershot the prior plan even after the later upward revision versus the preliminary print. The next preliminary release, covering July, is expected around late August, and will show whether the +4.5% planned gain for August materializes.
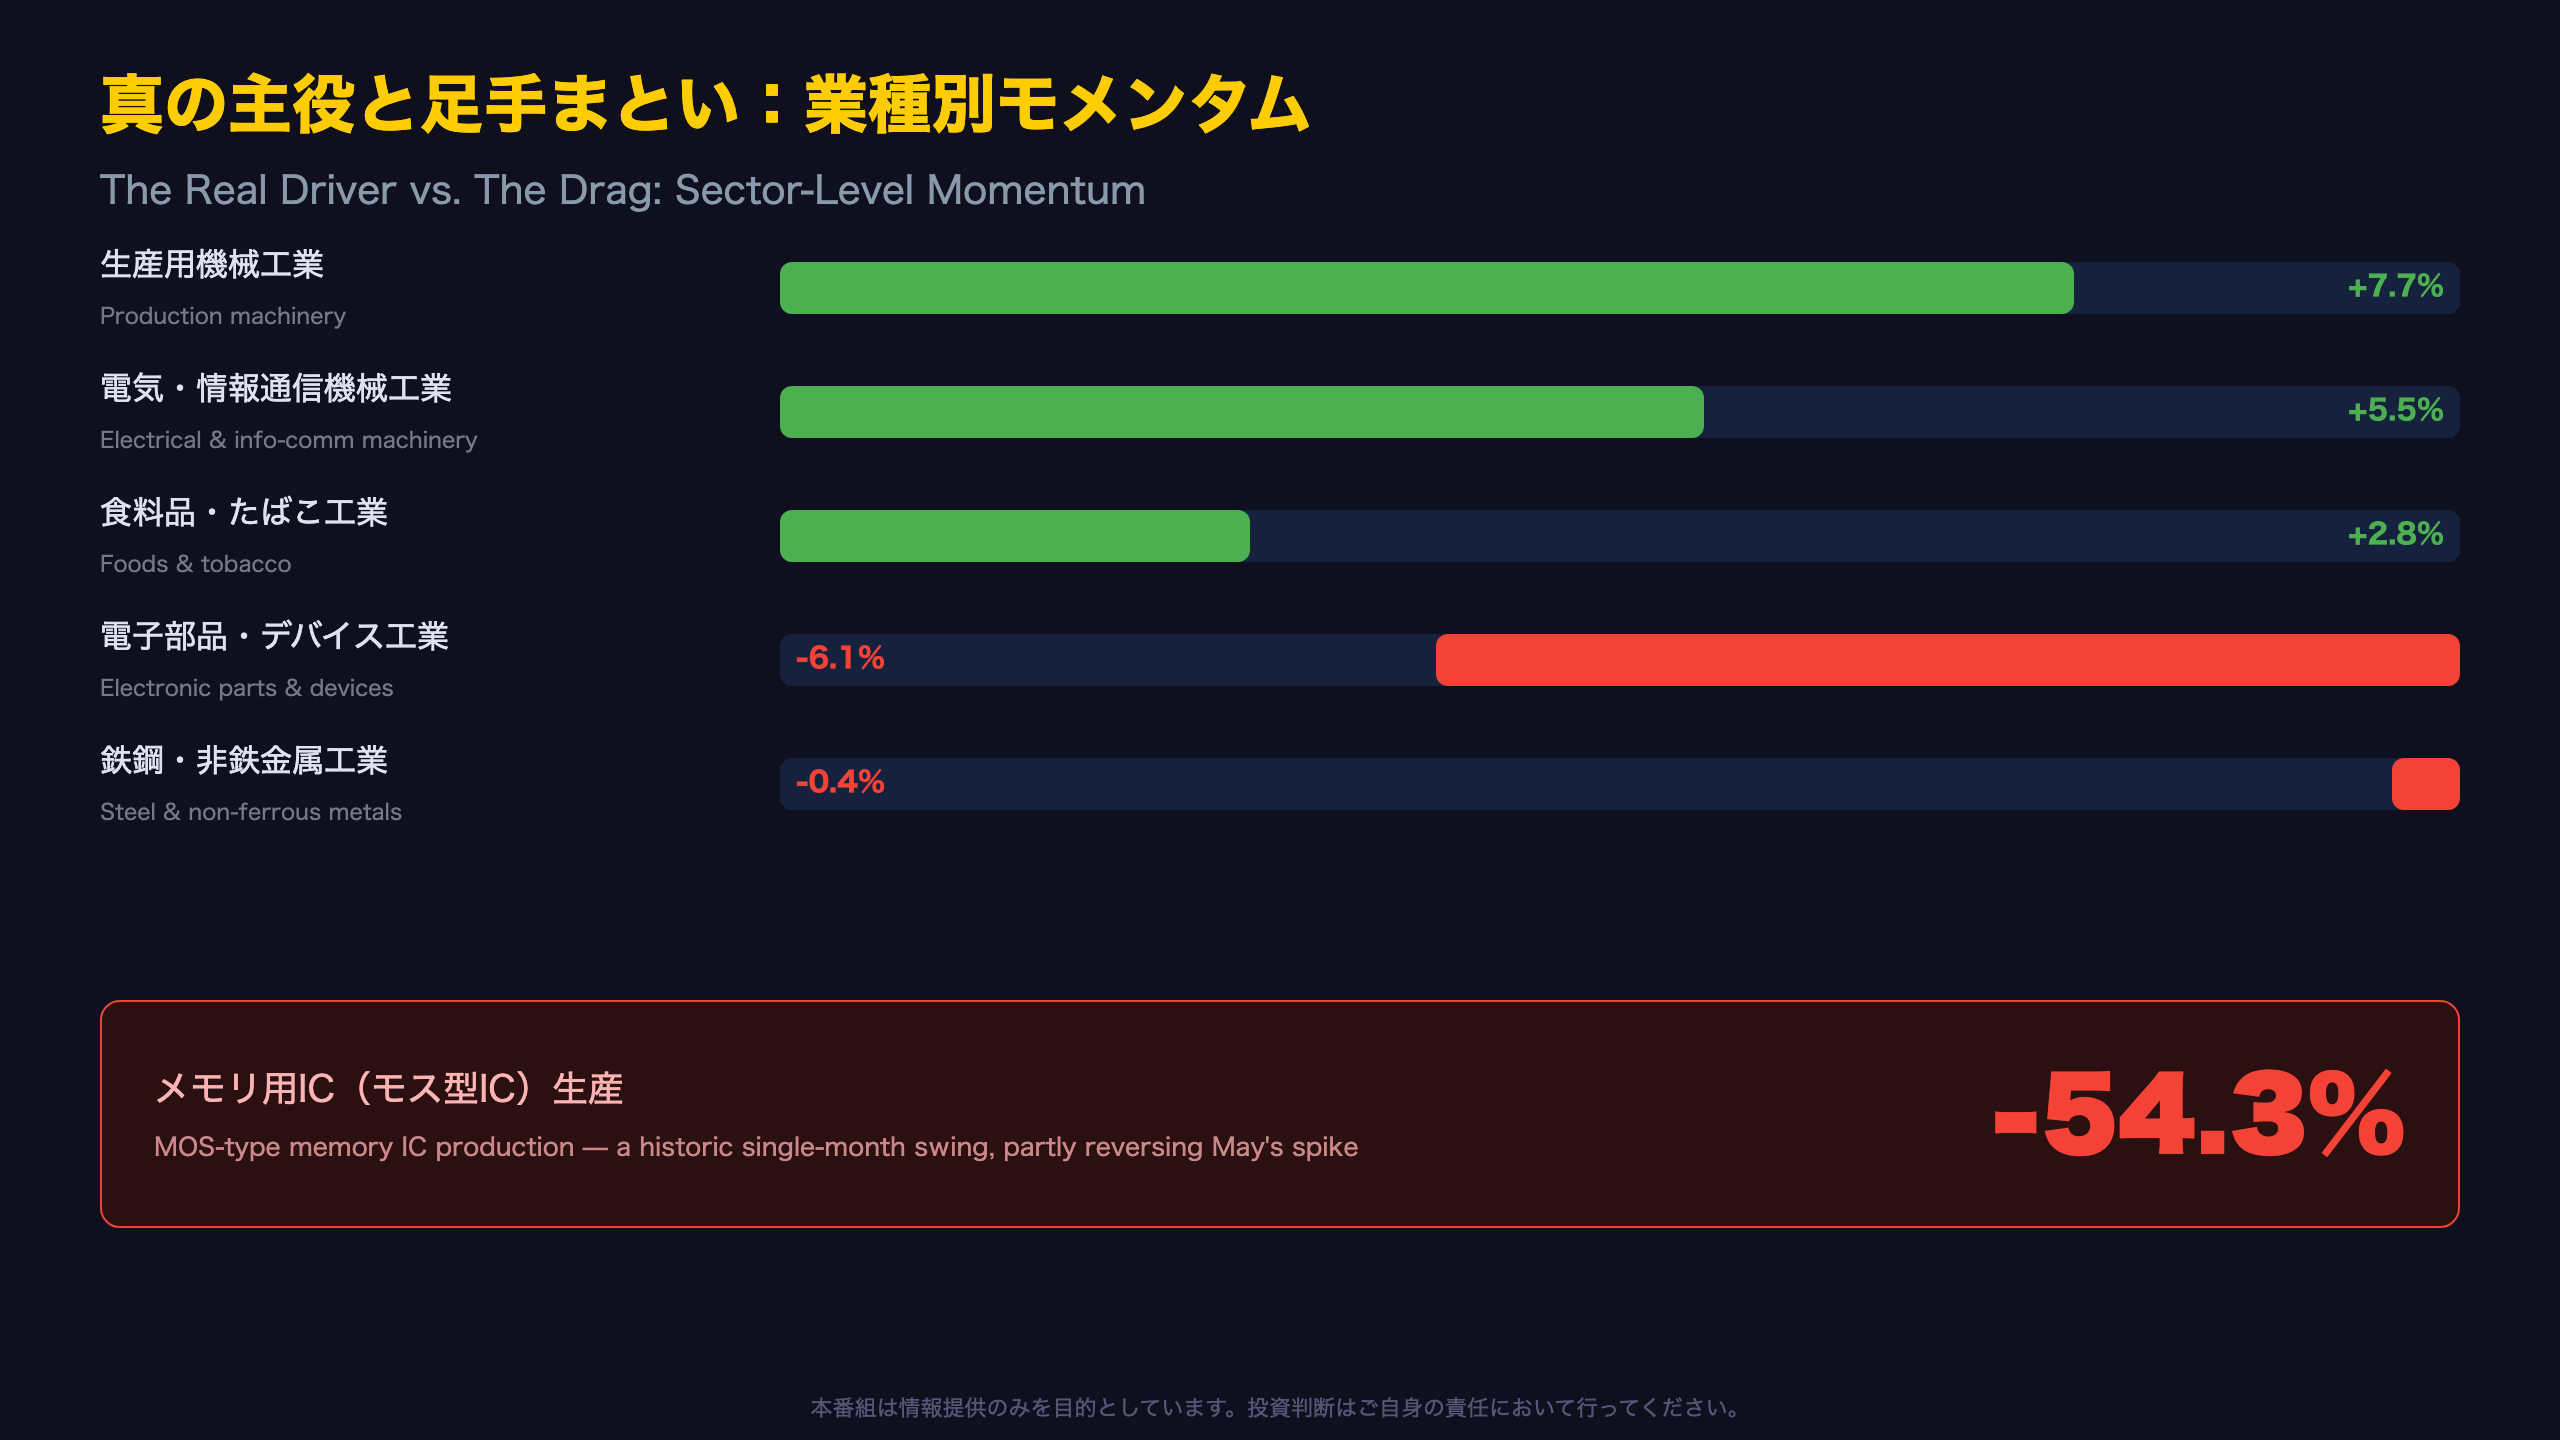
真の主役と足手まとい:業種別モメンタム
Capital Goods vs. Components: A Widening Gap
Within production machinery, semiconductor manufacturing equipment led the charge, up 11.1% month-on-month and 18.8% year-on-year — a figure that echoes the kind of AI-infrastructure capex boom global investors have tracked in U.S. semiconductor capital equipment names. Machining centers and wheel tractors also contributed.
Electrical and information-communication machinery rose thanks to a startling 66.4% month-on-month jump in notebook PC output, though the year-on-year comparison (-21.8%) shows the base remains historically depressed — a useful reminder that large percentage swings in Japanese sub-indices often reflect a narrow, concentrated supplier base (METI notes several series are confidentiality-masked due to having only one or two reporting firms).
Electronic parts and devices told the opposite story: MOS-type memory ICs collapsed 54.3% month-on-month and 49.4% year-on-year. The underlying data show May’s seasonally adjusted index at an unusually elevated 201.9, so part of June’s plunge is a reversal of that spike — a pattern familiar to anyone who follows the boom-bust cadence of global memory chip cycles (comparable to swings seen in Korean and Taiwanese DRAM/NAND output data).
Still, it would be premature to dismiss this purely as base-effect noise: electronic parts and devices inventories rose 3.1% month-on-month even as production fell, hinting demand may not be keeping pace. The split between export-oriented capital goods and domestically-exposed components looks set to remain the central fault line in Japan’s manufacturing story.
在庫サイクルの精密診断:健全な拡大か、意図せざる滞留か
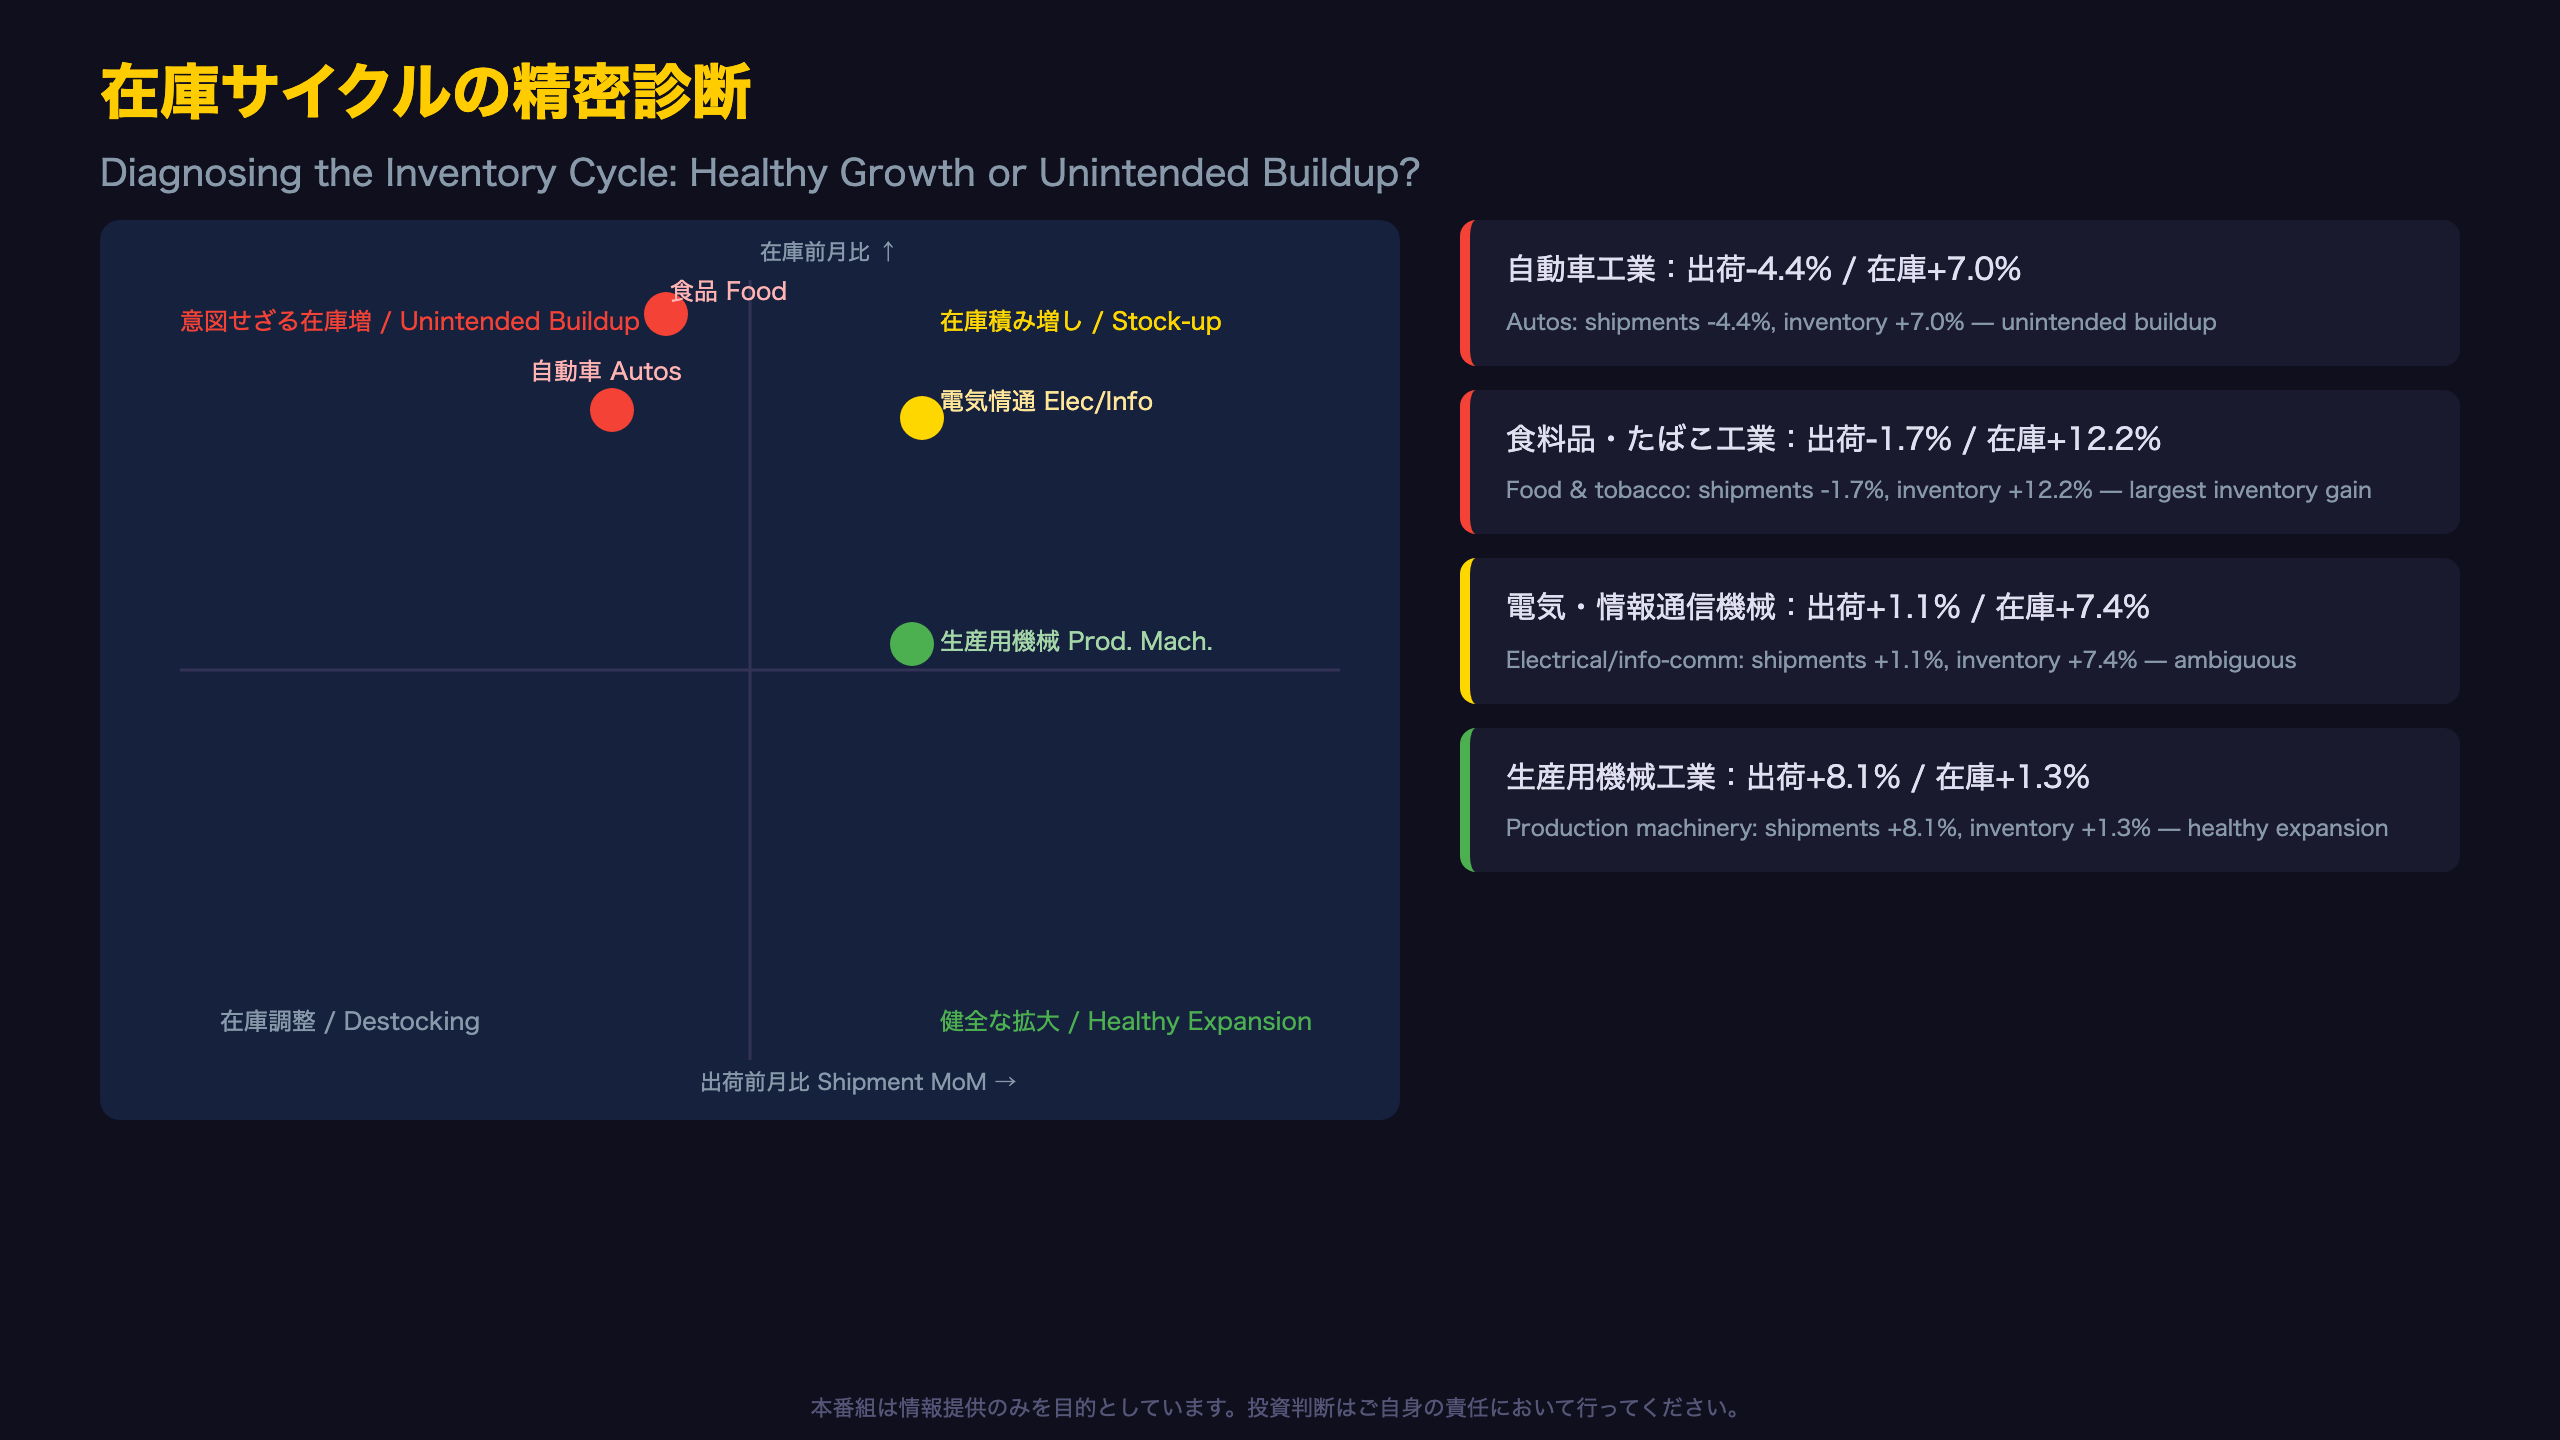
Reading the Inventory Cycle Diagram
METI’s inventory cycle chart (plotting year-on-year production against year-on-year inventory) is a classic four-quadrant framework used to gauge where the business cycle stands: unintended destocking, planned destocking, unintended stockpiling, and intentional restocking. The same logic can be applied at the sector level using this month’s data.
Automobiles: shipments -4.4%, inventories +7.0% (large trucks, small passenger cars). Falling shipments alongside rising inventory is the textbook signature of unintended stock accumulation — the kind of pattern that, if it persists, typically precedes a production cutback.
Foods and tobacco: shipments -1.7%, inventories +12.2% (coffee beverages, tea beverages, processed broiler products). This is the single largest inventory increase across all sectors this month, though a one-off seasonal or product-specific factor cannot be ruled out from a single month’s data (Level C reasoning).
Production machinery: shipments (+8.1%) outpaced production (+7.7%), which in turn outpaced inventory growth (+1.3%) — the textbook signature of healthy, demand-led expansion, comparable to how U.S. semiconductor capital equipment makers have described order backlogs exceeding shipment capacity during the current AI infrastructure buildout.
All of these are single-month observations; confirming whether the pattern persists requires watching the July preliminary release, due around late August 2026.
生産能力の縮小と稼働率急上昇、そして先行き
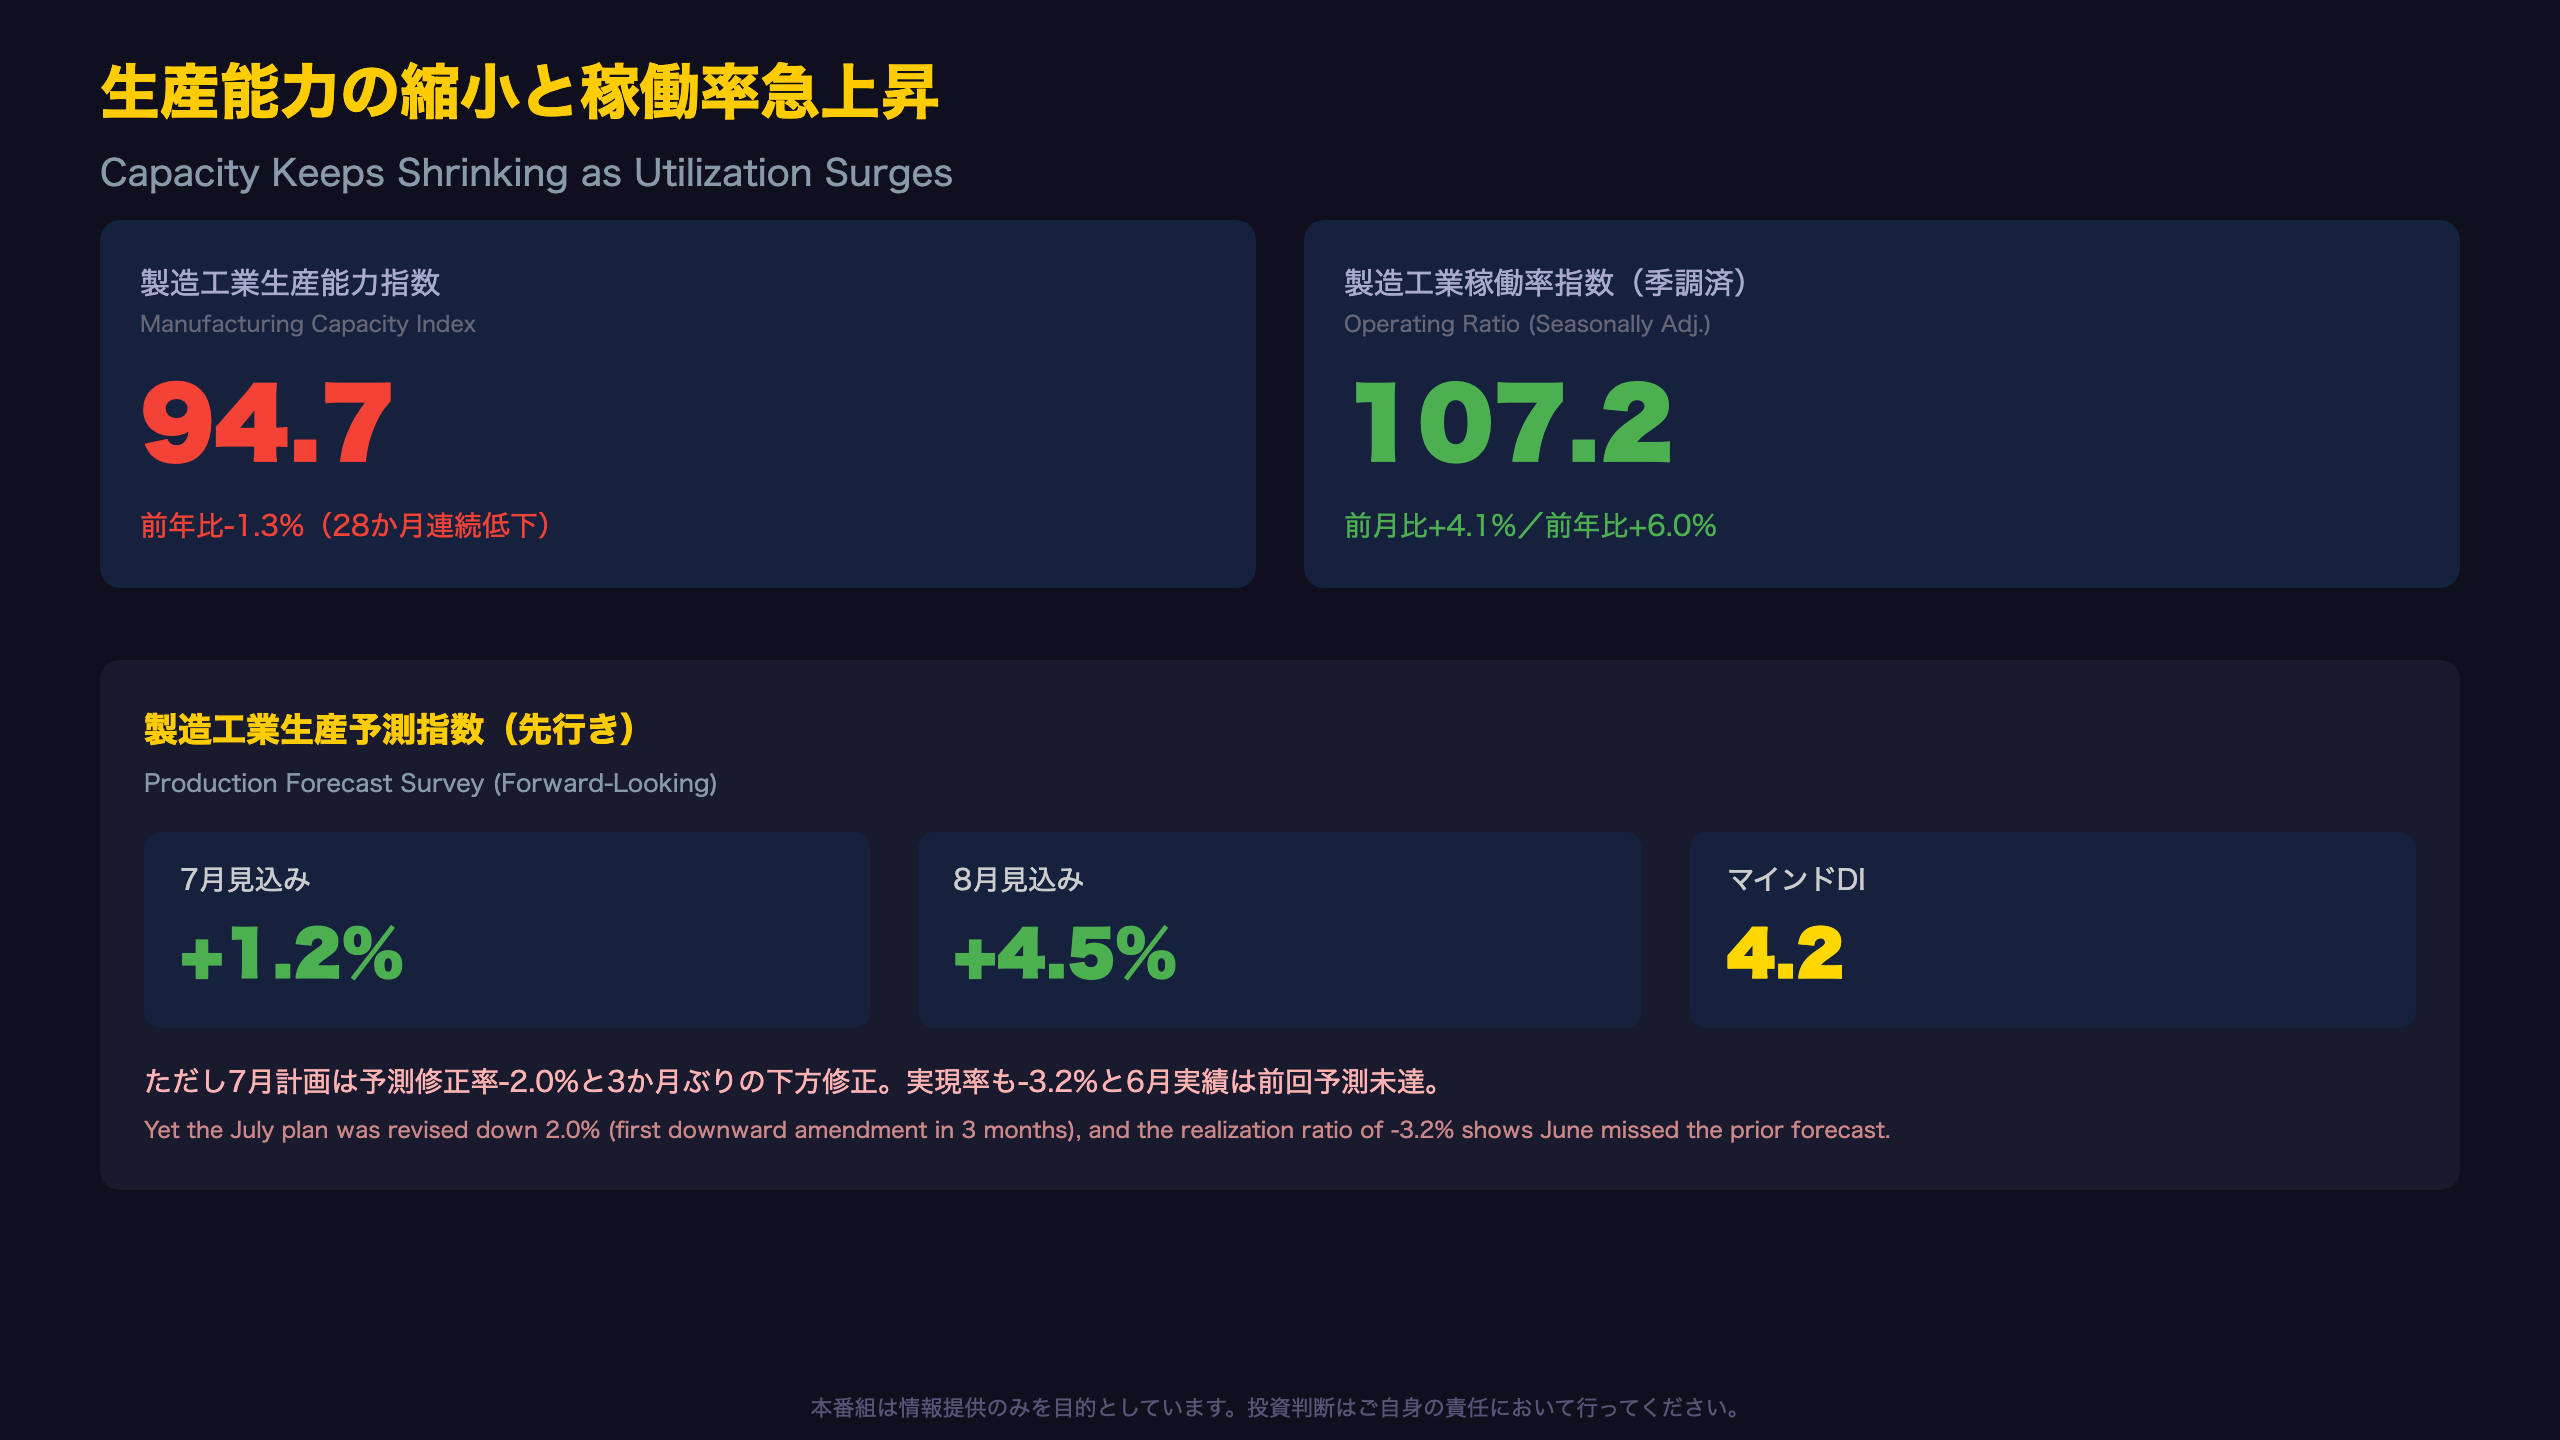
Capacity Shrinks While Utilization Surges
Japan’s manufacturing capacity index has now declined year-on-year for 28 consecutive months, a structural contraction dating back to early 2024 that likely reflects plant consolidation, scrapping of older facilities, and cautious capital spending amid labor constraints. This month’s capacity index did rise 0.2% month-on-month — its first monthly increase in nine months — driven mainly by a 1.5% capacity expansion in production machinery.
The operating ratio tells a sharply different story: seasonally adjusted, it rose 4.1% month-on-month, and the year-on-year figure turned positive for the first time in two months at +6.0%. By sector, production machinery’s operating ratio jumped 12.3% month-on-month and electrical/info-comm machinery rose 7.4%. Notably, the reference figures show the machinery industry’s operating ratio up 9.4% year-on-year, versus just 0.6% for non-machinery manufacturing — confirming the utilization surge is concentrated almost entirely in the machinery sector, mirroring the same bifurcation seen in the production data.
METI’s own commentary on the production forecast survey states: “the amendment ratio fell to -2.0% this time, marking the first downward revision to production plans in three months” — a note of caution amid otherwise upbeat monthly capacity/utilization data.
The sentiment diffusion index (DI) improved to 4.2 from 3.4, with its trend reading at 0.8, comfortably above the -5 threshold METI associates with recession risk. Both bullish (30.0%) and bearish (25.8%) responses rose from the prior month, hinting at a modestly more polarized outlook among manufacturers. Whether this utilization surge proves durable — a potential precursor to renewed capex — or transient will likely hinge on how the August realization ratio compares once the July preliminary data arrives.
インプリケーション:市場と生活への示唆
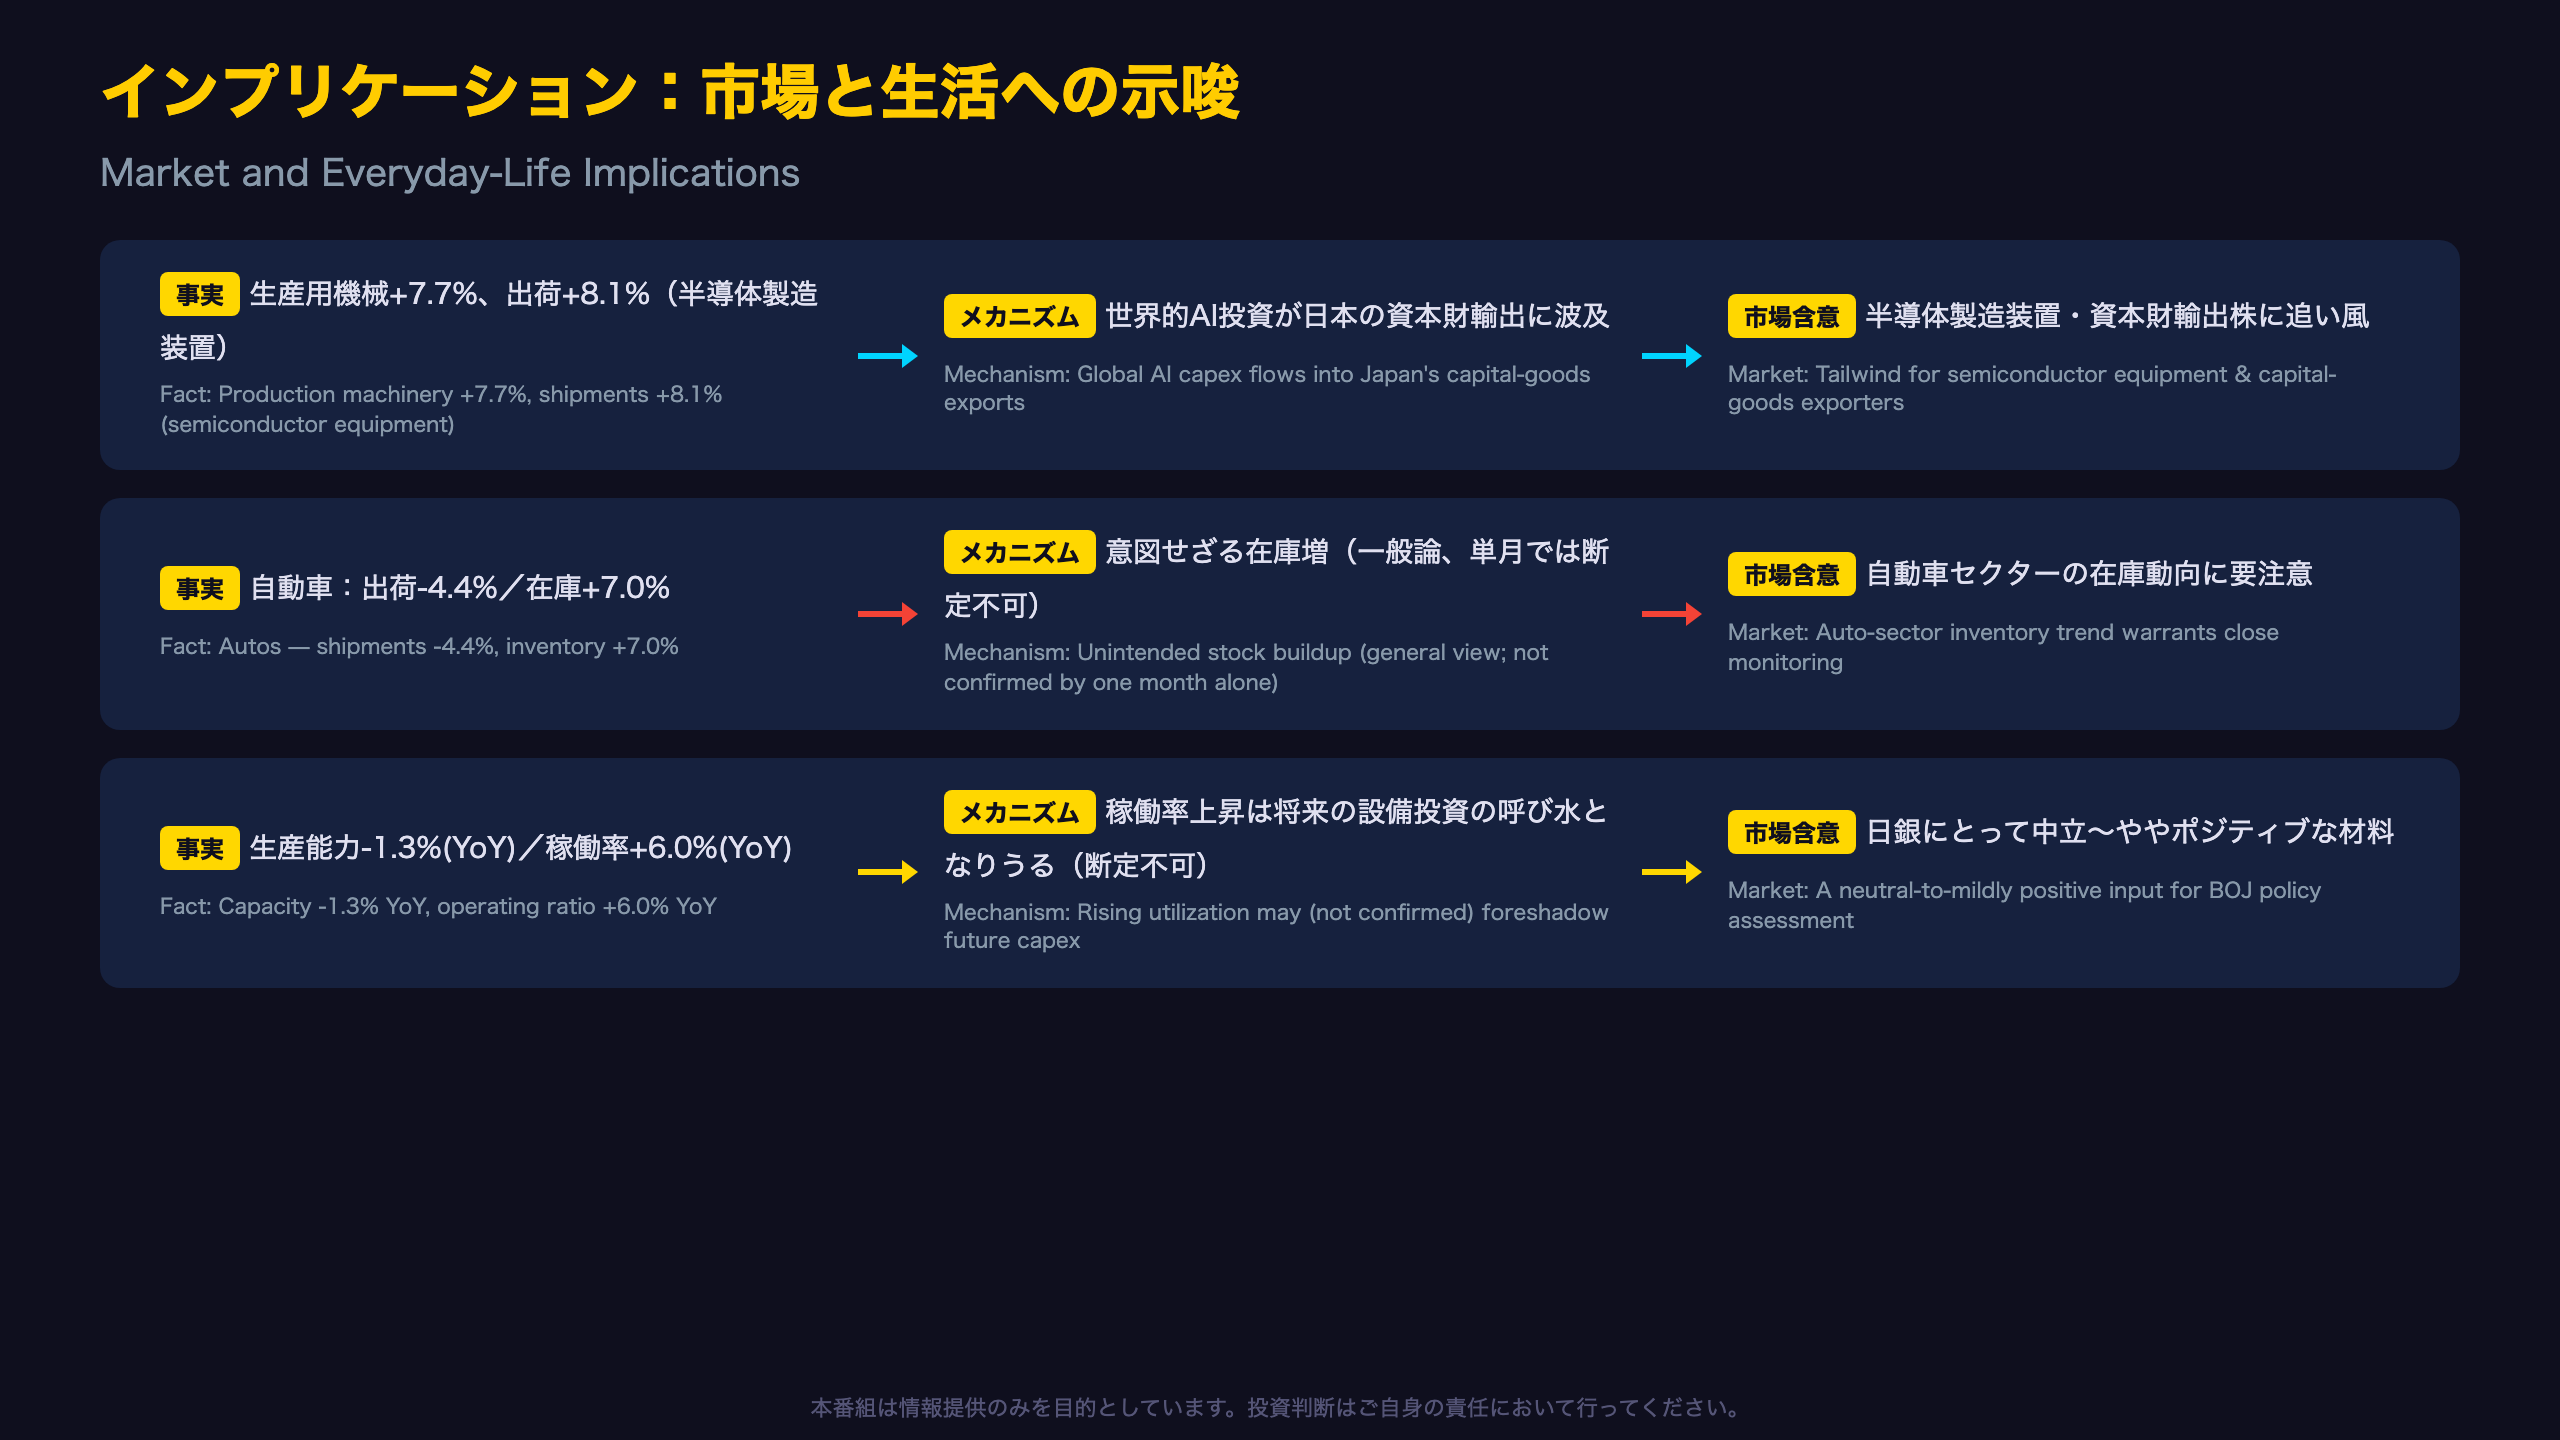
Chain of Reasoning: From Data to Market Implications
Chain 1: Production machinery output rose 7.7% month-on-month, with shipments rising even faster at 8.1% (driven by semiconductor manufacturing equipment) → this suggests robust global AI-related capital expenditure demand is flowing directly into Japanese capital-goods exporters’ orders and output → this remains a supportive factor for semiconductor equipment-related stocks and capital-goods exporters, in a manner comparable to how strong bookings at U.S. and Dutch semiconductor equipment makers have supported those equities.
Chain 2: Automobile shipments fell 4.4% month-on-month even as inventories rose 7.0% (large trucks, small passenger cars) → generally, a combination of falling shipments and rising inventory is read as a signal of unintended stock accumulation, which could lead to production cutbacks in coming months — but this single month’s data alone cannot confirm that the entire auto sector has entered a production-cutting phase.
Chain 3: The manufacturing capacity index has now fallen year-on-year for 28 consecutive months, even as the operating ratio index rose 6.0% year-on-year → generally, a sustained rise in utilization is thought to be a precursor to new capital expenditure, but this needs to be cross-checked against other indicators such as the BOJ’s Tankan survey; this IIP data alone cannot confirm an acceleration in capital spending.
For readers new to Japanese macro data: this kind of sector bifurcation — strong exports, softer domestic demand — echoes patterns seen in the U.S. where semiconductor capex has outpaced broader industrial production. For the Bank of Japan, resilient export-linked manufacturing profits support (but do not by themselves confirm) the wage-price virtuous cycle narrative underpinning its policy normalization path, while emerging auto-sector inventory softness is a factor worth watching in upcoming Tankan and consumption data. The next data point to watch is the July preliminary IIP release, expected around late August, which will show whether August’s planned 4.5% production gain materializes.
Disclaimer: This article is for informational purposes only. All investment decisions are made solely at your own risk.







