📺 Watch the Full Video Analysis
This article was automatically generated by the NFC Market Live AI analysis system. (Updated: 2026-08-14 08:59 JST)
Deep dive into Japan’s weekly securities flow data from the Ministry of Finance. 📊
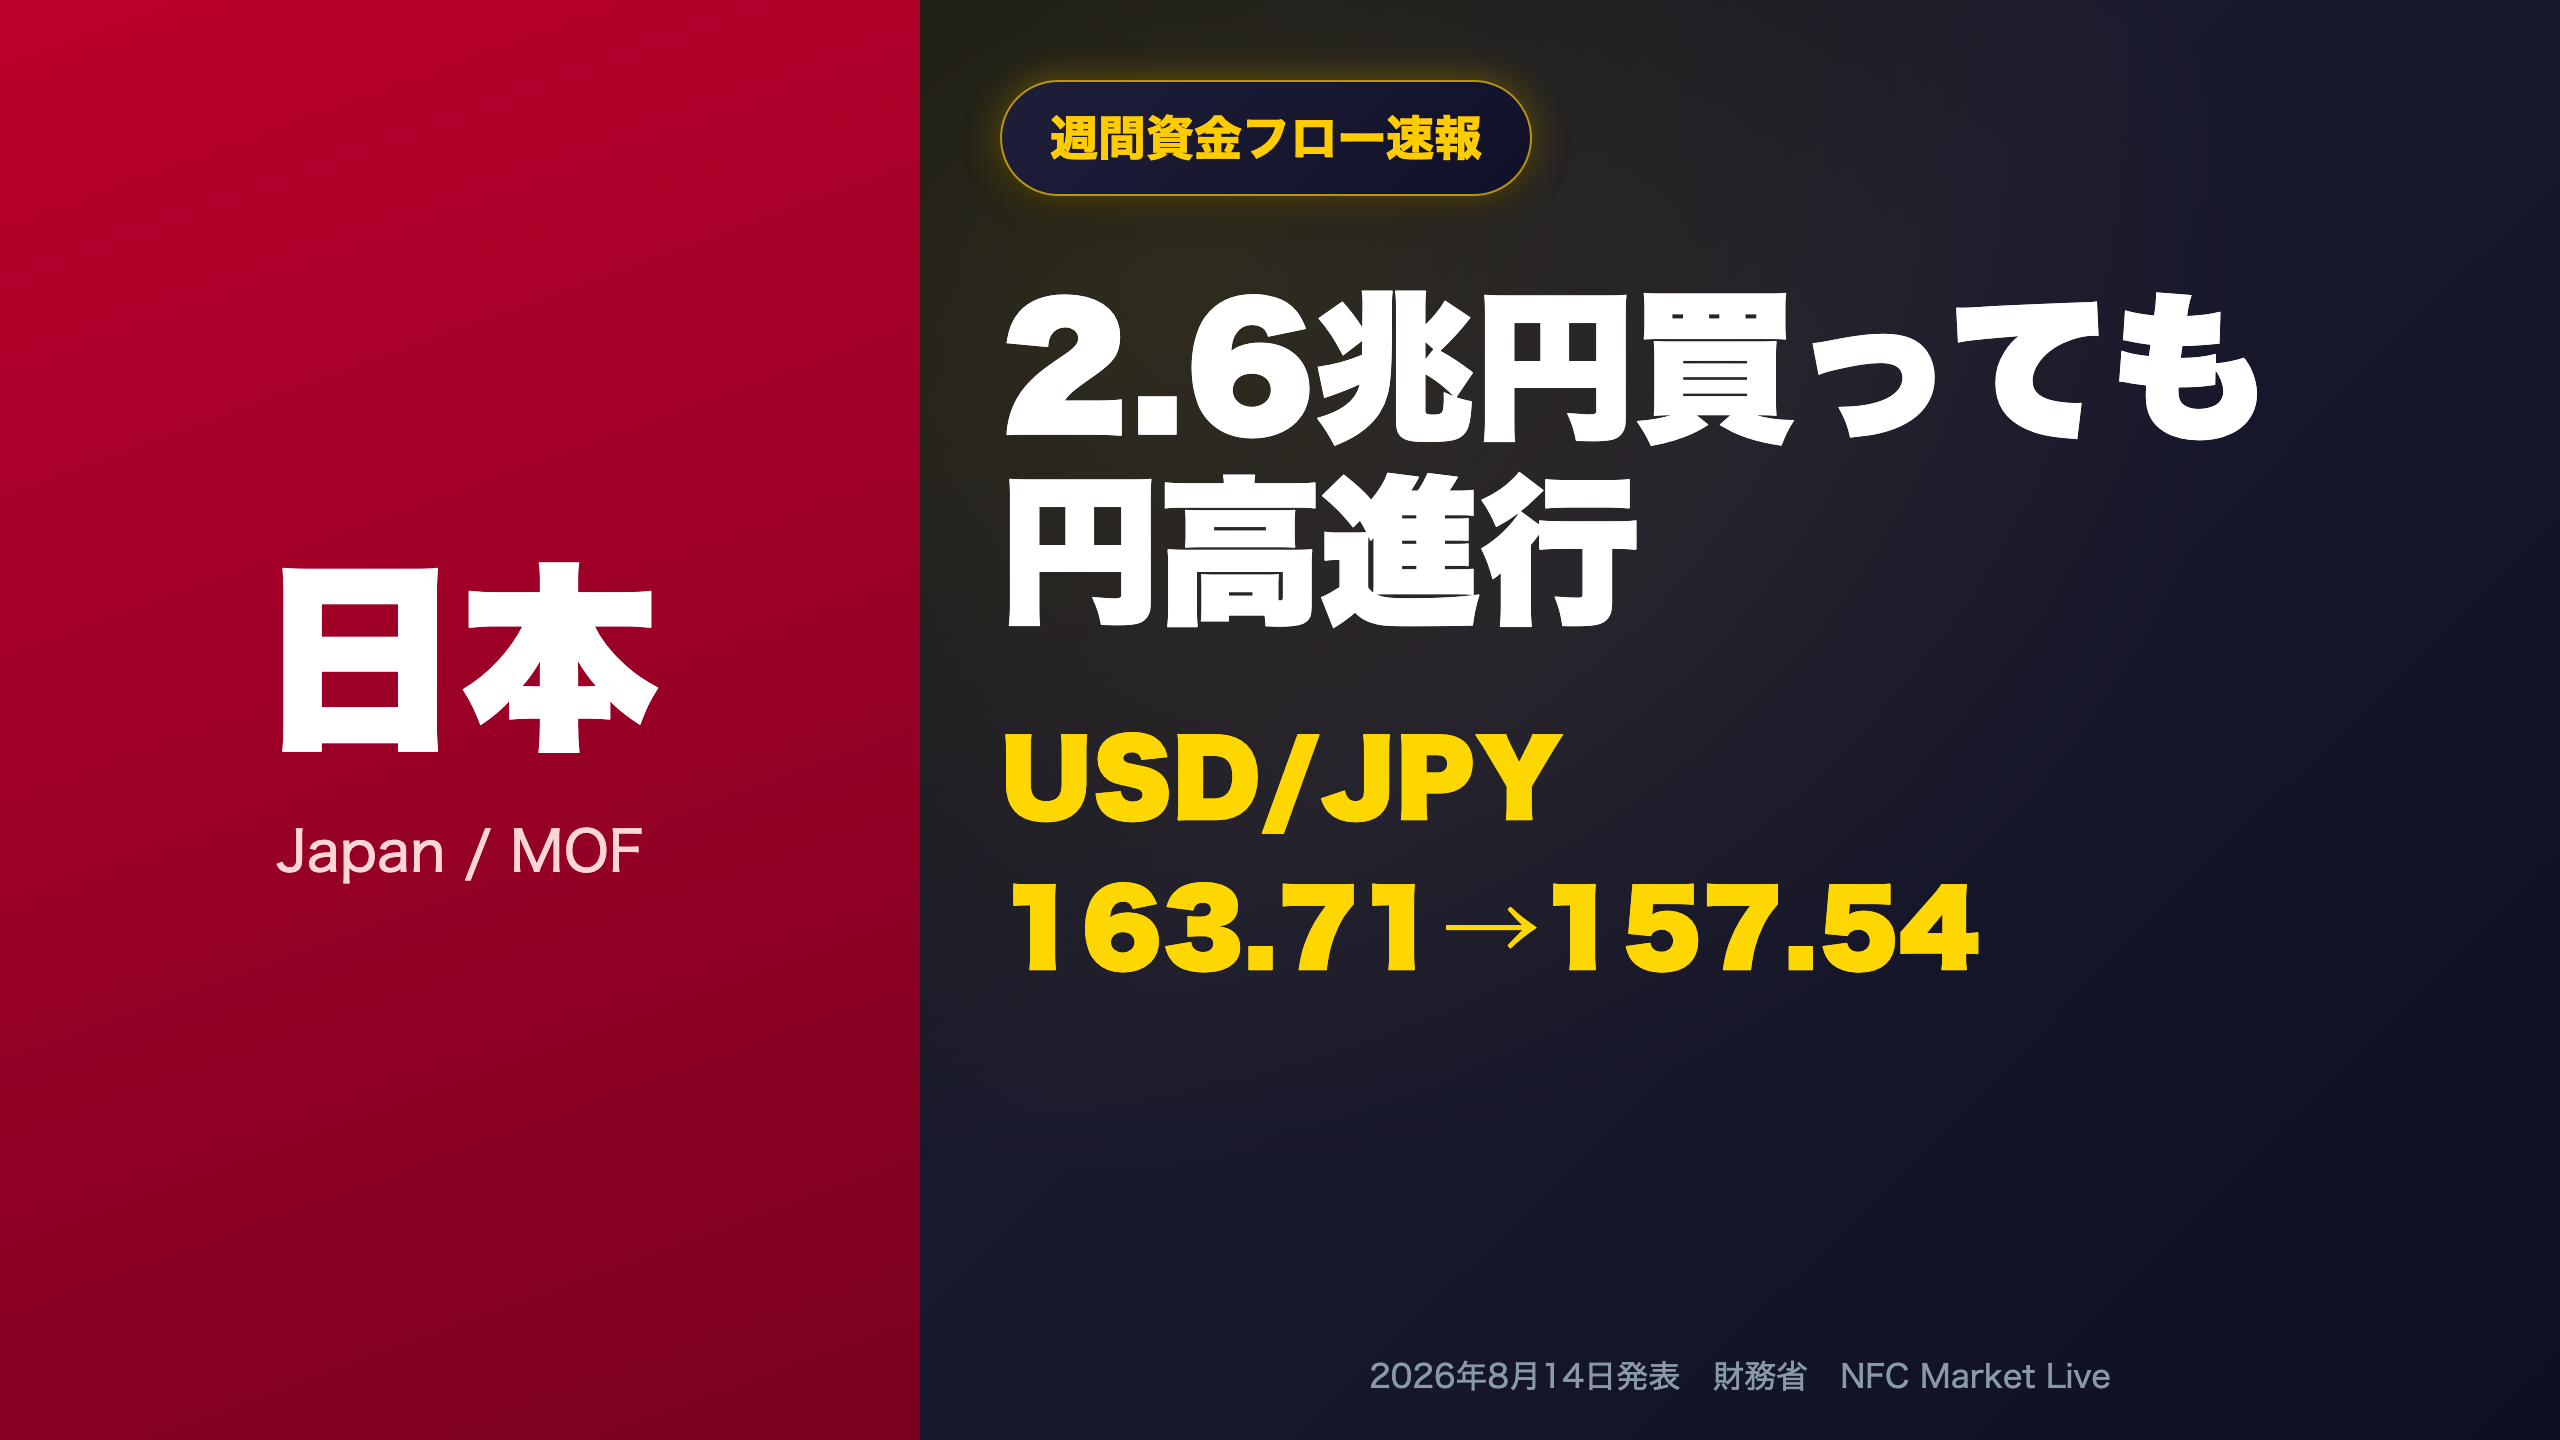
Japanese investors ramped up overseas stock and bond purchases to ¥2.6 trillion combined.
Meanwhile, foreign investors continued net selling of Japanese stocks and bonds.
💹 Yet USD/JPY strengthened over 6 yen from July’s 163.71 peak to 157.54.
We examine why the textbook flow-FX correlation broke down this week.
⚠️ Careful, evidence-based analysis—no overreach from single-week data.
資金フローと為替の逆説:2.6兆円の対外投資でも進む円高
Weekly Capital Flow Snapshot: A Curious Divergence
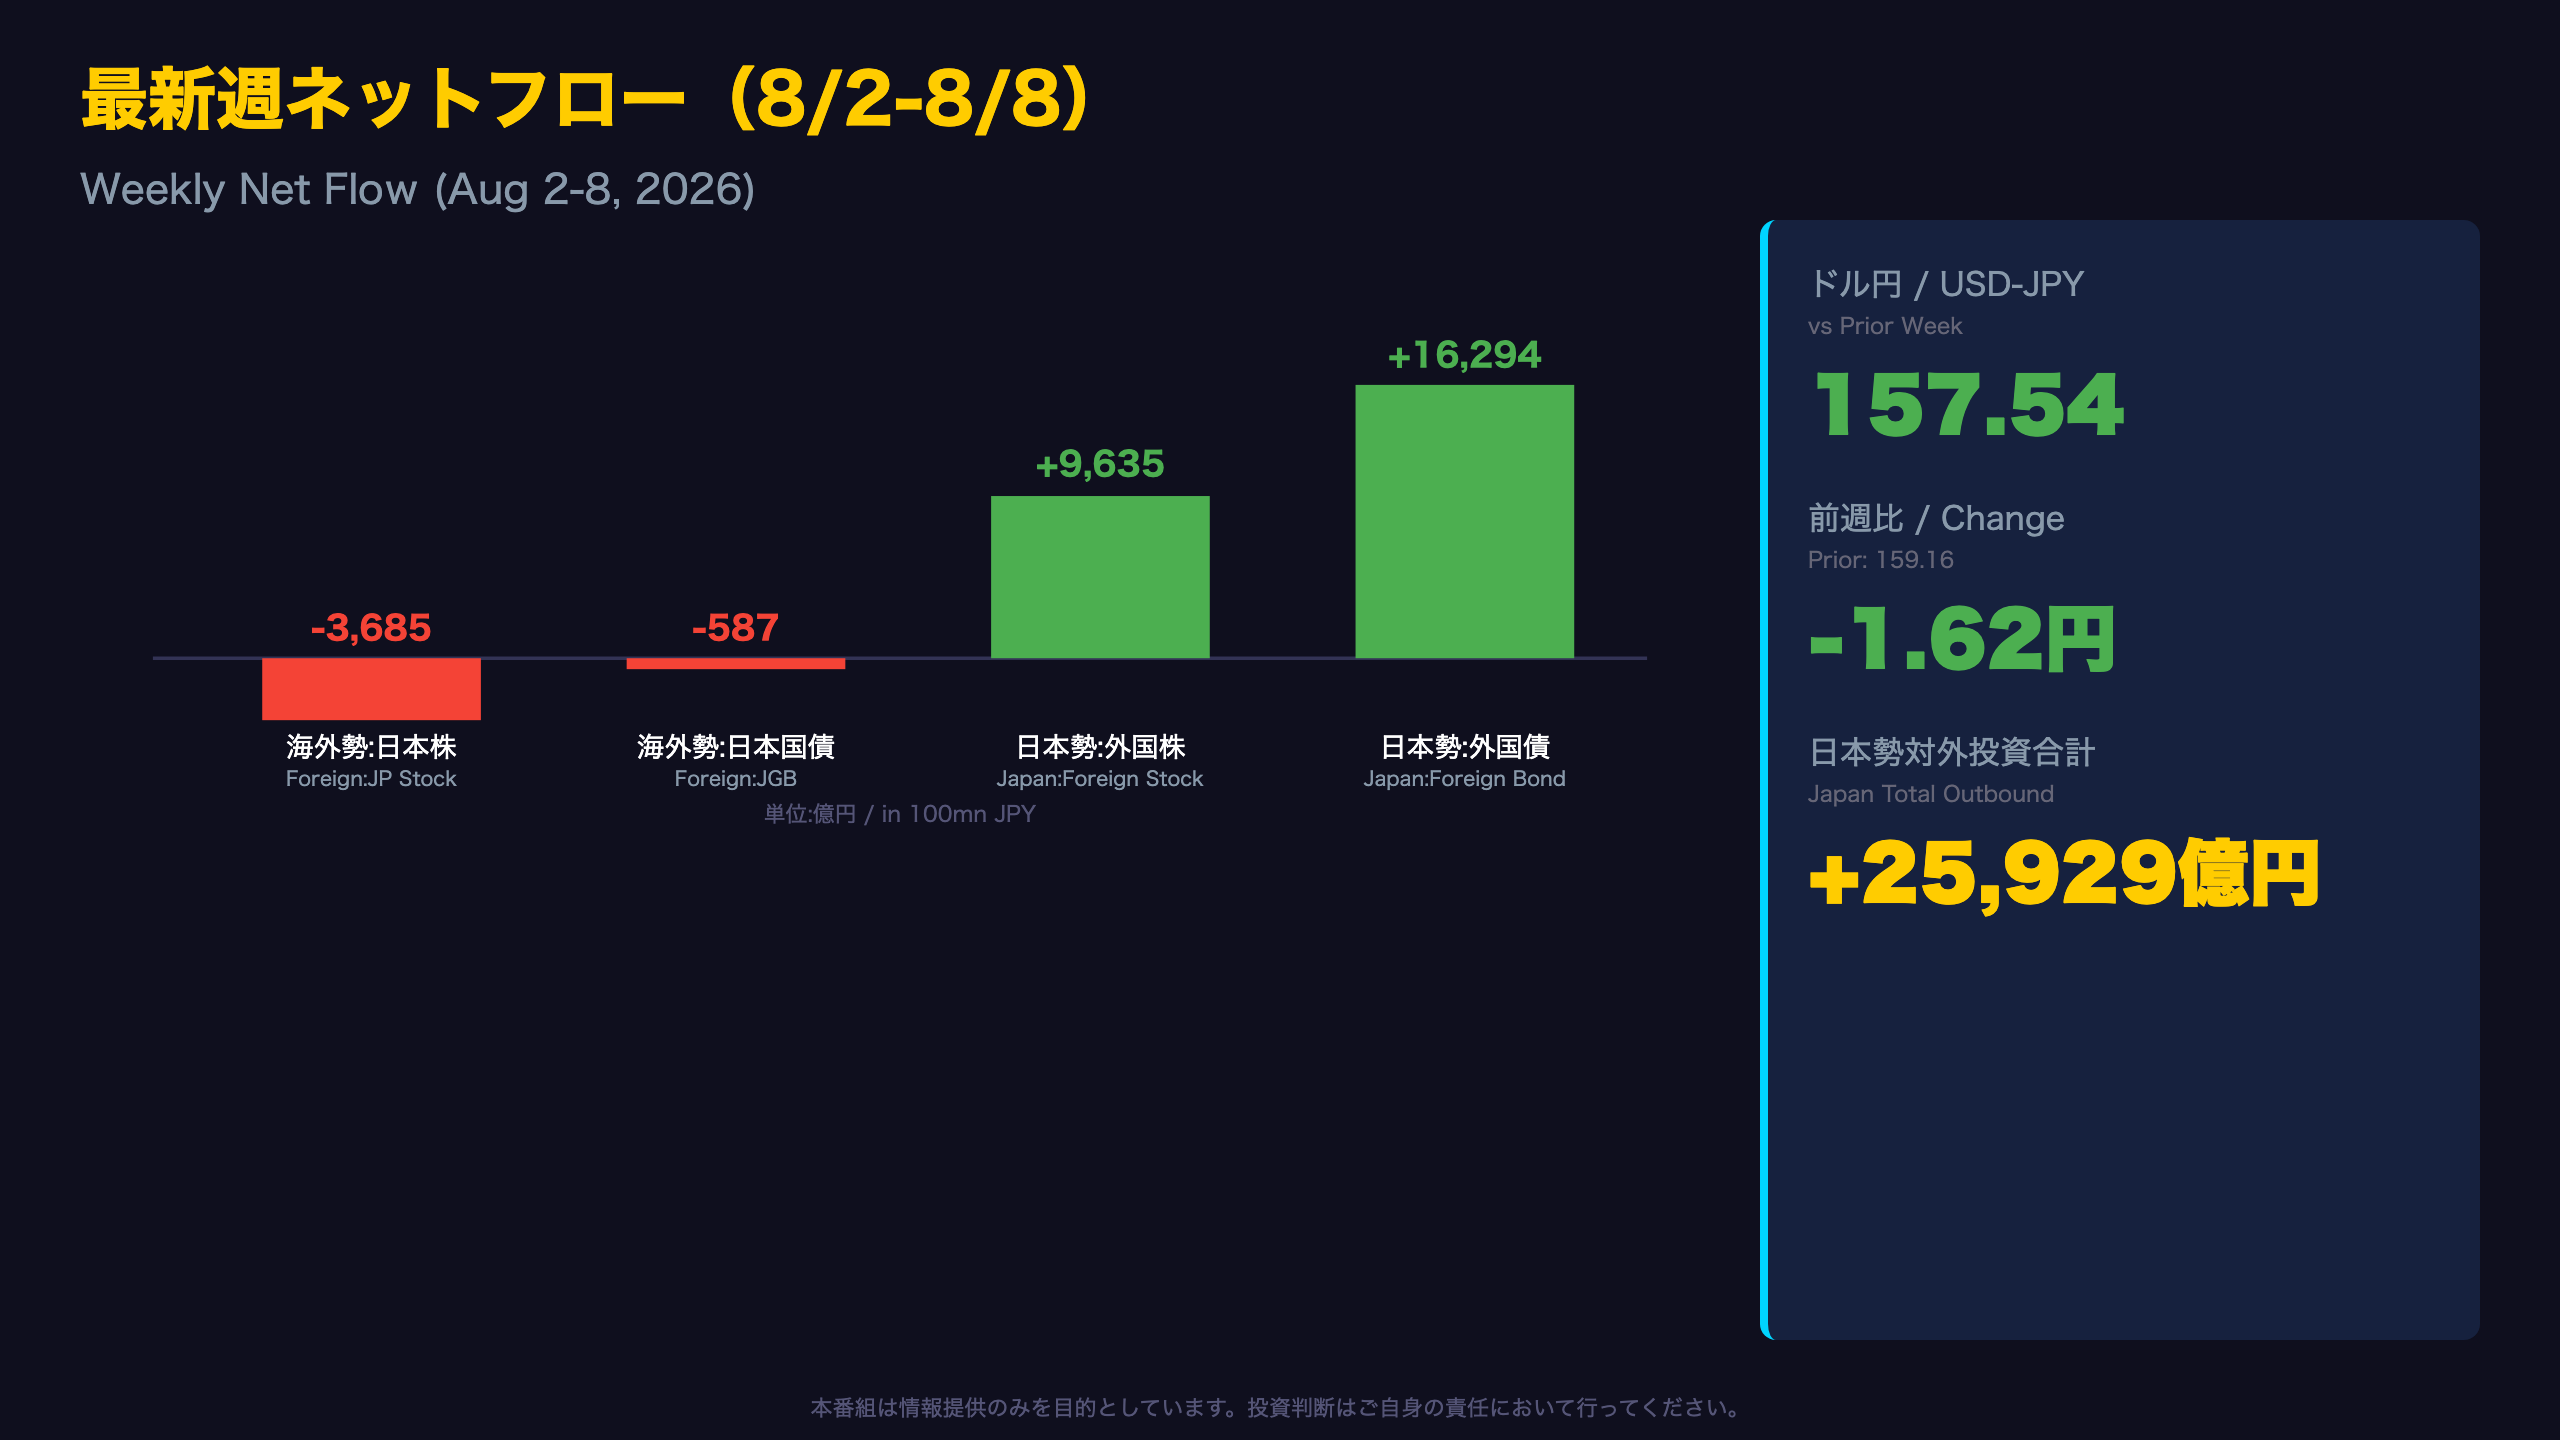
Japan’s Ministry of Finance (MOF) publishes a weekly report titled “Trends in Sales/Purchases of Foreign Securities” that tracks cross-border portfolio flows in stocks and bonds. For the week of August 2-8, 2026, the report revealed a striking mismatch between flows and the exchange rate.
Key figures
| Item | This Week | Prior Week |
|---|---|---|
| Foreign investors, JP stocks | -¥368.5bn | -¥392.5bn |
| Foreign investors, JGBs | -¥58.7bn | +¥558.9bn |
| Japan investors, foreign stocks | +¥963.5bn | -¥276.4bn |
| Japan investors, foreign bonds | +¥1,629.4bn | +¥477.9bn |
| USD/JPY | 157.54 | 159.16 |
Japanese residents’ combined outbound investment (stocks + bonds) surged to roughly ¥2.59 trillion, more than ten times the prior week’s level.
At the same time, foreign investors kept selling both Japanese equities and JGBs, meaning capital was leaving the Japanese market from both directions simultaneously.
Why this matters for international investors: Conventional wisdom holds that rising outbound investment by residents (capital outflow) should pressure the domestic currency lower. Instead, USD/JPY strengthened toward the yen. This is a textbook case where flow data alone cannot explain FX moves — rate differentials, hedging costs, and risk sentiment likely played a larger role. Subsequent slides unpack the July 25 turning point in detail.
日本勢「攻めの外債買い」急拡大、2週連続で加速
Japan’s Outbound Investment: A Closer Look
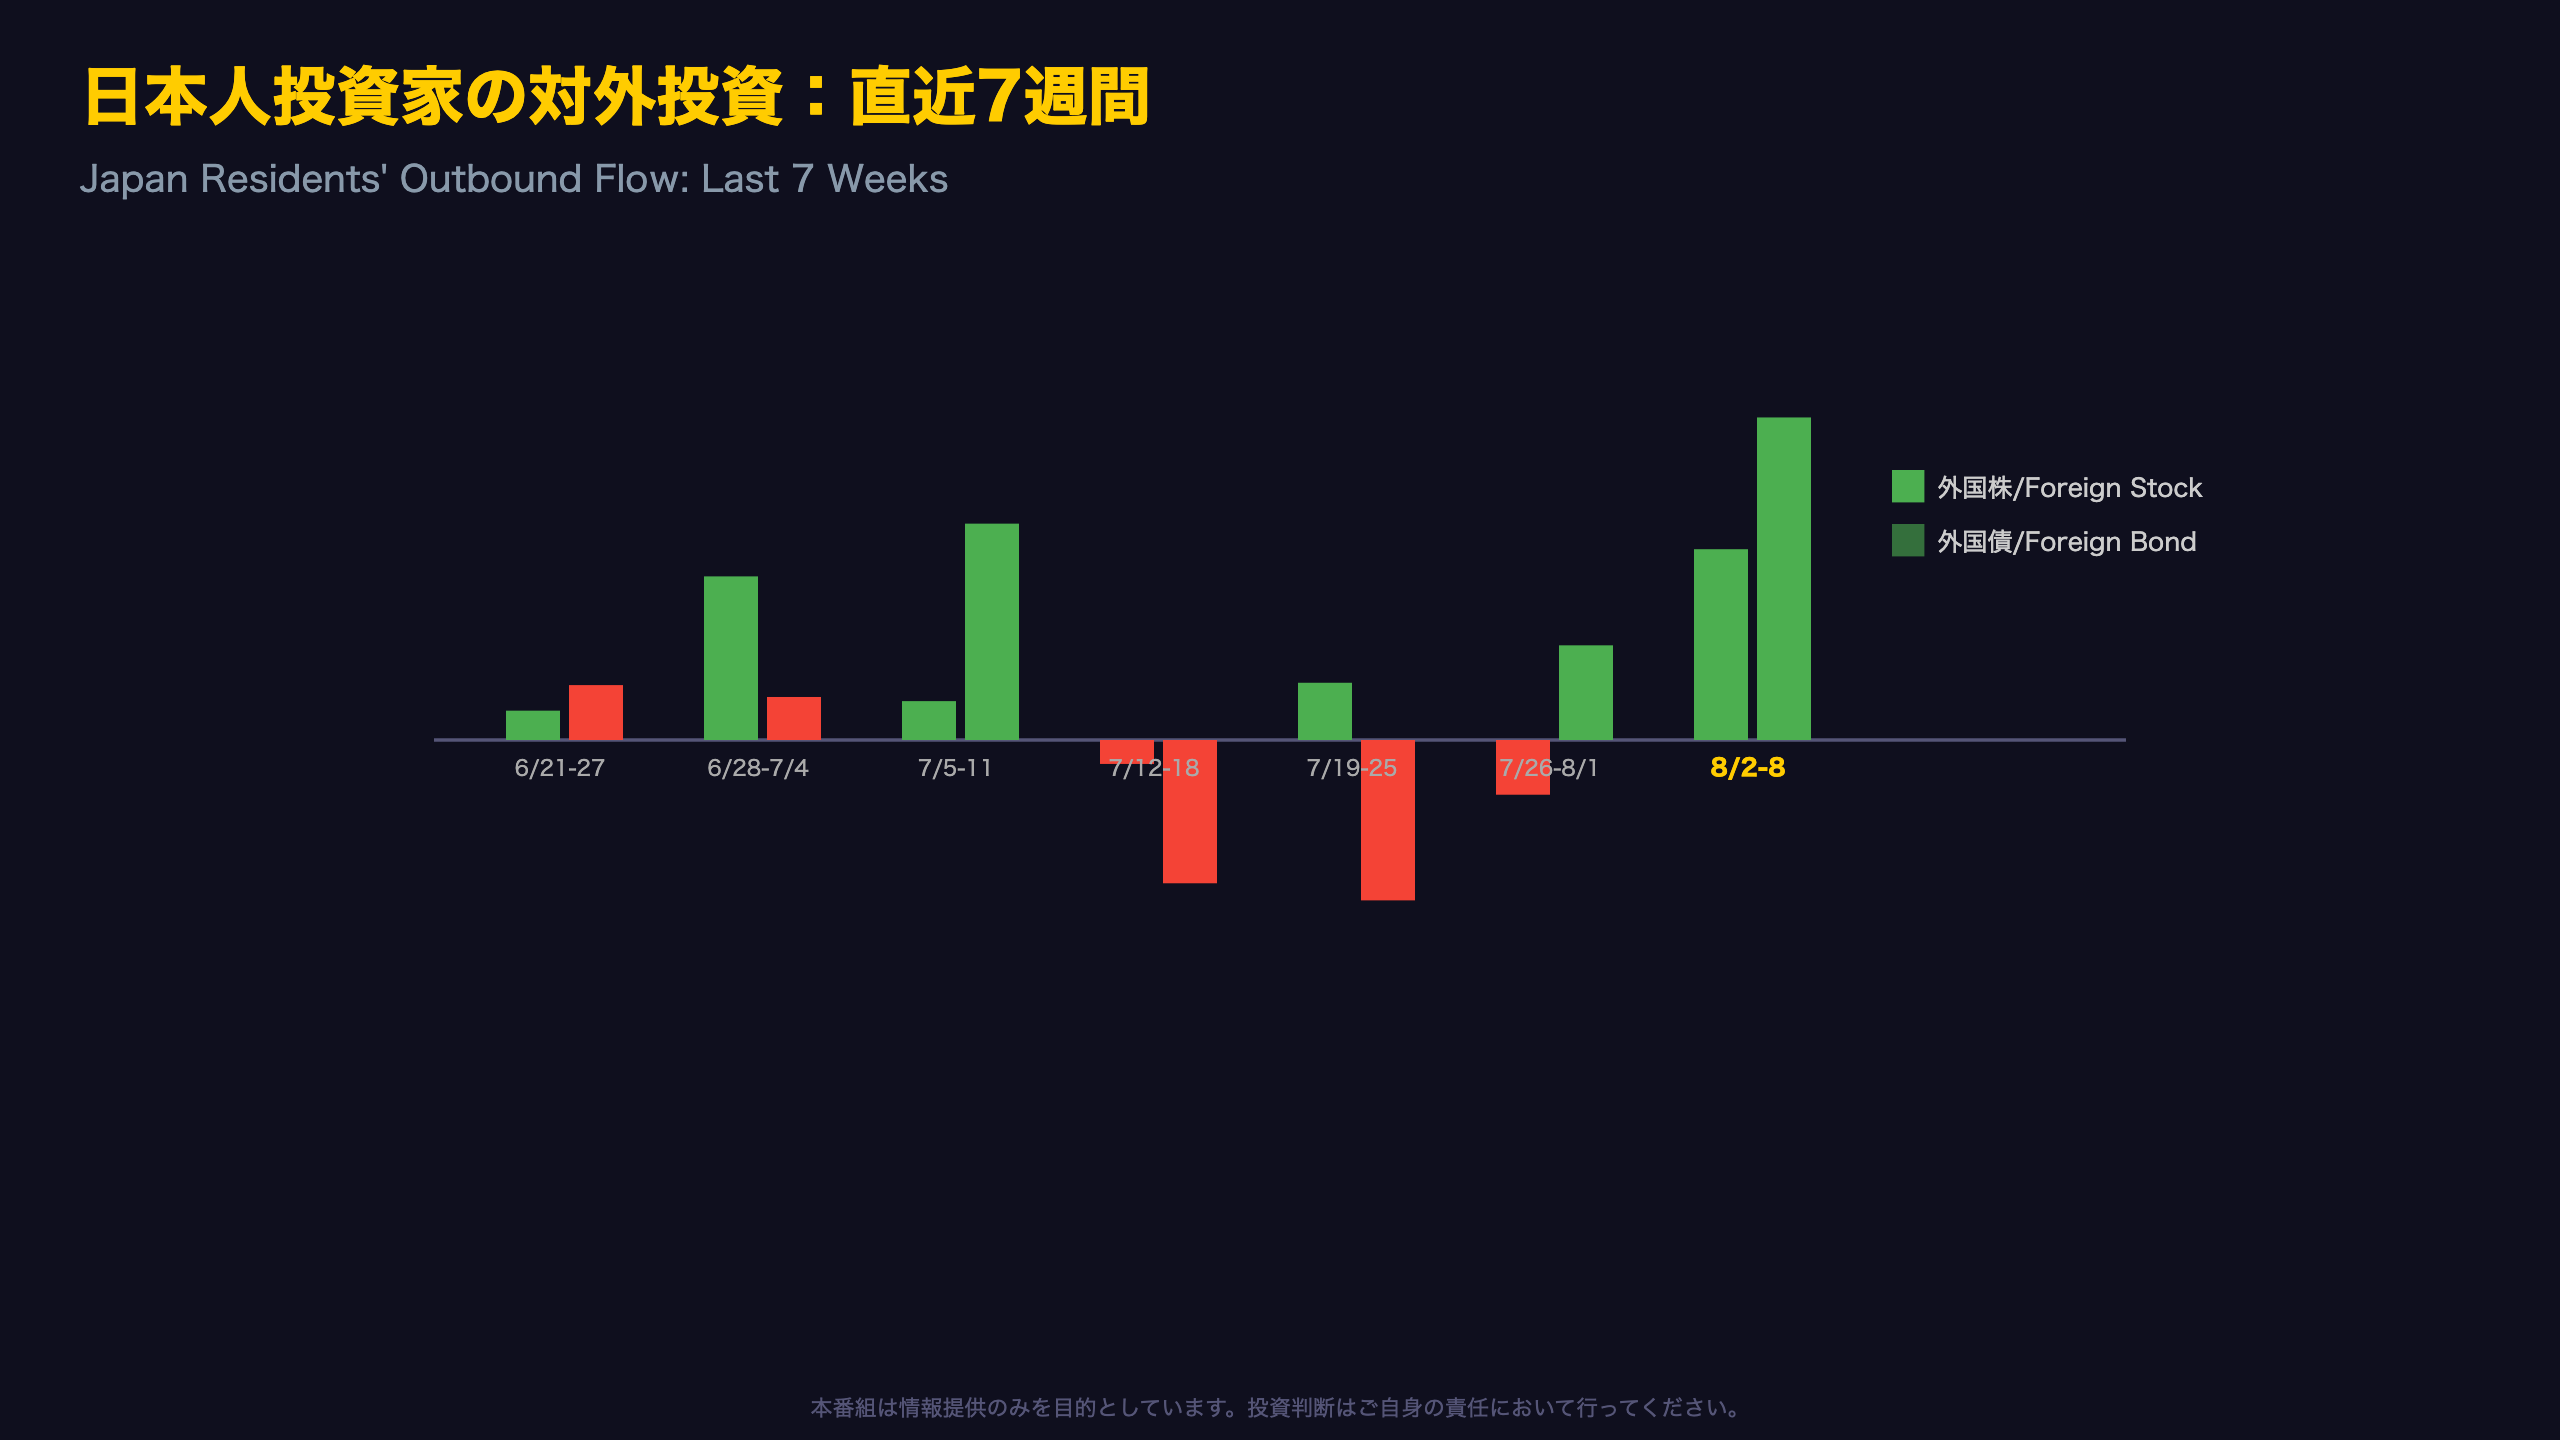
For the week of August 2-8, Japanese residents bought 963.5 billion yen of foreign stocks and 1.63 trillion yen of foreign long-term bonds — both substantial net purchases.
Seven-week trend (¥100mn)
| Week | Foreign Stocks | Foreign L-T Bonds |
|---|---|---|
| Jun 21-27 | +147.8 | -277.5 |
| Jun 28-Jul 4 | +826.6 | -217.3 |
| Jul 5-11 | +196.2 | +1,092.9 |
| Jul 12-18 | -121.3 | -723.7 |
| Jul 19-25 | +289.1 | -810.1 |
| Jul 26-Aug 1 | -276.4 | +477.9 |
| Aug 2-8 | +963.5 | +1,629.4 |
Foreign long-term bond buying roughly tripled week-over-week, while equity flows flipped from net selling to strong net buying.
Context: A historically volatile flow series
Japanese institutional investors — primarily life insurers, pension funds, and banks — have shown highly unstable directional patterns over the past year. Notably, the week of April 26-May 2, 2026 saw a massive ¥2.43 trillion equity sell-off, only to be followed the next week by a ¥1.64 trillion swing into foreign bond buying.
Why this matters globally: Japanese life insurers and pension funds are among the largest holders of foreign bonds (particularly U.S. Treasuries) in the world. Sustained increases in their buying can be a modest tailwind for demand at Treasury auctions, though single-week data cannot confirm a structural shift. An alternative reading is that this is simply a rebalancing after several weeks of net selling — continuation over the next two to three weeks would be needed to validate a trend change.
海外勢、日本売り越し継続も勢いは沈静化
Foreign Selling of Japan: Scale Matters
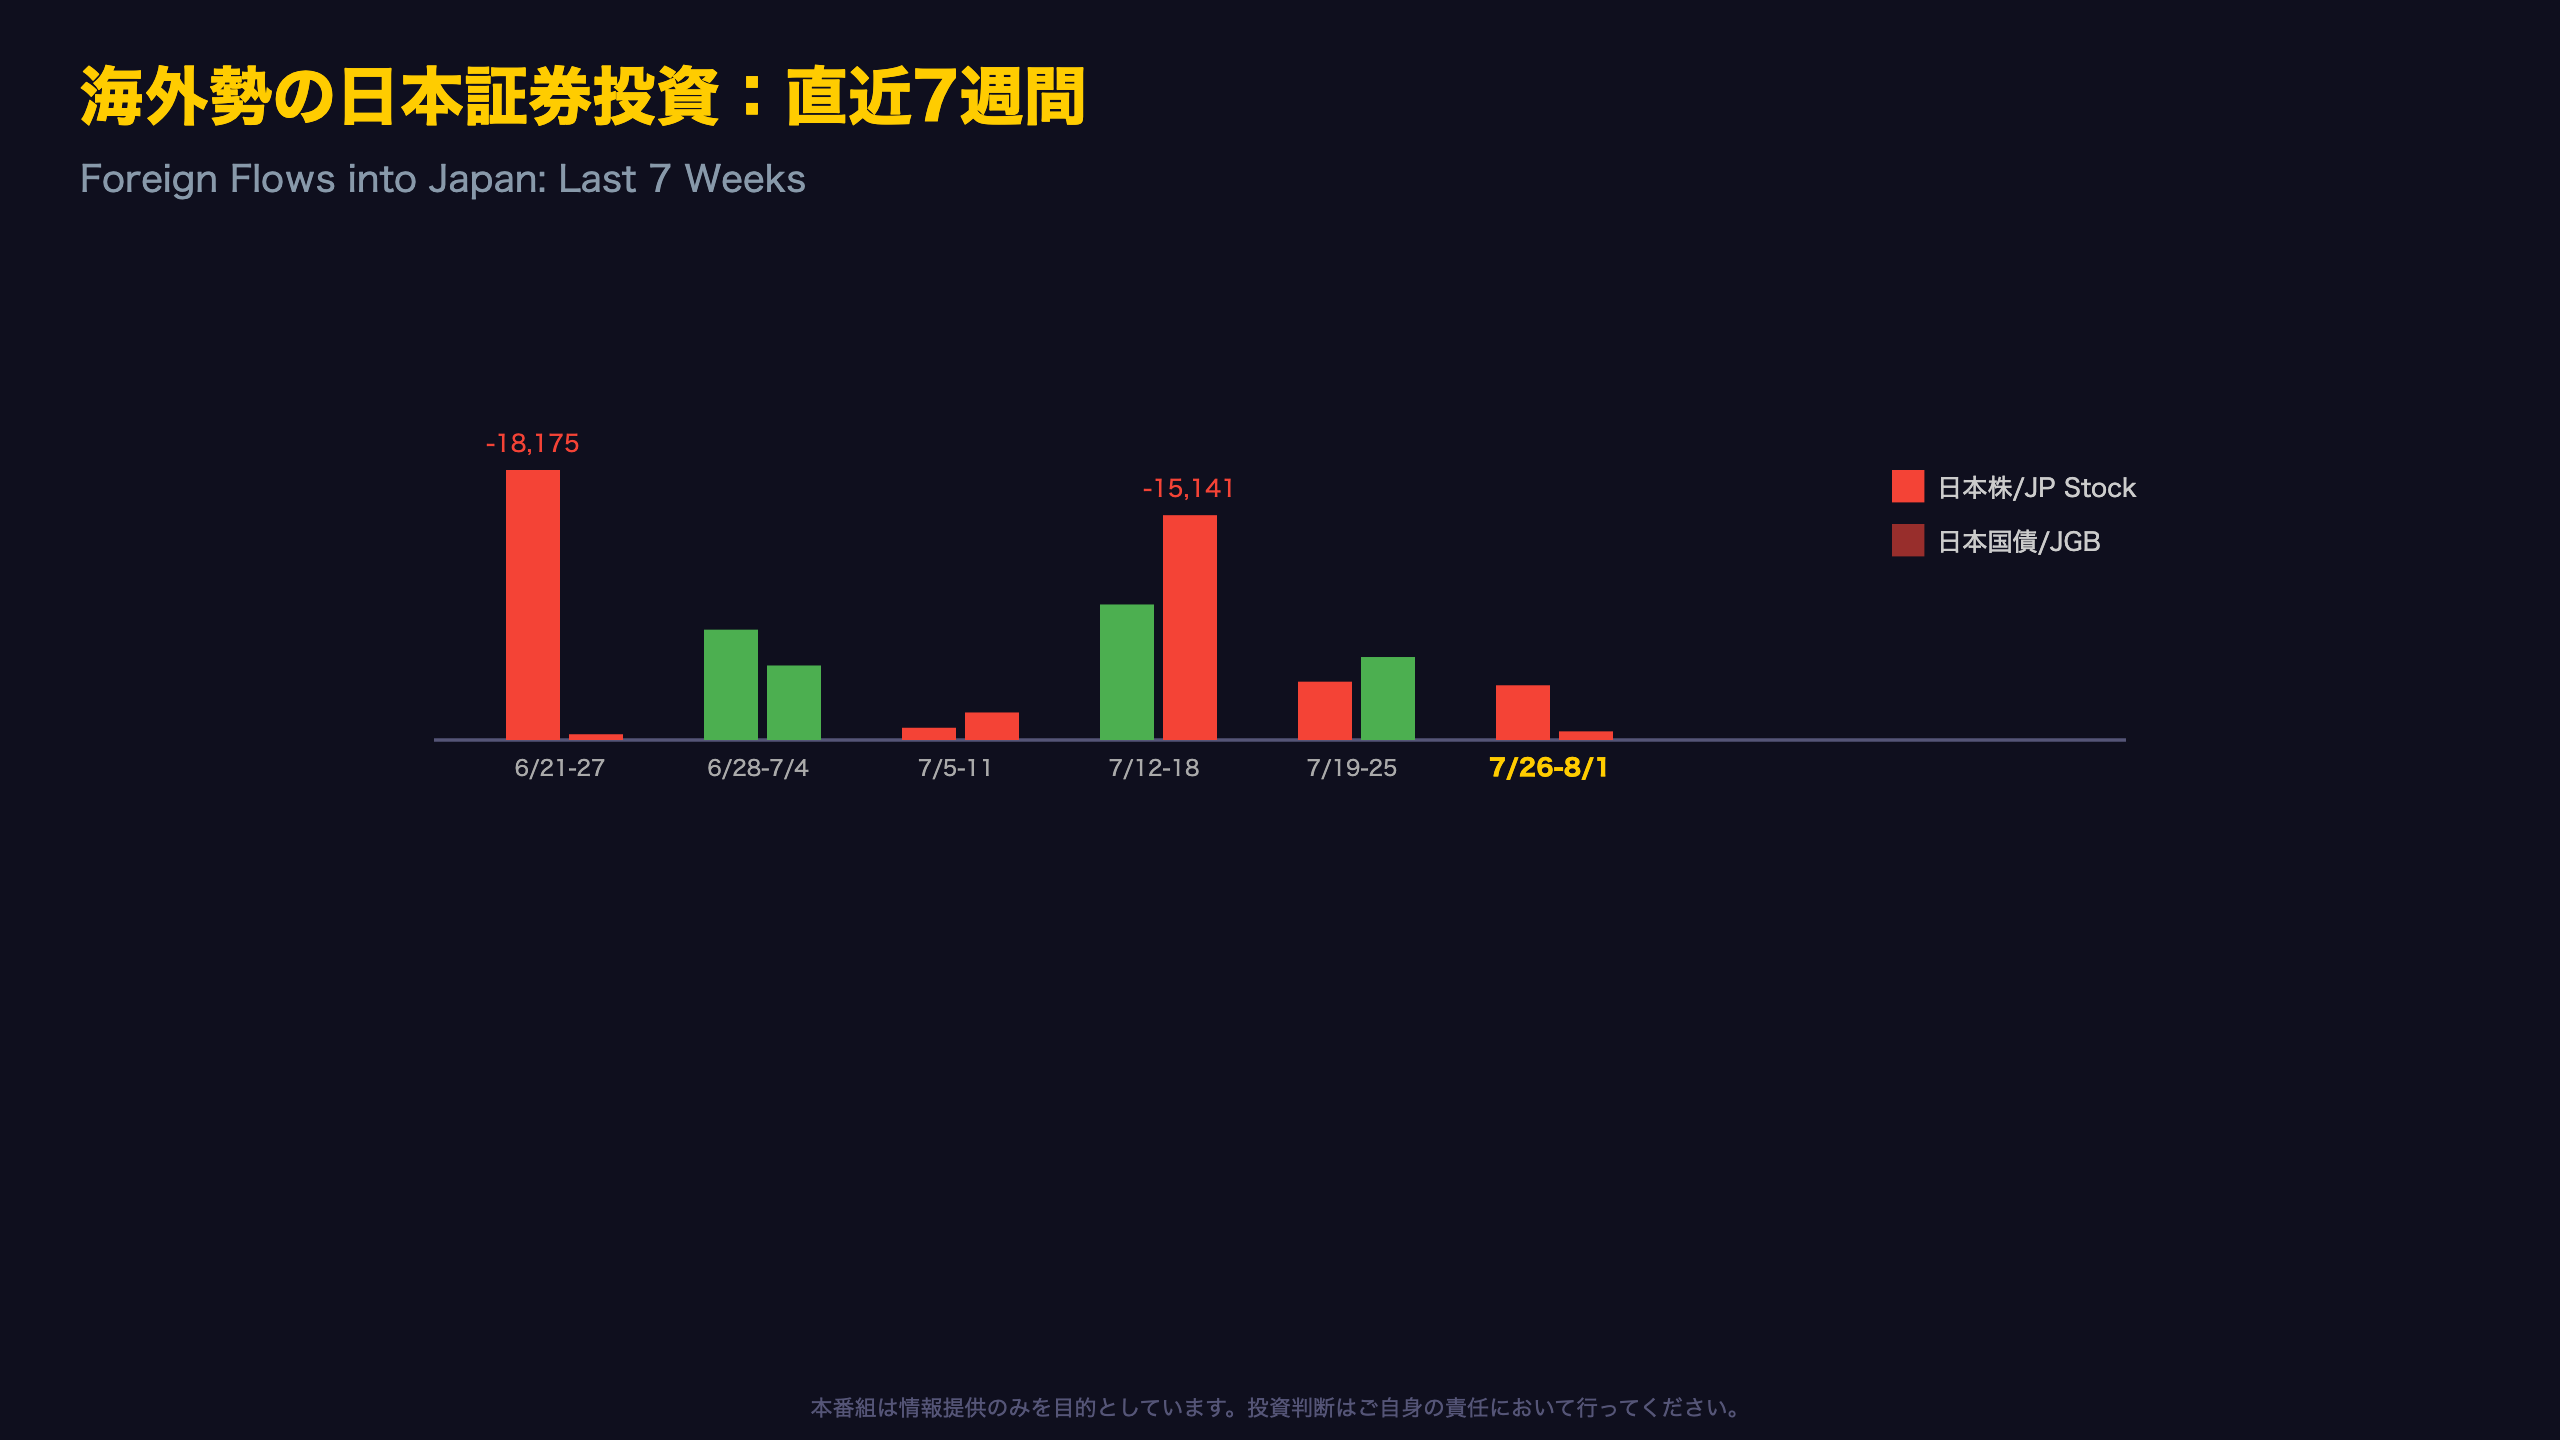
For the week of August 2-8, foreign investors sold ¥368.5bn of Japanese equities and ¥58.7bn of long-term JGBs — the second consecutive week of net outflow from Japan.
The short-term bond swing
The most notable move is in short-term bonds (BondS), a category often used for FX-hedged arbitrage and carry-trade positioning:
| Week | Short-Term Bond Flow (¥100mn) |
|---|---|
| Jul 19-25 | -2,882.4 |
| Jul 26-Aug 1 | -292.9 |
| Aug 2-8 | +215.9 |
The ¥2.88 trillion sell-off in the week of July 19-25 stands out as one of the largest moves in the past year for this category. That selling pressure has since cooled sharply and flipped to net buying — a pattern consistent with the unwinding of speculative or hedged carry positions reaching completion.
Equity selling in perspective
Comparing across the year, foreign equity selling hit ¥1.82 trillion in the week of June 21-27 — roughly five times the scale of the latest week’s ¥368.5bn.
Context for international readers: This MOF weekly series is closely watched by Japan-focused fund managers because it offers a rare, high-frequency (weekly) window into foreign positioning in JGBs and Japanese equities — comparable in usefulness to the U.S. Treasury’s TIC data, but published faster. The current pattern — continued but shrinking outflows — argues against reading this as a panic-driven capital flight from Japan.
6円超の円高はどこから?7月25日を境にした転換点
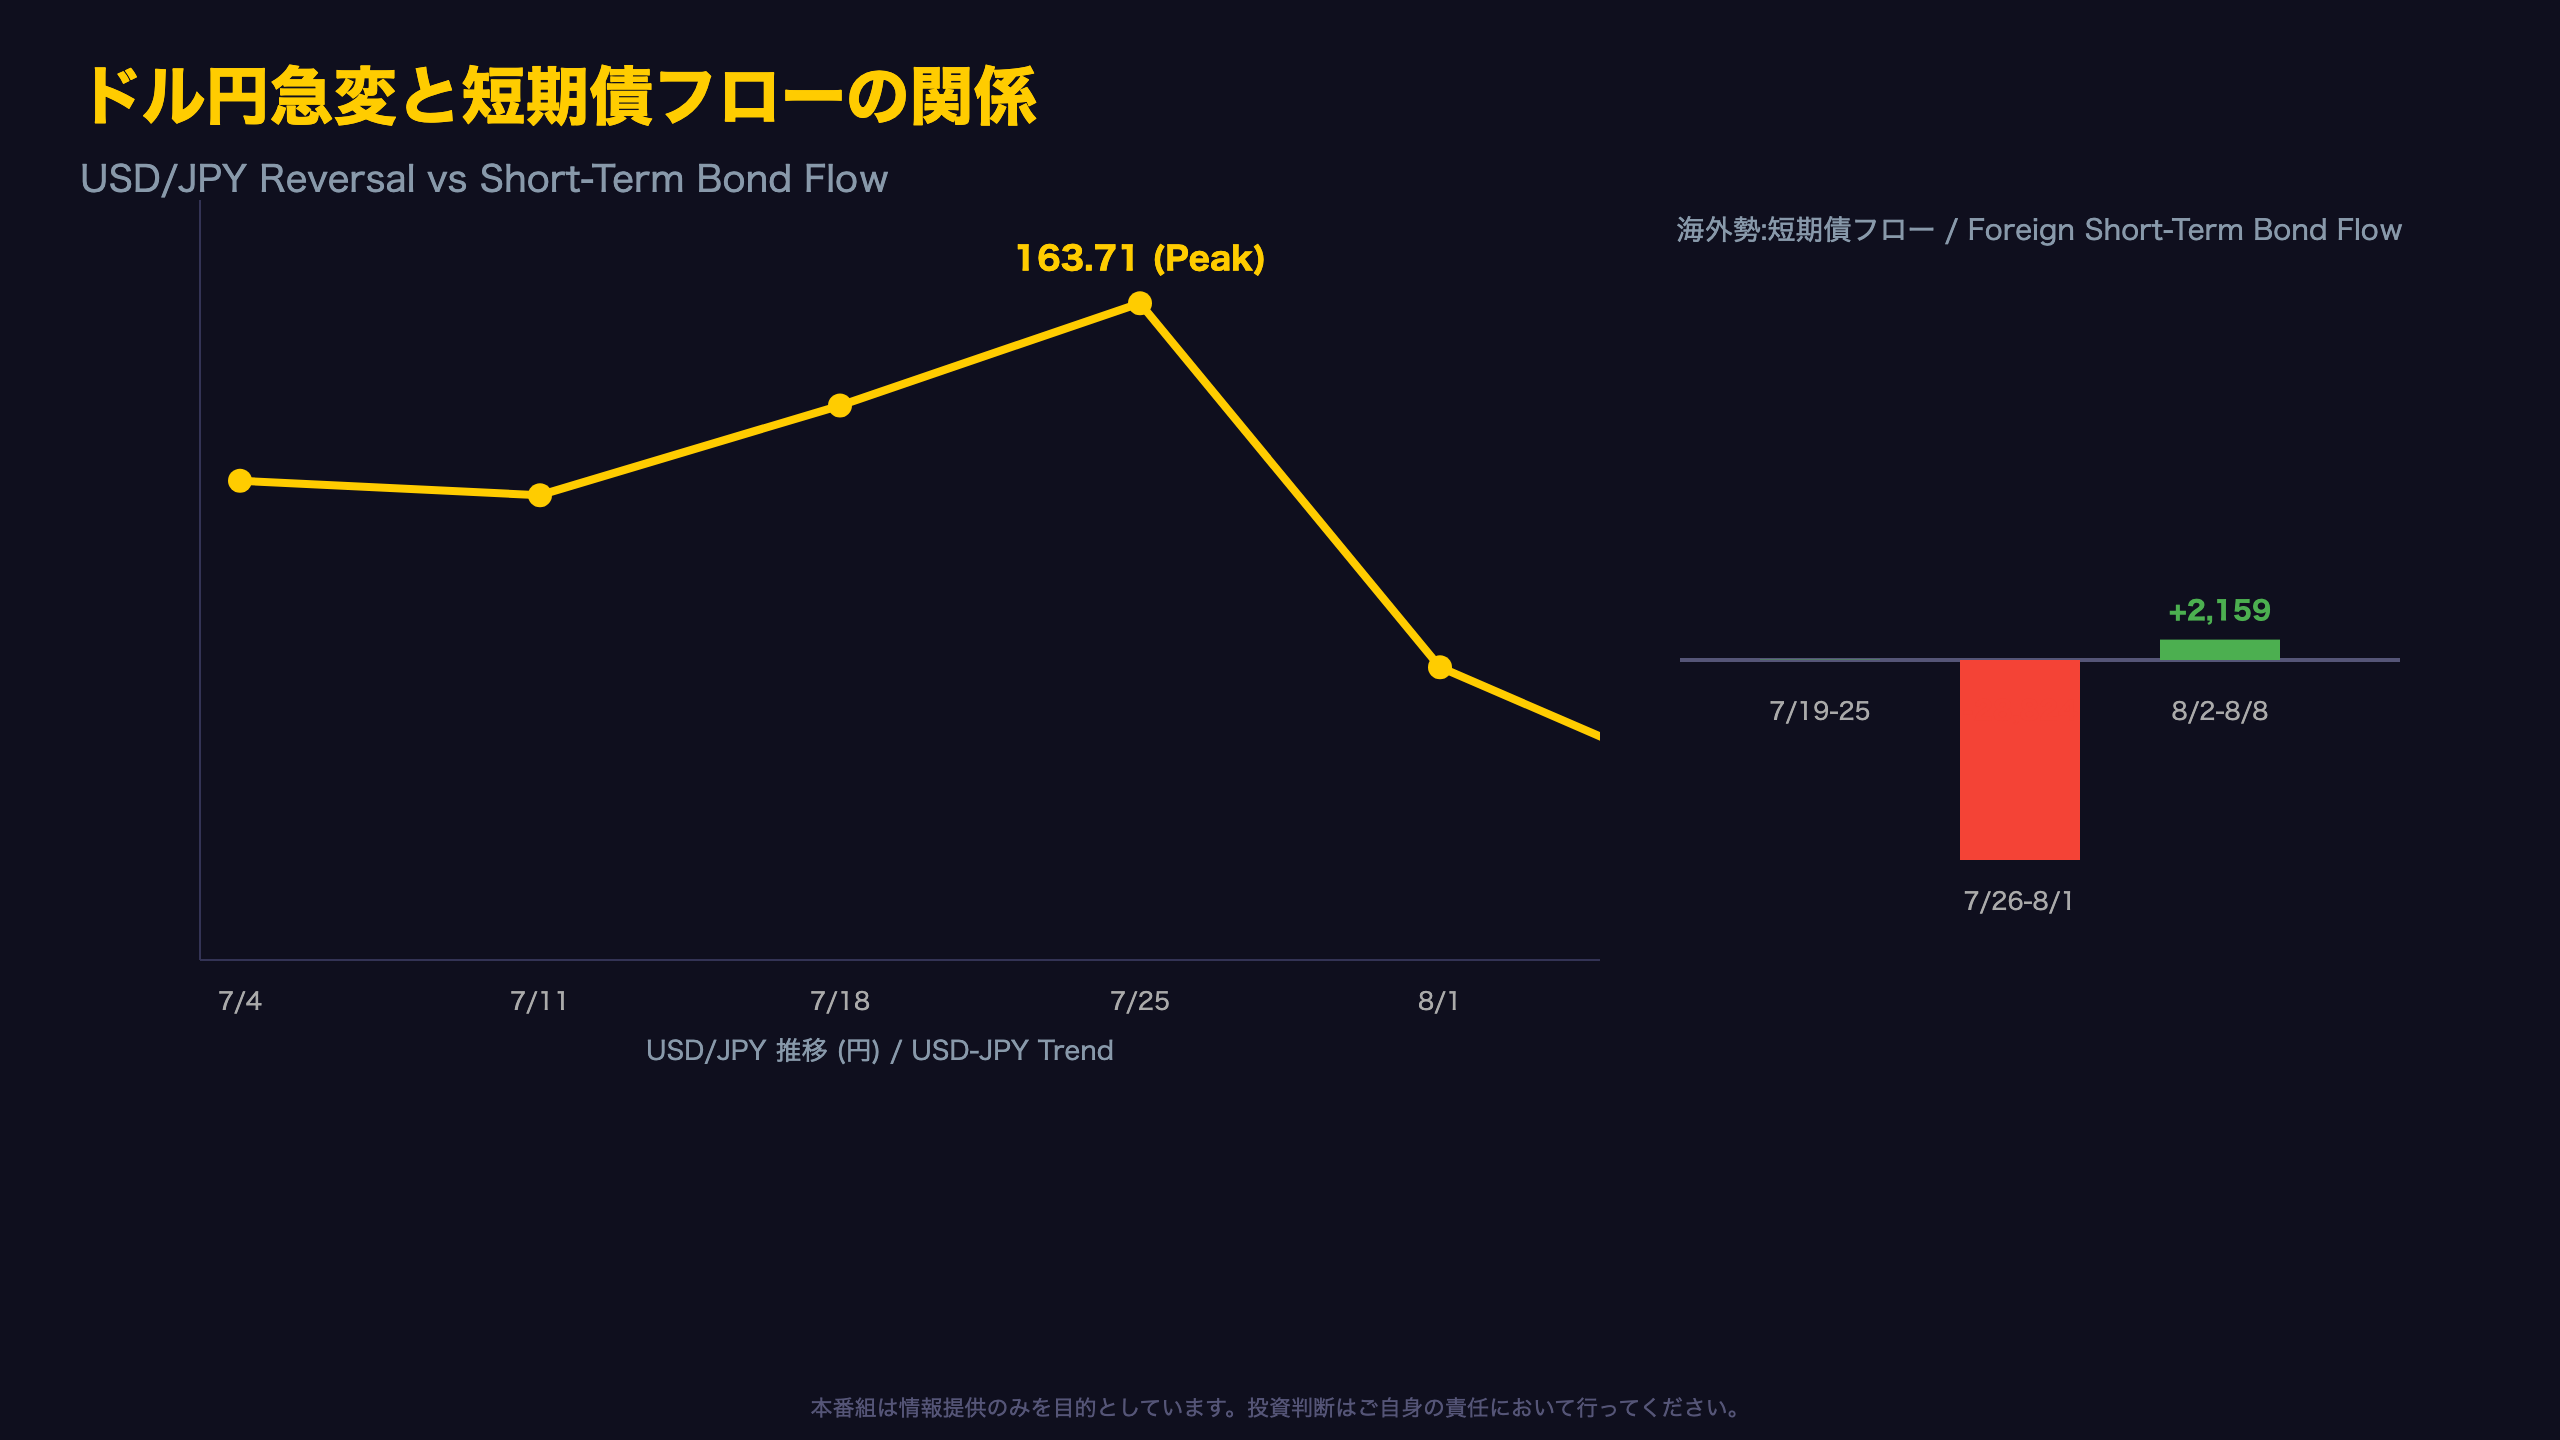
Decoding the USD/JPY Swing: The July 25 Turning Point
USD/JPY peaked at 163.71 on July 25, then fell to 157.54 within two weeks — a move of 6.17 yen.
Flow and FX timeline
| Week | USD/JPY | Foreign Short-Term Bonds (¥100mn) | Foreign L-T Bonds (¥100mn) |
|---|---|---|---|
| Jul 19-25 | 163.71 | -2,882.4 | -1,514.1 |
| Jul 26-Aug 1 | 159.16 | -292.9 | +558.9 |
| Aug 2-8 | 157.54 | +215.9 | -58.7 |
The week of July 19-25 saw heavy foreign selling across both short-term and long-term JGBs, immediately preceding the yen’s reversal to strength.
Reading the signal carefully: Short-term JGBs are frequently used in FX-hedged arbitrage and carry-trade structures. A sudden reduction in selling could suggest an unwind of speculative positions was largely completing — but this is a level-C inference (a plausible contributing factor, not a confirmed cause).
Why over-attribution is risky: FX moves of this magnitude typically reflect multiple simultaneous forces — shifts in expected Fed-BOJ rate differentials, speculation about BOJ policy normalization, and broader risk sentiment — that this weekly flow report alone cannot isolate. Readers familiar with U.S. TIC data will recognize this limitation; portfolio flow data is a useful but incomplete lens on FX.
What to watch next: Whether short-term bond flows stay in positive territory and whether Japanese residents’ outbound buying persists will be the next data points to confirm or challenge this narrative.
過去1年の資金フロー、日本勢の対外投資は一貫も振れ幅大
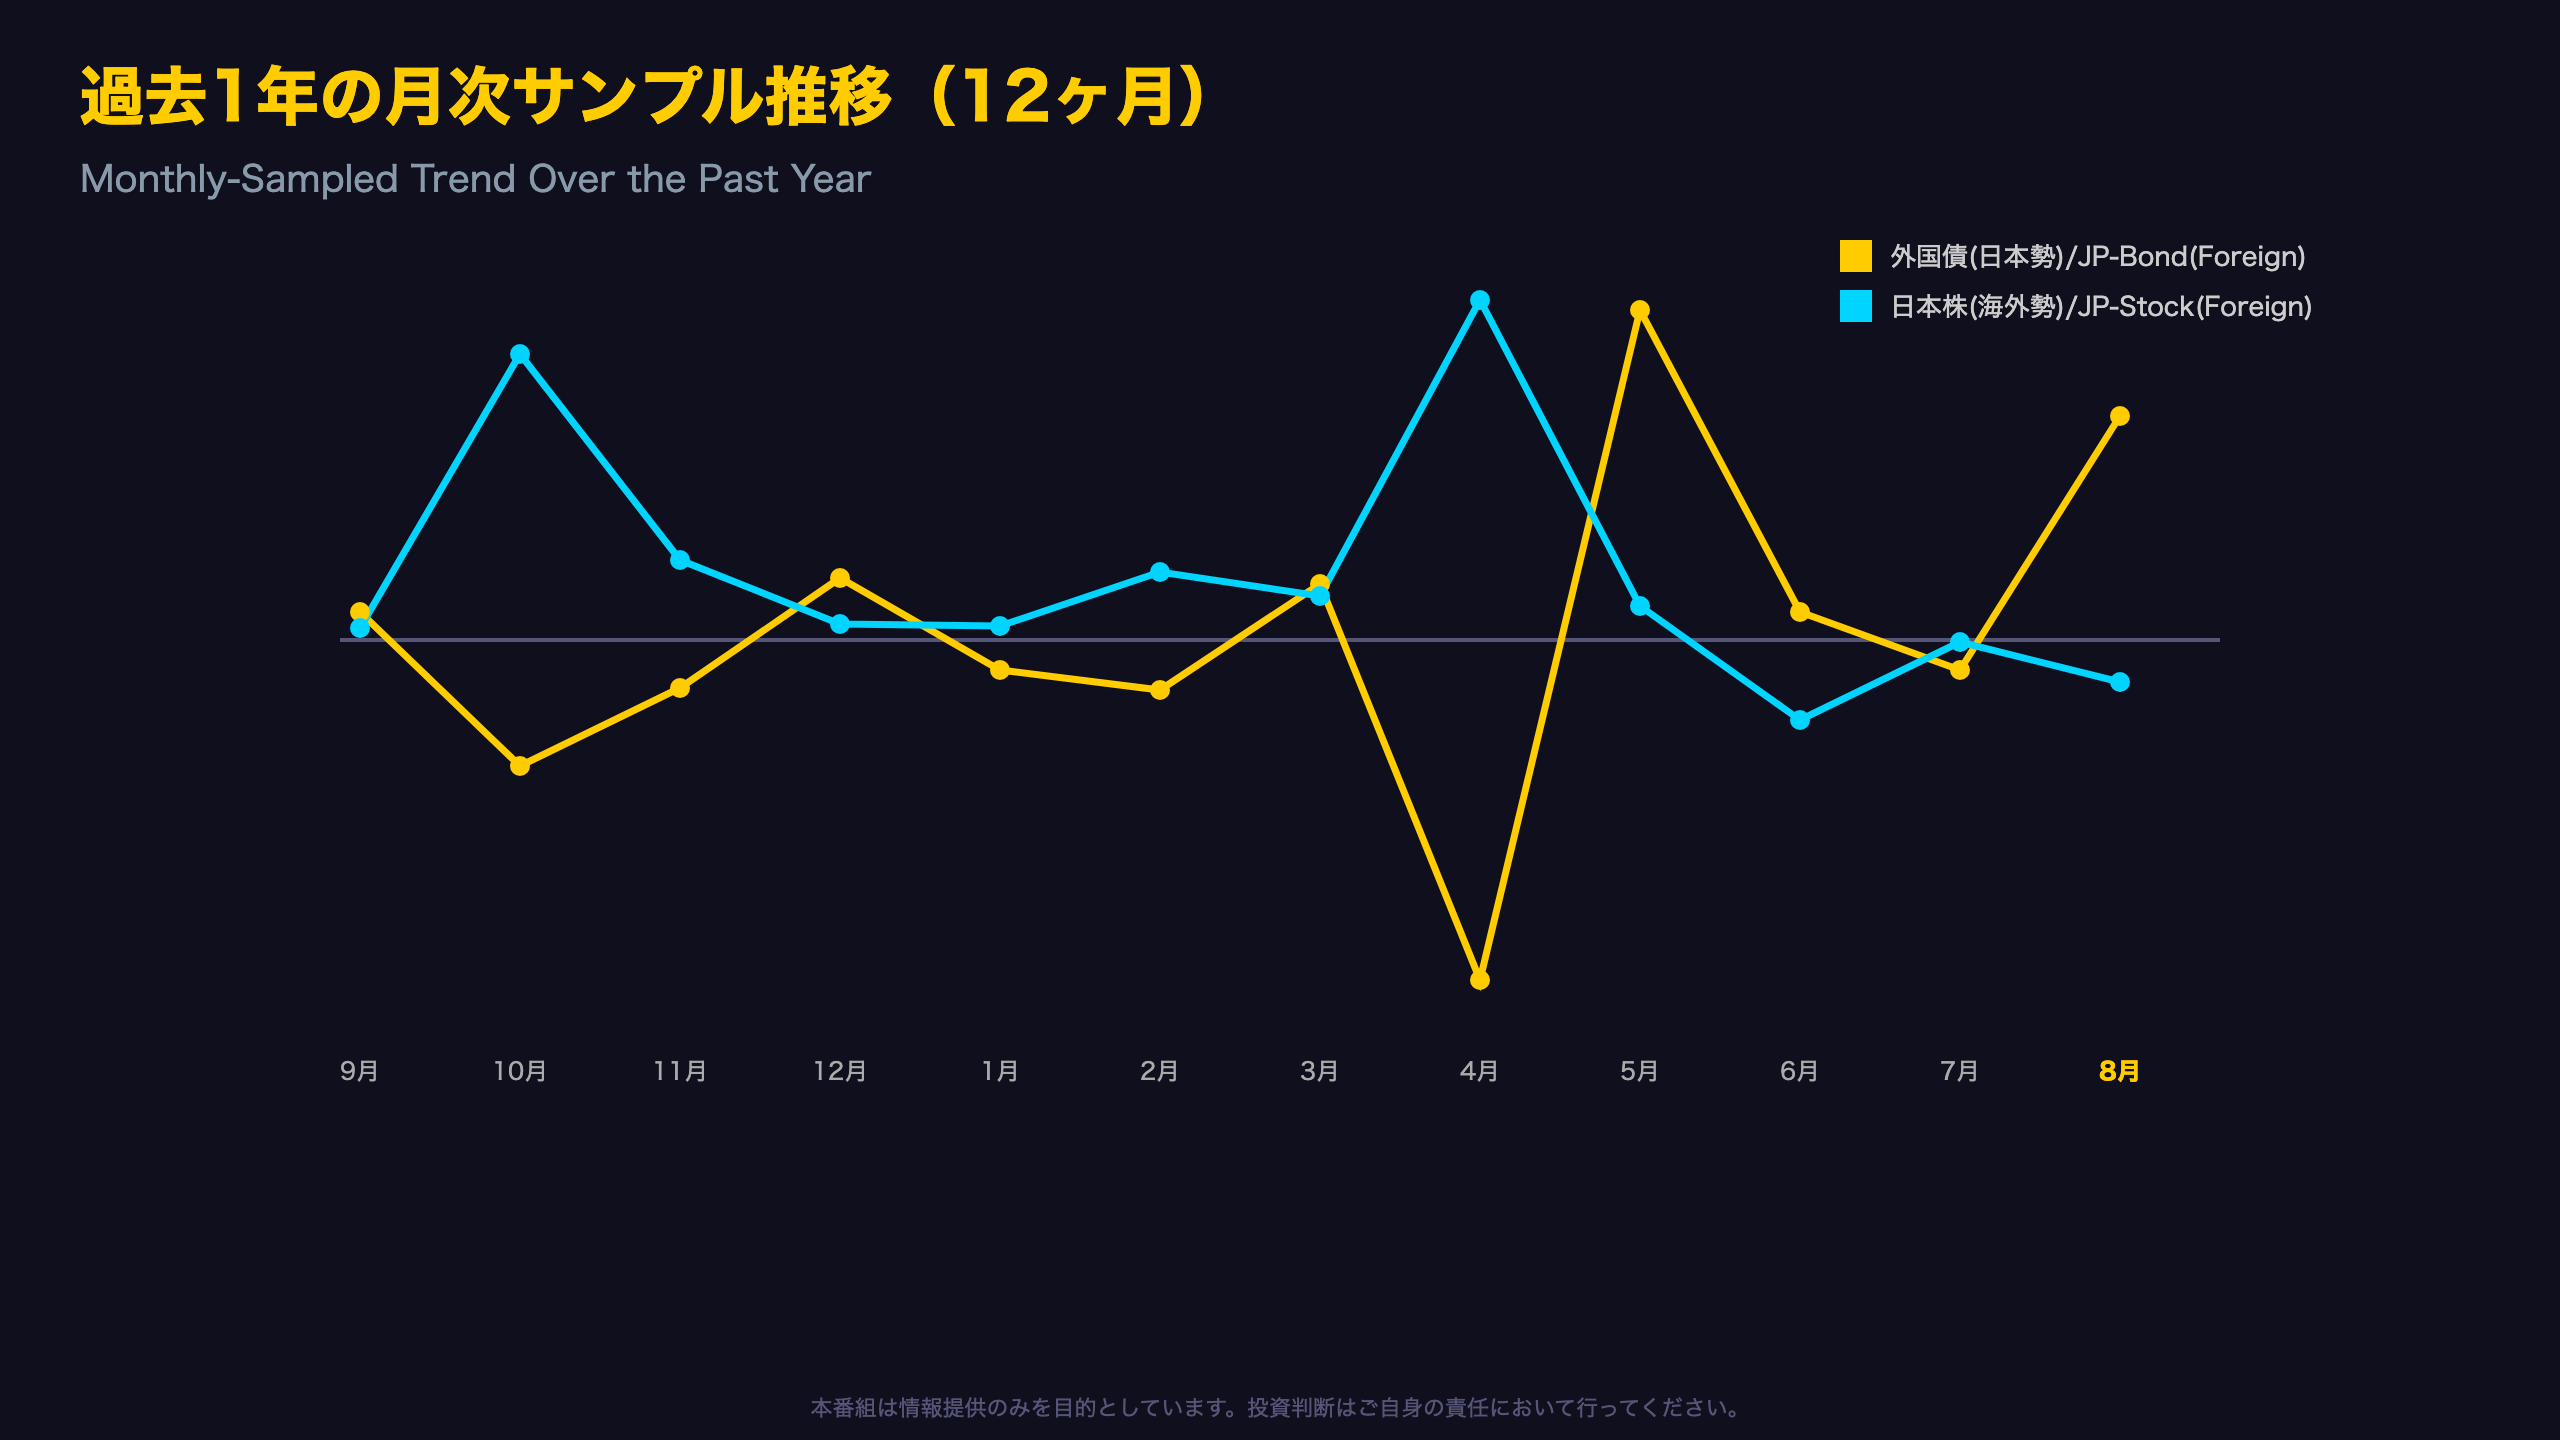
One-Year Overview: The Case for Caution on Weekly Noise
Sampling one representative week per month over the past year reveals just how volatile Japan’s weekly securities flow data can be.
Sampled data (¥100mn)
| Period | Foreign L-T Bonds (Japan) | JP Stocks (Foreign) |
|---|---|---|
| Sep 2025 | +210.0 | +108.6 |
| Oct 2025 | -923.6 | +2,476.1 |
| Nov 2025 | -354.5 | +690.1 |
| Dec 2025 | +447.7 | +134.6 |
| Jan 2026 | -223.7 | +124.9 |
| Feb 2026 | -359.6 | +591.4 |
| Mar 2026 | +404.4 | +385.5 |
| Apr 2026 | -2,478.9 | +2,951.8 |
| May 2026 | +2,406.4 | +301.5 |
| Jun 2026 | +209.6 | -700.6 |
| Jul 2026 | -217.3 | -21.3 |
| Aug 2026 | +1,629.4 | -368.5 |
Between April and May 2026 alone, the foreign long-term bond flow swung from -¥2.48tn to +¥2.41tn — an almost ¥4.9tn reversal within a single month.
Institutional context for global readers: This kind of extreme month-to-month volatility is often linked to fiscal year-end rebalancing among Japanese life insurers and pension funds (Japan’s fiscal year ends March 31), or shifts in currency hedge ratios on foreign bond holdings — though the source data does not identify specific institutional actors.
Foreign investment in Japanese equities also hit its most extreme point of the year in the week of March 22-28, 2026, with a ¥4.45tn sell-off (visible in the full underlying dataset, though not sampled above).
Bottom line for analysts: Given this noise level, single-week readings should always be triangulated against 4-week moving averages or MOF’s monthly aggregate release (International Transactions in Securities) before drawing directional conclusions — a practice similar to how U.S. analysts treat weekly TIC flow estimates versus the monthly Treasury International Capital report.
市場へのインプリケーション:フローと為替の乖離をどう読むか
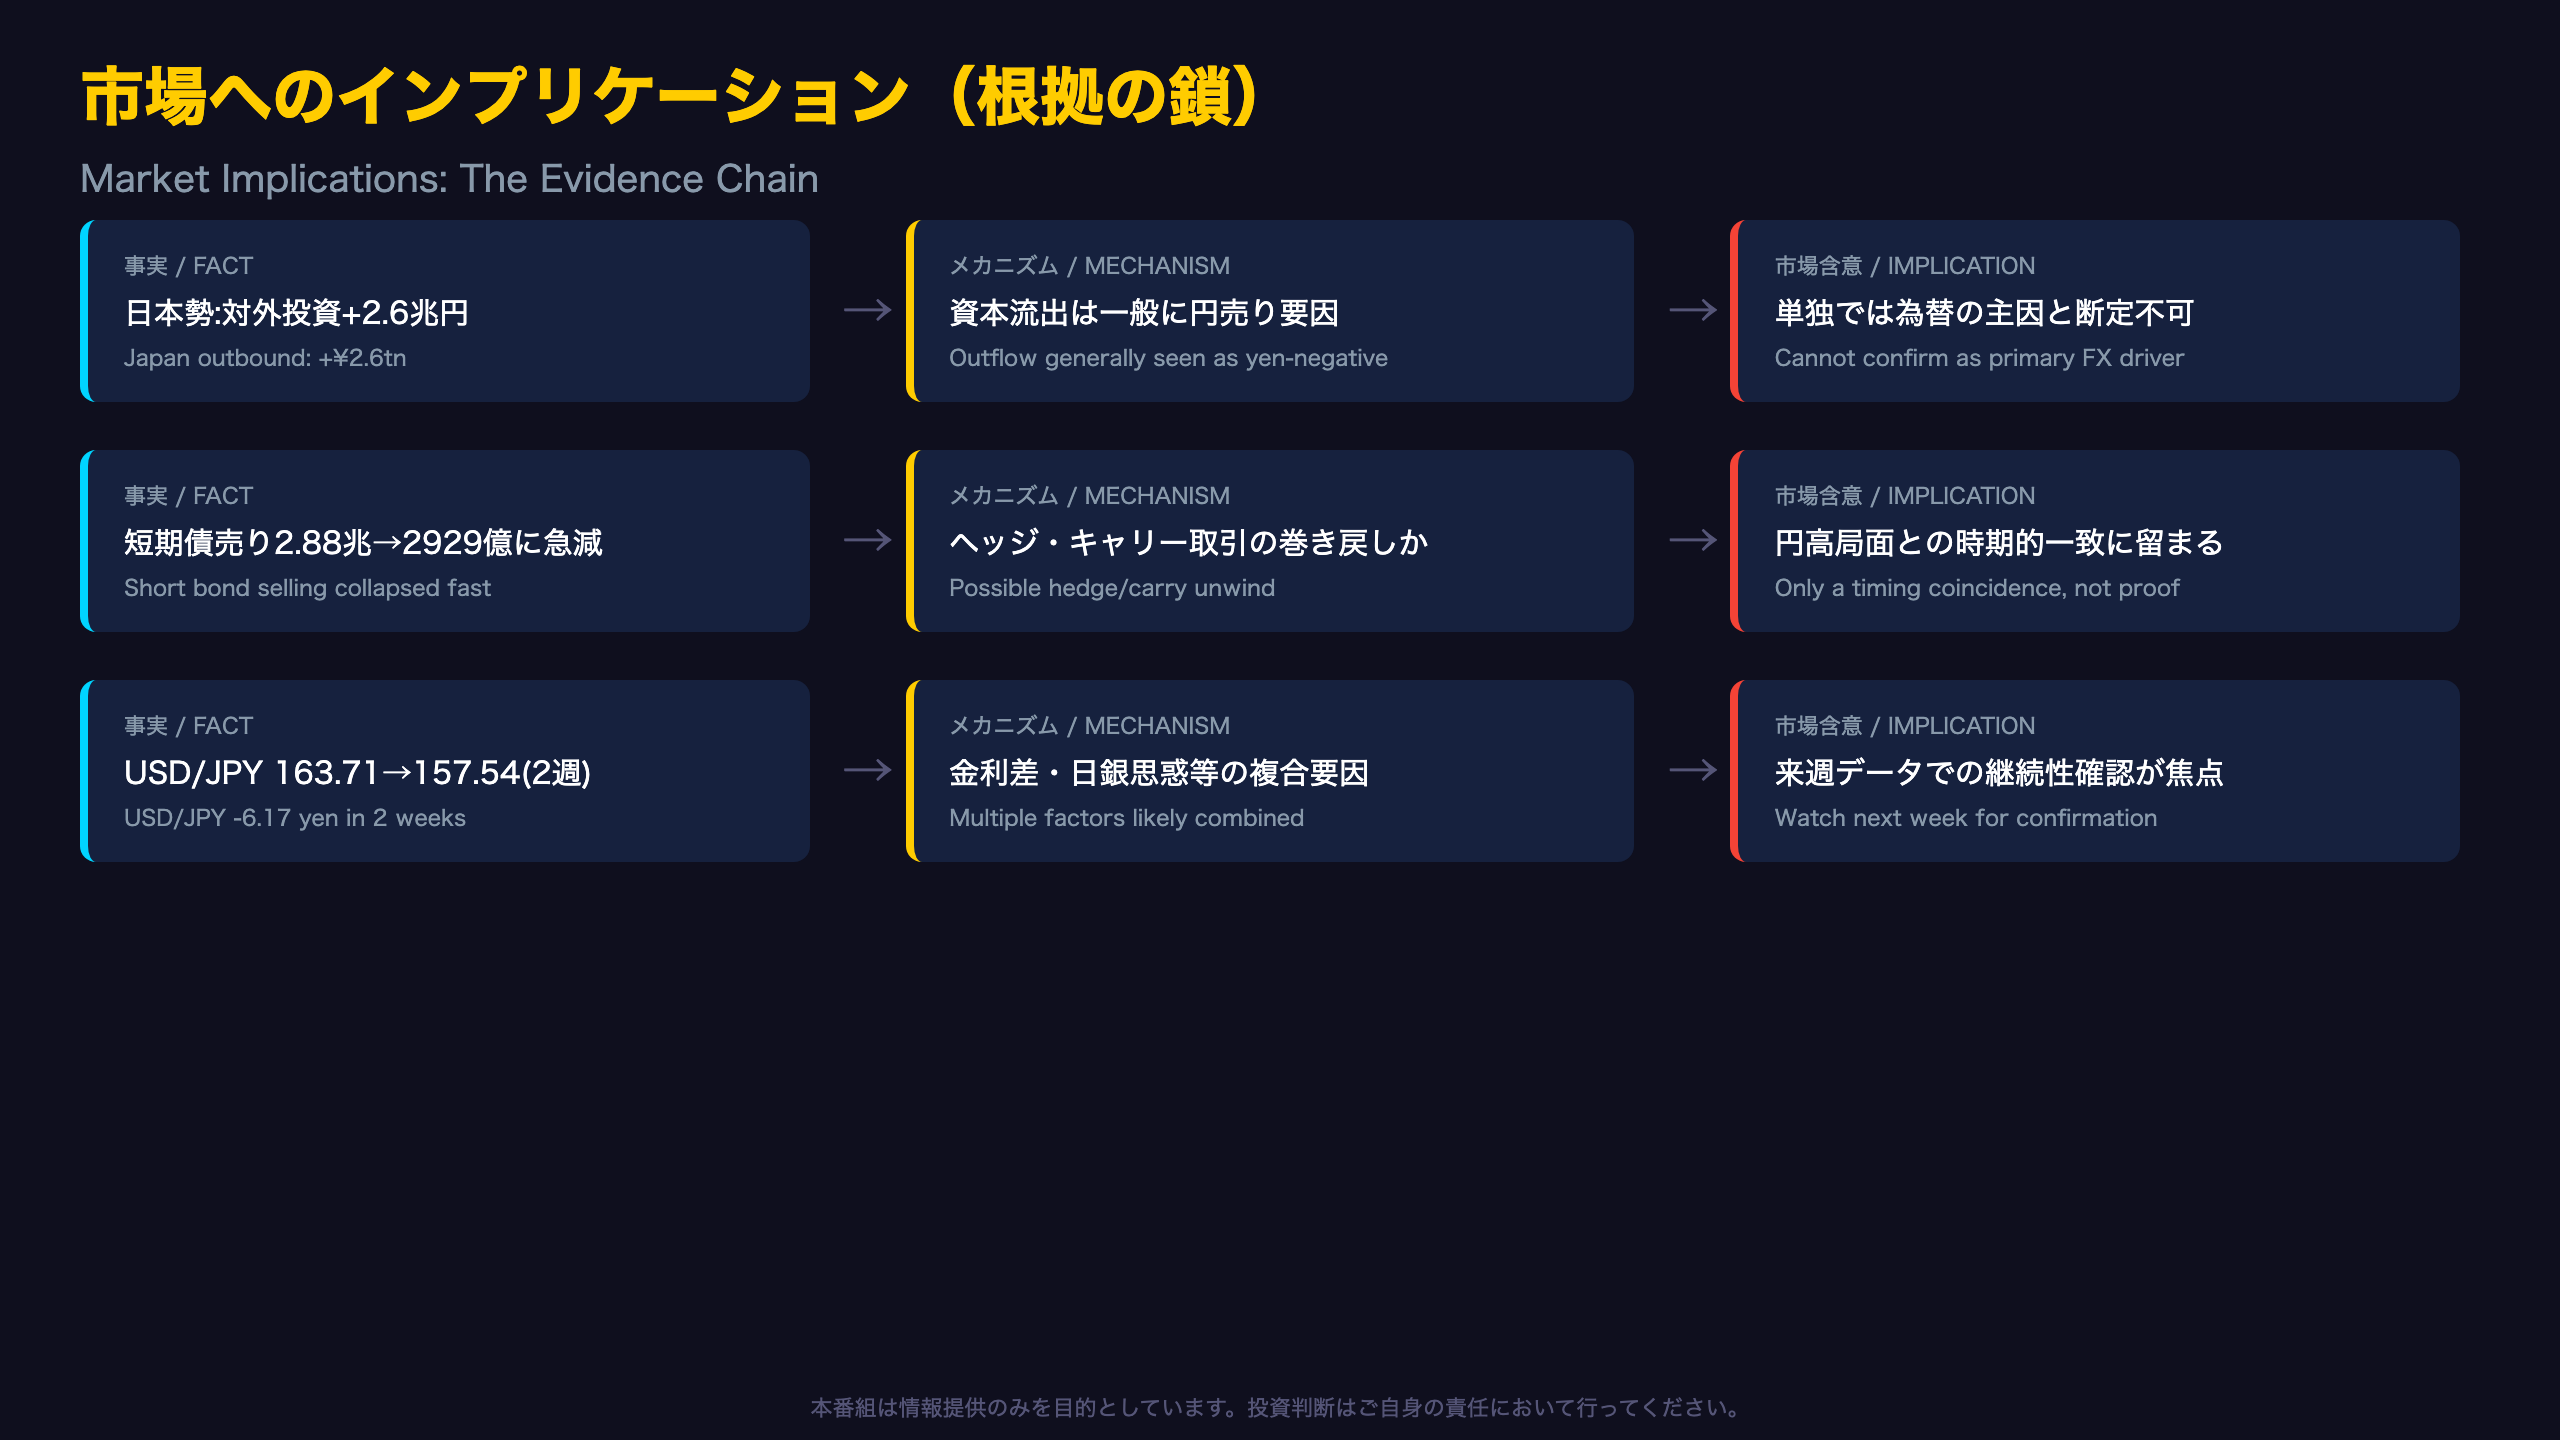
Synthesis: What the Flow-FX Divergence Means Going Forward
The defining feature of this week’s release is the coexistence of two seemingly contradictory facts: an expansion in Japanese residents’ outbound investment (traditionally yen-negative) and an actual strengthening of the yen.
The evidence chain
- [Fact] Japanese residents bought a combined ¥2.59 trillion of foreign securities → [Mechanism] Capital outflows are generally considered yen-negative → [Market implication] However, this data alone cannot confirm that this outflow was the primary driver of the FX move.
- [Fact] Foreign short-term bond selling swelled to ¥2.88 trillion in the week of July 19-25, then collapsed to ¥292.9bn the next week → [Mechanism] Short-term JGBs are commonly used in hedged arbitrage and carry-trade structures → [Market implication] The timing suggests position unwinding may have coincided with the yen’s reversal, but causation cannot be confirmed.
- [Fact] USD/JPY fell 6.17 yen from 163.71 to 157.54 in two weeks → [Mechanism] Multiple factors — rate-differential expectations, risk sentiment, and BOJ policy signals — are generally understood to interact in driving such moves → [Market implication] This flow dataset alone cannot isolate the dominant cause.
What to watch next
The next MOF weekly release (covering August 9-15) will be important for confirming whether Japanese outbound investment continues its three-week expansion, and whether foreign selling of Japanese stocks and bonds reverses. Cross-referencing with Japan’s monthly Balance of Payments statistics — which international readers may find more familiar, akin to the U.S. Treasury’s TIC report — would also help filter out weekly noise and validate whether this week’s pattern reflects a genuine shift or transient rebalancing.
Disclaimer: This article is for informational purposes only. All investment decisions are made solely at your own risk.







