📺 Watch the Full Video Analysis
This article was automatically generated by the NFC Market Live AI analysis system. (Updated: 2026-07-04 09:44 JST)
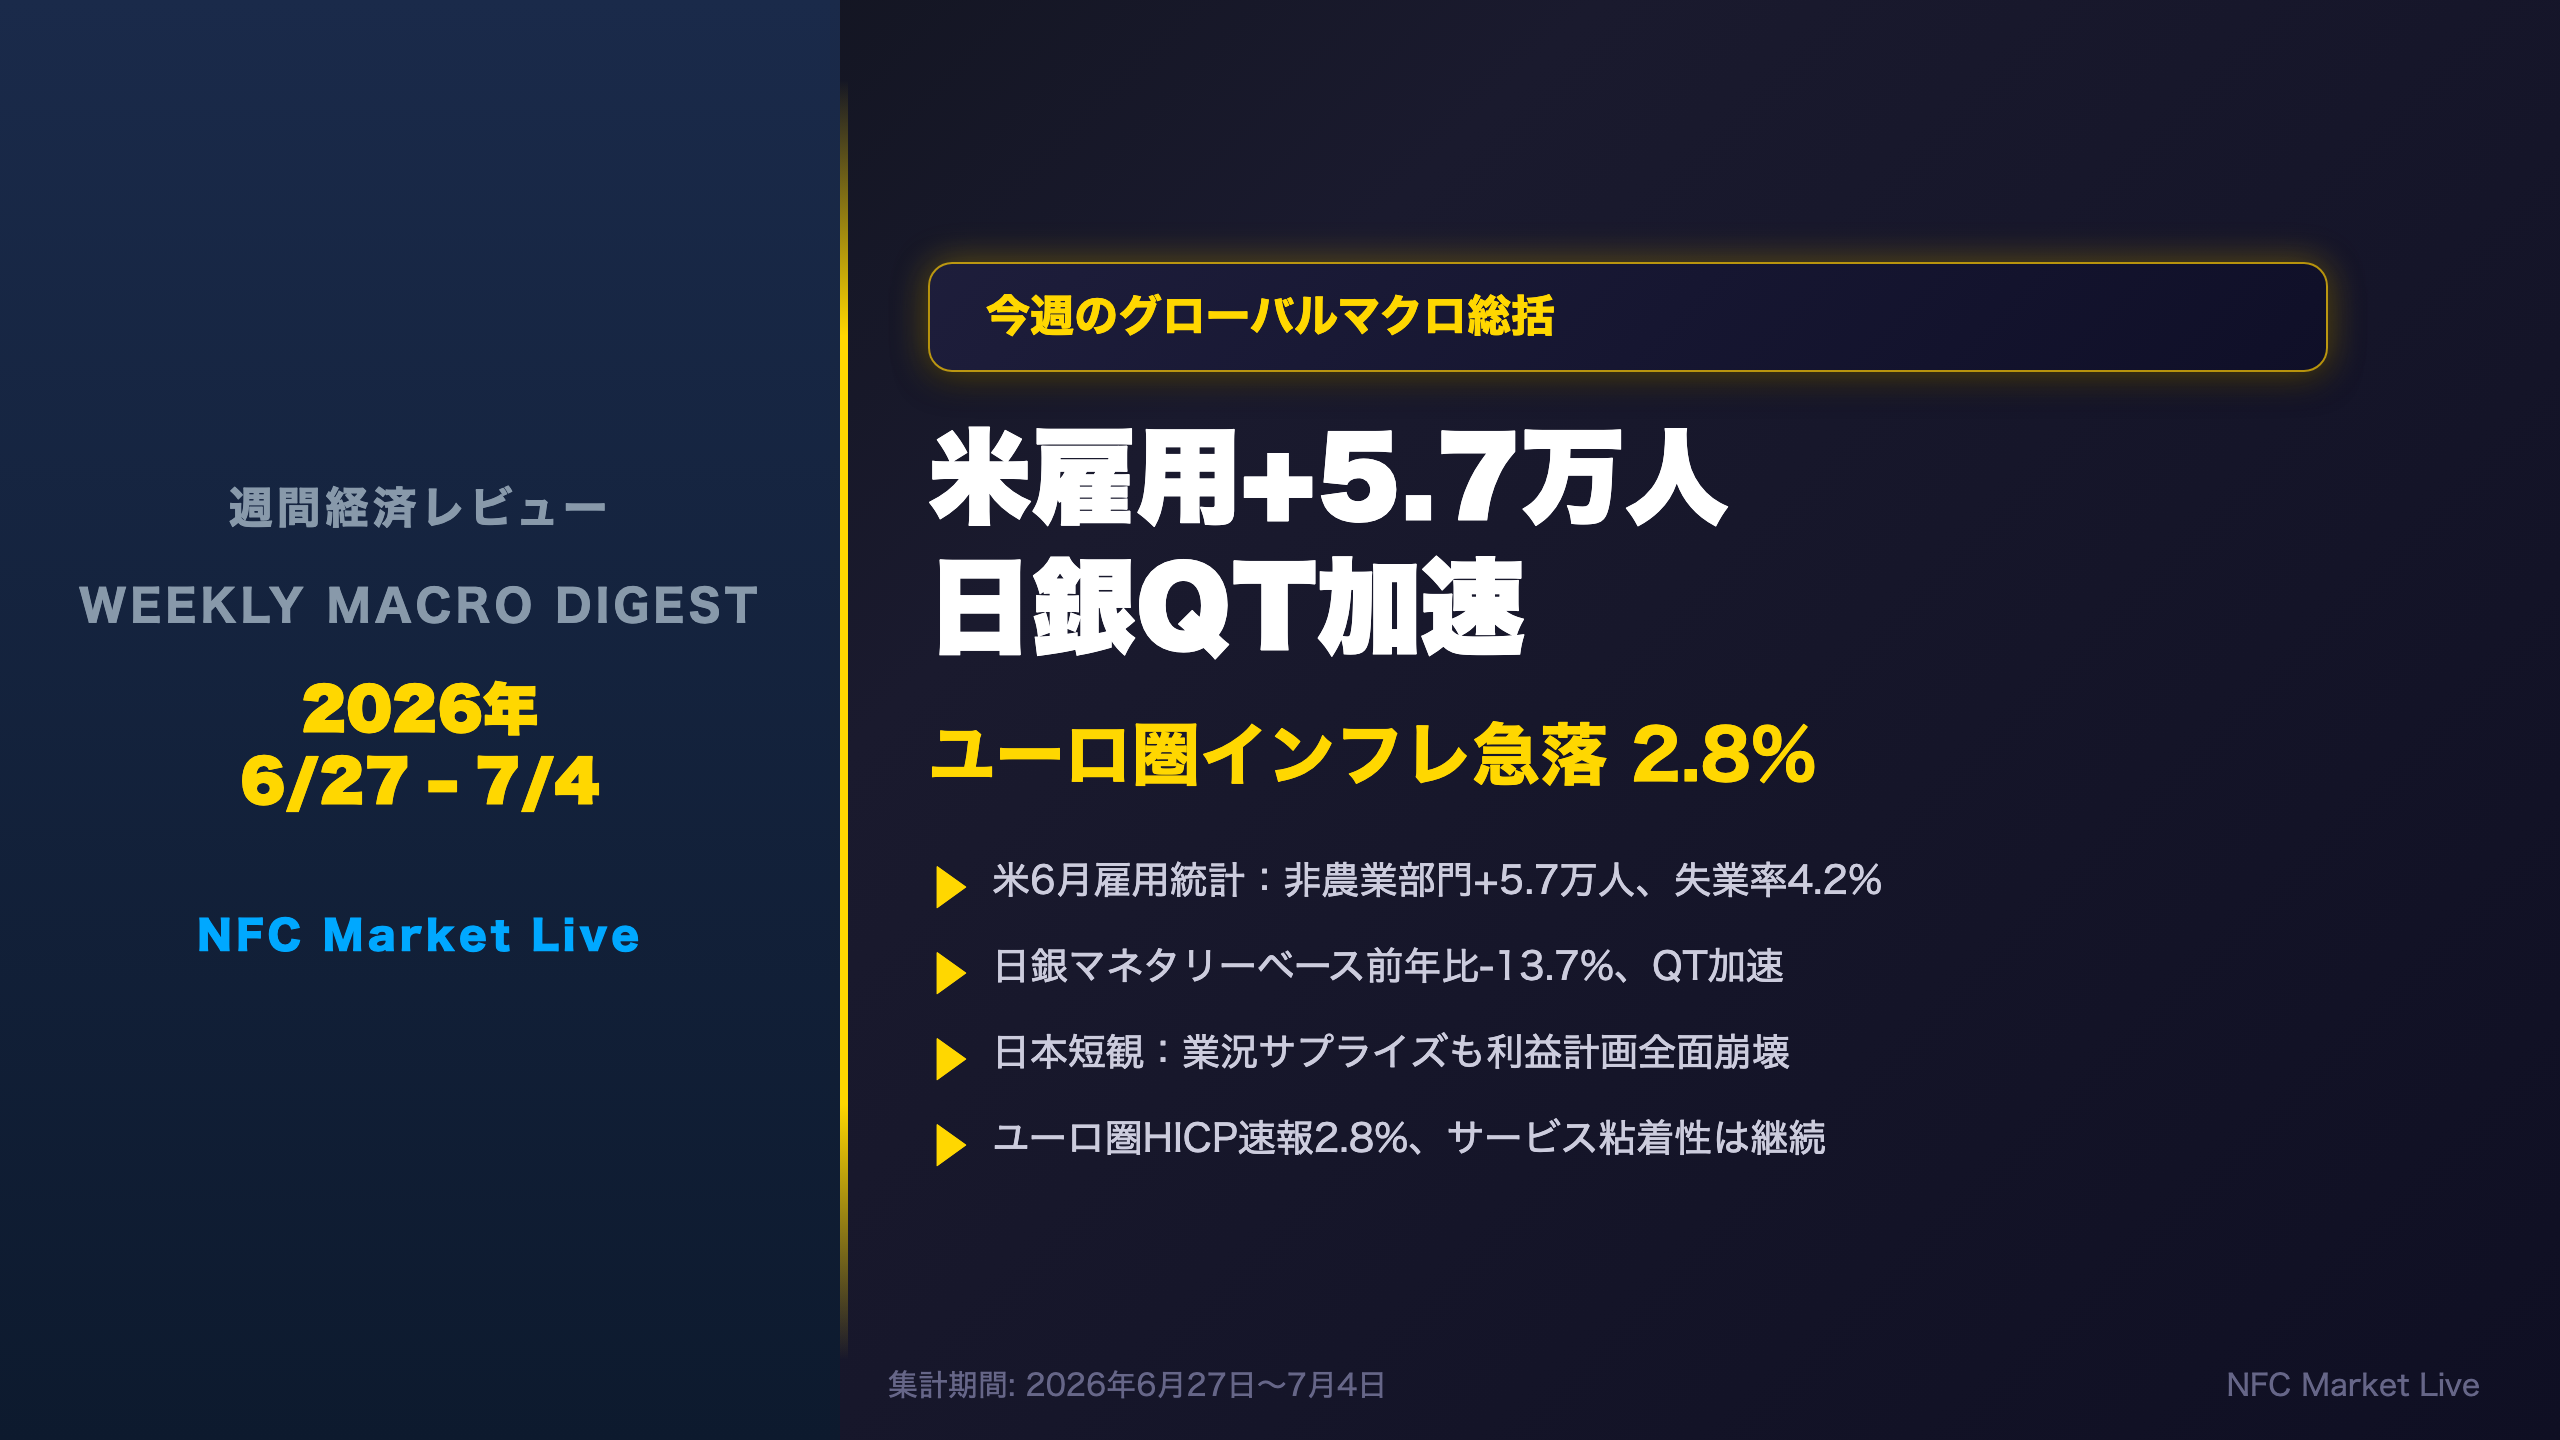
This week’s global macro digest covers: US June payrolls +57K (well below trend), BOJ monetary base -13.7% YoY as QT accelerates, Eurozone HICP flash drops to 2.8%, Japan Tankan beats on sentiment but profit plans collapse. Plus next week’s key events calendar for investors.
オープニング:週間経済レビュー 2026年6月27日〜7月4日
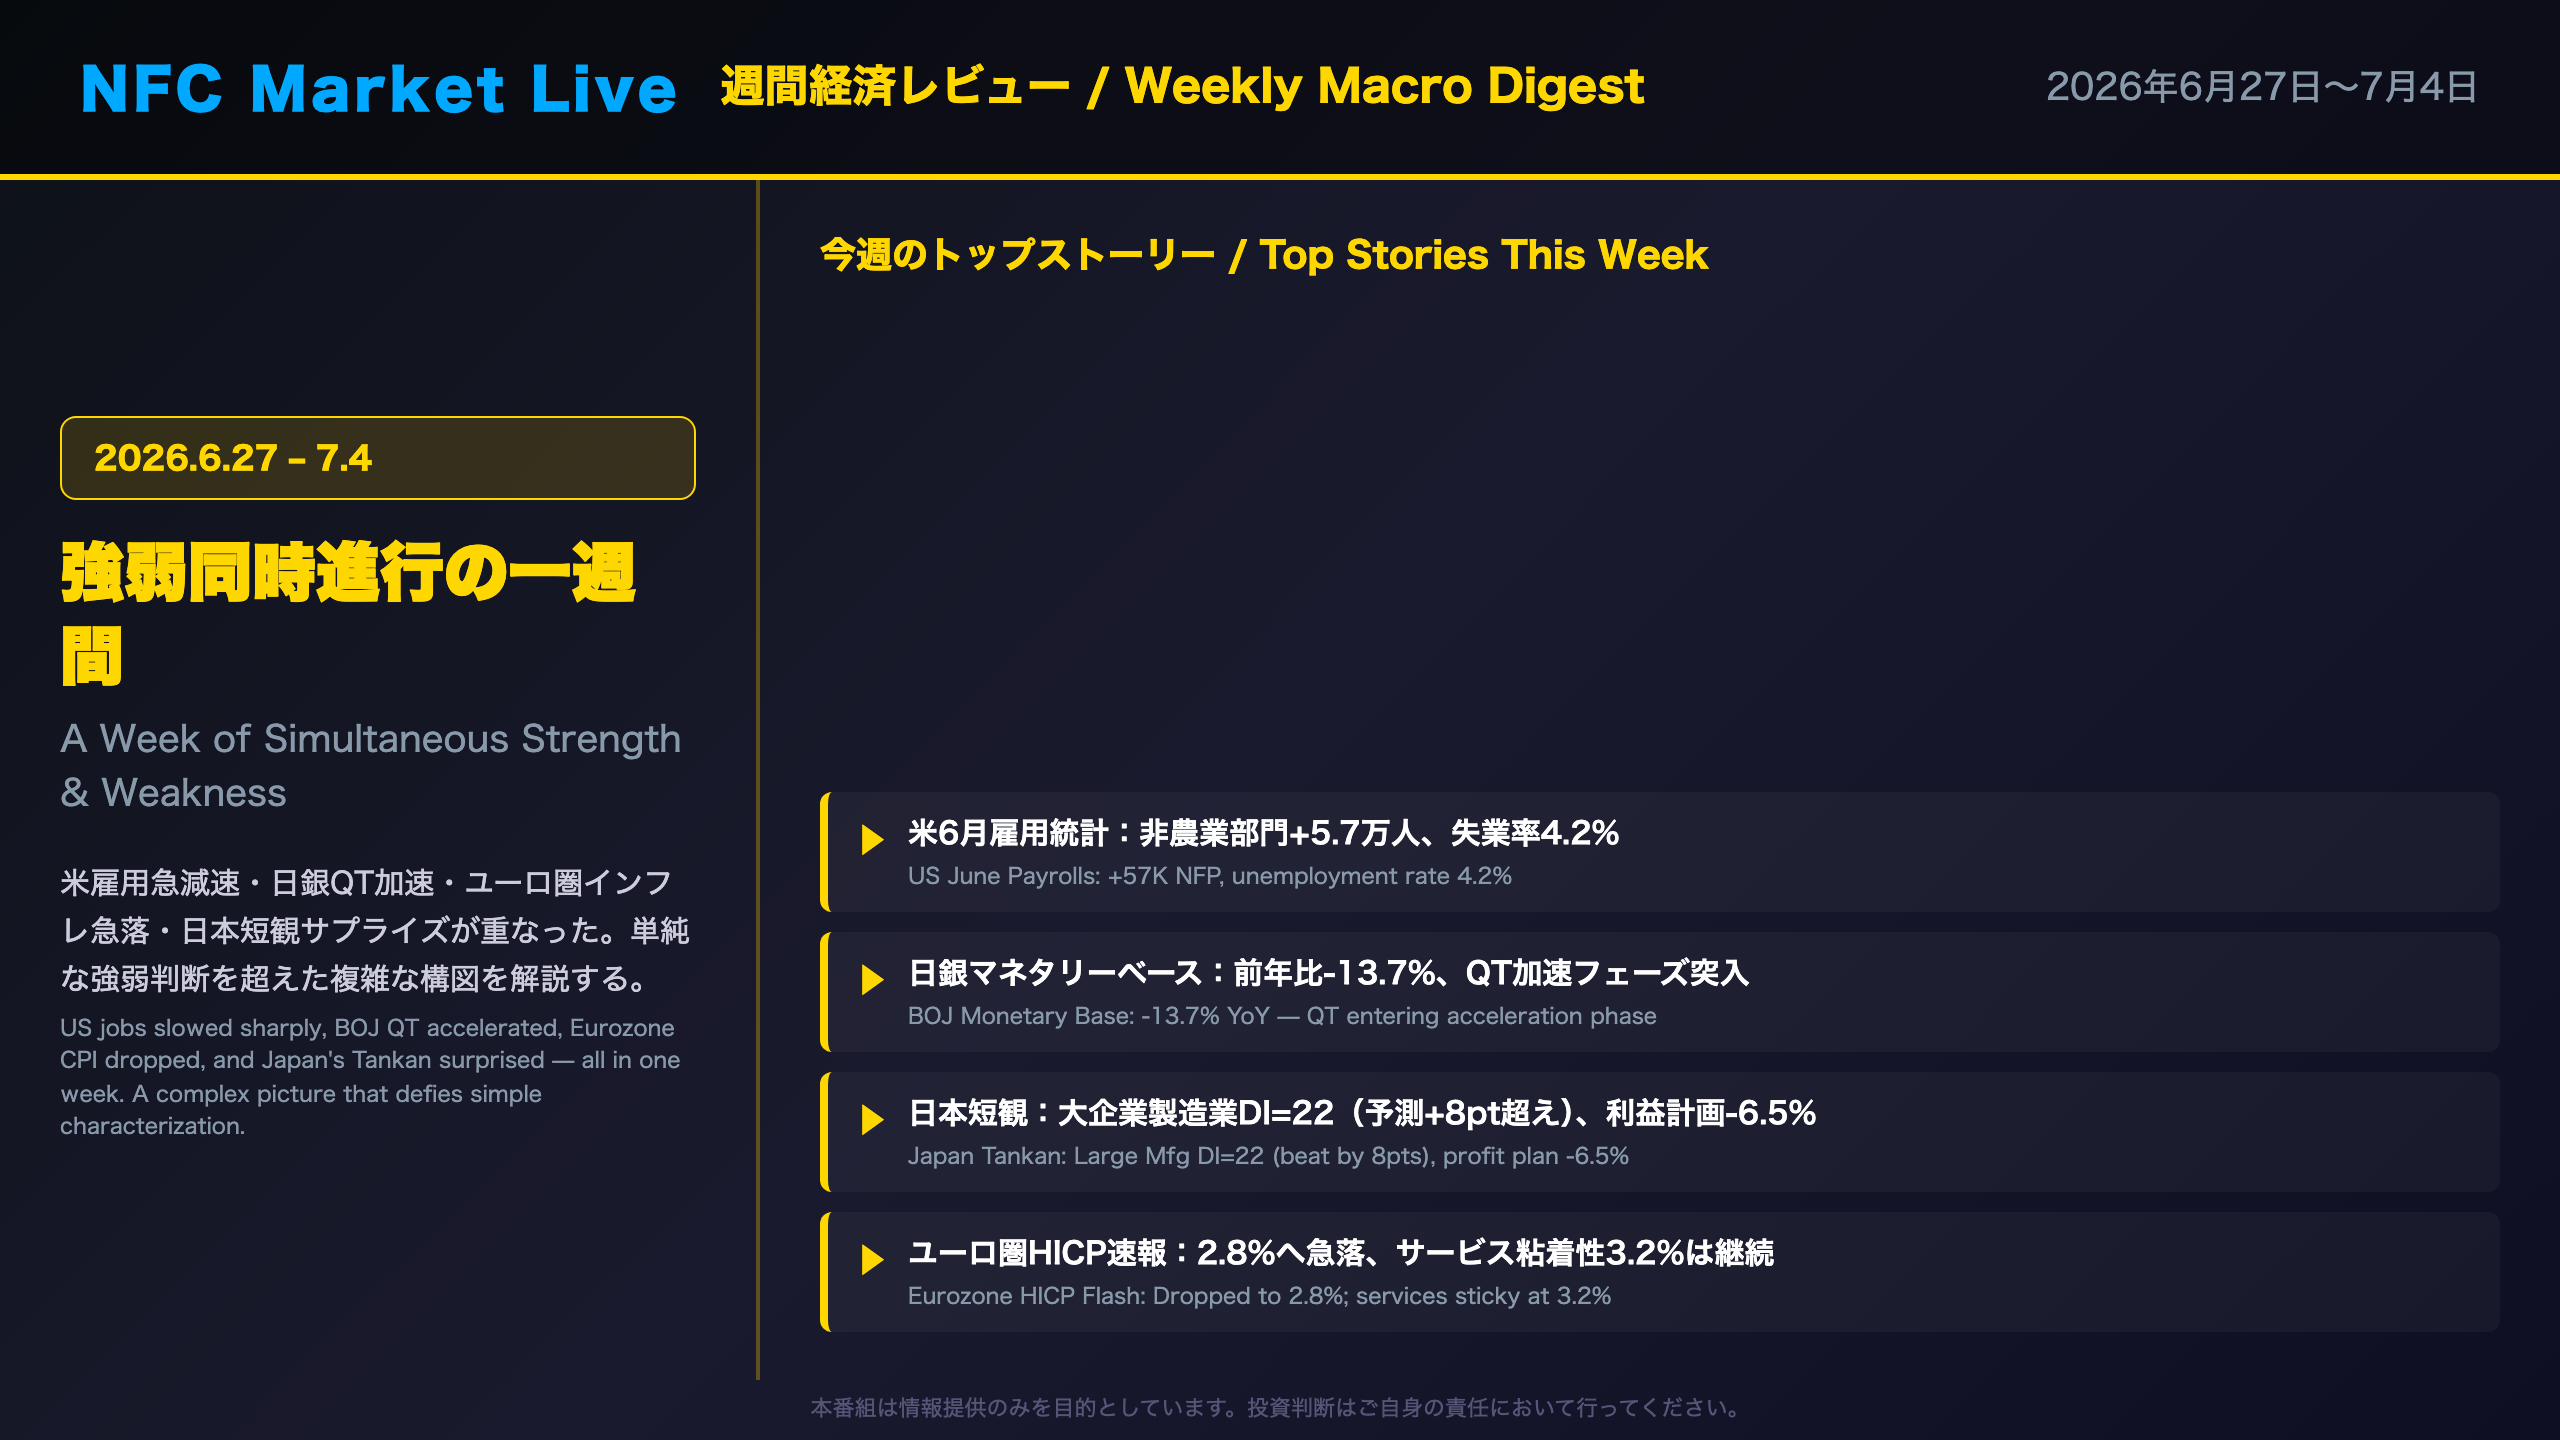
Weekly Macro Digest: June 27 – July 4, 2026
This week delivered a dense calendar of major economic releases across the G10. In the US, June nonfarm payrolls came in at just +57,000 — a sharp deceleration from the prior trend. In Japan, the BOJ’s monetary base contracted 13.7% year-on-year, confirming an accelerating quantitative tightening phase. The Eurozone’s HICP flash estimate dropped to 2.8%, led by energy disinflation, though services inflation remained sticky at 3.2%. Japan’s Tankan survey presented a paradox: large manufacturer sentiment beat forecasts by 8 points, yet fiscal year profit plans collapsed to -6.5%.
This episode synthesizes all of these cross-currents under the theme of simultaneous strength and weakness — a macro environment that defies simple characterization as either bullish or bearish.
今週の総括:強弱同時進行の週
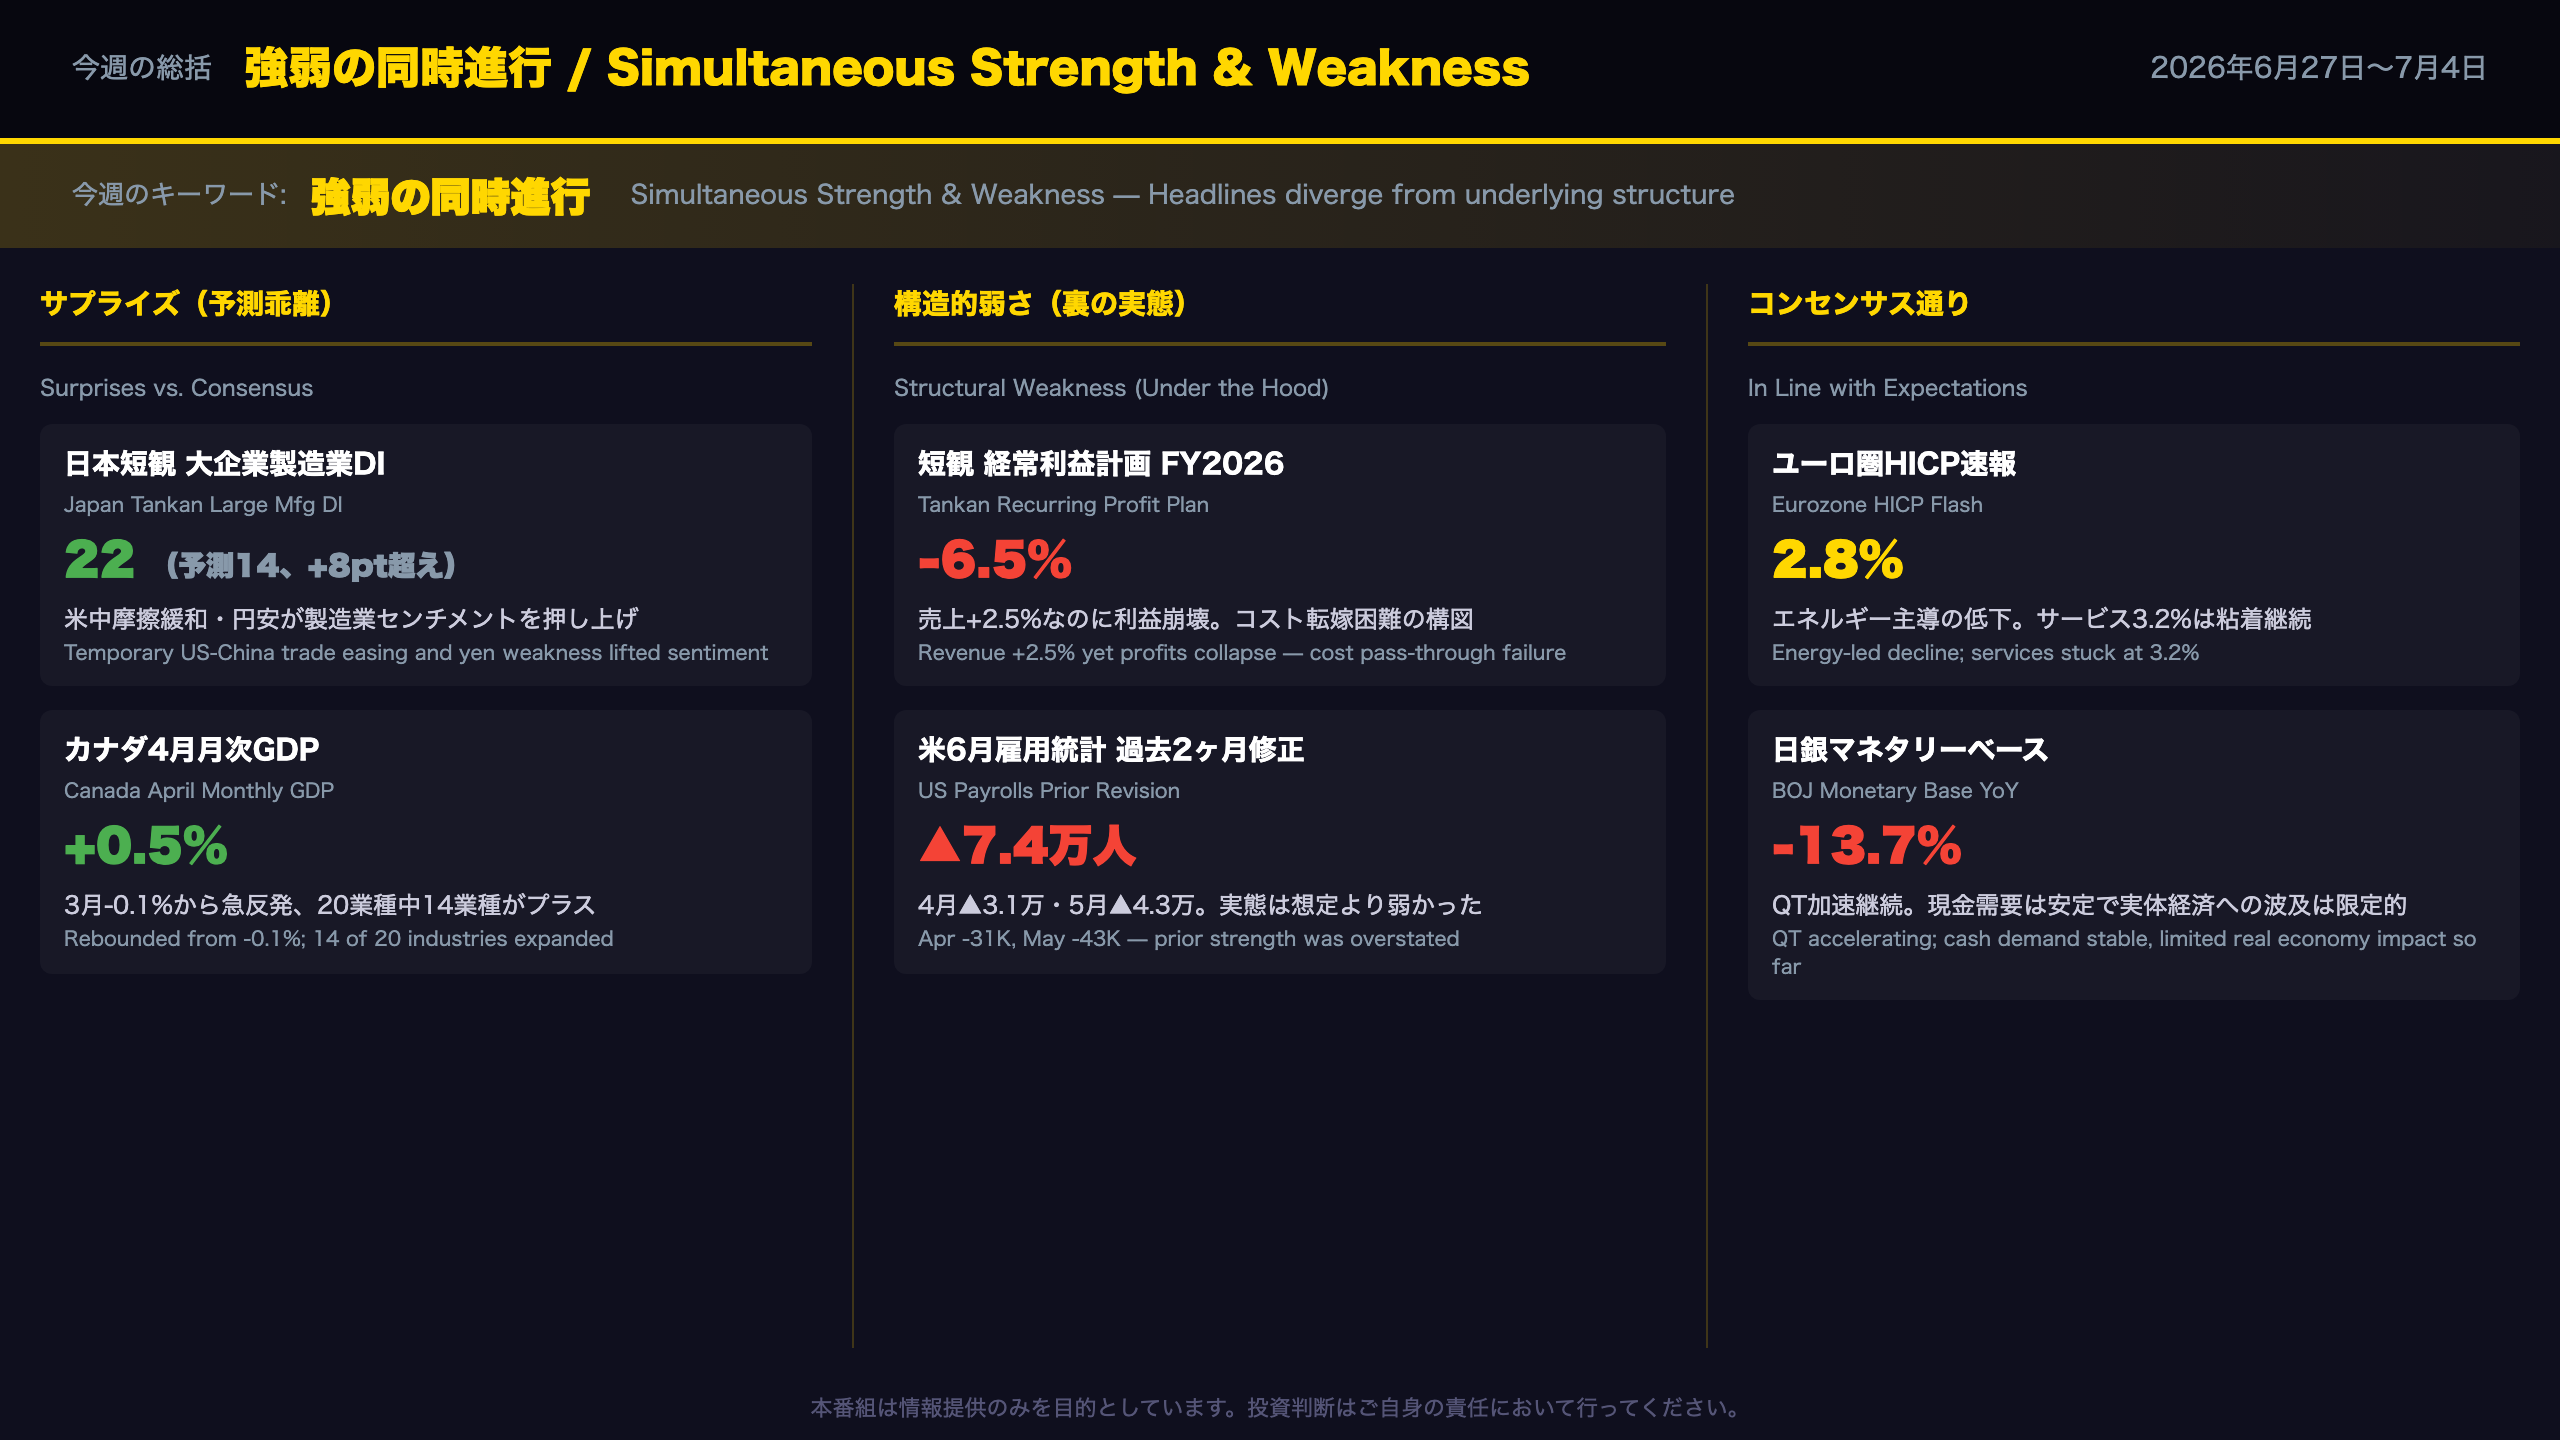
Weekly Verdict: Headlines vs. Underlying Structure
The Defining Theme: Simultaneous Strength and Weakness
This week’s data releases across the G10 share a common thread: headline numbers that look either strong or weak on the surface, but reveal a more complex picture when examined structurally.
Biggest Surprise: Japan Tankan DI Beat
The Bank of Japan’s quarterly Tankan survey (Short-Term Economic Survey of Enterprises in Japan) showed large manufacturer sentiment at DI=22, beating the March survey’s forecast of 14 by 8 points. The Tankan DI measures the percentage of firms reporting “favorable” conditions minus those reporting “unfavorable” — a positive reading indicates net optimism. However, fiscal year 2026 recurring profit plans collapsed to -6.5%, down from the March forecast of -2.4%. Revenue plans were revised upward to +2.5%, creating a classic “revenues up, profits down” pattern that signals severe cost pressures — likely from yen weakness and tariff-related input cost increases.
In Line with Expectations: Eurozone Disinflation
The Eurozone HICP flash estimate of 2.8% (down from 3.2% in May) was broadly in line with the direction of travel, driven by energy disinflation. Services inflation at 3.2% remains the key concern for the ECB — this component, which accounts for roughly 47% of the HICP basket, has been stuck in the 3.0-3.5% range for over a year.
Scorecard
| Indicator | Strength | Weakness |
|---|---|---|
| US Payrolls | Diffusion index 54.4, private sector resilient | +57K headline, -74K prior revisions |
| Japan Tankan | DI=22, beat by 8pts | Profit plans -6.5%, forward guidance weak |
| Eurozone HICP | Dropped to 2.8% | Services sticky at 3.2% |
| BOJ QT | Cash demand stable | MB -13.7% YoY, accelerating |
主要指標ハイライト①:米雇用統計と日本短観の深層
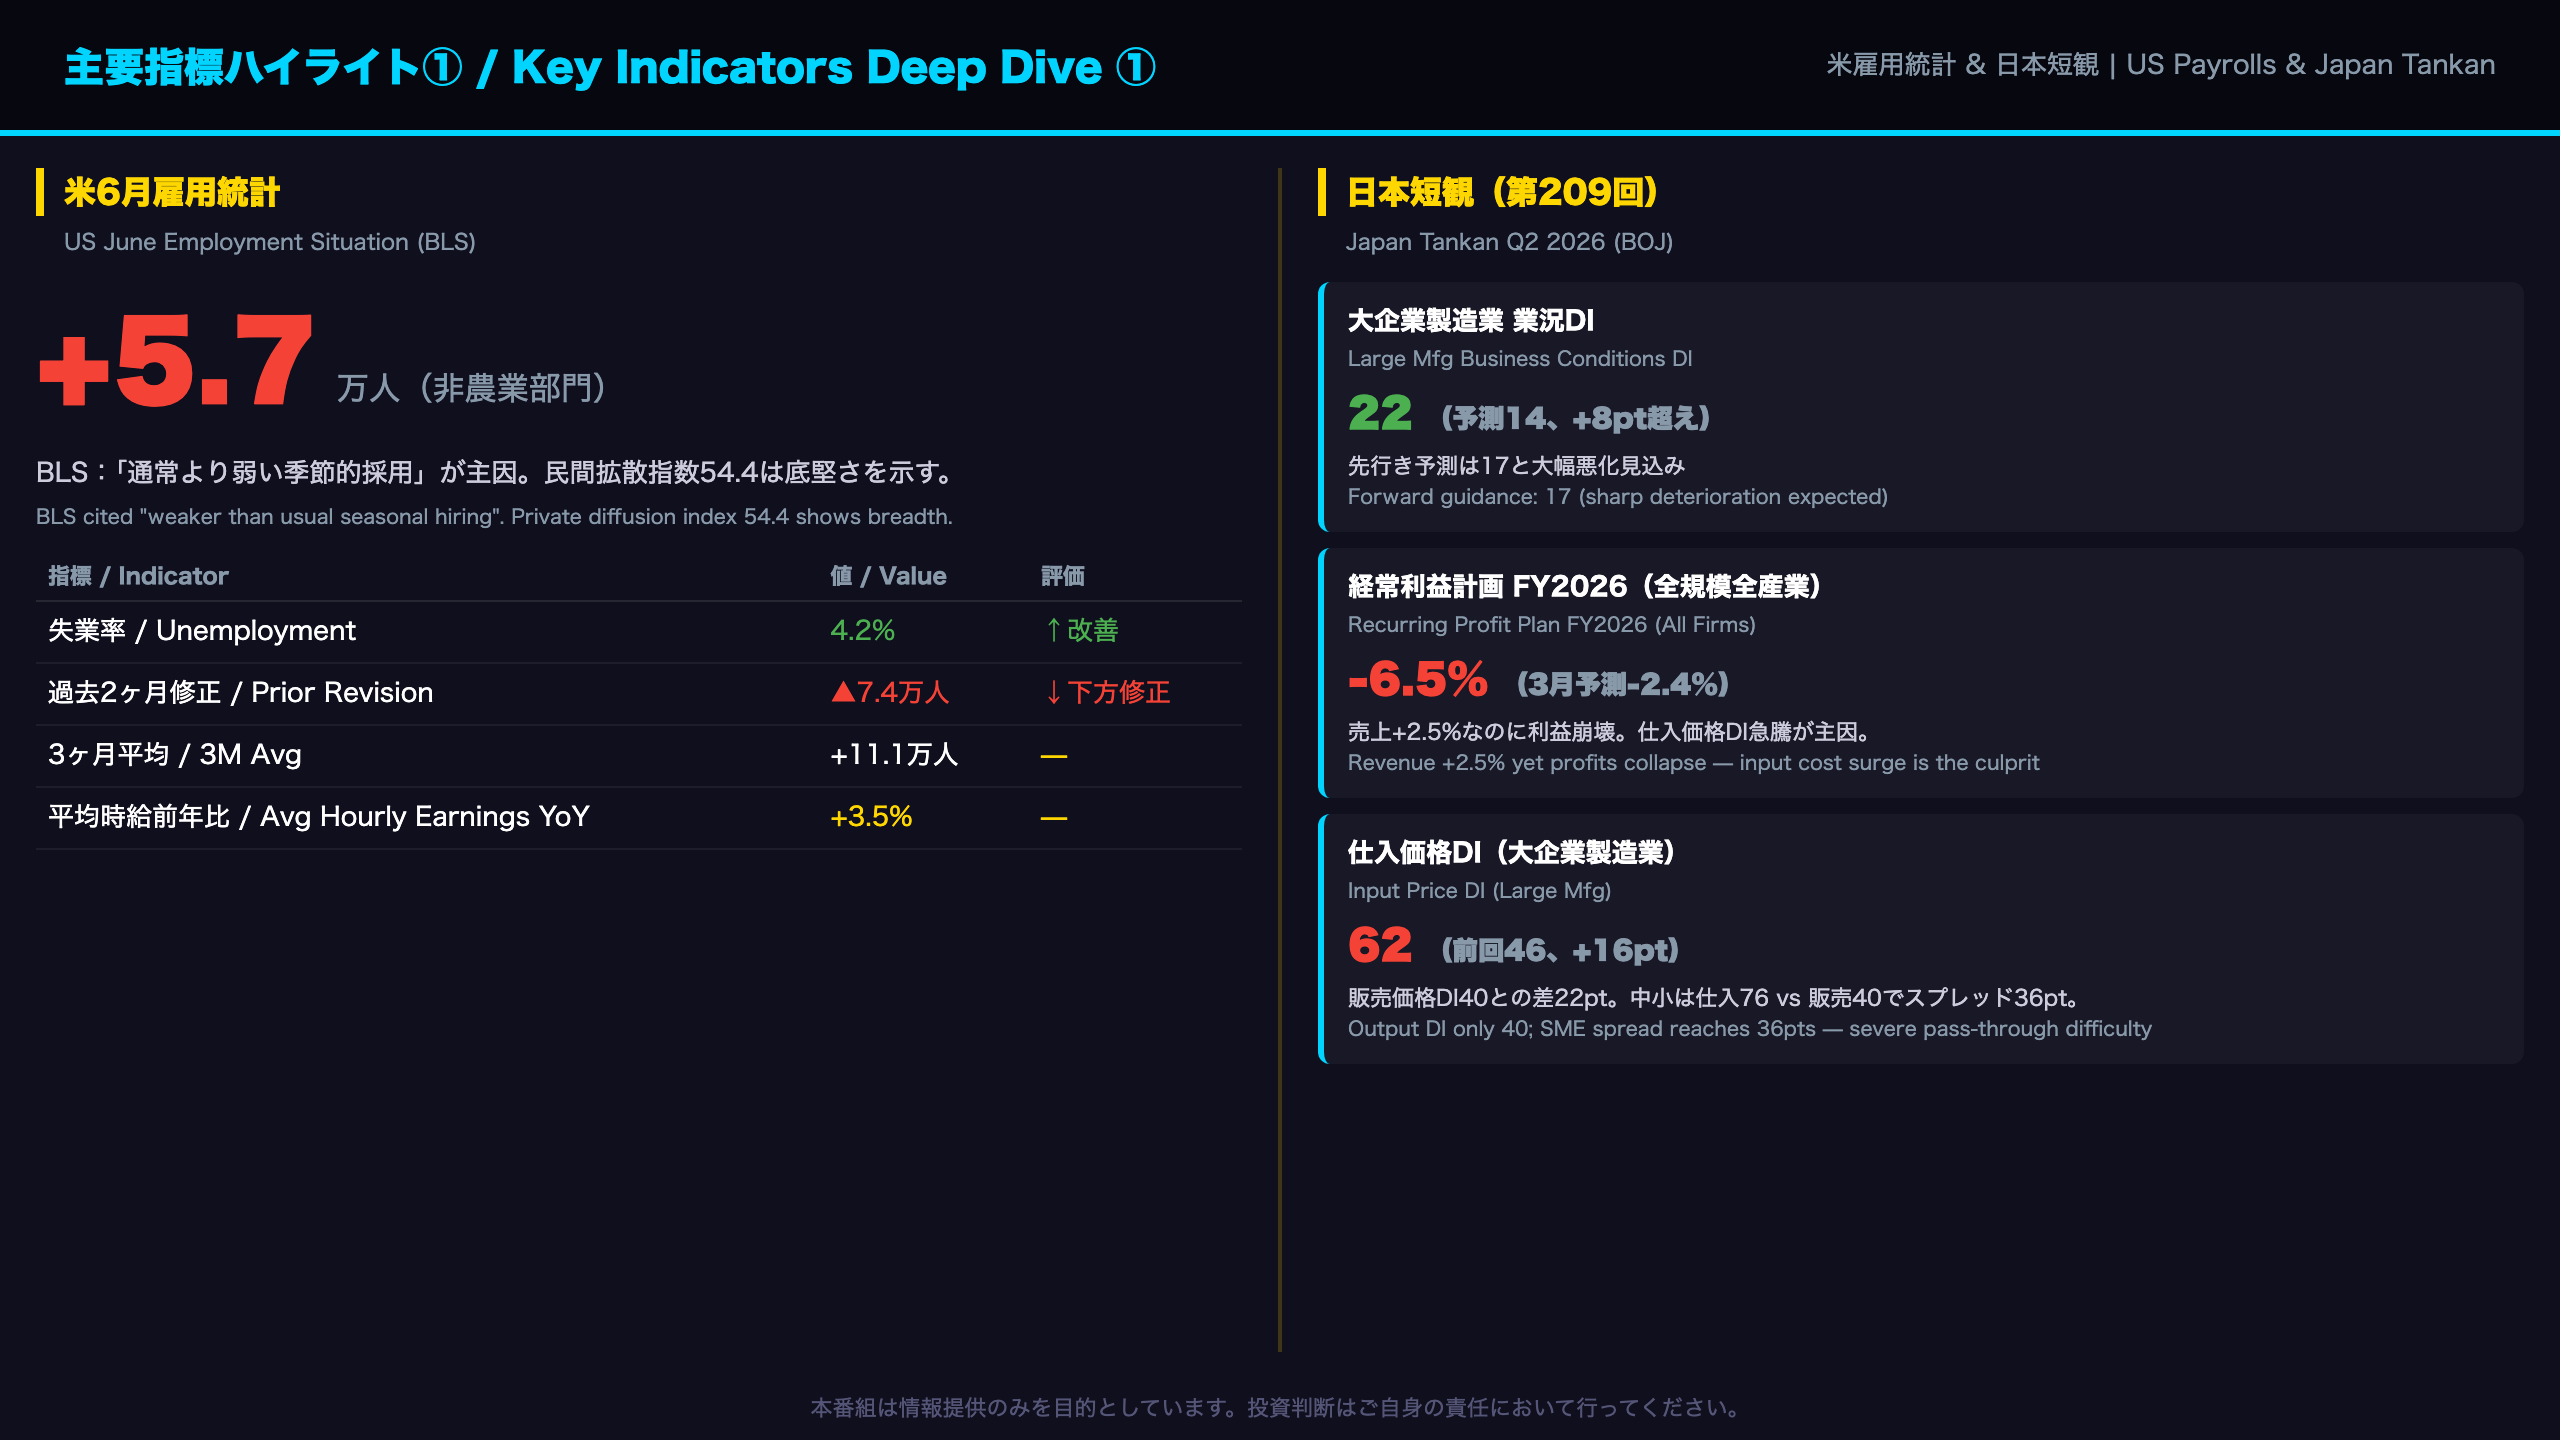
US Payrolls and Japan Tankan: The Structure Behind the Numbers
US June Payrolls: Seasonal Noise or Structural Slowdown?
The +57,000 headline was heavily influenced by what the BLS described as “weaker than usual seasonal hiring” in leisure and hospitality. This sector shed 61,000 jobs on a seasonally adjusted basis — meaning actual hiring fell short of the seasonal model’s expectations. Year-to-date, the industry has shown “little net change,” suggesting a structural plateau rather than a cyclical dip.
However, the private sector showed genuine resilience:
– Professional & Business Services: +36,000 (cumulative +172,000 since Oct 2025 trough)
– Healthcare & Social Assistance: +47,000 (above 12-month average of +38,000)
– Construction: +11,000 (non-residential leading)
– Private diffusion index: 54.4 (above 50 = more industries hiring than cutting)
The combined 74,000 downward revision to April and May is the most important number in this report. It suggests the labor market was softer than initially reported, and the 3-month average of +111,000 — while above the 12-month average of +36,000 — may itself be revised lower.
Japan Tankan: The Revenue-Profit Paradox
The Tankan (Short-Term Economic Survey of Enterprises) is the BOJ’s flagship quarterly business survey, covering approximately 10,000 companies. The DI (Diffusion Index) = % favorable – % unfavorable.
The key insight this quarter is not the DI beat, but the input-output price spread:
| Size | Input Price DI | Output Price DI | Spread |
|---|---|---|---|
| Large firms | 62 | 40 | 22pts |
| SMEs | 76 | 40 | 36pts |
SMEs face a spread nearly 1.6x that of large firms, indicating severe cost pass-through difficulties. With fiscal year profit plans at -6.5% despite revenue plans of +2.5%, the math is clear: costs are rising faster than prices.
主要指標ハイライト②:ユーロ圏インフレ・日銀QT・英国住宅市場
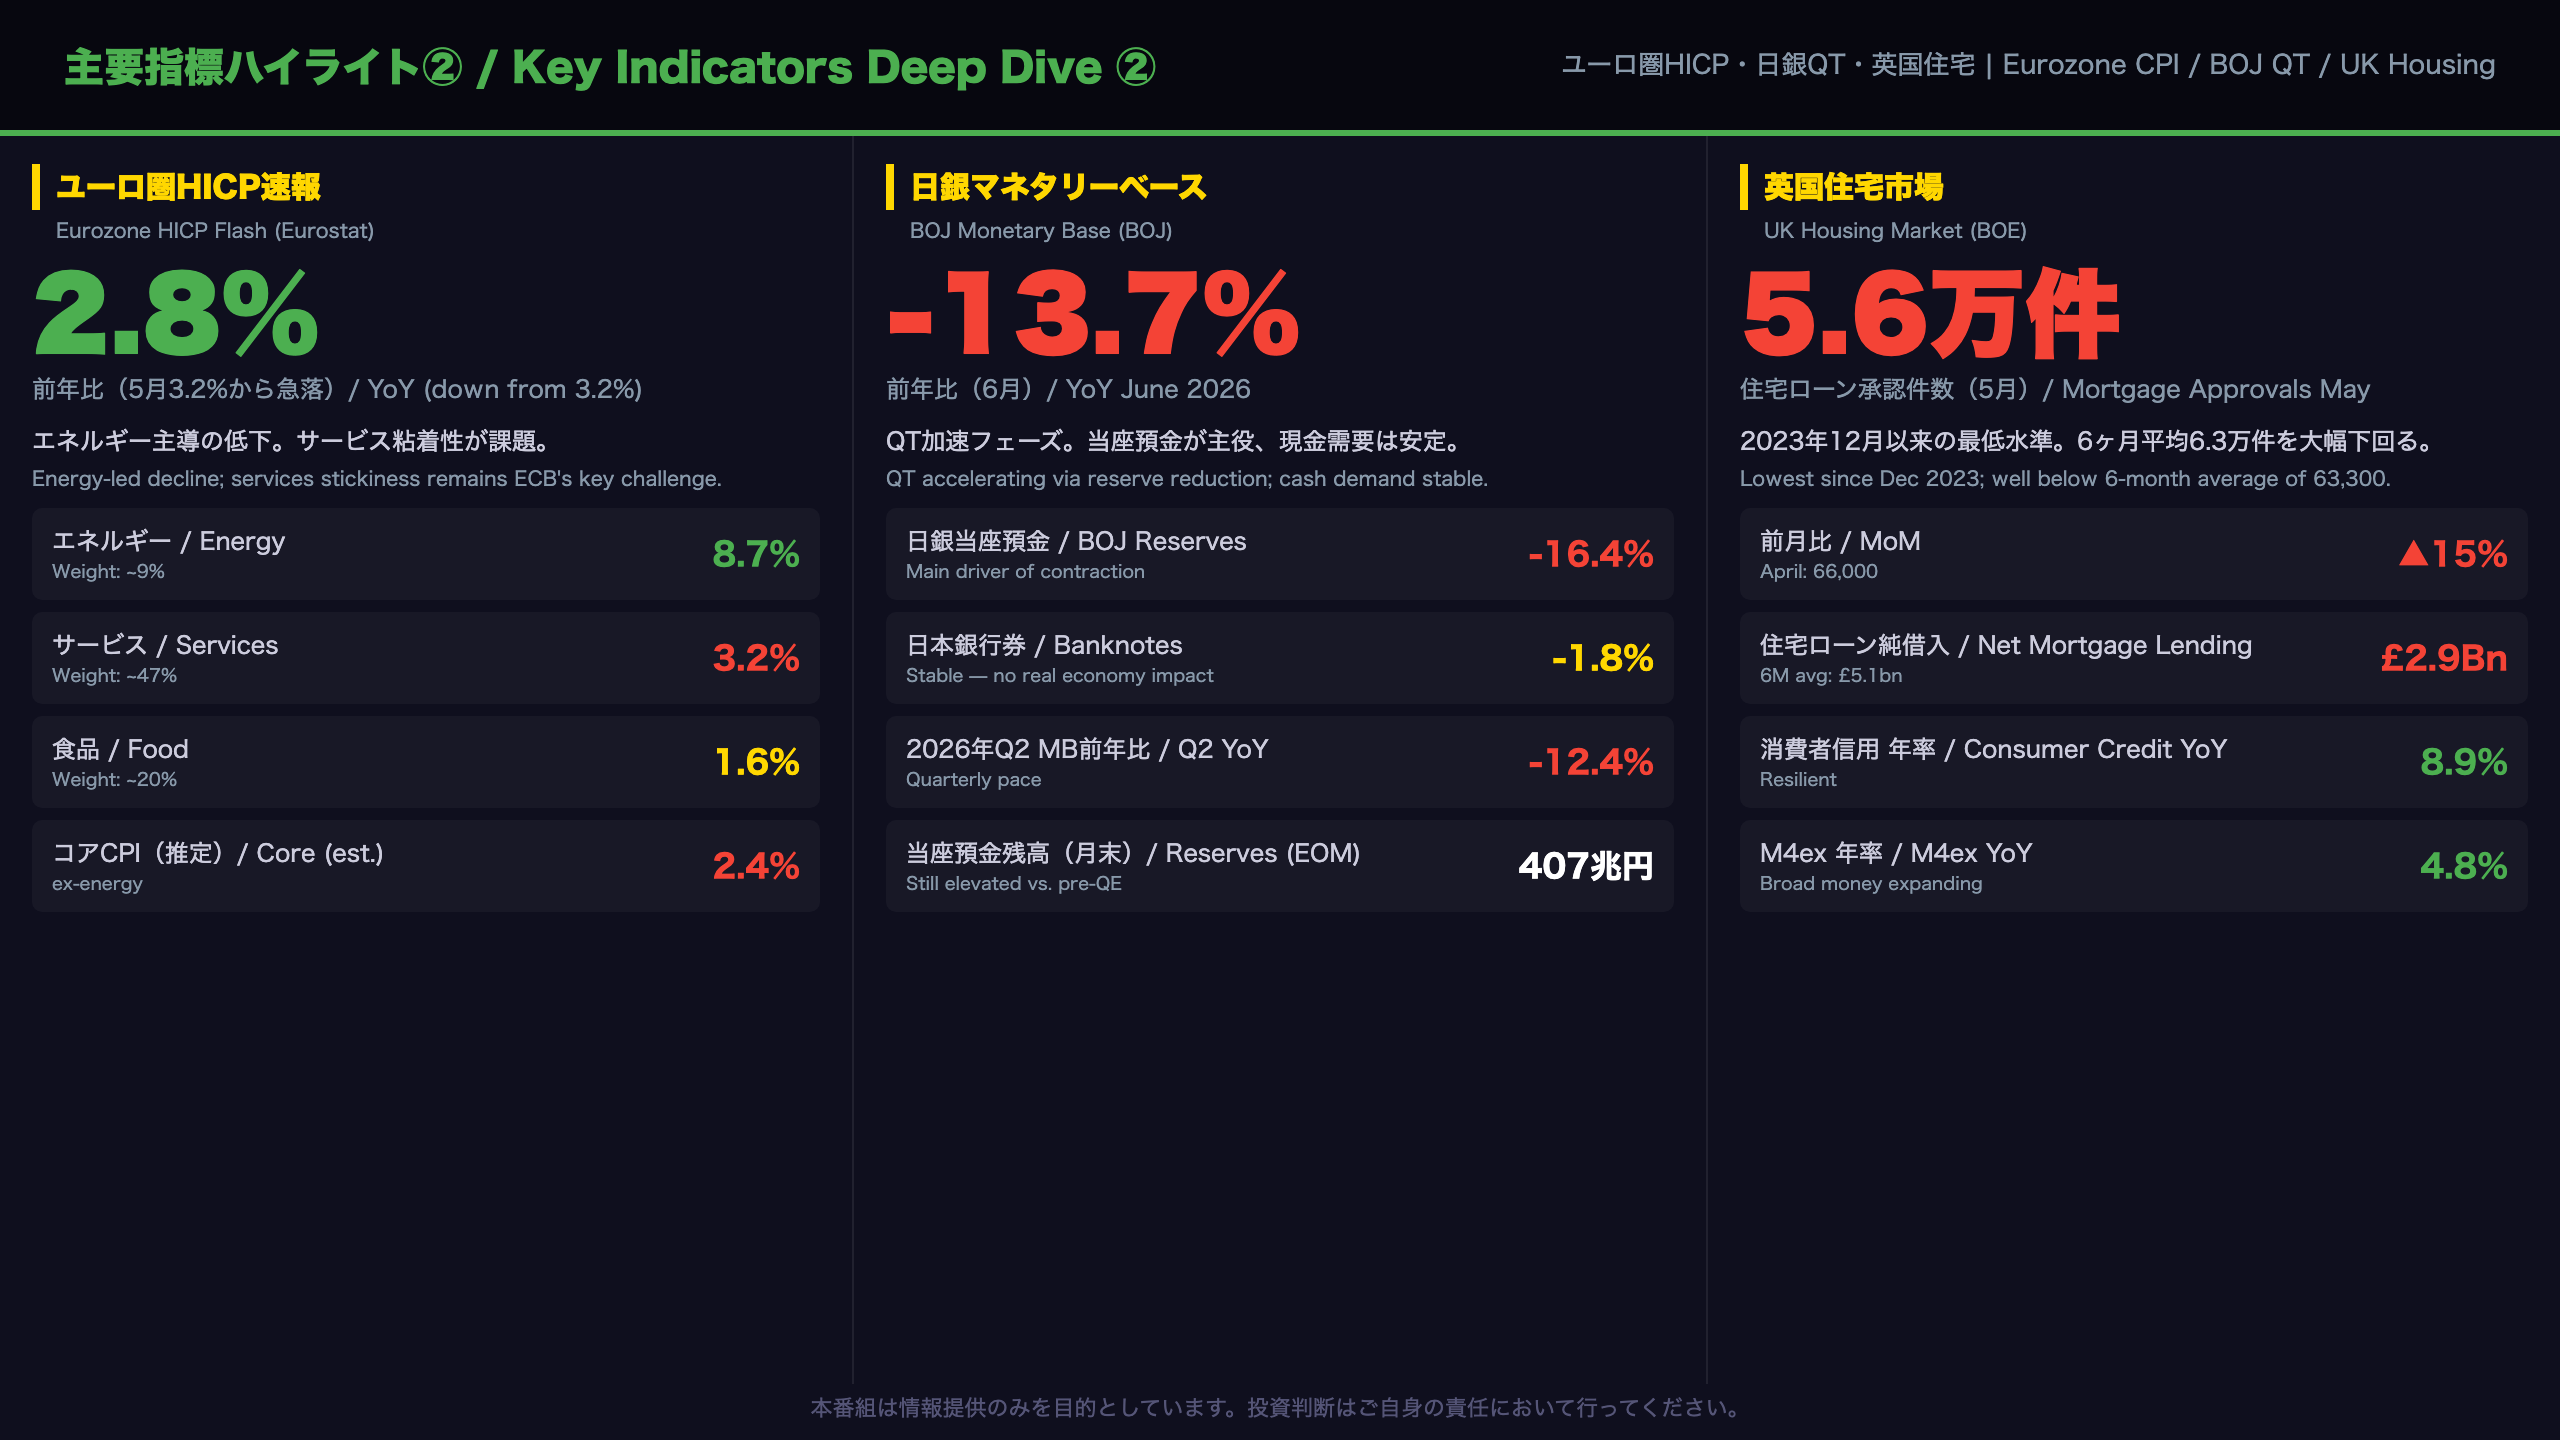
Eurozone, Japan, UK: Three Tightening Cycles at Different Stages
Eurozone HICP: Energy Relief vs. Services Stickiness
The June HICP flash estimate of 2.8% marks the first clear reversal in a trend that had been rising since January (1.7% → 3.2% in May). The energy component (weight: ~9% of basket) fell from 10.8% to 8.7%, contributing approximately -0.19 percentage points to the headline decline.
The critical concern for the ECB is services inflation (weight: ~47% of basket), which only edged down from 3.5% to 3.2%. This component has been locked in a 3.0-3.5% range for over 12 months, driven by persistent wage cost pass-through. The ECB’s 2% target implies services inflation needs to fall to roughly 2.5-3.0% for a sustained basis — still some distance away.
BOJ QT: Acceleration Phase Confirmed
The BOJ’s monetary base has contracted from -2.5% YoY in Q1 2025 to -12.4% in Q2 2026 — a near-fivefold acceleration in the pace of contraction. The key distinction: BOJ reserves (current account deposits) are falling at -16.4% YoY, while banknote issuance is stable at -1.8%. This confirms that QT is operating through the “excess reserve reduction” channel, not through a contraction in real economy money demand. The absolute level of BOJ reserves (¥407 trillion) remains extraordinarily high by pre-Abenomics standards, suggesting limited near-term systemic risk.
UK Housing: Lowest Since December 2023
Mortgage approvals of 56,200 in May fell 15% from April’s 66,000 and came in below the 6-month average of 63,300. Remortgage approvals collapsed 35% to 33,300 — suggesting borrowers are waiting for rate cuts before refinancing. Gross lending held up at £27.1bn, but repayments surged to £22.9bn (15% above the 6-month average), compressing net lending to £2.9bn from £4.4bn in April.
中央銀行・政策スタンスの現在地
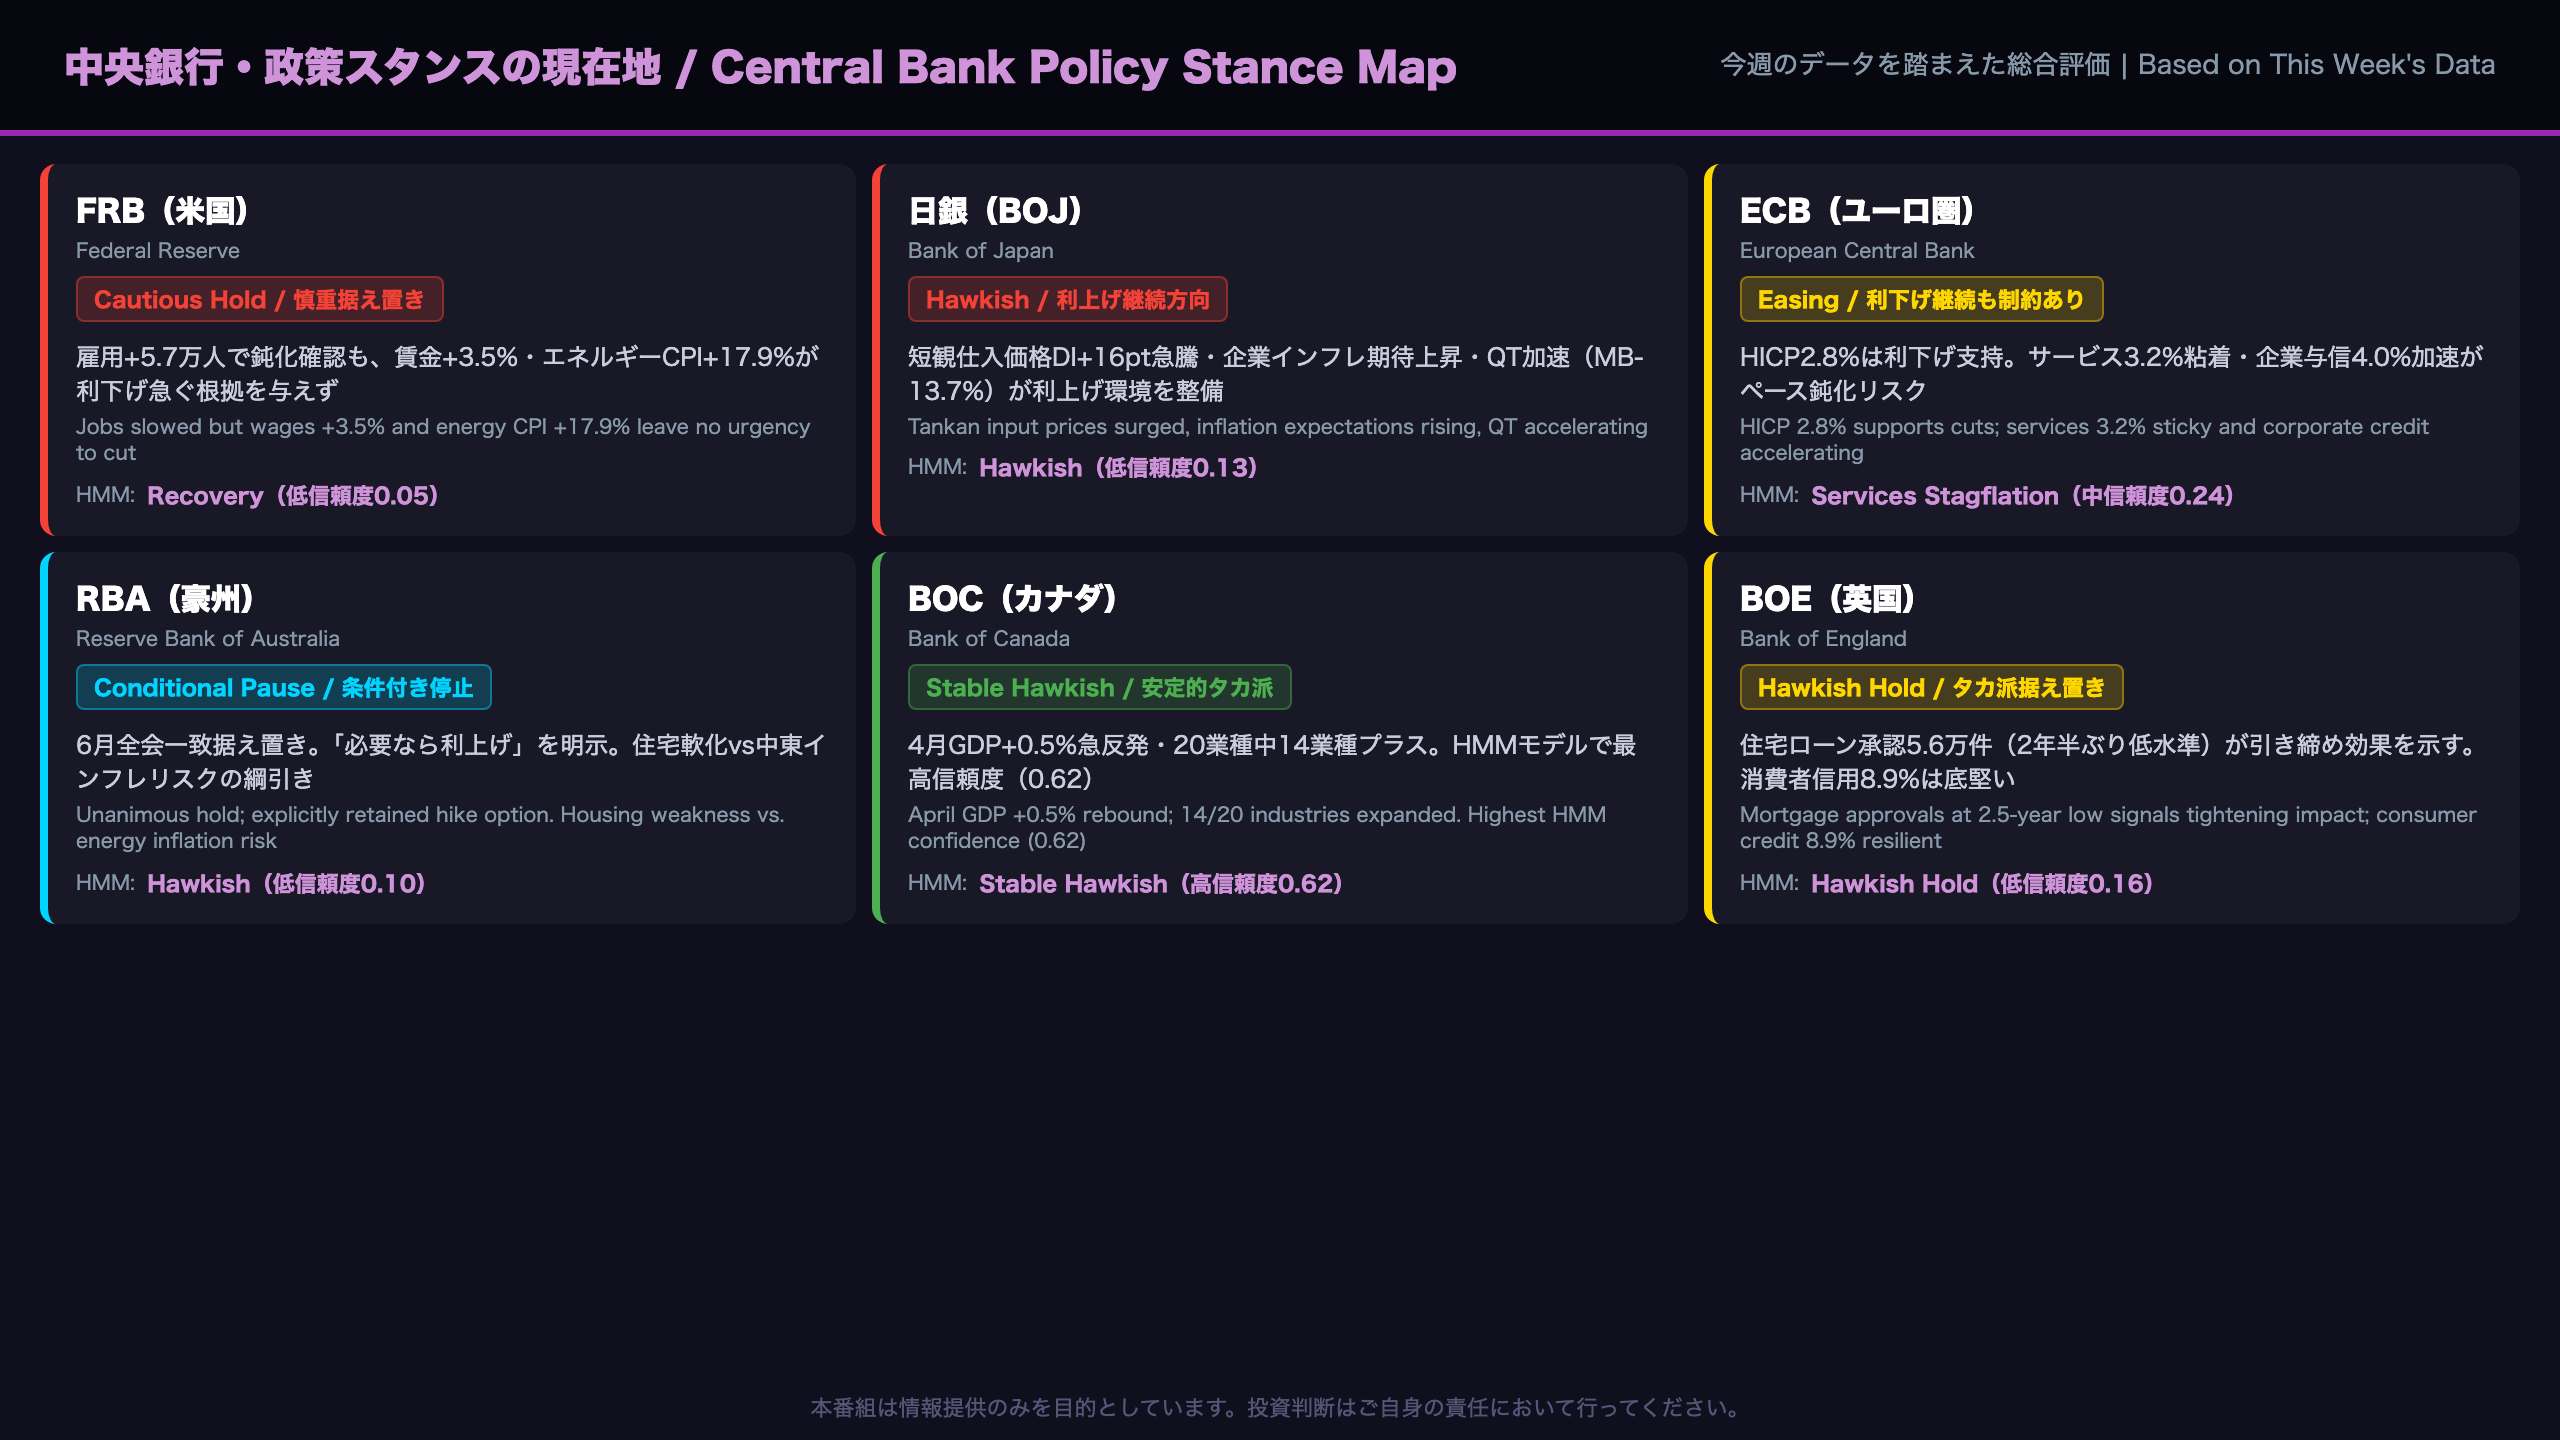
Major Central Bank Policy Stances: What This Week’s Data Changed
Fed: No Urgency to Cut
The June payrolls report showed labor market softening, but not enough to push the Fed toward imminent rate cuts. Average hourly earnings at +3.5% YoY, energy CPI at +17.9% YoY (HMM Z-score: 2.40), and a private sector diffusion index above 50 all support a “wait and see” posture. The HMM model places the US in a “Recovery” regime, but with low confidence (0.05) — meaning the model sees the current data as atypical even within this regime.
BOJ: Rate Hike Environment Building
The Tankan input price DI surge (46→62), combined with firms’ 1-year price outlook rising to 3.7% (from 3.1%) and 5-year outlook to 6.1% (from 5.6%), adds upside risk to the BOJ’s inflation forecasts. The labor survey shows regular employment rising for 31 consecutive months, with accommodation and food services employment up 5.8% YoY — a direct pipeline to services price inflation. The BOJ’s QT acceleration (-13.7% monetary base YoY) confirms the tightening direction.
ECB: Services Stickiness as the Binding Constraint
The HICP flash at 2.8% supports continued ECB easing, but services inflation at 3.2% — stuck in a 3.0-3.5% range for over a year — prevents the ECB from declaring victory. The HMM model flags a “Services Stagflation” regime with medium confidence (0.24). ECB M3 data showed corporate loan growth accelerating to 4.0%, suggesting monetary transmission is working, but the services inflation puzzle remains unsolved.
RBA: Conditional Pause
The June RBA minutes explicitly retained the option to hike (“including increasing the cash rate target if necessary”) — a shift from May’s language. The board unanimously agreed that financial conditions are “already somewhat restrictive,” but three risk factors keep them on guard: Middle East uncertainty (energy upside), productivity slowdown (inflation persistence), and housing market weakness (growth downside).
BOC: Most Stable
The HMM model places Canada in a “Stable Hawkish” regime with the highest confidence of any model (0.62). April GDP +0.5% — rebounding from March’s -0.1% — with 14 of 20 industries expanding confirms this stability.
今週の番組制作費コーナー
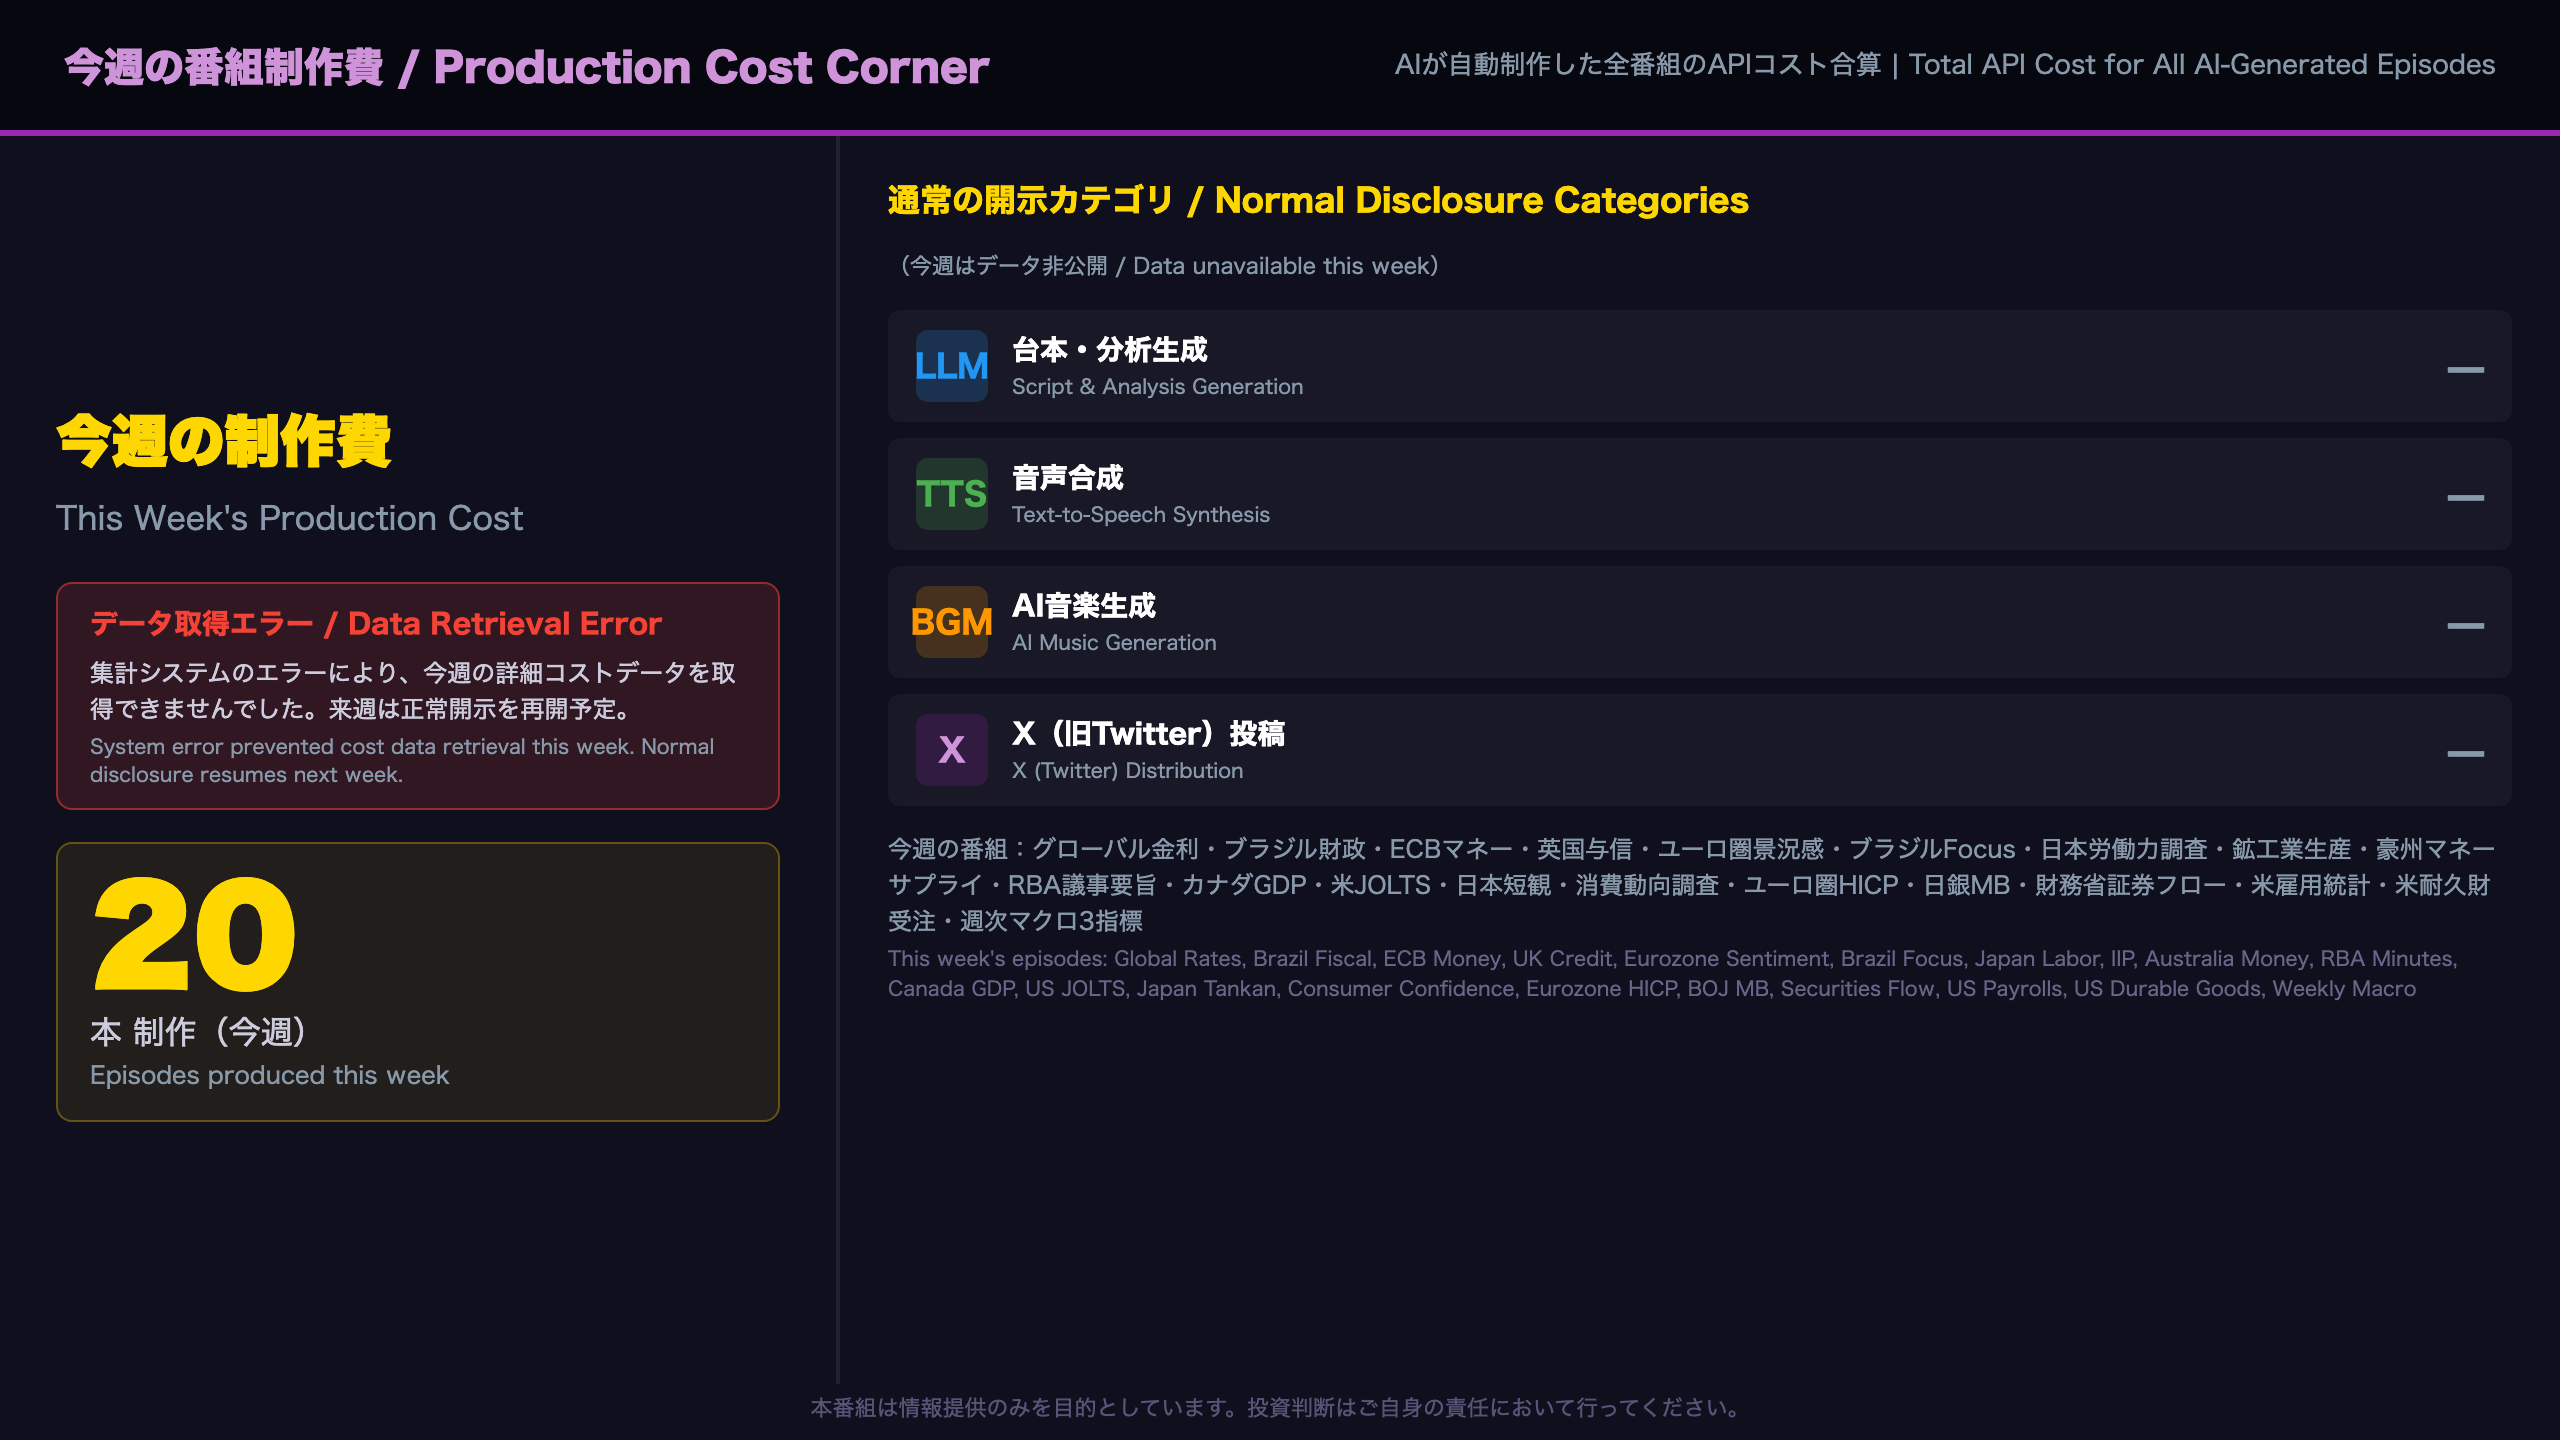
Production Cost Corner: Data Unavailable Due to System Error
What Happened
This week’s production cost data could not be retrieved due to an unexpected argument error in the format_weekly_summary() function of the aggregation system.
What We Normally Disclose
In a typical week, this segment discloses the total API cost for producing all NFC Market Live episodes, broken down into four categories:
| Category | Description |
|---|---|
| LLM | Script generation and analysis API costs |
| TTS | Text-to-speech synthesis costs |
| BGM | AI music generation costs |
| X (Twitter) | Social media distribution costs |
This Week’s Episode Count
Despite the data retrieval error, 20 episodes were produced this week covering: global bond markets, Brazil fiscal statistics, ECB monetary developments, UK money and credit, Eurozone business surveys, Brazil Focus readout, Japan labor force survey, industrial production, Australia monetary aggregates, RBA minutes, Canada GDP, US JOLTS, Japan Tankan, consumer confidence, Eurozone HICP flash, BOJ monetary base, securities flow data, US employment situation, US durable goods orders, and the weekly macro three-indicator report.
Next Steps
We aim to resolve the aggregation system error and resume normal cost disclosure next week.
来週の注目イベントカレンダー
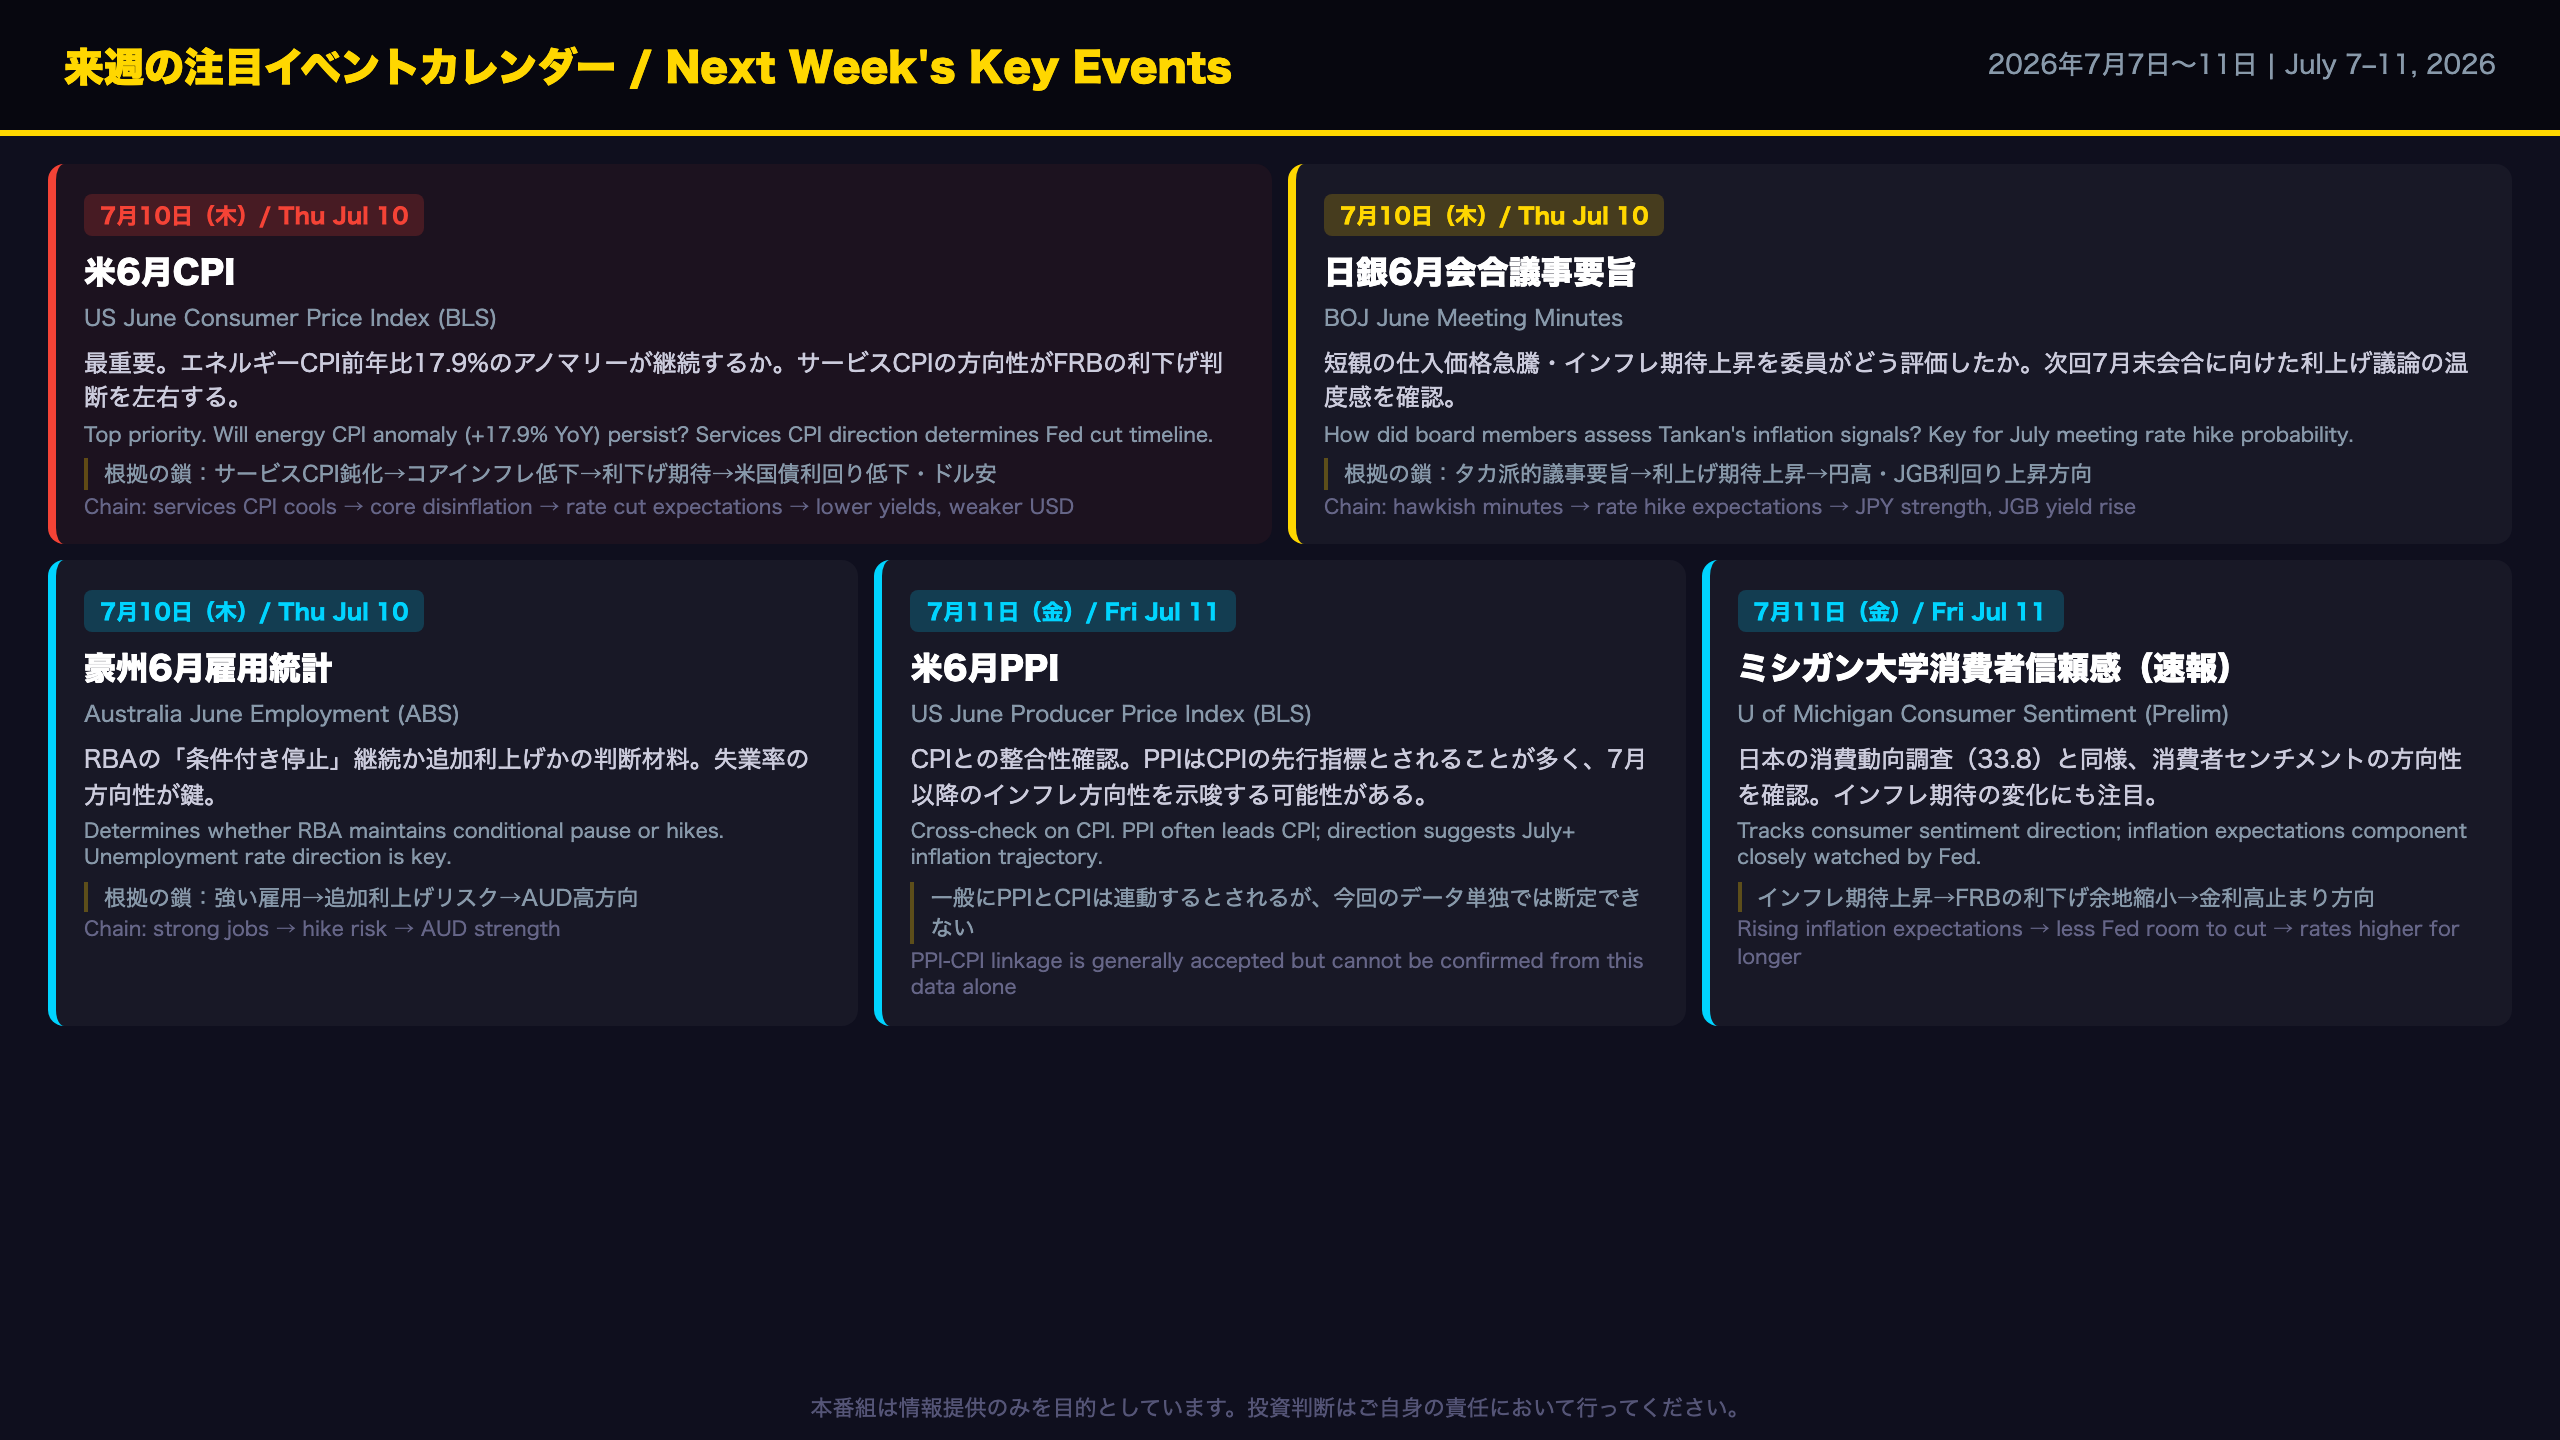
Next Week’s Event Calendar: Three Potential Inflection Points
Top Priority: US June CPI (July 10)
With labor market softening confirmed by this week’s payrolls report, next week’s CPI becomes the single most important data point for Fed policy expectations.
The Causal Chain:
– Energy CPI at +17.9% YoY (HMM anomaly, Z=2.40) → upward pressure on headline CPI → delays Fed rate cut timeline
– If services CPI cools → core inflation declining → rate cut expectations build → Treasury yields fall, USD weakens
– If services CPI stays elevated → “higher for longer” scenario returns → Treasury yields rise, USD strengthens
Note: this causal chain relies on general market mechanisms; the actual market reaction will depend on the magnitude of the surprise relative to consensus expectations.
BOJ June Meeting Minutes (July 10)
The June Tankan showed input price DI surging 16 points and corporate inflation expectations rising across all time horizons. The minutes will reveal how BOJ board members assessed these signals at the June meeting — and whether the language around the next rate hike has shifted.
Australia June Employment (July 10)
The RBA’s June minutes explicitly retained the option to hike. A strong employment report (unemployment rate falling, hours worked rising) would increase the probability of a July hike. A weak report would support the conditional pause.
US June PPI (July 11)
PPI is generally considered a leading indicator for CPI, as producer price changes tend to pass through to consumer prices with a lag. A PPI surprise in either direction would inform expectations for July CPI.
Additional Events
- July 9: US May wholesale inventories (final)
- July 10: UK May GDP (monthly)
- July 11: University of Michigan consumer sentiment (preliminary)
Disclaimer: This article is for informational purposes only. All investment decisions are made solely at your own risk.