📺 Watch the Full Video Analysis
This article was automatically generated by the NFC Market Live AI analysis system. (Updated: 2026-08-09 08:41 JST)
This week’s global macro roundup📊
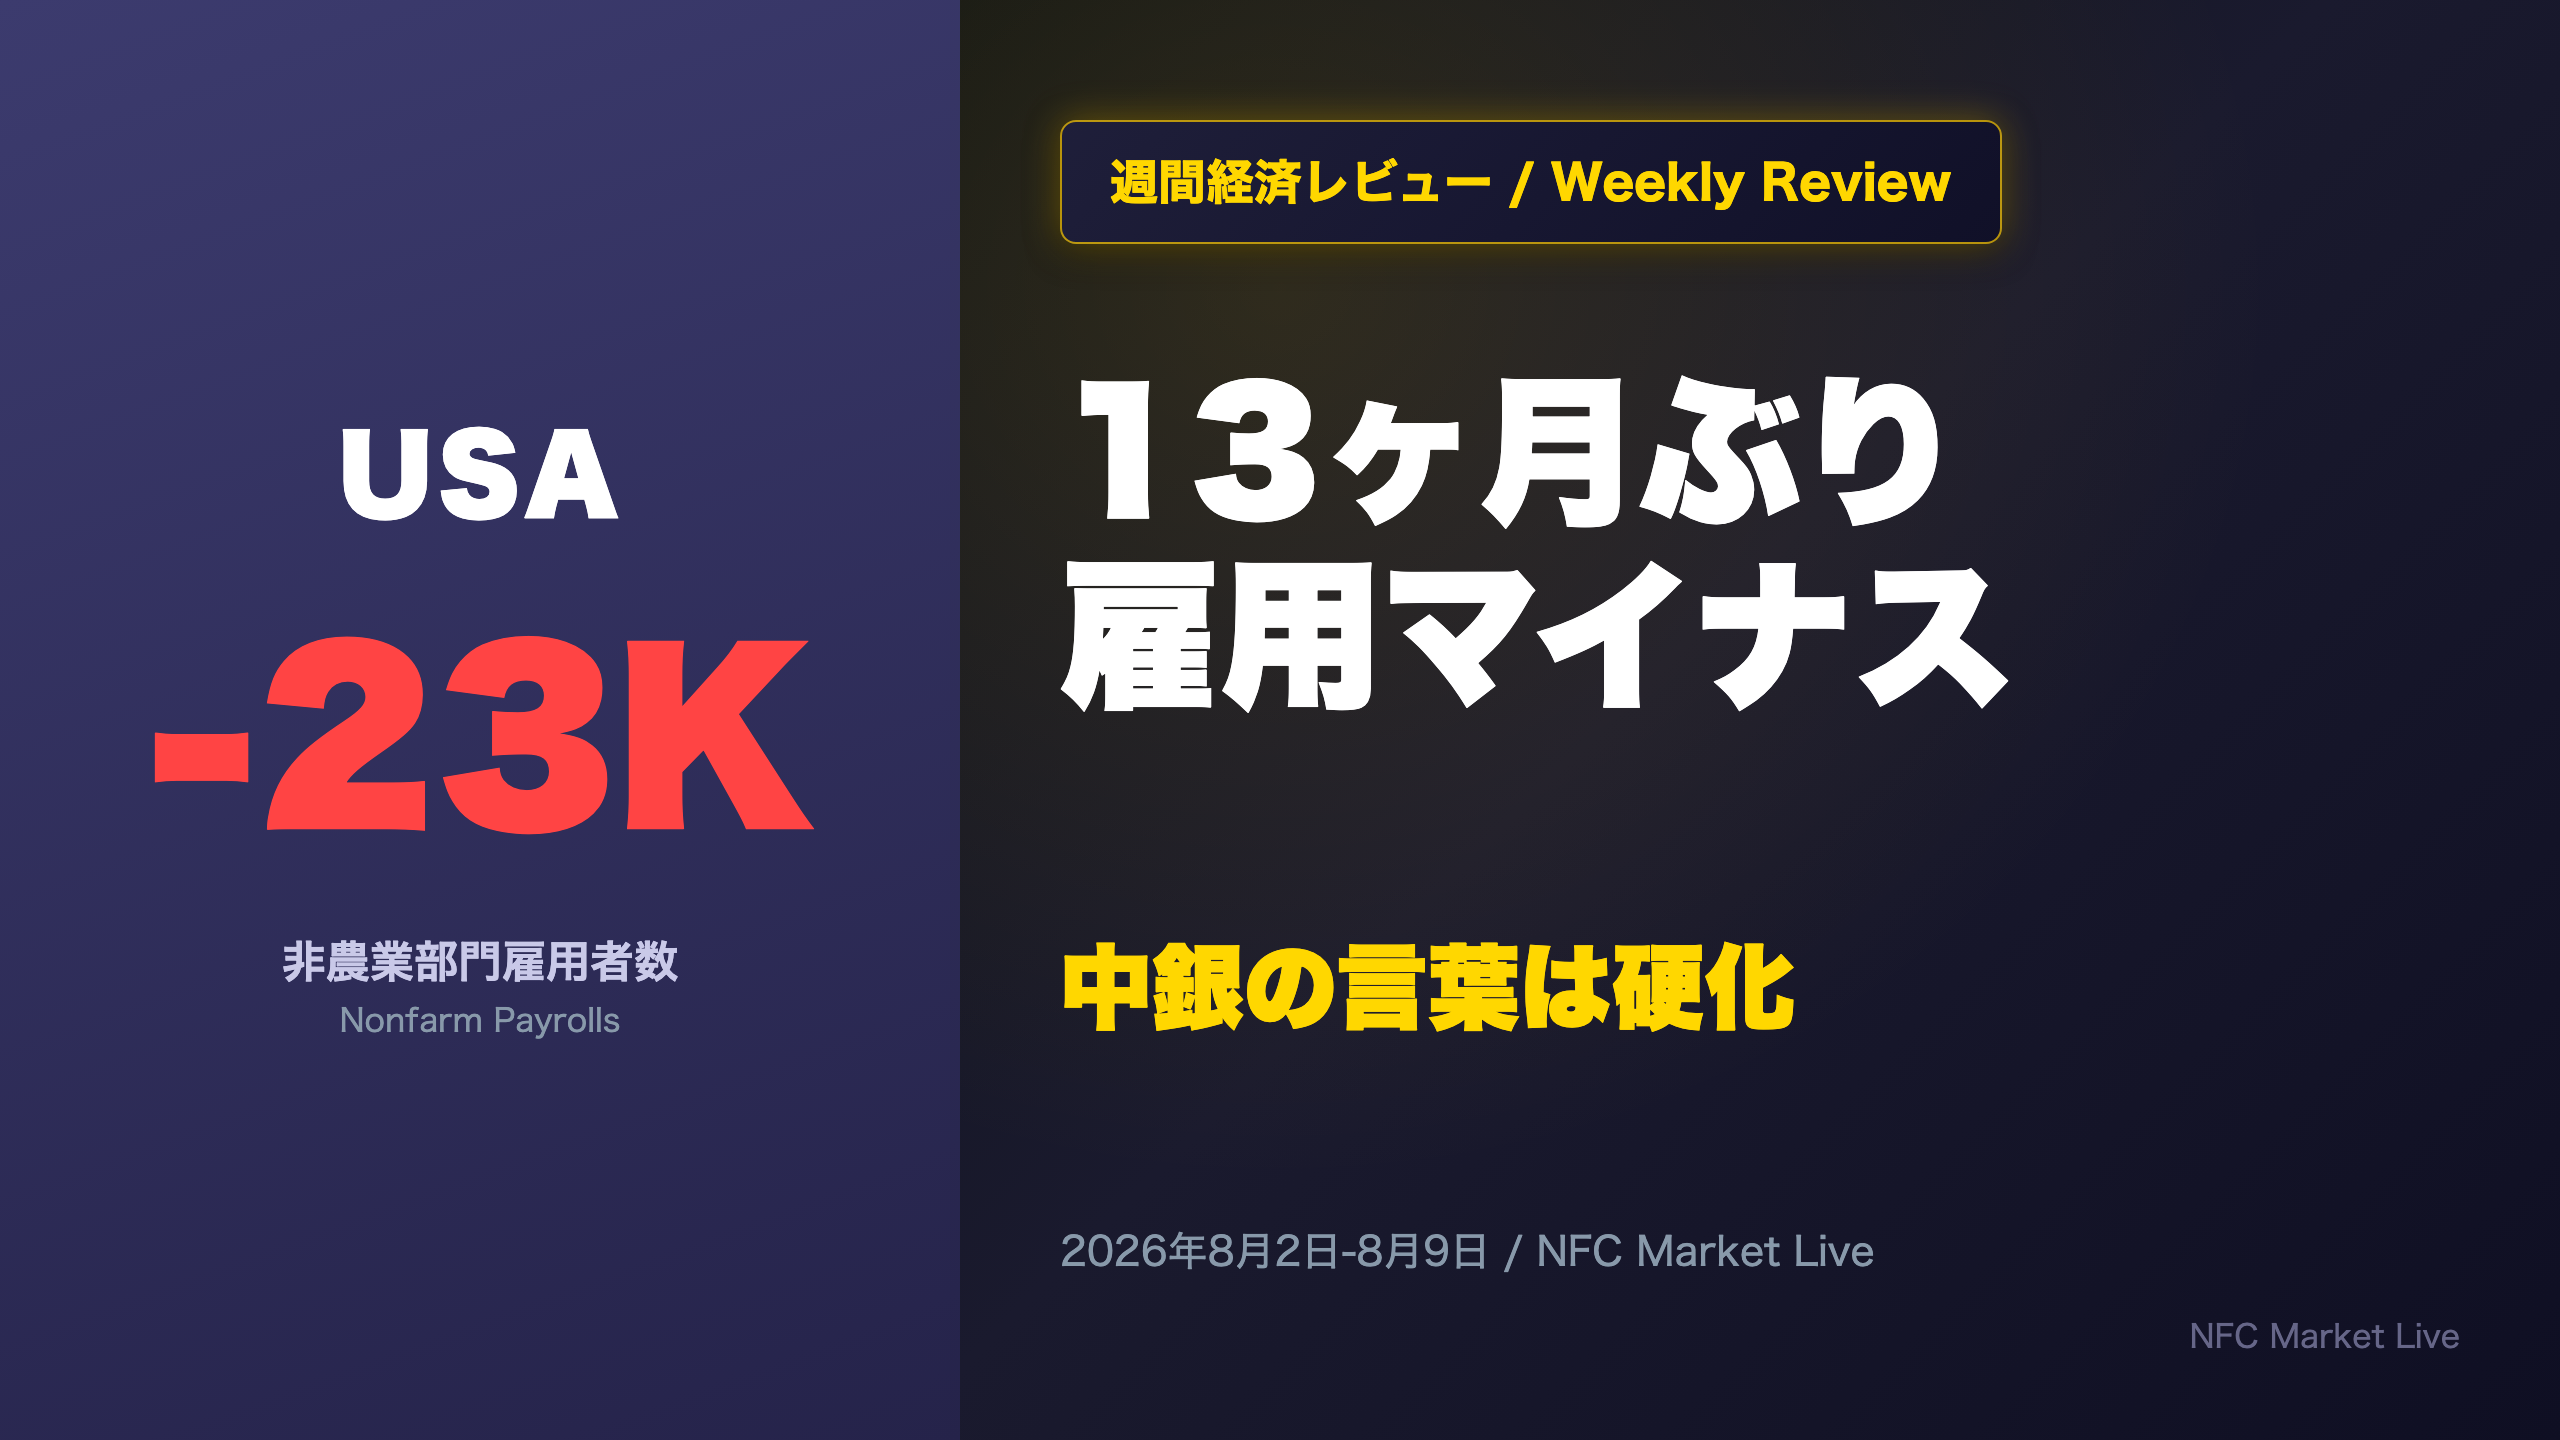
US nonfarm payrolls turned negative for the first time in 13 months, with May-June revised down over 100K combined🇺🇸
Canada added 75K jobs, unemployment at a 2-year low🇨🇦
Japan’s real wages logged a 6th straight monthly gain, even as the monetary base contracted at a record pace🇯🇵
Brazil’s COPOM cut rates again but added new “upside asymmetry” language, while Mexico’s Banxico pushed back its inflation convergence timeline💡
Hard data diverged by country, but central bank rhetoric broadly hardened.
Next week: US CPI, PPI, and Japan’s Q2 GDP preliminary are the key tests⚠️
オープニング:週間経済レビュー

This Week’s Highlights
The week of August 2-9, 2026 stood out for a notable divergence: hard economic data showed mixed strength across countries, while several central banks — spanning vastly different policy stages — hardened their communicated tone.
Key Topics Covered
- US jobs report: First negative print in 13 months, with sharp downward revisions to prior months
- Bank of Japan (BOJ): Simultaneously hiked rates and halted quantitative tightening (QT) tapering
- Brazil’s COPOM & Mexico’s Banxico: Both added more cautious language to their policy statements
- Corporate earnings: Strong prints from Palantir, Caterpillar, AMD, and SpaceX
This episode unpacks each of these developments in detail before looking ahead to next week’s key economic releases, which will test whether this week’s central bank caution proves warranted.
今週の総括:底堅い実体、硬化する中銀の言葉
The Week in One Line
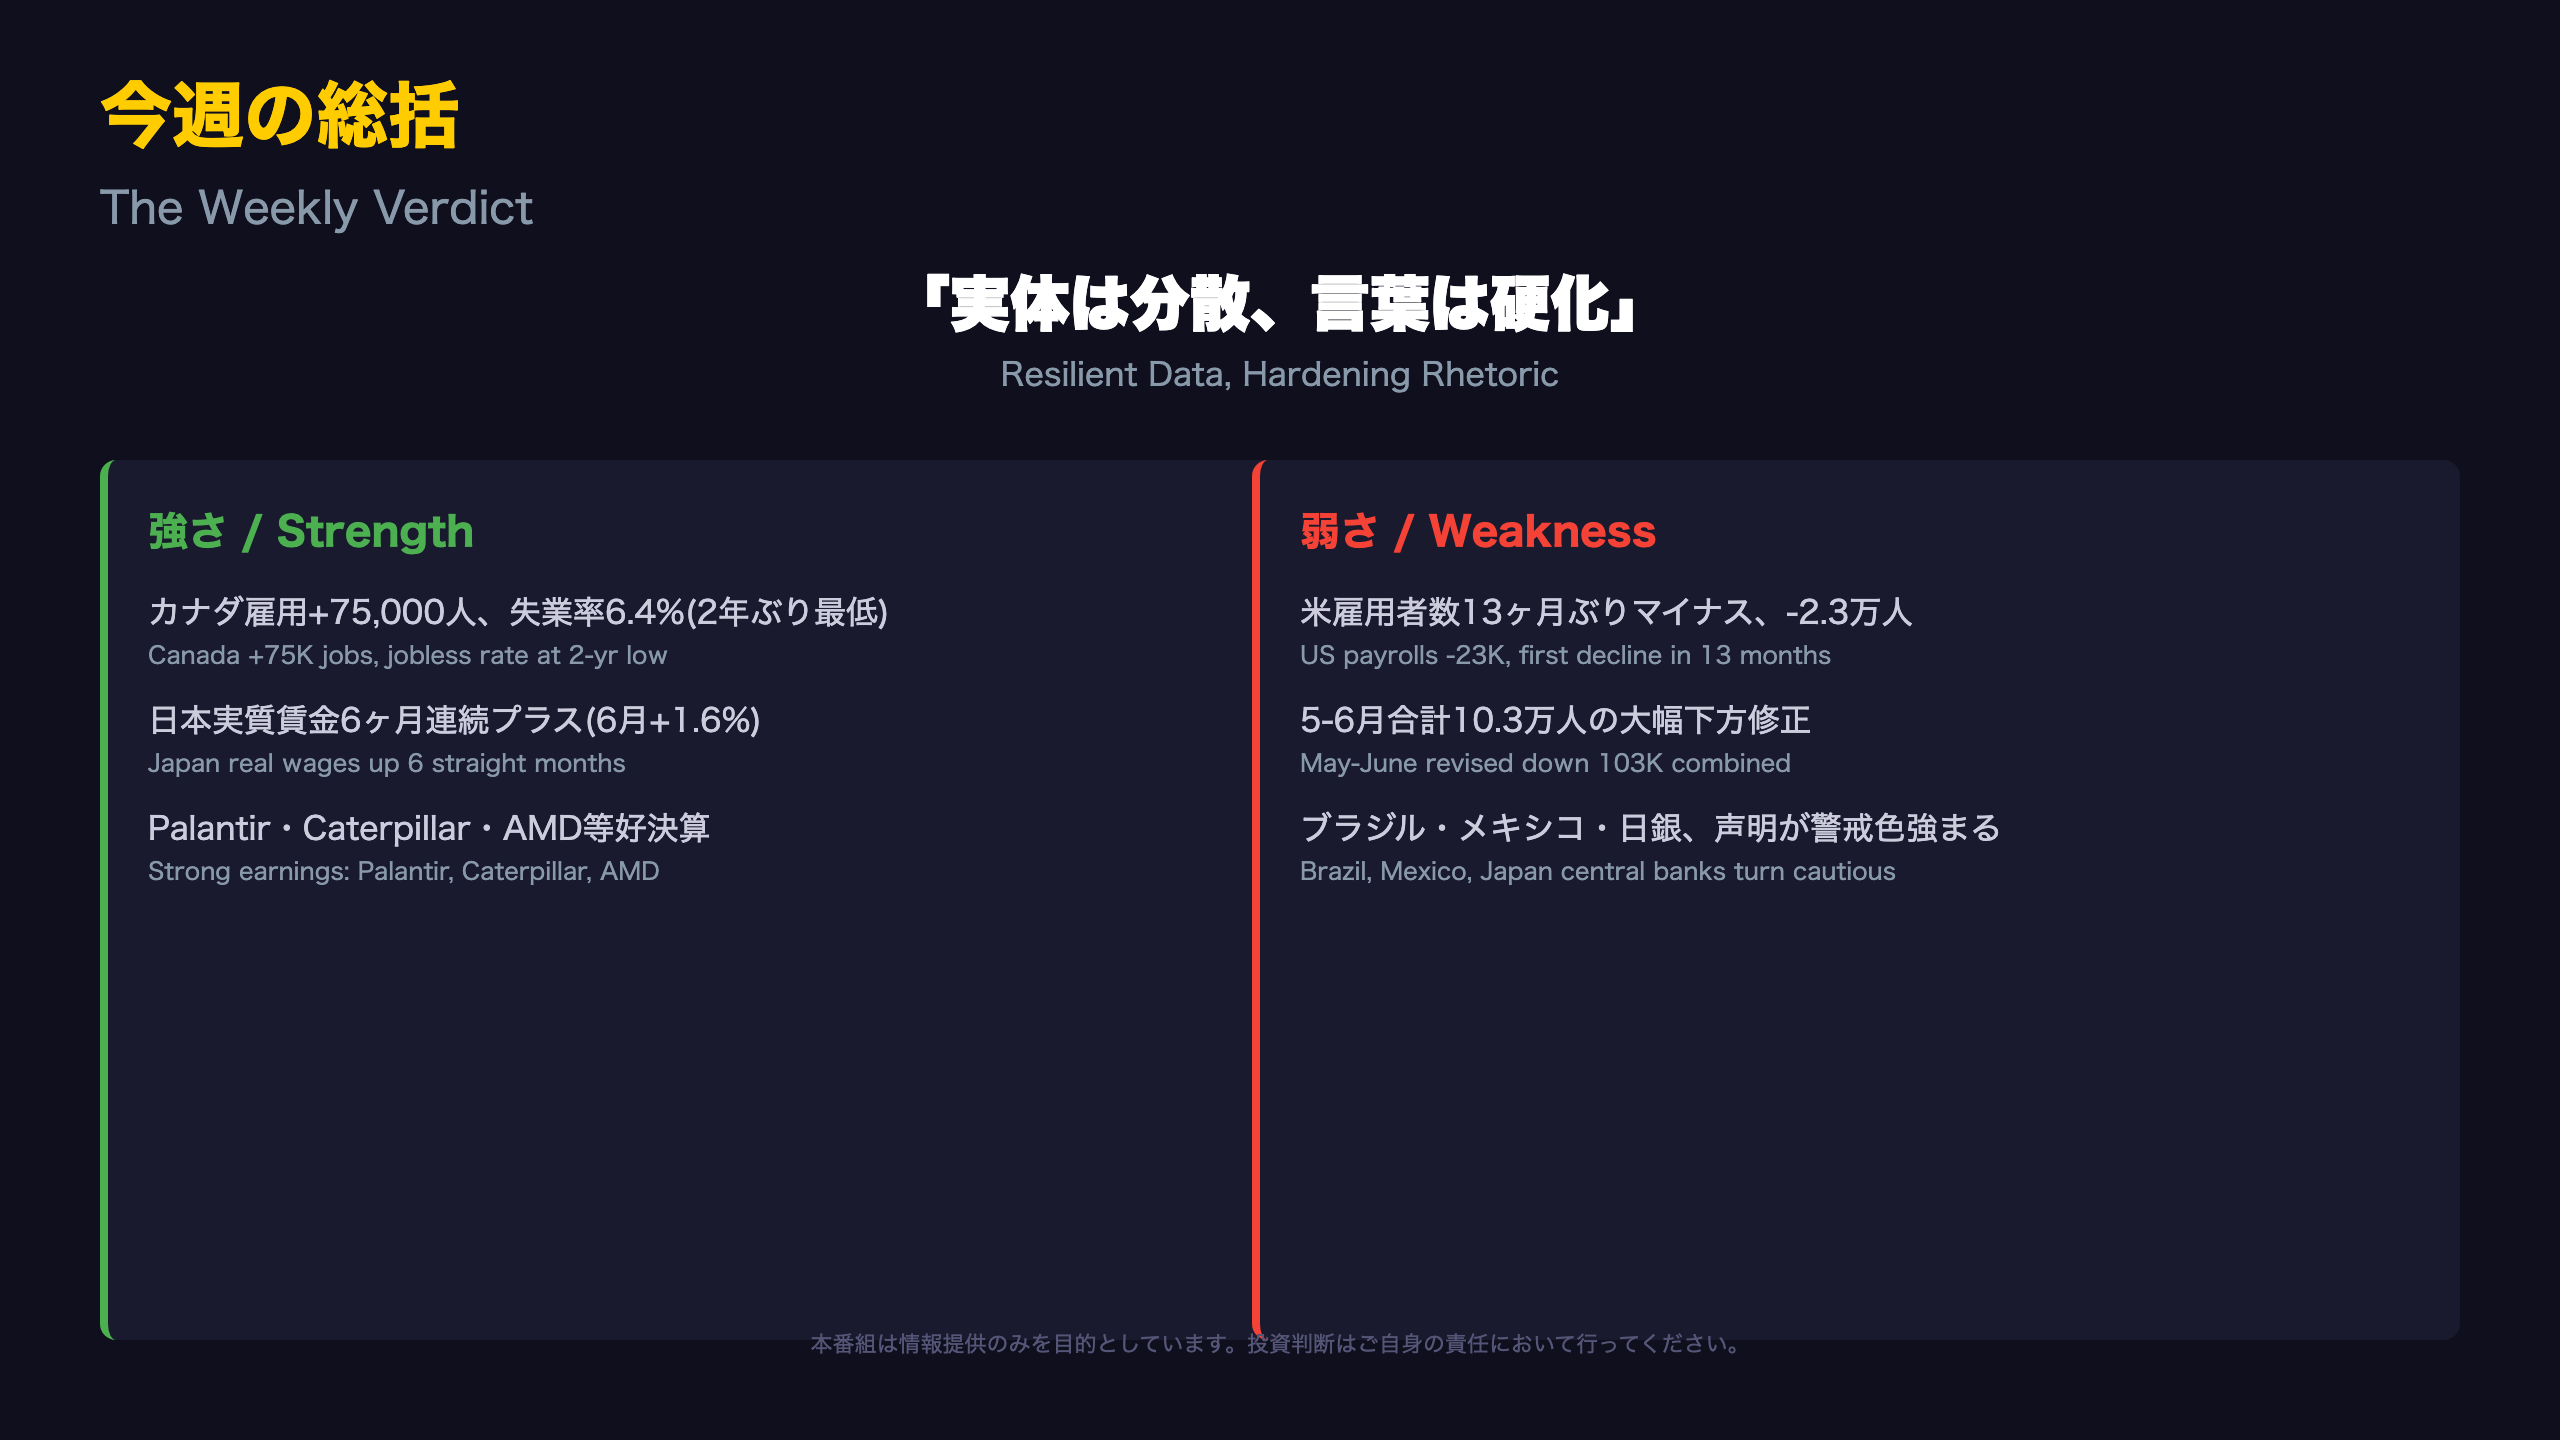
“Resilient data, hardening rhetoric” sums up the week of August 2-9, 2026. While hard economic data sent mixed signals across countries, central bank communications from Brazil, Mexico, and Japan uniformly hardened in tone.
The Week’s Biggest Surprise
The US Bureau of Labor Statistics (BLS) jobs report showed nonfarm payrolls falling by 23,000 in July — the first monthly decline in 13 months. Just as notable: May and June figures were revised down by a combined 103,000, illustrating how preliminary estimates can overstate the pace of hiring. The BLS itself described both figures as having “changed little” in statistical terms, given the survey’s roughly 122,000 significance threshold.
What Went As Expected
Brazil’s COPOM (the central bank’s monetary policy committee) delivered its widely anticipated 25bp cut to 14.00%, while Mexico’s Banxico held steady at 6.50% — both moves fully priced in by markets.
Overlooked Strength
For readers unfamiliar with Japan’s wage dynamics: real wages have now posted six consecutive months of gains (+1.6% YoY in June), a notable shift after 12 straight months of declines in 2025. Meanwhile, Canada’s unemployment rate fell to a two-year low of 6.4%, and corporate earnings from Palantir, Caterpillar, and AMD all set records this week.
Bottom Line for Markets
The divergence between resilient (if uneven) hard data and increasingly cautious central bank language — particularly the explicit “upside asymmetry” risk language newly added to Brazil’s COPOM statement — suggests policymakers are positioning for surprises even as current data doesn’t scream alarm. Next week’s US CPI and PPI releases will be the first real test of whether this rhetorical caution is warranted.
米雇用市場:潮目の変化とカナダとの明暗
A Quiet US Slowdown, A Canadian Bright Spot
For international investors, the US Bureau of Labor Statistics (BLS) Employment Situation report is the single most closely watched monthly US indicator, directly influencing Federal Reserve rate expectations. This week’s release showed nonfarm payrolls falling 23,000 in July — the first negative print in 13 months.
Why the Revisions Matter More Than the Headline
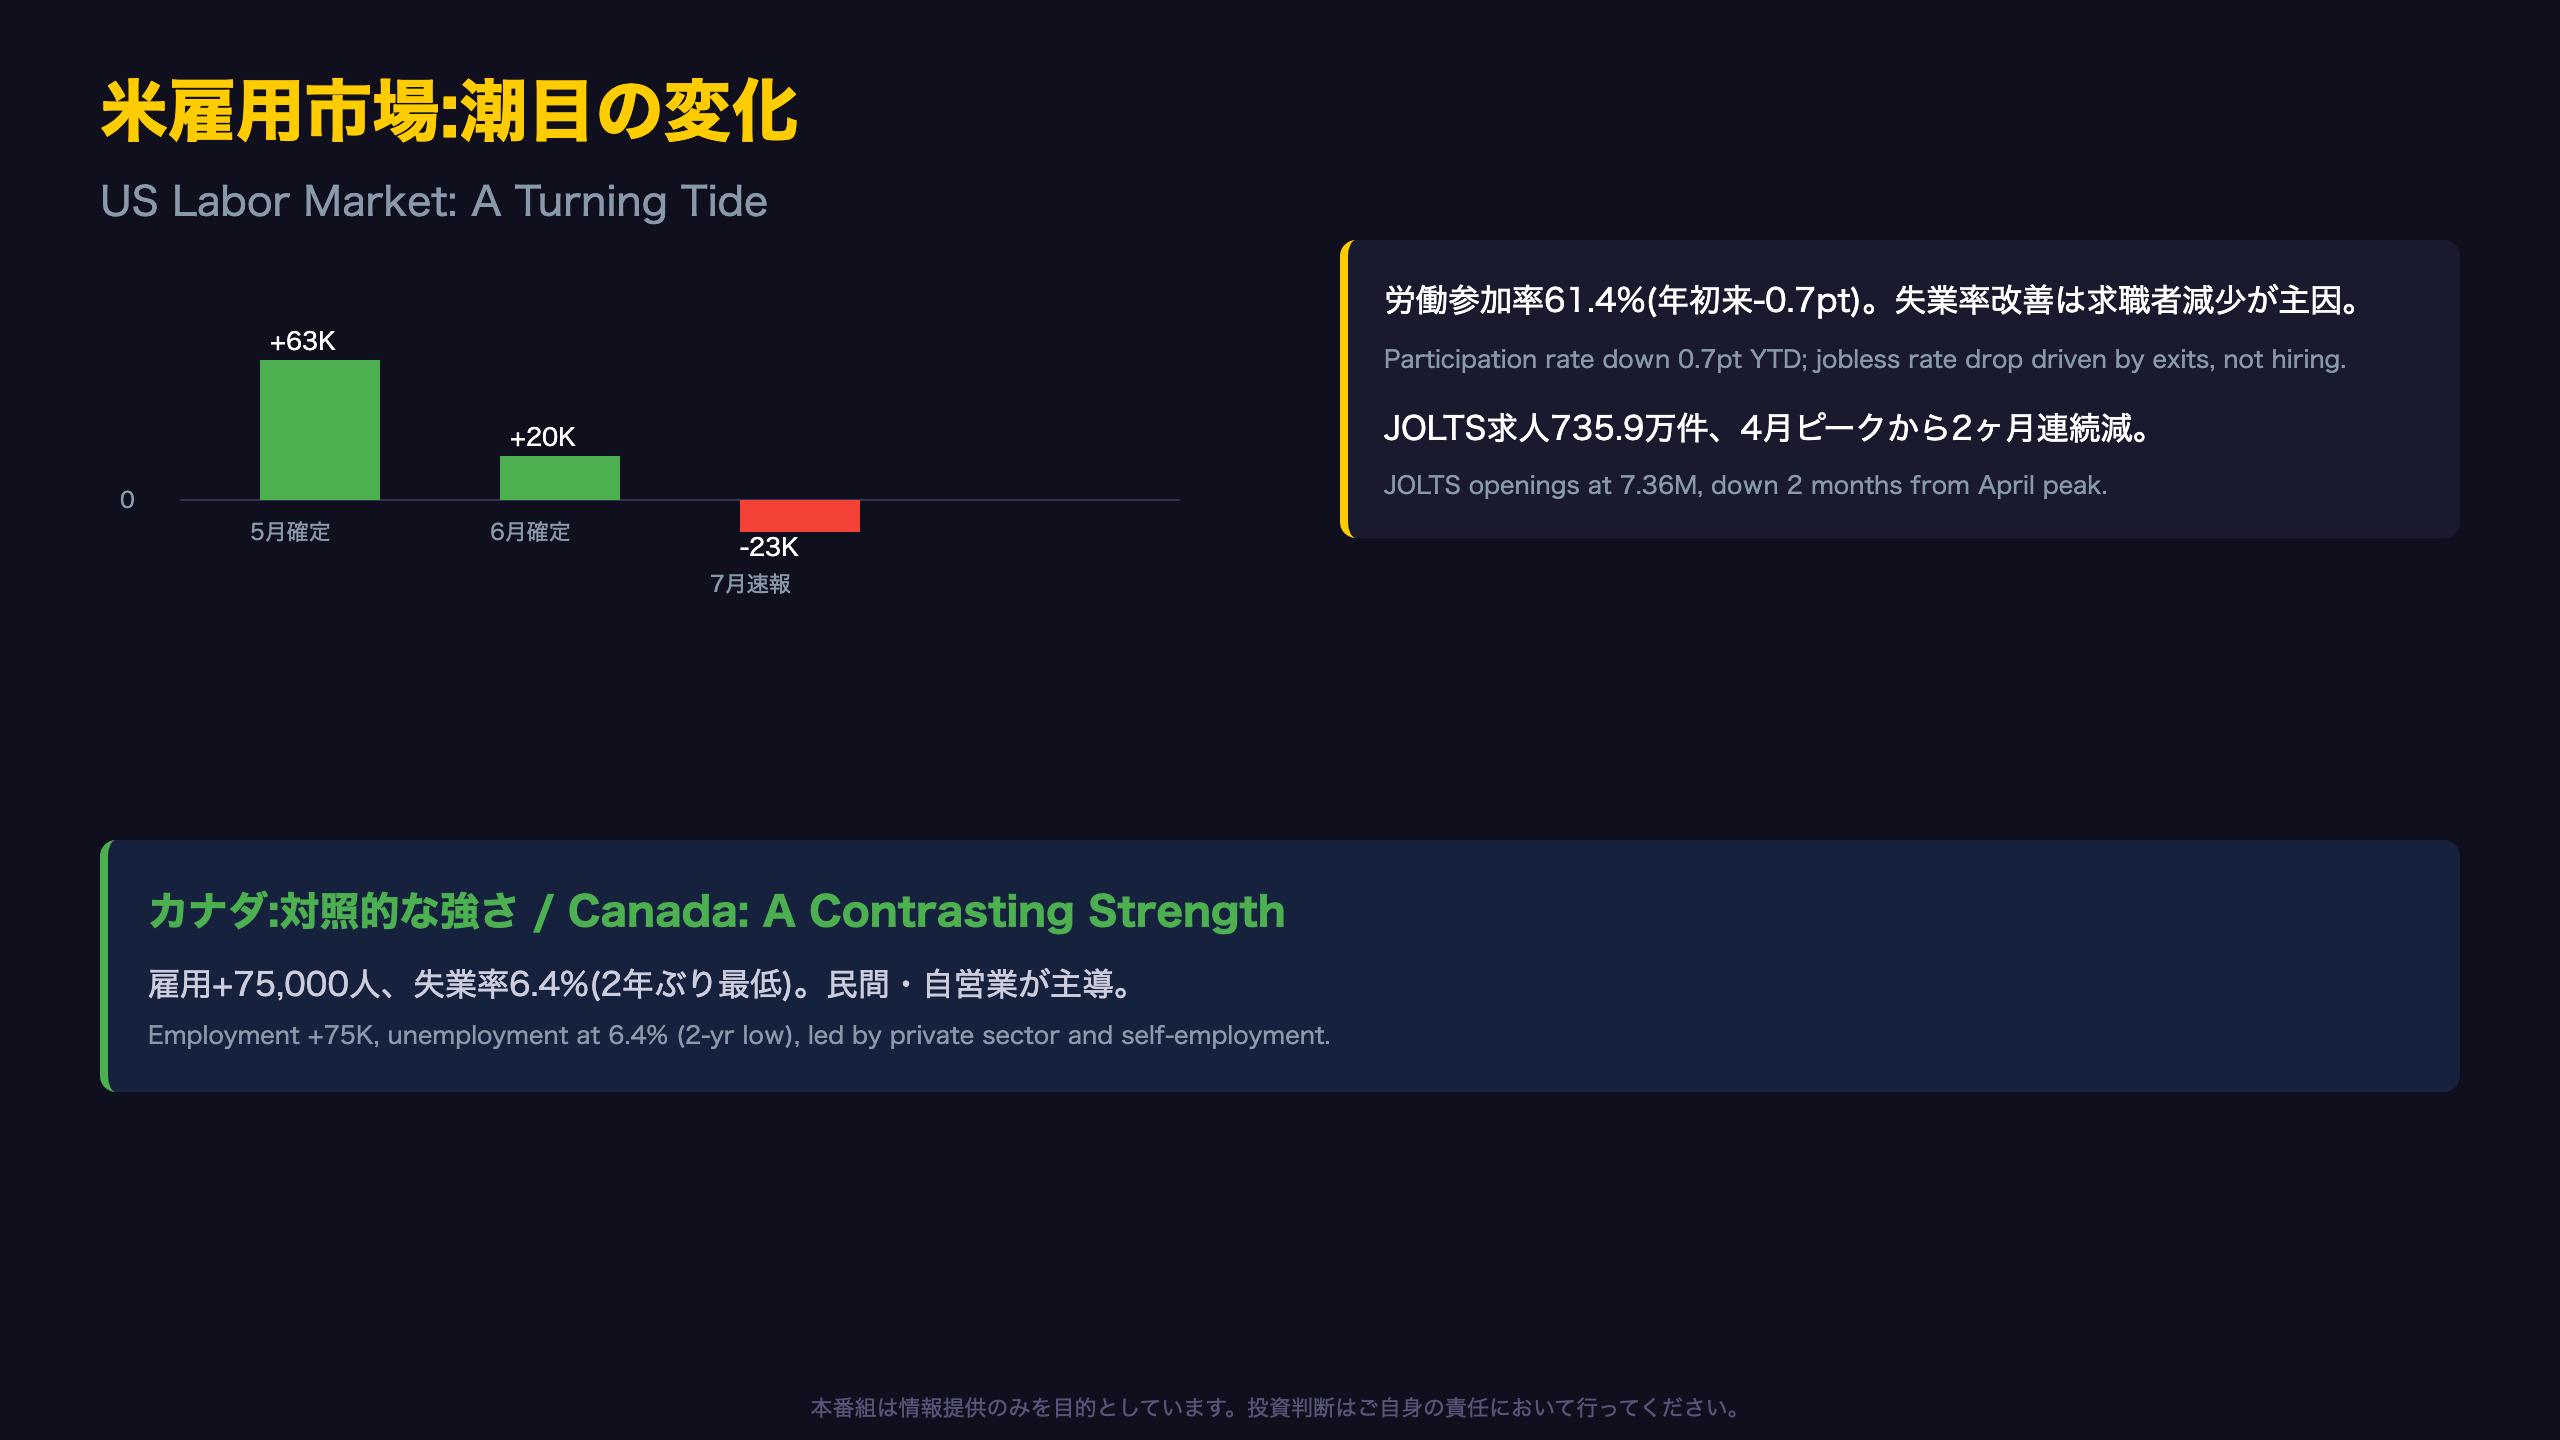
The BLS’s own statistical significance threshold for the establishment survey is roughly 122,000 — meaning July’s -23,000 alone doesn’t clear the bar for a “significant” change on its own. What’s more consequential is the two-month revision cascade: May was cut from +129,000 to +63,000, and June from +57,000 to +20,000, erasing a combined 103,000 jobs from prior estimates. The 3-month moving average has now fallen from +142,000 (as of May) to just +20,000 (as of July) — a trend that’s hard to dismiss as noise.
The Participation Rate Caveat
The unemployment rate ticked down to 4.1%, but this was driven primarily by a declining labor force participation rate (61.4%, down 0.7 points since January) rather than robust hiring — a distinction that matters for correctly interpreting the “improvement.”
Canada Tells a Different Story
Statistics Canada reported employment up 75,000 in July, pushing the unemployment rate down to 6.4% — its lowest level since July 2024. Private-sector employment (+58,000) and self-employment (+44,000) led the gains. This divergence between two economically linked North American neighbors is a reminder that even correlated economies can diverge sharply within a single month.
What to Watch Next
The next US jobs report (August data) arrives September 4, alongside a preliminary annual benchmark revision on August 28 that could further reshape the picture.
中銀の”言葉”が硬化:日銀・ブラジル・メキシコ
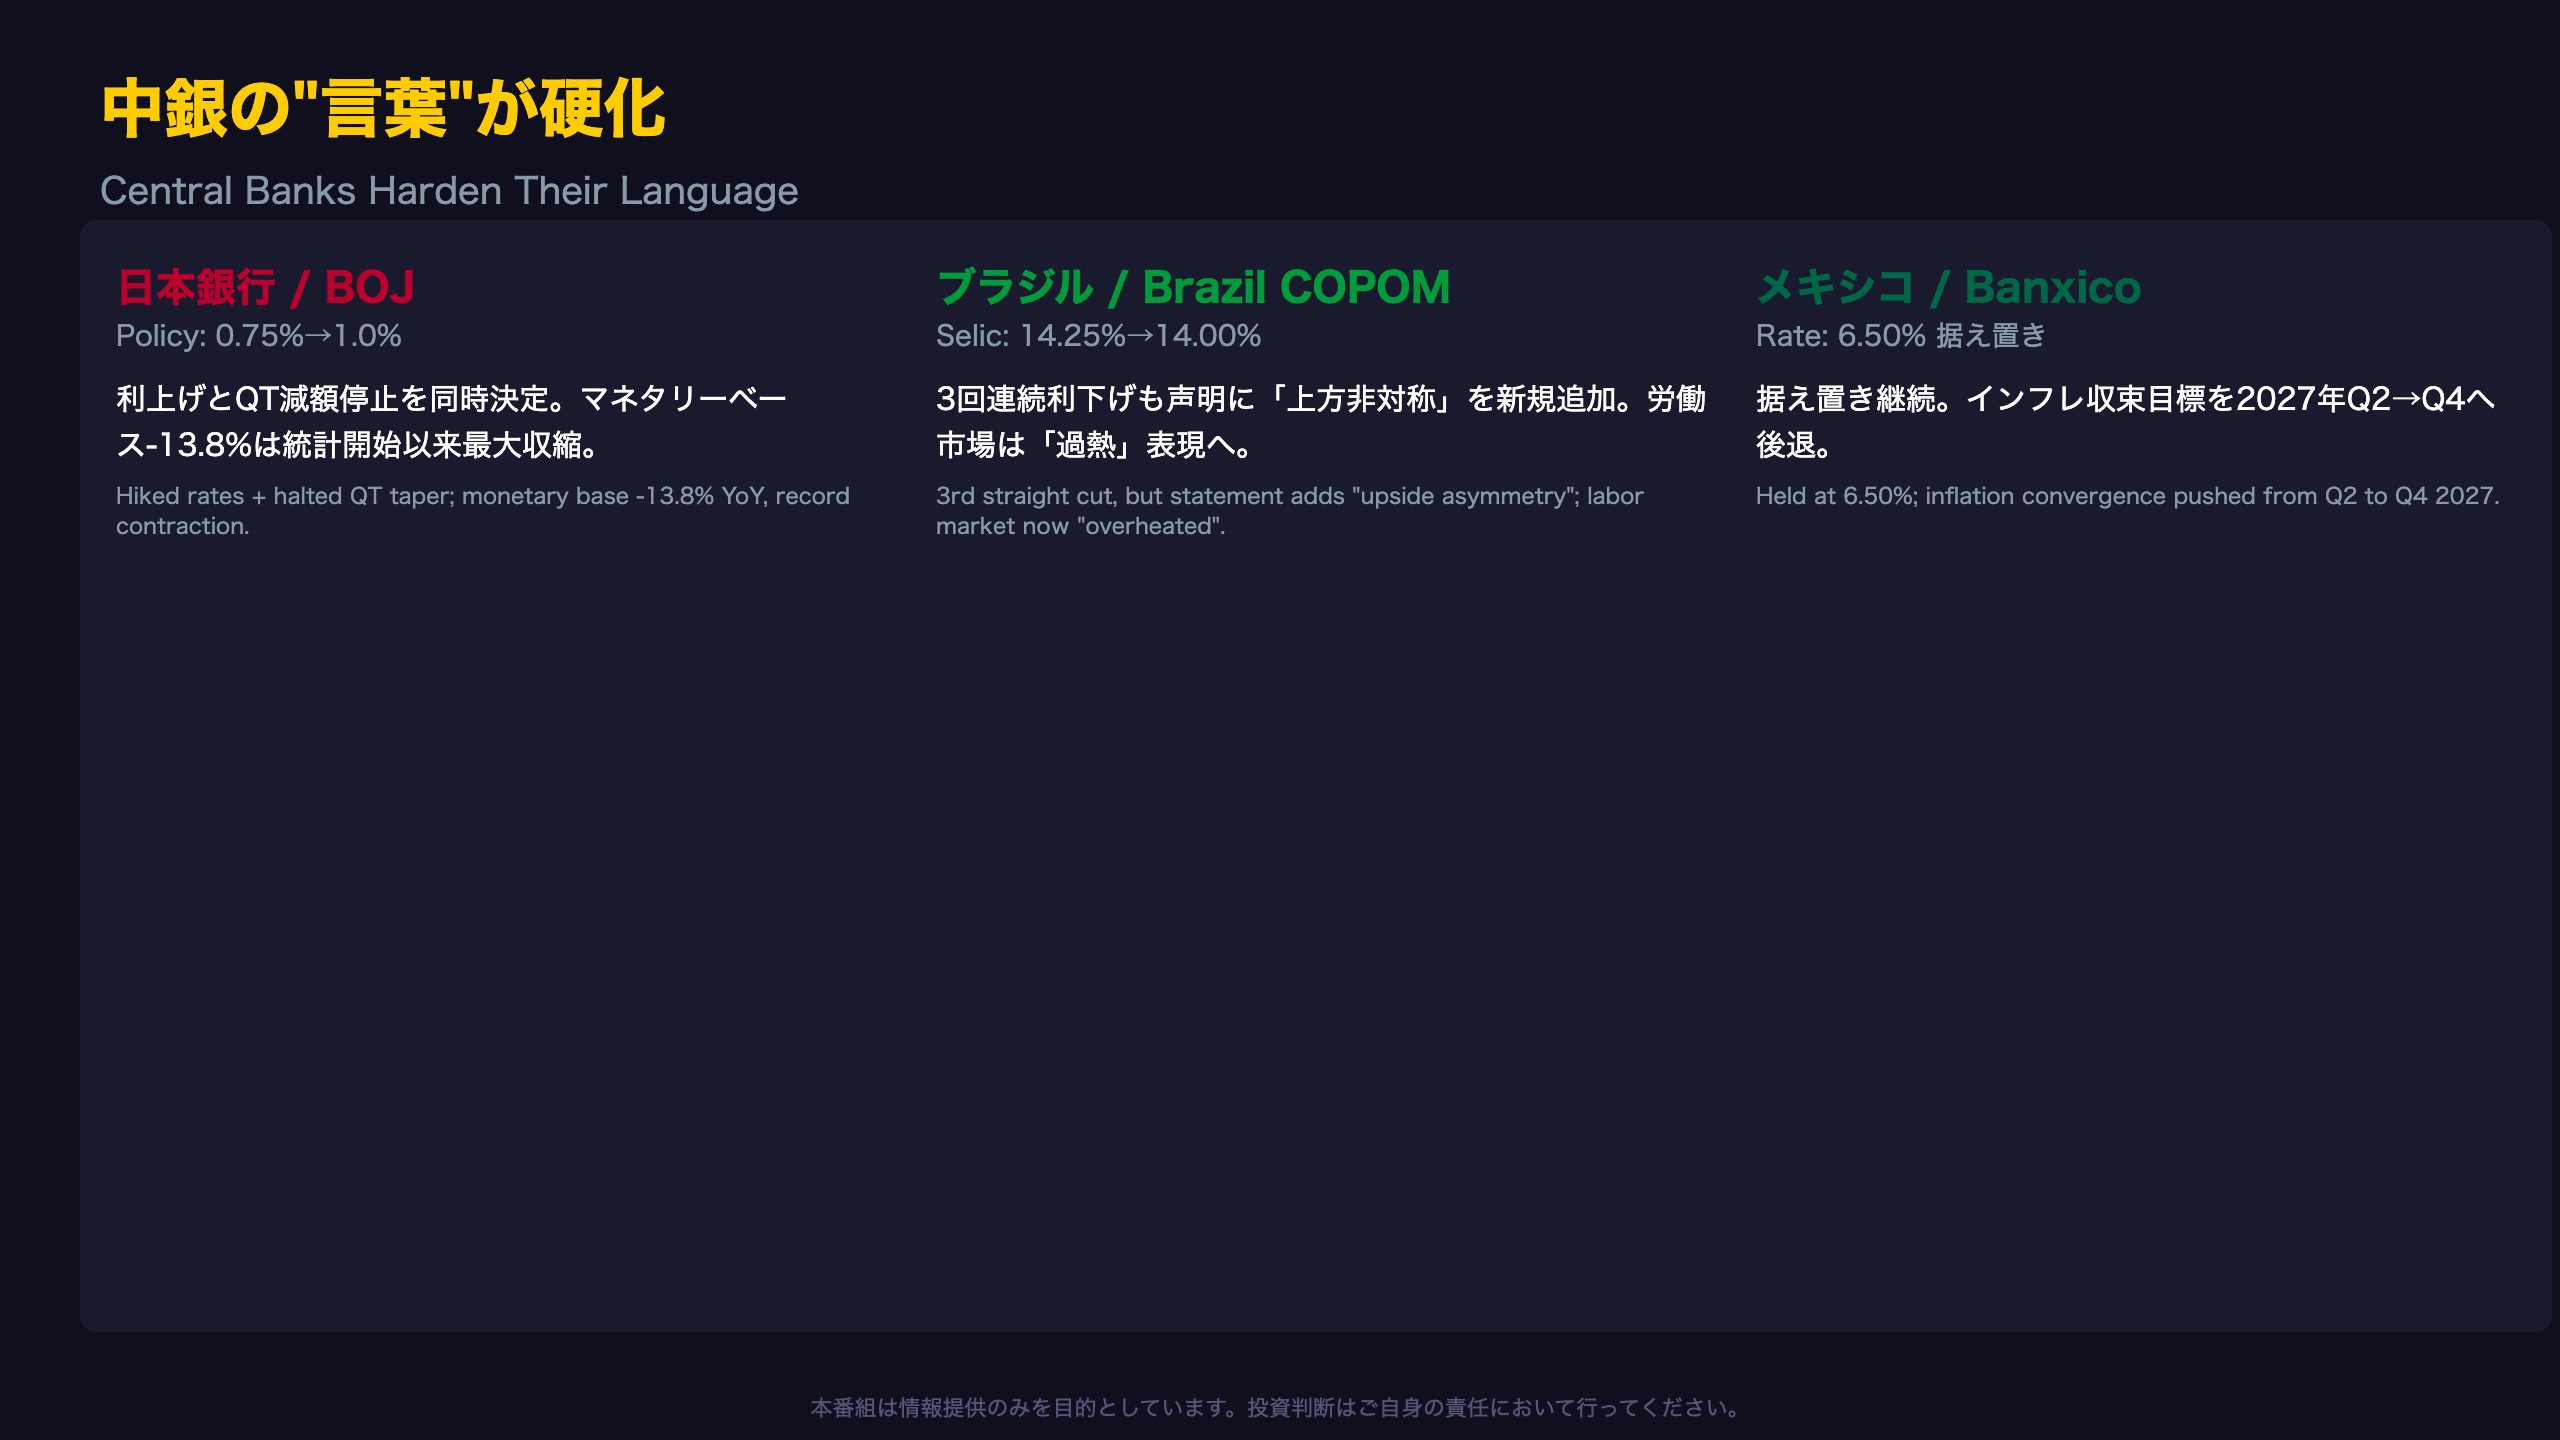
When Actions and Words Diverge: Three Central Banks This Week
Bank of Japan (BOJ): Hiking Rates While Halting QT Tapering
For readers unfamiliar with Japan’s policy framework: the BOJ has been simultaneously raising rates from near-zero and shrinking its enormous government bond holdings (quantitative tightening, or QT) built up during years of ultra-easy policy. This week’s minutes revealed the June 15-16 meeting delivered a rate hike to 1.0% (7-1 vote) alongside a decision to halt further QT tapering from April 2027, maintaining bond purchases at roughly \u00a52 trillion/month. Notably, July’s monetary base contracted -13.8% year-over-year — the sharpest pace since records began — with current account deposits at banks down -16.6%.
Brazil’s COPOM: Cutting Rates, Adding Hawkish Language
Brazil’s central bank (Banco Central do Brasil) cut its Selic rate to 14.00% on August 5 — the third consecutive 25bp cut, unanimously approved. Yet the statement newly inserted the phrase “upside asymmetry” (assimetria altista) to describe inflation risks, and upgraded its labor market description from “resilient signs” to “overheated” (aquecido).
Mexico’s Banxico: Pushing Back the Inflation Timeline
Mexico’s central bank held its policy rate at 6.50% but pushed back its inflation convergence target from Q2 2027 to Q4 2027 — a delay of roughly two quarters, even as the ultimate 2028 target of 3.0% remained unchanged.
The Common Thread
None of these three central banks — at vastly different stages of their policy cycles — signaled an imminent shift in action. But all three hardened their rhetoric, suggesting a shared, precautionary stance ahead of potential upside inflation surprises. This is a pattern (Level B inference) rather than a confirmed causal link across institutions, since each statement reflects distinct domestic conditions.
中銀スタンスの現在地:安定のBOC、不確実なECBと米国
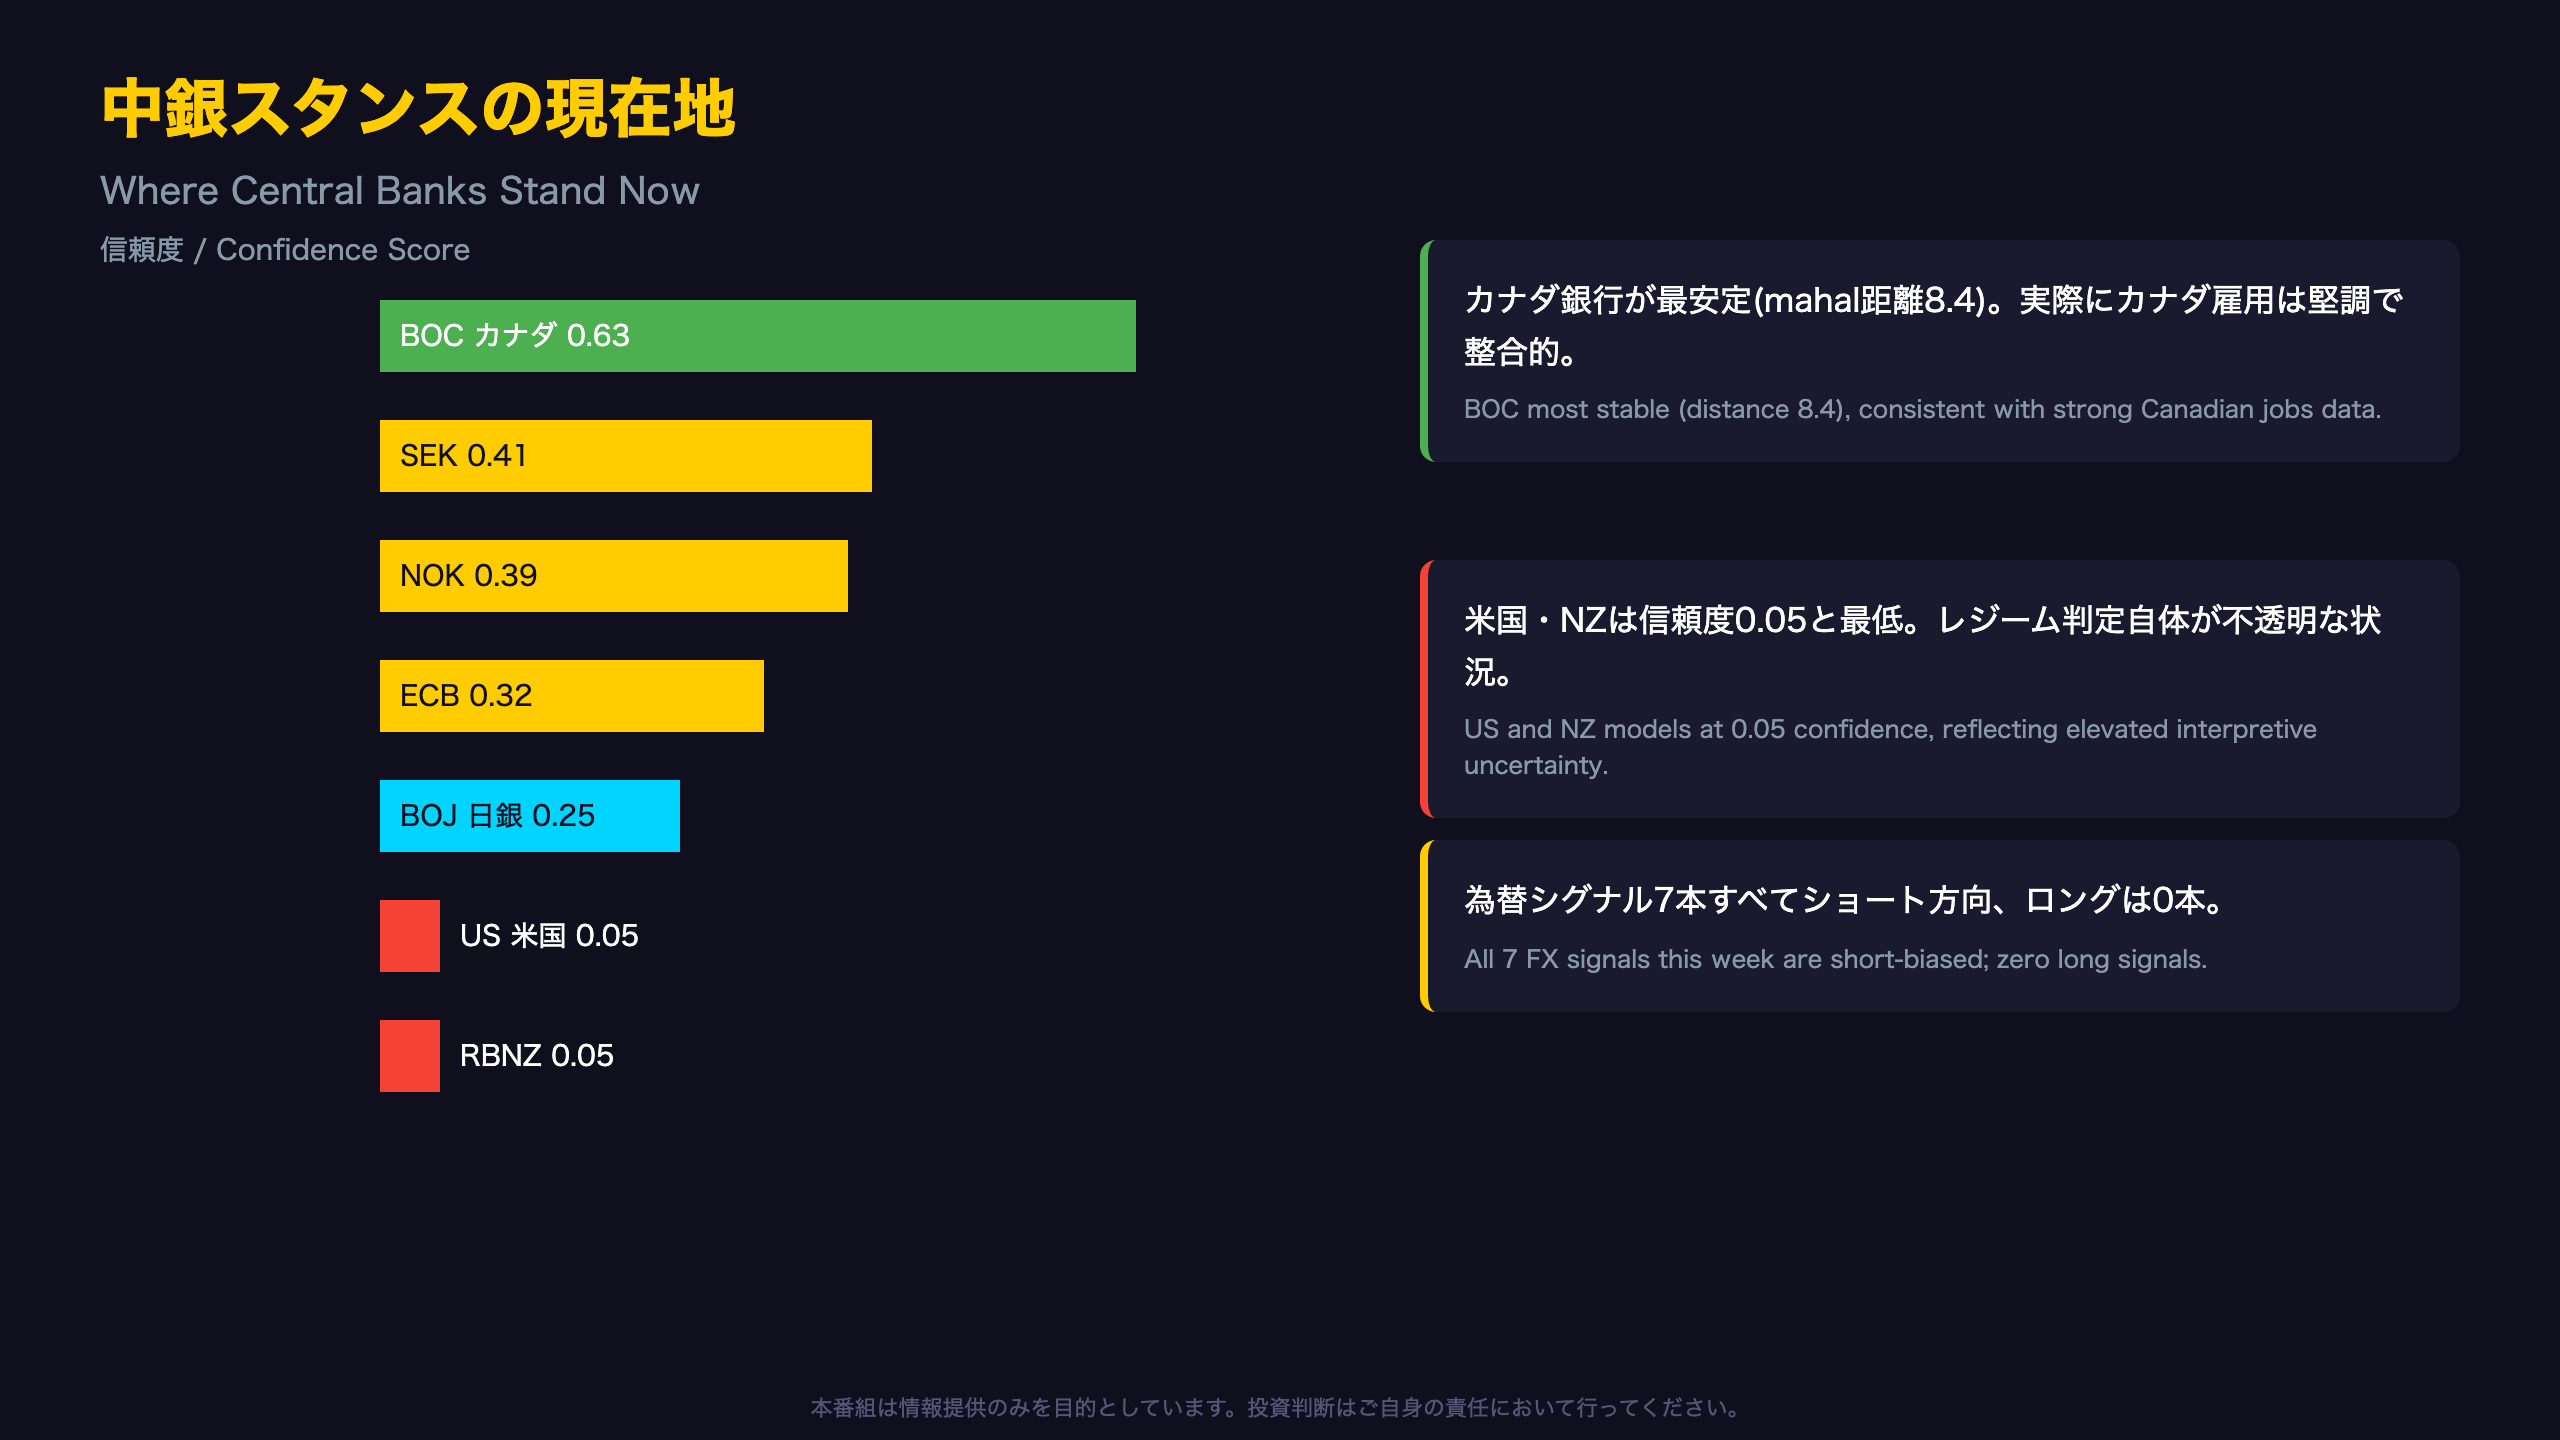
Reading the Central Bank “Stability Rankings”
This week’s quantitative regime-detection model — a Hidden Markov Model (HMM) framework that classifies central banks into statistical “regimes” based on policy and market data patterns — offers a useful cross-check against the qualitative signals discussed elsewhere in this review.
What “Confidence” Means Here
For readers unfamiliar with this methodology: the model assigns each central bank a Mahalanobis distance (a statistical measure of how far current conditions sit from a regime’s typical center) and a corresponding confidence score. A low distance with high confidence means the model has strong conviction in its classification.
Top of the Stability Table
The Bank of Canada (BOC) posted the lowest distance (8.4) and highest confidence (0.63) among all 10 central banks tracked, placing it firmly in a “Hawkish” regime. This aligns with this week’s Canadian jobs report showing unemployment at a two-year low.
Where Uncertainty Concentrates
The European Central Bank (ECB) shows a much larger distance (52.8) with only moderate confidence (0.32), reflecting genuine ambiguity in its “Mild Inflation” classification. More strikingly, the US Federal Reserve model carries the lowest confidence in the entire panel (0.05) — a statistical echo of this week’s soft and heavily-revised jobs data, which has muddied the outlook for US policy.
Trading Signal Context
The model generated seven directional signals this week, all short-biased (zero long signals) — including GBPJPY, NZDMXN, and NZDSEK flagged as “strong directional” setups. Importantly, this is presented as directional color only; the source report explicitly withholds position sizing and P&L data, cautioning that “signals from low-confidence models carry higher uncertainty.”
Bottom Line
No single central bank consensus emerges this week — rather, a bifurcated picture where Canada and Nordic banks show unusually stable hawkish footing, while the US and RBNZ models flag rising interpretive uncertainty.
今週の番組制作費:AIによる自動制作コスト
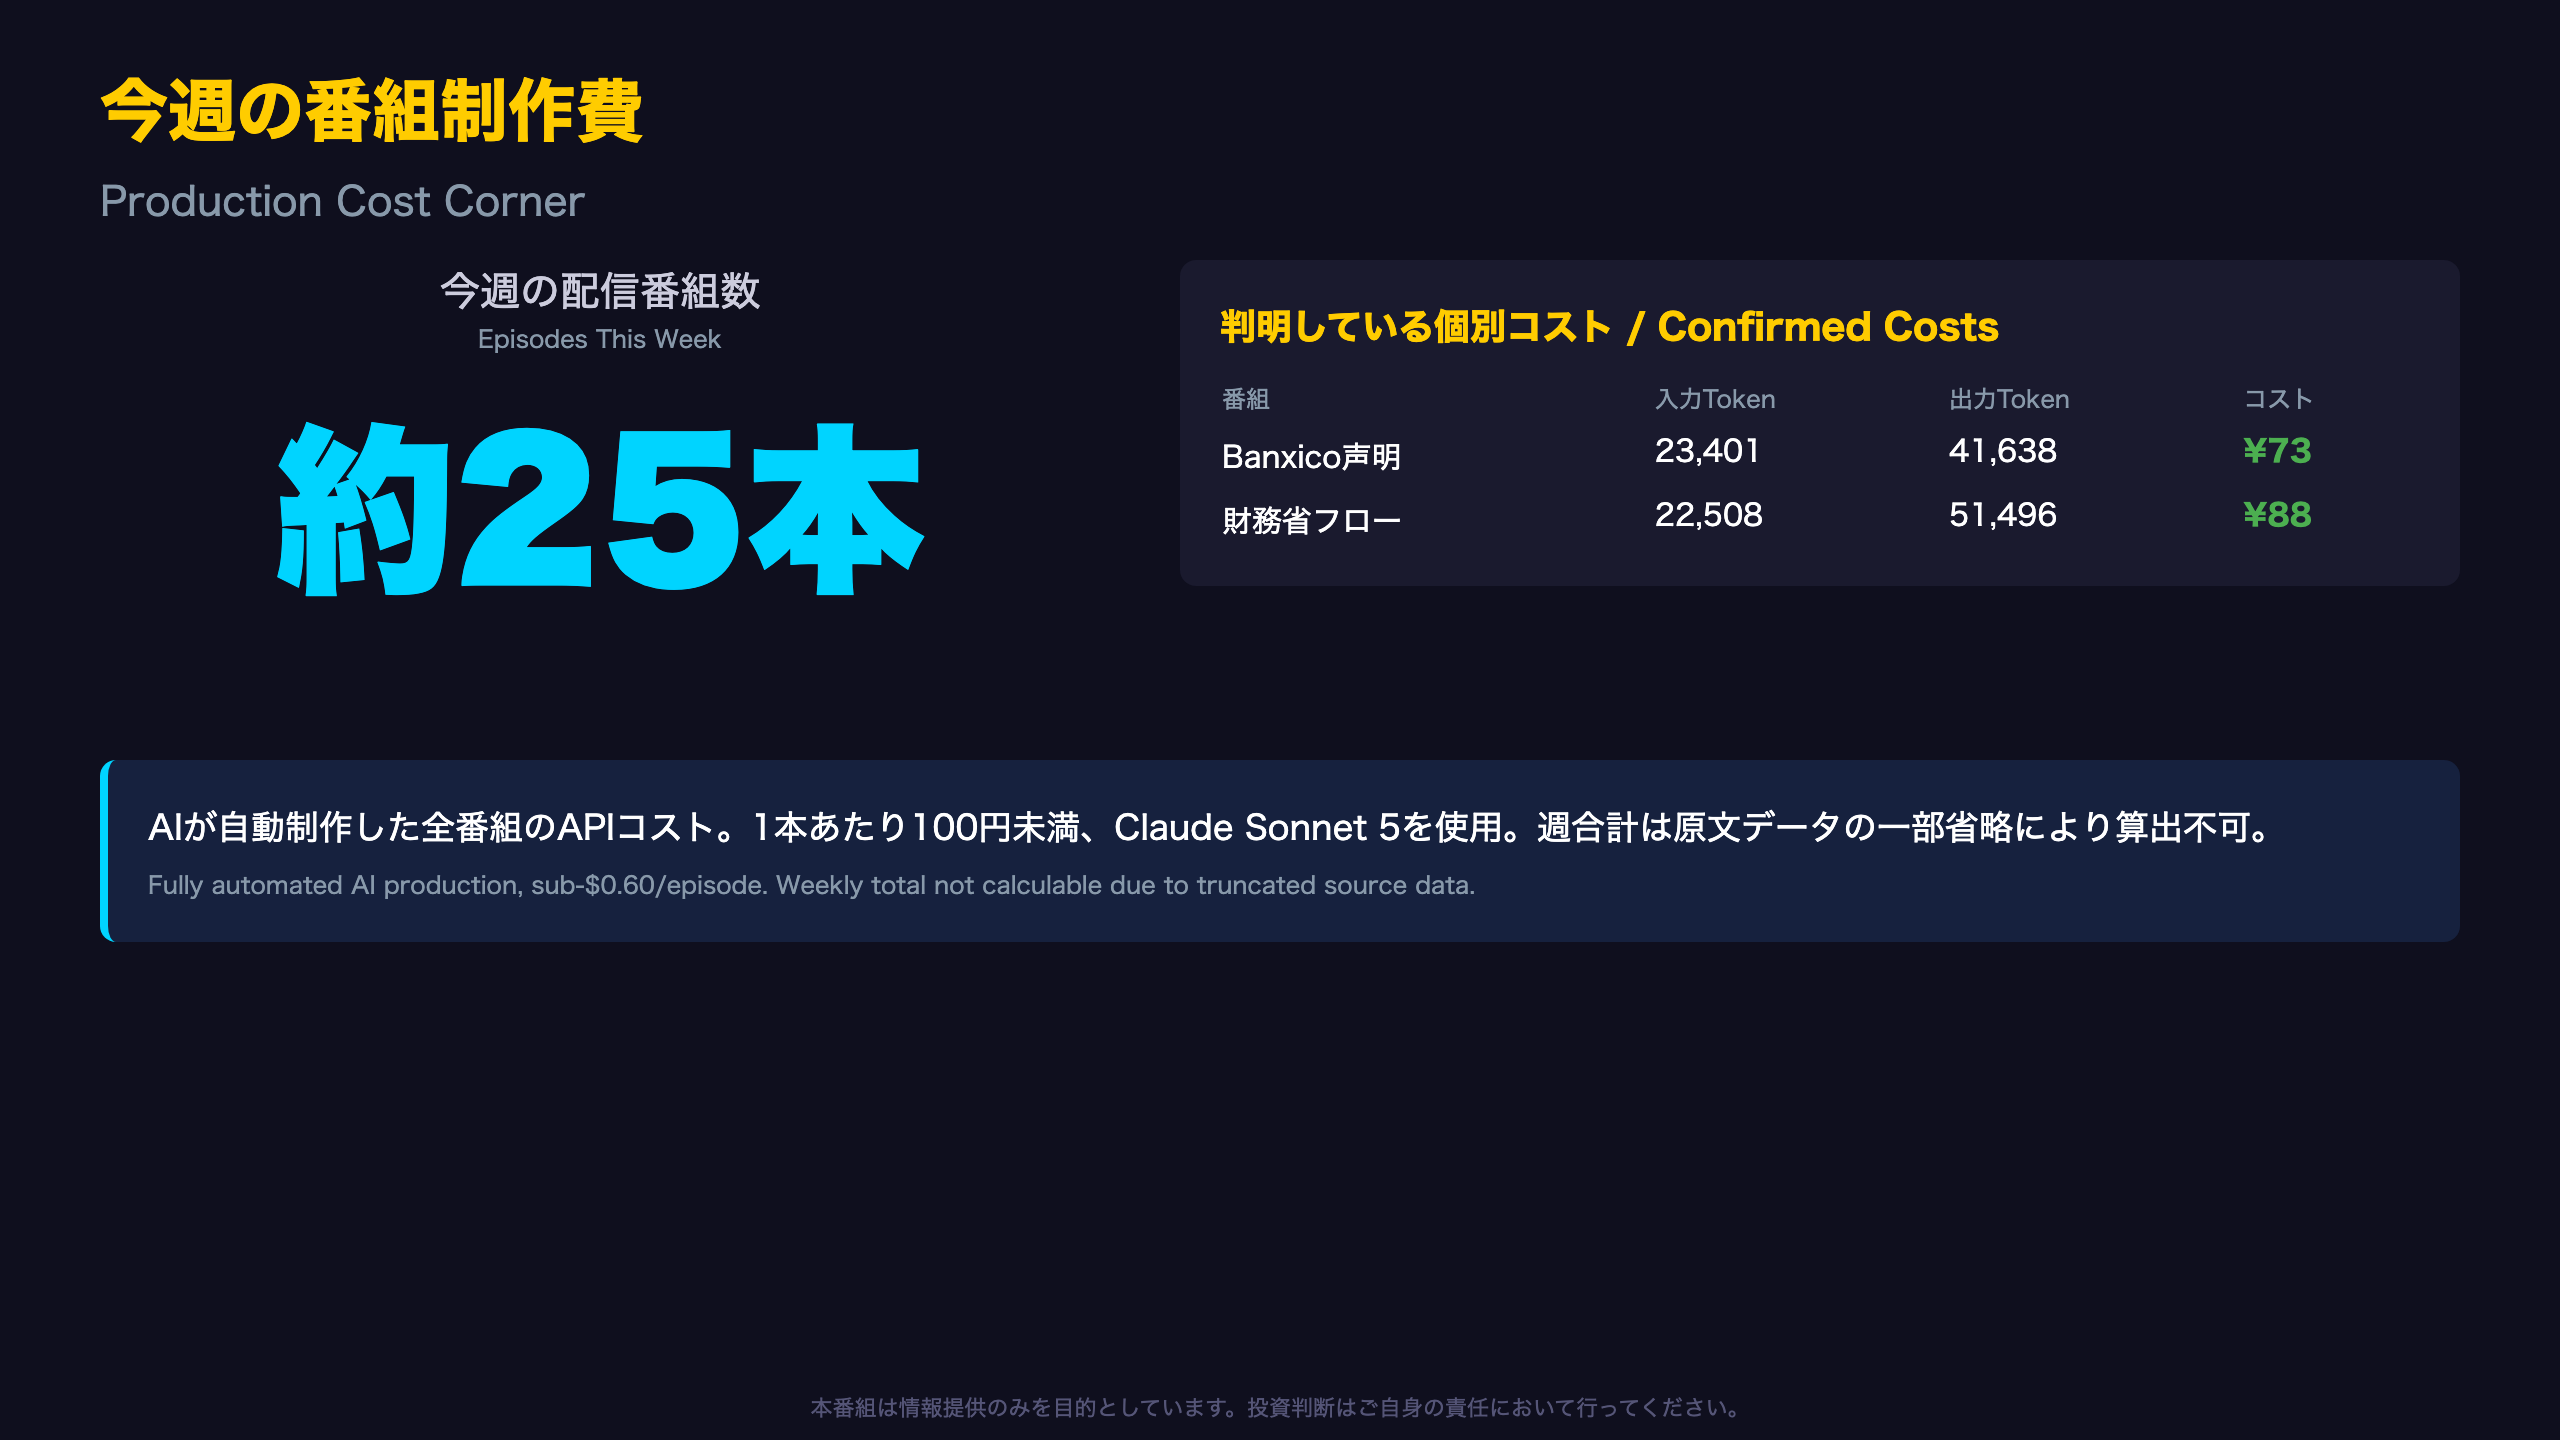
The Economics of Fully-Automated Financial Journalism
Every NFC Market Live program — from data ingestion to script-writing to voice synthesis — is produced by a fully automated AI pipeline, with zero human editorial intervention in the production loop.
Confirmed Per-Episode Costs
Two episodes in this week’s report catalog explicitly disclosed production costs:
| Program | LLM Model | Input Tokens | Output Tokens | Cost |
|---|---|---|---|---|
| Banxico Statement Analysis | Claude Sonnet 5 | 23,401 | 41,638 | \u00a573 (~$0.46) |
| MOF Weekly Capital Flows | Claude Sonnet 5 | 22,508 | 51,496 | \u00a588 (~$0.56) |
Both figures use a consistent exchange rate of 1 USD = 157.6 JPY.
A Note on Data Completeness
This week’s report catalog includes roughly 25 individual programs, but most cost-breakdown sections in the source data were truncated. In keeping with our strict no-estimation policy, we report only the confirmed figures above rather than extrapolating a weekly total.
What This Implies for Scalability
At under $0.60 per episode — covering an LLM analysis pipeline processing roughly 20,000-50,000 tokens — the economics of AI-driven financial content differ fundamentally from traditional newsroom models. This cost structure is what enables NFC Market Live to cover dozens of macro releases across more than a dozen countries within a single week, something that would be economically prohibitive under a traditional human-staffed research and editorial model.
Context for International Readers
For comparison, a single hour of a human analyst’s research and writing time at a typical financial media outlet often costs more than this entire per-episode production budget — highlighting both the promise and the current limitations (e.g., no live human fact-checking layer) of AI-generated financial content.
来週の注目イベント:8月10日〜14日
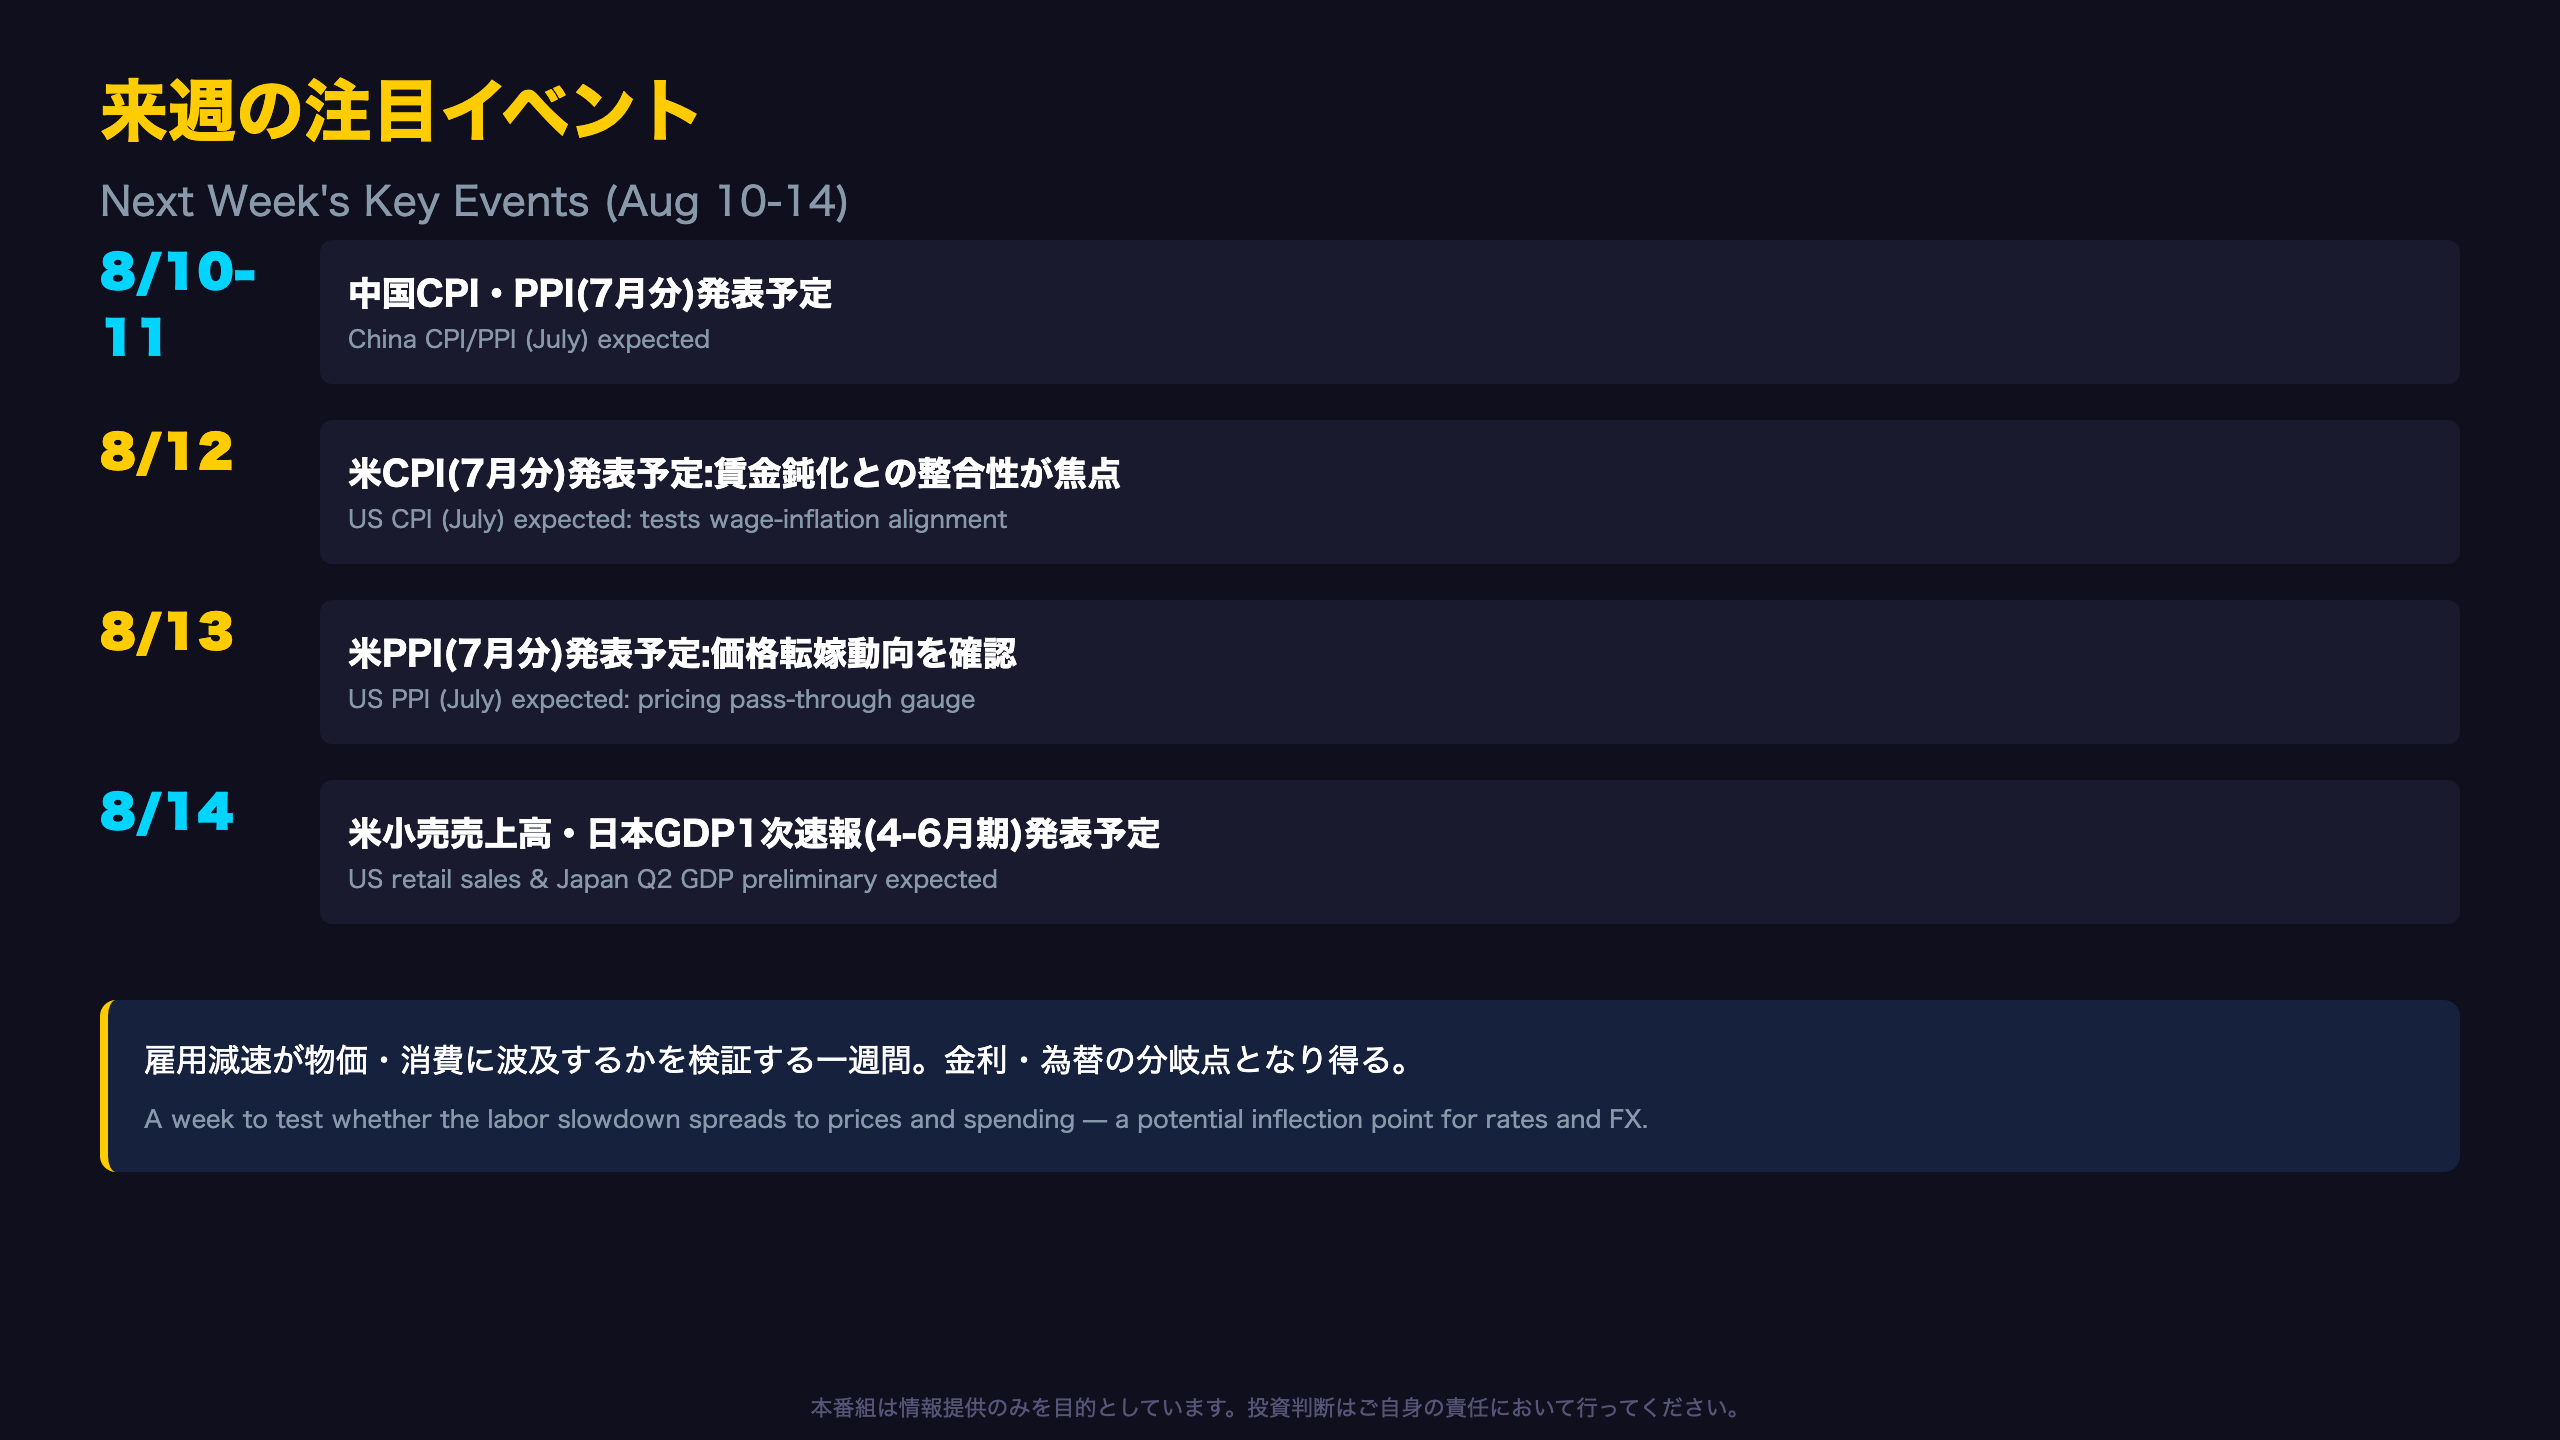
Three Key Inflection Points Next Week
1. US CPI (July data, expected)
Following this week’s wage deceleration (+3.2% YoY, down from +3.5%), next week’s Consumer Price Index release becomes the single most important data point. For international readers: the CPI is the Fed’s primary near-term inflation gauge, distinct from the Fed’s preferred longer-term metric (PCE inflation). If core CPI reaccelerates despite slowing wages, it would validate the low-confidence (0.05) uncertainty flagged in this week’s US regime model — a genuinely unusual combination that markets would need to price quickly.
Chain of reasoning: [If July CPI surprises to the upside] \u2192 [a rare combination of decelerating wages alongside sticky inflation would emerge] \u2192 [rate-cut expectations could recede, supporting longer-dated US yields and the dollar]. This is a general mechanism, not a certainty — the actual print will determine the outcome.
2. US PPI (July data, expected)
Following the CPI release, Producer Price Index data will show whether the oil-driven softness observed in this week’s wholesale trade data is feeding through into upstream pricing.
3. Japan Q2 GDP Preliminary (April-June, expected)
This week’s Japan Coincident Index (CI) — a composite gauge compiled by Japan’s Cabinet Office — maintained an “improving” classification, but retail sales growth decelerated sharply from 5.0% to 0.5% YoY. Next week’s GDP preliminary reading will show whether private consumption confirms this softening or the CI’s broader resilience.
Also Watch: China CPI/PPI (July data)
Early in the week, China’s inflation gauges offer a read on global disinflationary/reflationary crosscurrents, relevant for commodity and EM currency positioning.
Scheduling note: the dates above reflect typical release patterns for these institutions; readers should confirm exact dates via official BLS, Cabinet Office, and NBS calendars, as this review does not have access to confirmed official schedules for the upcoming week.
Disclaimer: This article is for informational purposes only. All investment decisions are made solely at your own risk.