📺 Watch the Full Video Analysis
This article was automatically generated by the NFC Market Live AI analysis system. (Updated: 2026-08-30 08:39 JST)
📊 This week (Aug 23-30), the RBA and Riksbank both held rates with hawkish undertones, while new Fed Chair Warsh signaled at Jackson Hole that easing won’t come easily.
📈 US personal income stayed resilient even as consumer sentiment plunged to 51.7. In Japan, Tokyo core CPI accelerated for a second month and payroll employment extended a 53-month streak.
💡 A week of strength and weakness moving side by side, broken down for investors.
⚠️ Next week’s key event: the US August jobs report on Sep 4.
オープニング / Opening

This Week’s Focus
The week of August 23-30, 2026 saw major central banks deliver holds that were nonetheless unmistakably hawkish in tone. The Reserve Bank of Australia (RBA) held its cash rate at 4.35% for a second consecutive meeting, but its minutes detailed the case for further tightening in unusually explicit terms. Sweden’s Riksbank likewise held at 1.75%, while markets grew more confident that a hike could come as soon as the next meeting.
Meanwhile in the US, new Federal Reserve Chair Kevin Warsh delivered his first major policy address at the Jackson Hole Economic Symposium, declaring that the Fed would move away from relying on forward guidance.
He noted he was “impressed by the economy’s overall performance,” while cautioning that “the price-stability side of the mandate shows more concerning numbers.”
This program balances these shifting central bank postures against a mixed bag of real-economy data — resilience in some corners, softness in others — from an investor’s perspective.
今週の総括:タカ派据え置きの連鎖 / The Weekly Verdict
Sorting Surprises from Consensus
This week’s real surprise wasn’t the policy decisions themselves — both the RBA and Riksbank held rates as expected — but the tone behind them. The RBA’s minutes explicitly stated that “several members judged that it was quite possible that the upside risks to the inflation forecast would crystallise, requiring some further tightening,” language notably more assertive than June’s minutes.
What came in line with consensus: Australia’s trimmed mean inflation held at 3.6% for a second month, and US core PCE stayed flat at 3.3% from June. Neither triggered major market reaction.
Strength and Weakness in Parallel
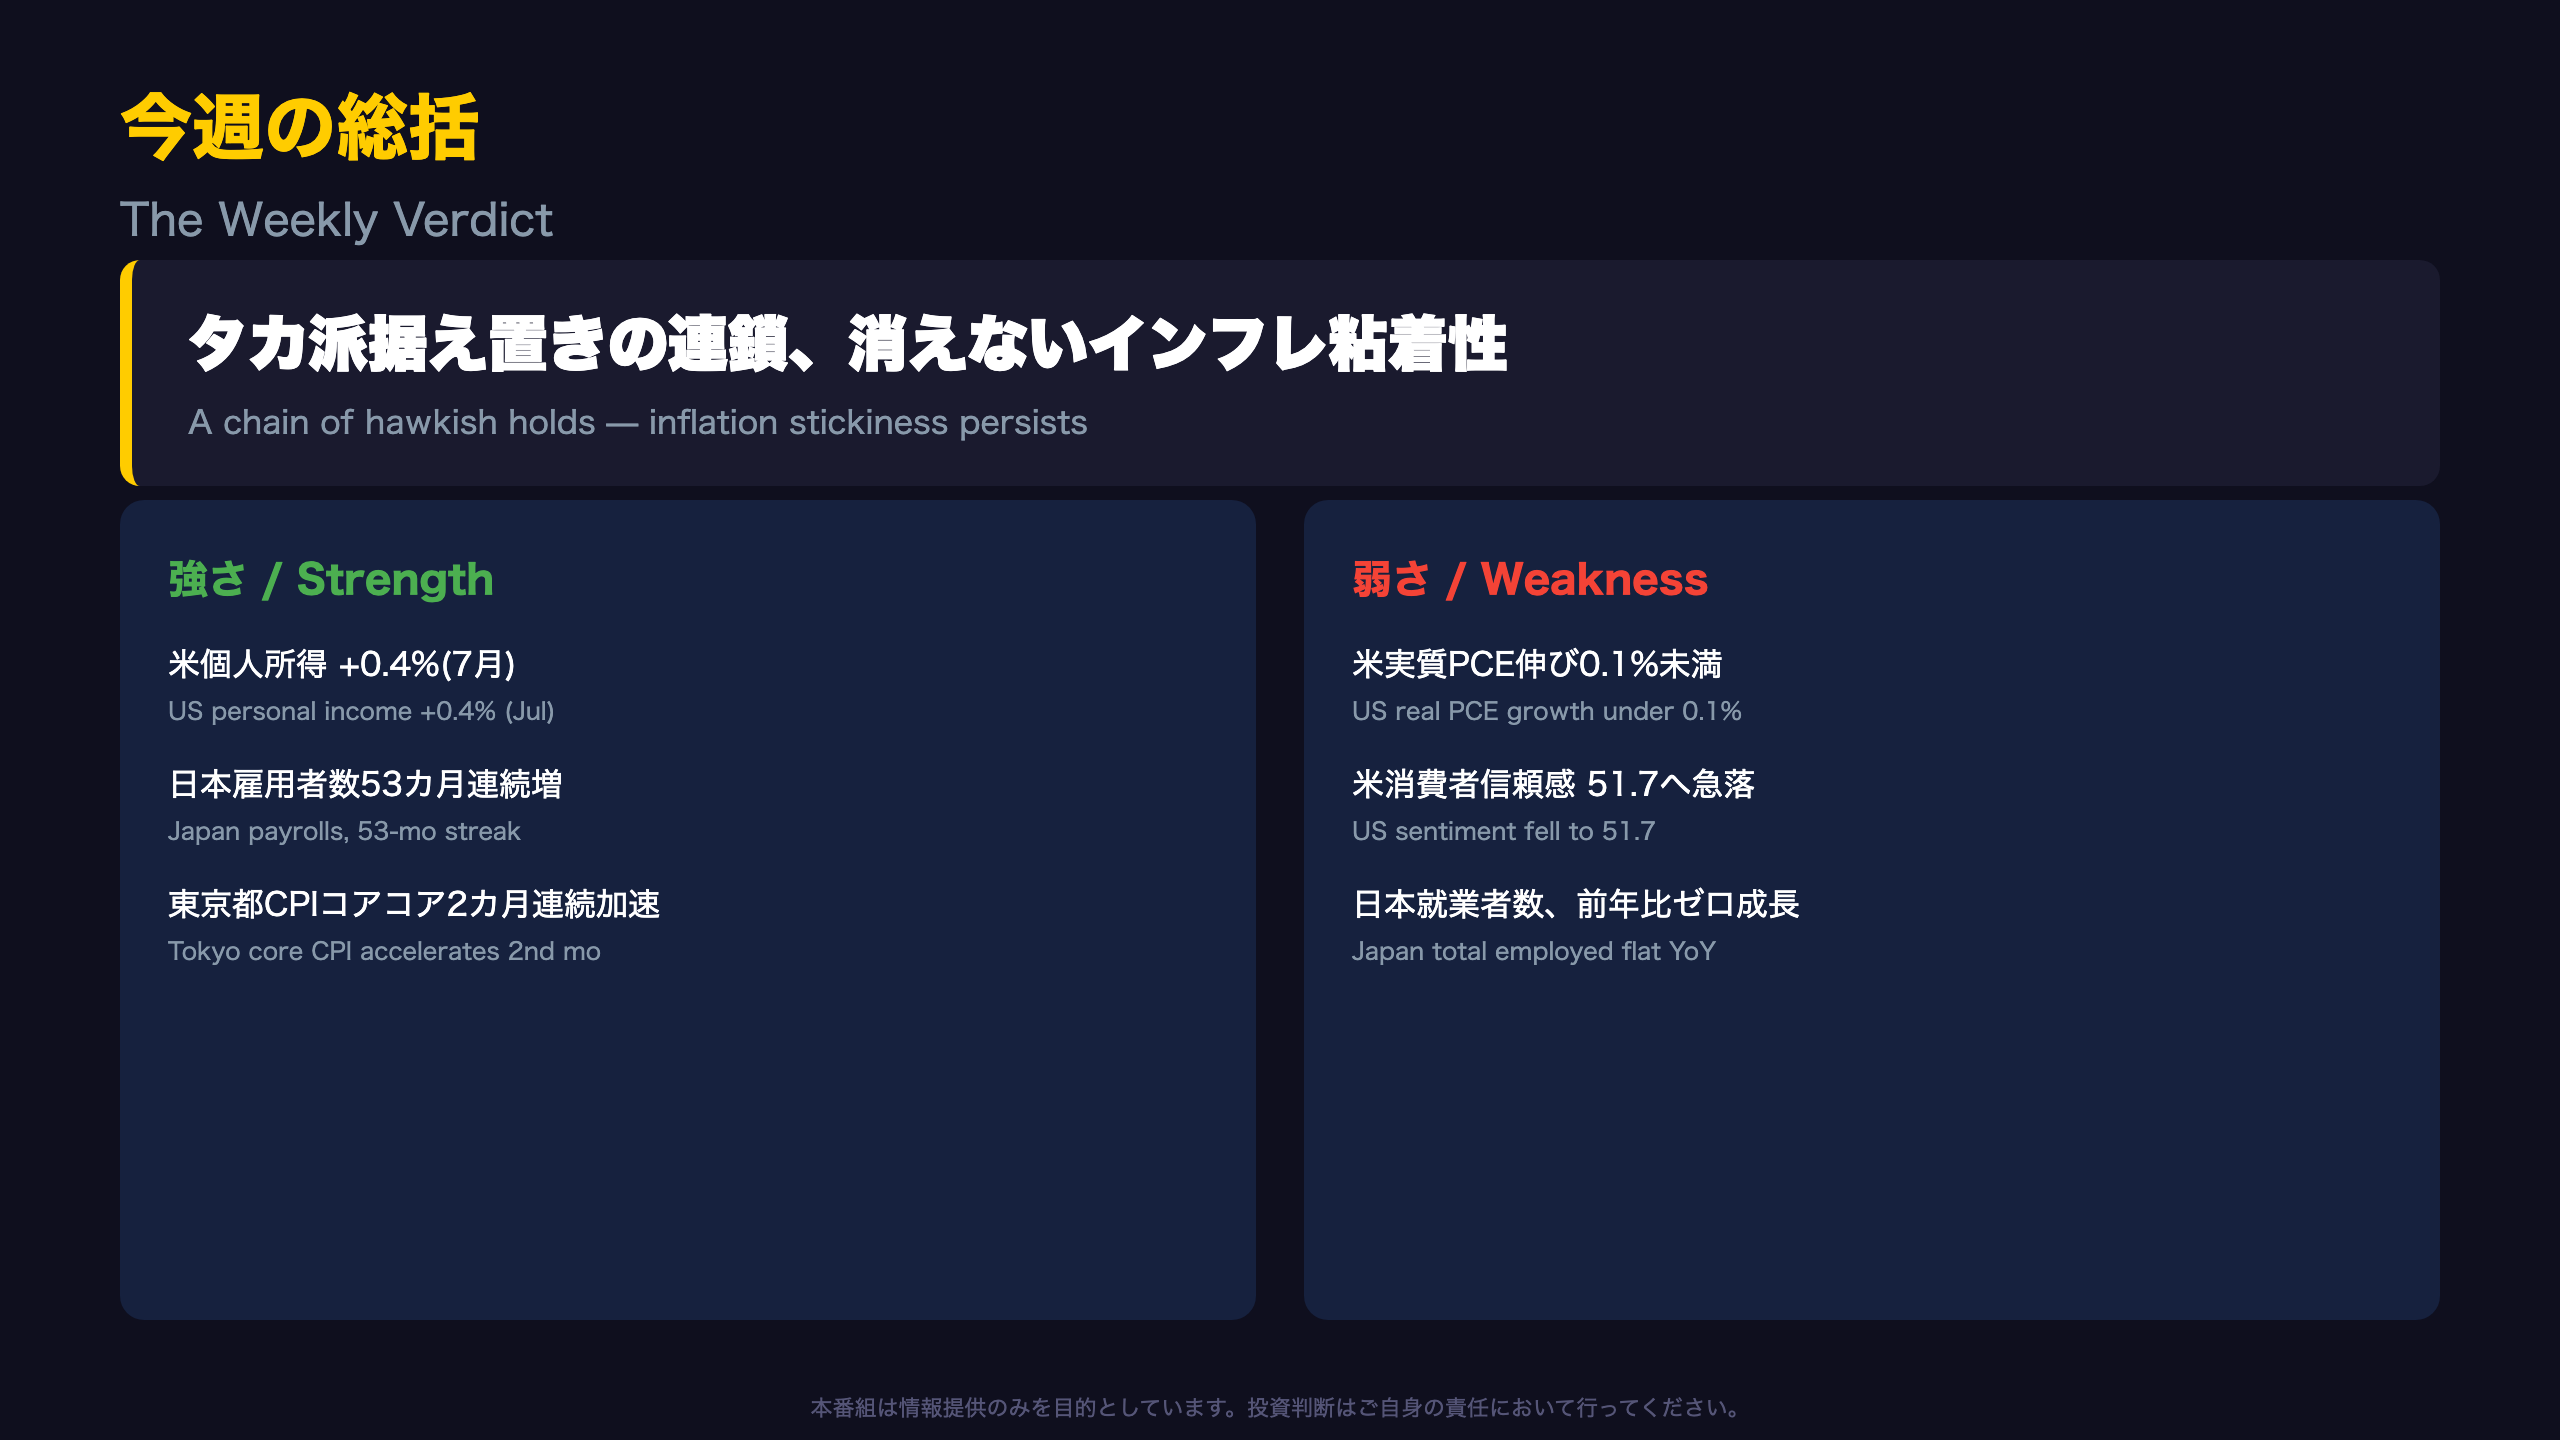
| Bullish signals | Bearish signals |
|---|---|
| US personal income +0.4% (Jul) | US real PCE growth under 0.1% |
| Japan payrolls, 53-month streak | US consumer sentiment fell to 51.7 |
| Tokyo core CPI, 2nd month of acceleration | Japan’s total employed flat YoY |
No single narrative captures this week cleanly — the following slides dig into the details for both the US and Japan.
主要指標ハイライト①:米国経済 / US Economy Highlights
Asymmetric Income and Spending
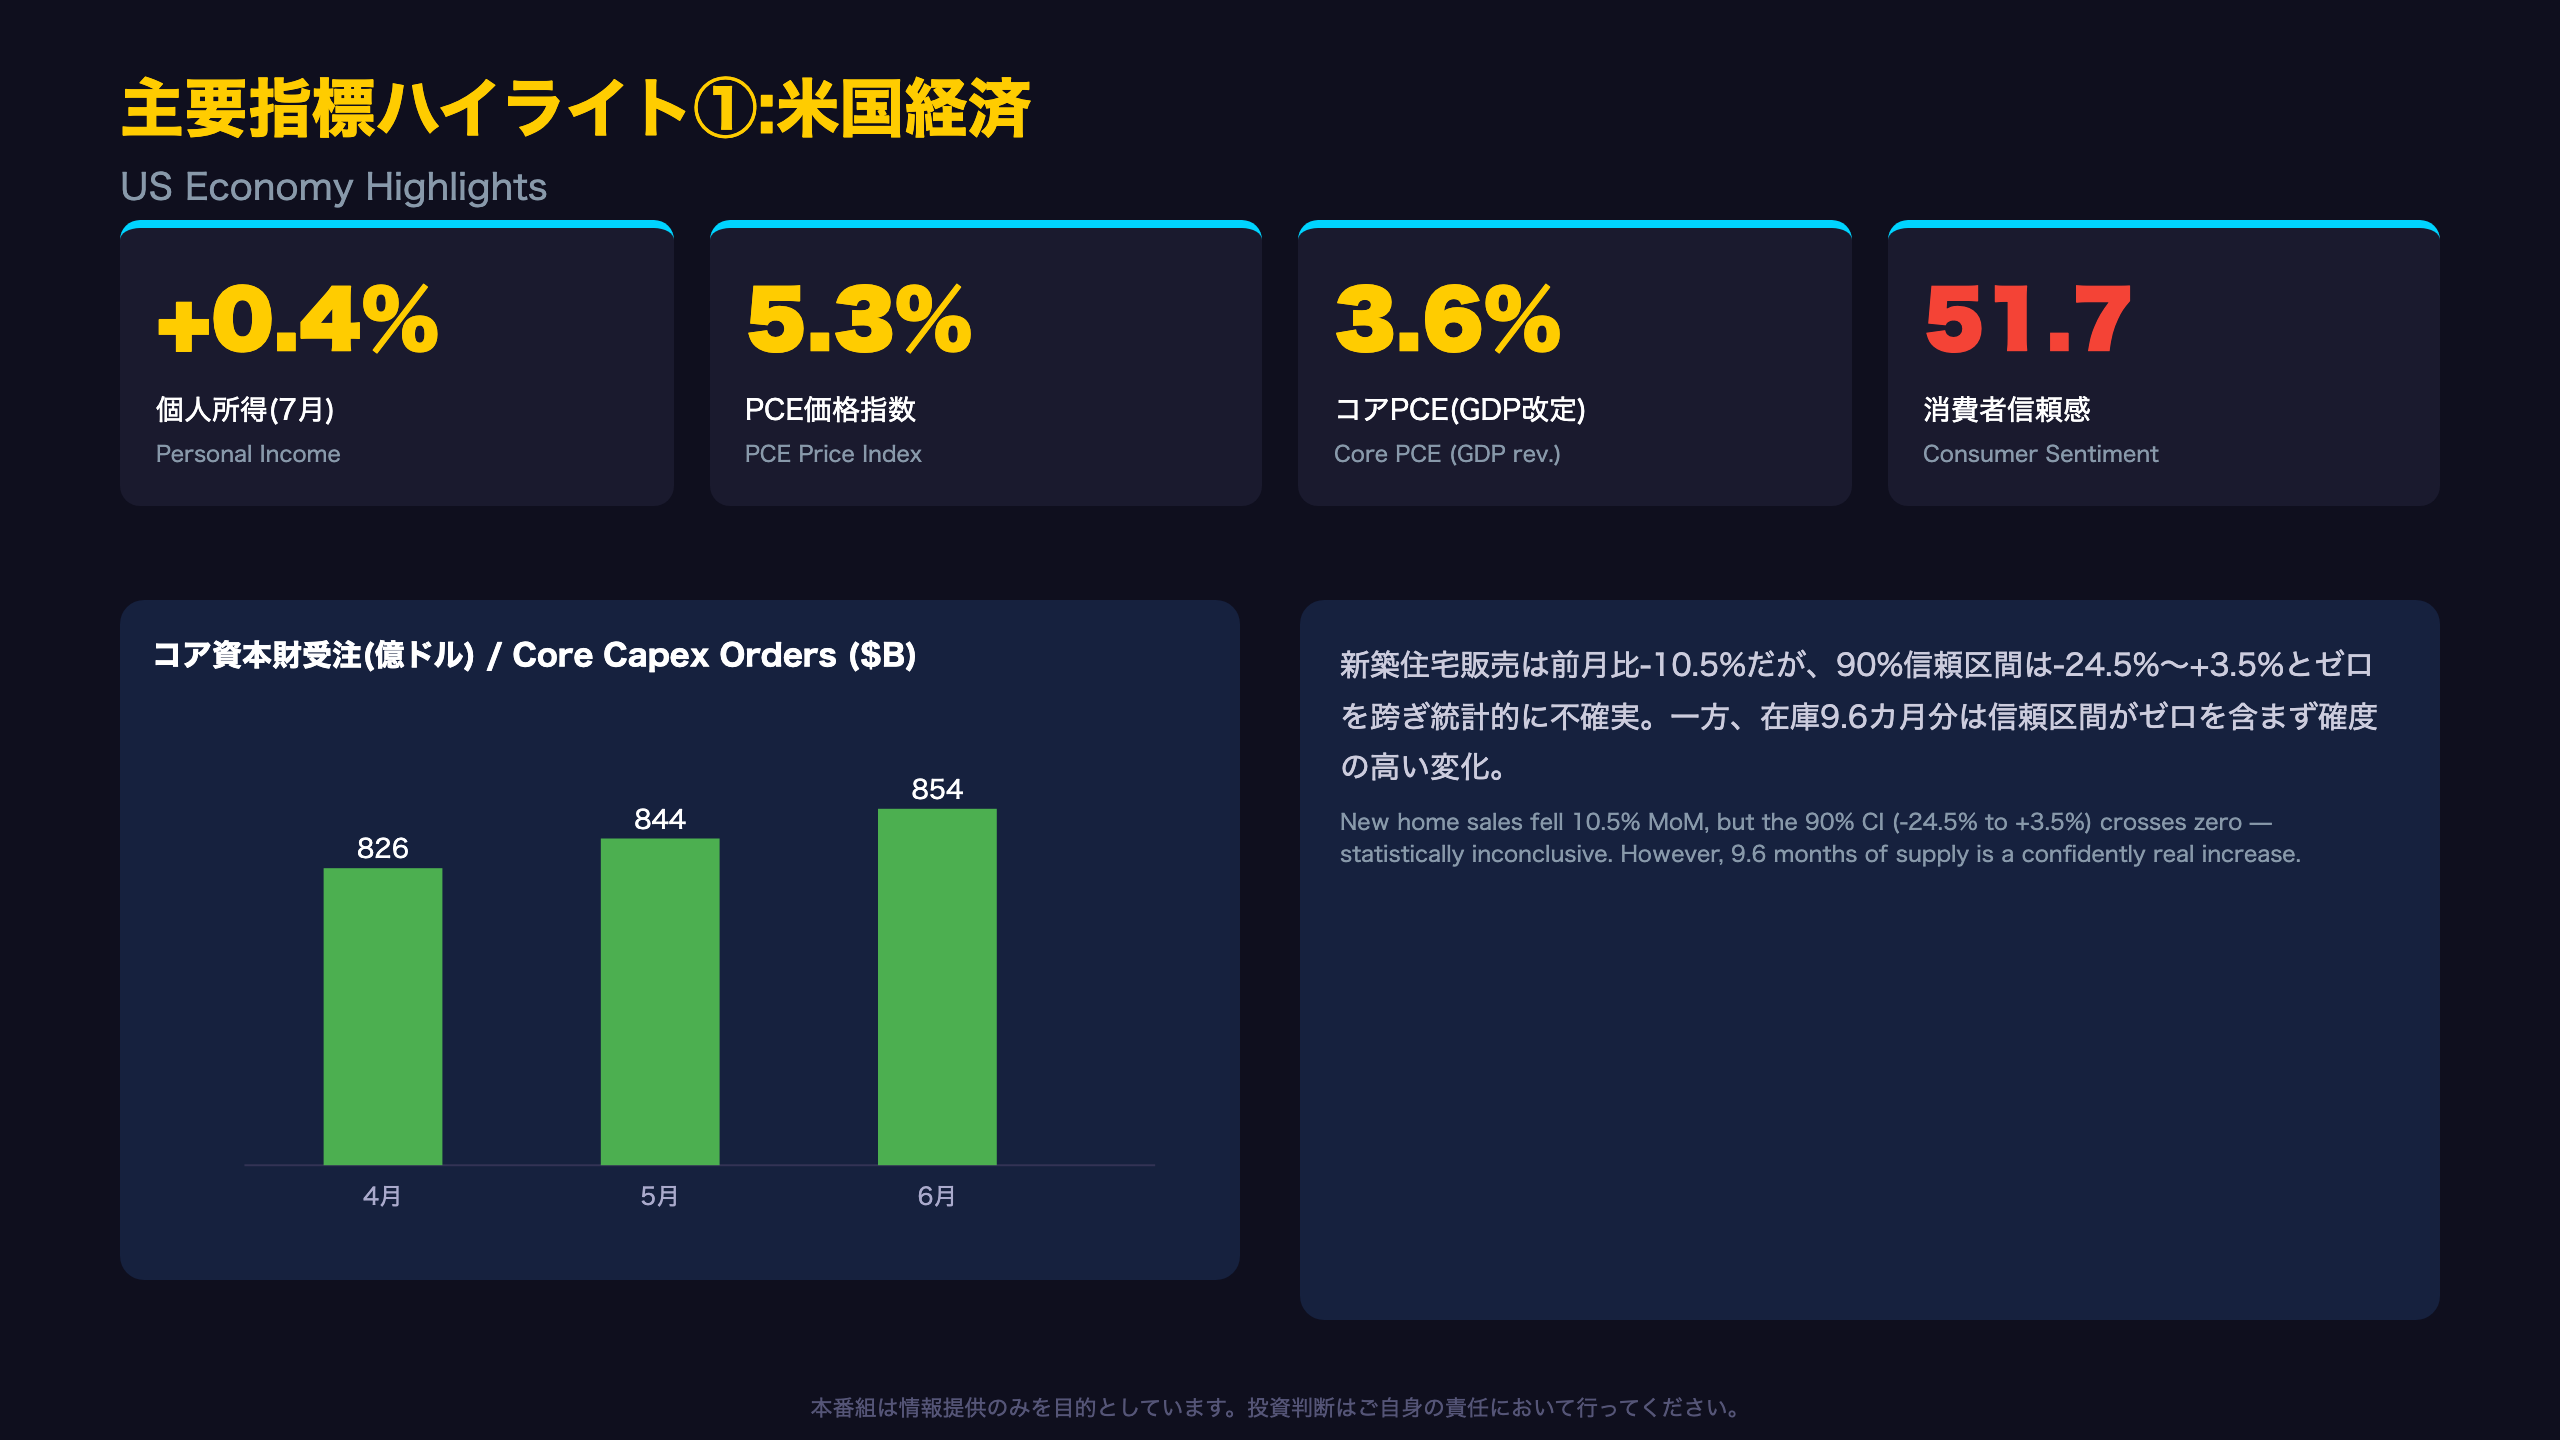
According to the BEA’s July Personal Income and Outlays report, personal income rose $115.1 billion (+0.4%) and disposable personal income (DPI) rose $125.9 billion (+0.5%), both accelerating from June’s $54.9 billion and $48.3 billion increases respectively. Yet personal outlays growth shrank sharply from $70.0 billion in June to just $36.6 billion in July, pushing the savings rate up from 2.7% to 3.0%.
“The $36.3 billion increase in current-dollar PCE in July reflected an increase of $86.2 billion in spending on services that was partly offset by a decrease of $49.9 billion in spending on goods.”
Goods spending fell broadly across gasoline, autos, and recreational items, while financial services, health care, and housing drove the services increase.
The GDP Inflation Split
In the GDP second estimate, the PCE price index — a broader measure covering all consumer prices — stayed elevated at 5.3% (revised up 0.2pp), while core PCE (ex food & energy, the Fed’s preferred gauge) eased to 3.6% from 4.4%. Notably, GDI (income-side measure of output) grew 2.2% versus GDP’s 1.5%, and the average of the two (1.8%) suggests underlying momentum may be somewhat firmer than the headline GDP figure implies — a nuance international readers should note, since the US reports GDP quarterly at an annualized rate (SAAR), unlike many countries’ simple quarter-on-quarter figures.
New Home Sales: Reading the Error Bars
The Census Bureau’s reported -10.5% change carries a 90% confidence interval of -24.5% to +3.5% — meaning statistically, it’s unclear whether sales actually declined. However, the 9.6-month supply figure (a confidently non-zero change) signals a real and structural loosening in housing supply-demand balance, well above the 5-6 month level typically considered a healthy market.
Next week’s key US releases: durable goods final report (Sep 2) and the August jobs report (Sep 4).
主要指標ハイライト②:日本とグローバル資金フロー / Japan & Global Flows
Tokyo CPI: Japan’s Leading Indicator
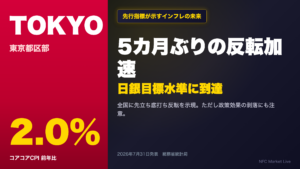
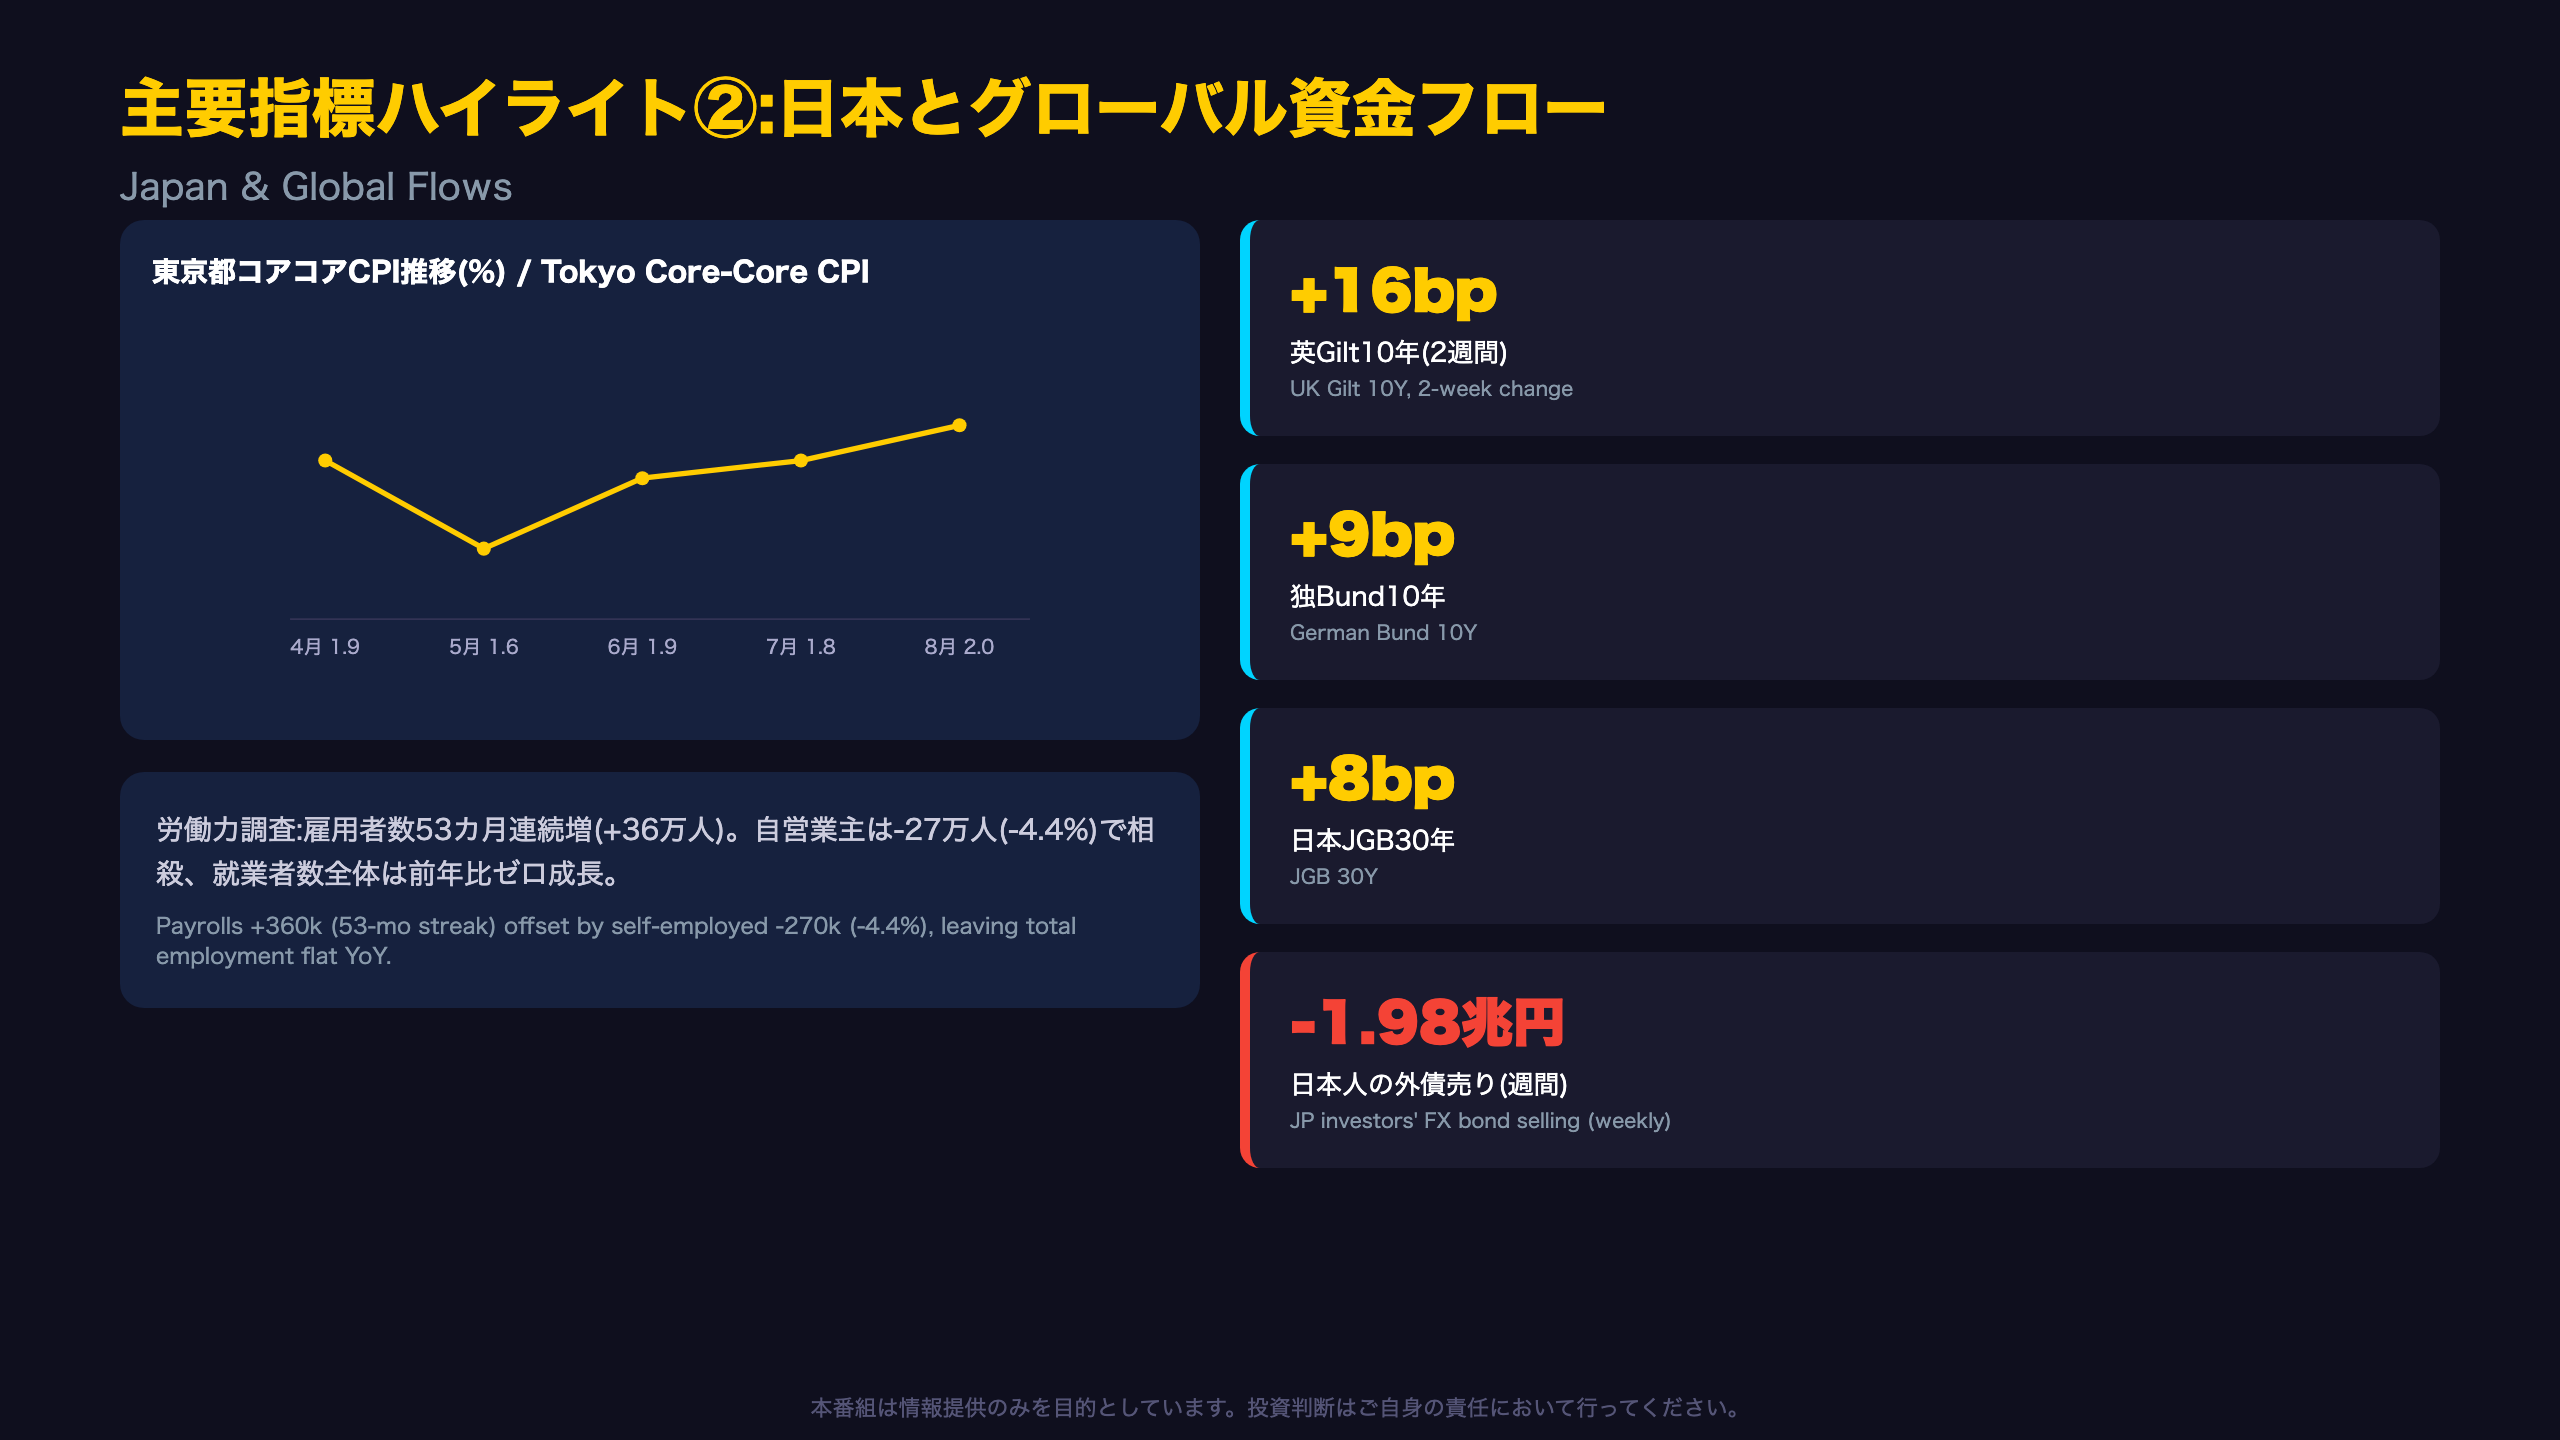
Japan’s Statistics Bureau reported that Tokyo’s core-core CPI (all items excluding fresh food and energy) rose 2.0% year-on-year in the August flash estimate, up from 1.8% in July. Tokyo data is released roughly a month ahead of the national CPI and has historically shown a one-month lead — Tokyo bottomed at 1.6% in May, while the national figure bottomed a month later in June at 1.7%.
The Statistics Bureau noted: “the core-core index stood at 102.6, up 2.0% year-on-year.”
However, part of this acceleration reflects the base-effect “drop-off” of a gasoline tax cut, estimated at -0.27 percentage points on the energy component in Tokyo. Readers should treat the headline acceleration with some caution as a mix of genuine and policy-driven effects.
Labor Force Survey: A Tale of Two Employment Types
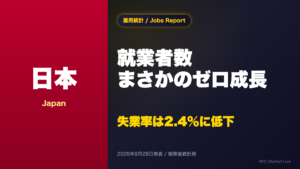
July’s labor force survey showed payroll employment (62.33 million, +360,000, a 53-month streak) remaining robust, while self-employed workers (5.92 million, -270,000, -4.4%) fell sharply — the two offsetting each other to leave total employment flat year-on-year. The unemployment rate improved to 2.4% from 2.5%.
Global Rates and a Sudden Flow Reversal
Japan’s Ministry of Finance weekly portfolio flow data showed Japanese investors—who had been actively buying foreign stocks and bonds for the prior two weeks—abruptly reversed into heavy selling. The ¥1.978 trillion sale of foreign long-term bonds was the second-largest weekly outflow of the year (for context, MOF data reflects trade-contract dates, offering faster but less final figures than settlement-based data). Meanwhile USD/JPY has retraced to the ¥158 range from its July 25 peak of ¥163.71, suggesting the flow-FX correlation was weak this particular week.
Japan’s next nationwide CPI (August data) is due September 18.
中央銀行・政策スタンスの現在地 / Central Bank Stances
Five Central Banks, Five Different Temperatures
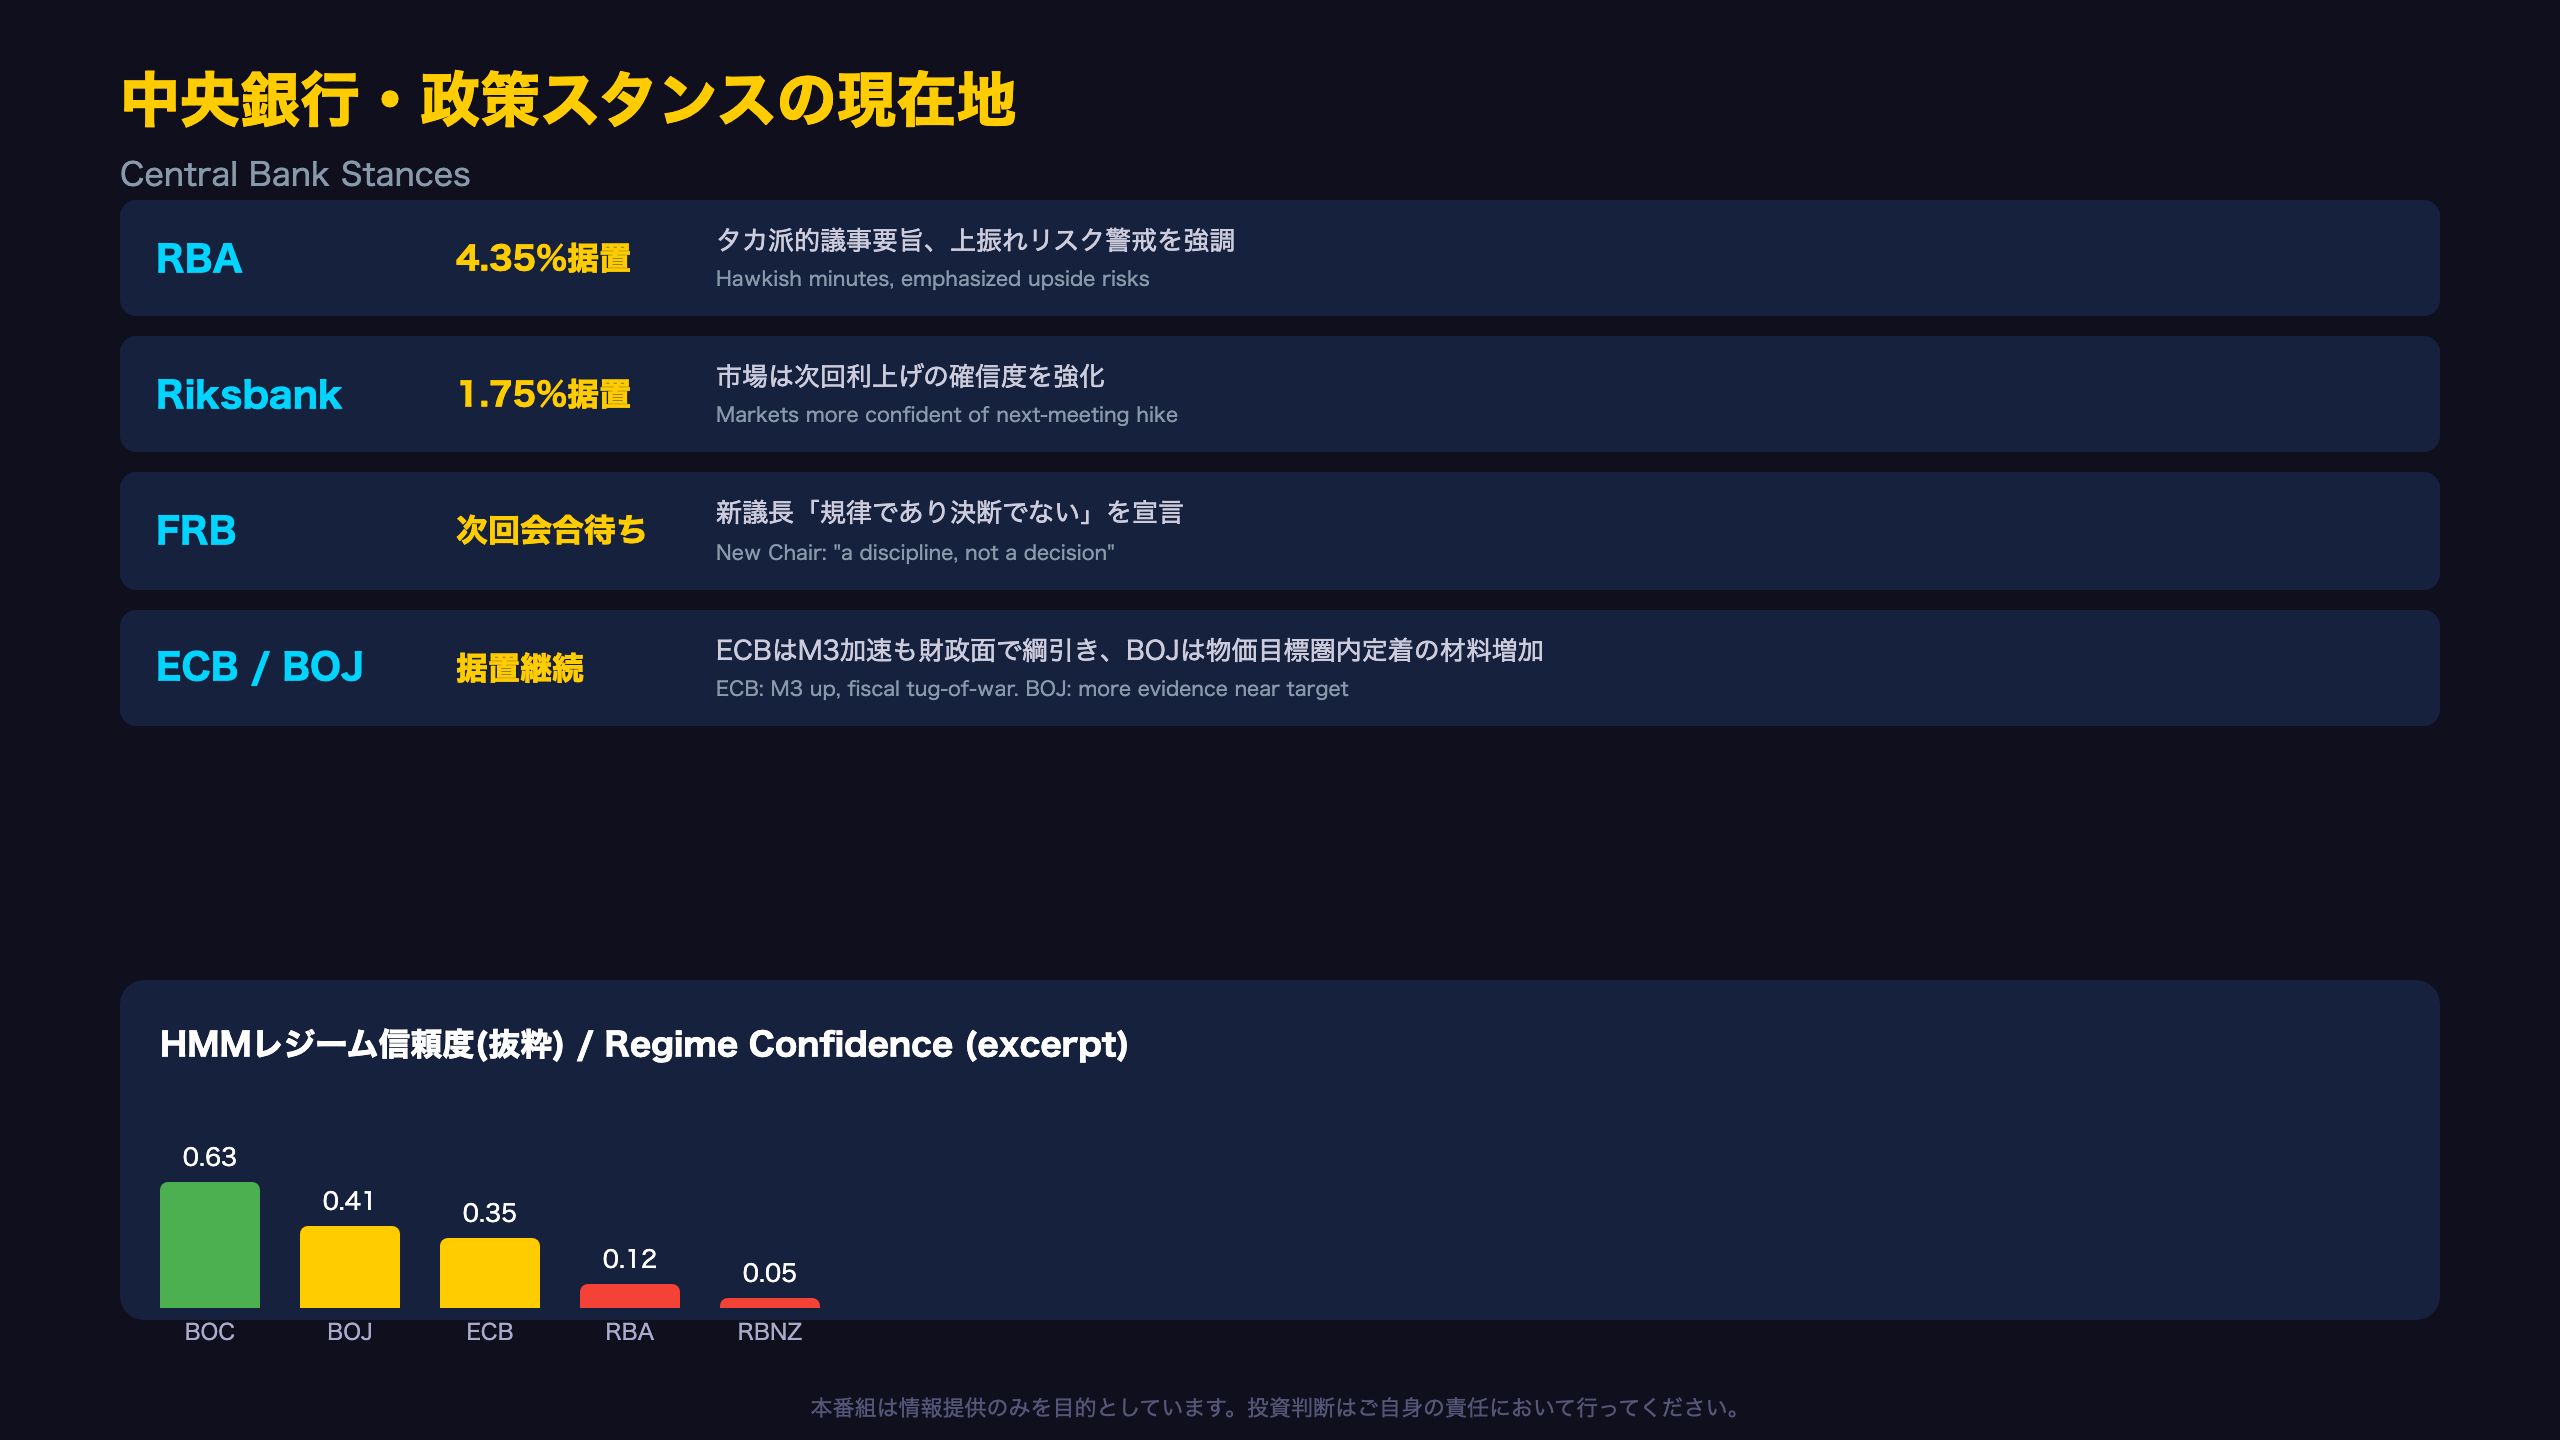
This week’s central bank actions all landed on “hold,” but the tone beneath each decision varied considerably.
| Central Bank | Policy Rate | Stance Shift |
|---|---|---|
| RBA (Australia) | 4.35% (hold) | Hawkish minutes, emphasized upside inflation risks |
| Riksbank (Sweden) | 1.75% (hold) | Markets grew more confident of a hike next meeting |
| Federal Reserve | (awaiting next FOMC) | New Chair declared end of reliance on forward guidance |
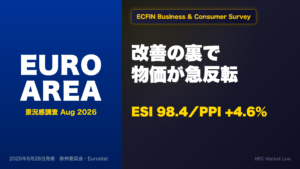
| ECB | (hold continues) | M3 accelerated even as fiscal claims turned negative |
| Bank of Japan | (hold continues) | Tokyo CPI acceleration adds evidence of target-range settling |
Chair Warsh’s “Hall of Mirrors” Critique
At Jackson Hole, new Fed Chair Kevin Warsh explicitly criticized the phenomenon where markets and the Fed become mutually dependent on each other’s signals — the so-called “Hall of Mirrors” problem.
“We should not tolerate a regime where market participants look solely to the Fed for their next trading cue.”
This reads as an implicit critique of the 2021-era forward guidance approach, and suggests FOMC-to-FOMC volatility could rise going forward as the Fed withholds explicit rate-path signals — a meaningful shift for a market long accustomed to Fed dot-plots and guidance language.
Where NFC’s Regime Model Stands
NFC’s proprietary regime-diagnostic framework shows the Bank of Canada model as the most stable read (0.63 confidence, closest to its centroid), while the ECB, RBA, RBNZ, and BOE models show large deviations (Mahalanobis distance), indicating the models carry elevated uncertainty this week. This is supplementary context only, not a forecast of actual policy decisions.
今週の番組制作費 / Production Cost Corner
An Experiment in AI-Automated Production
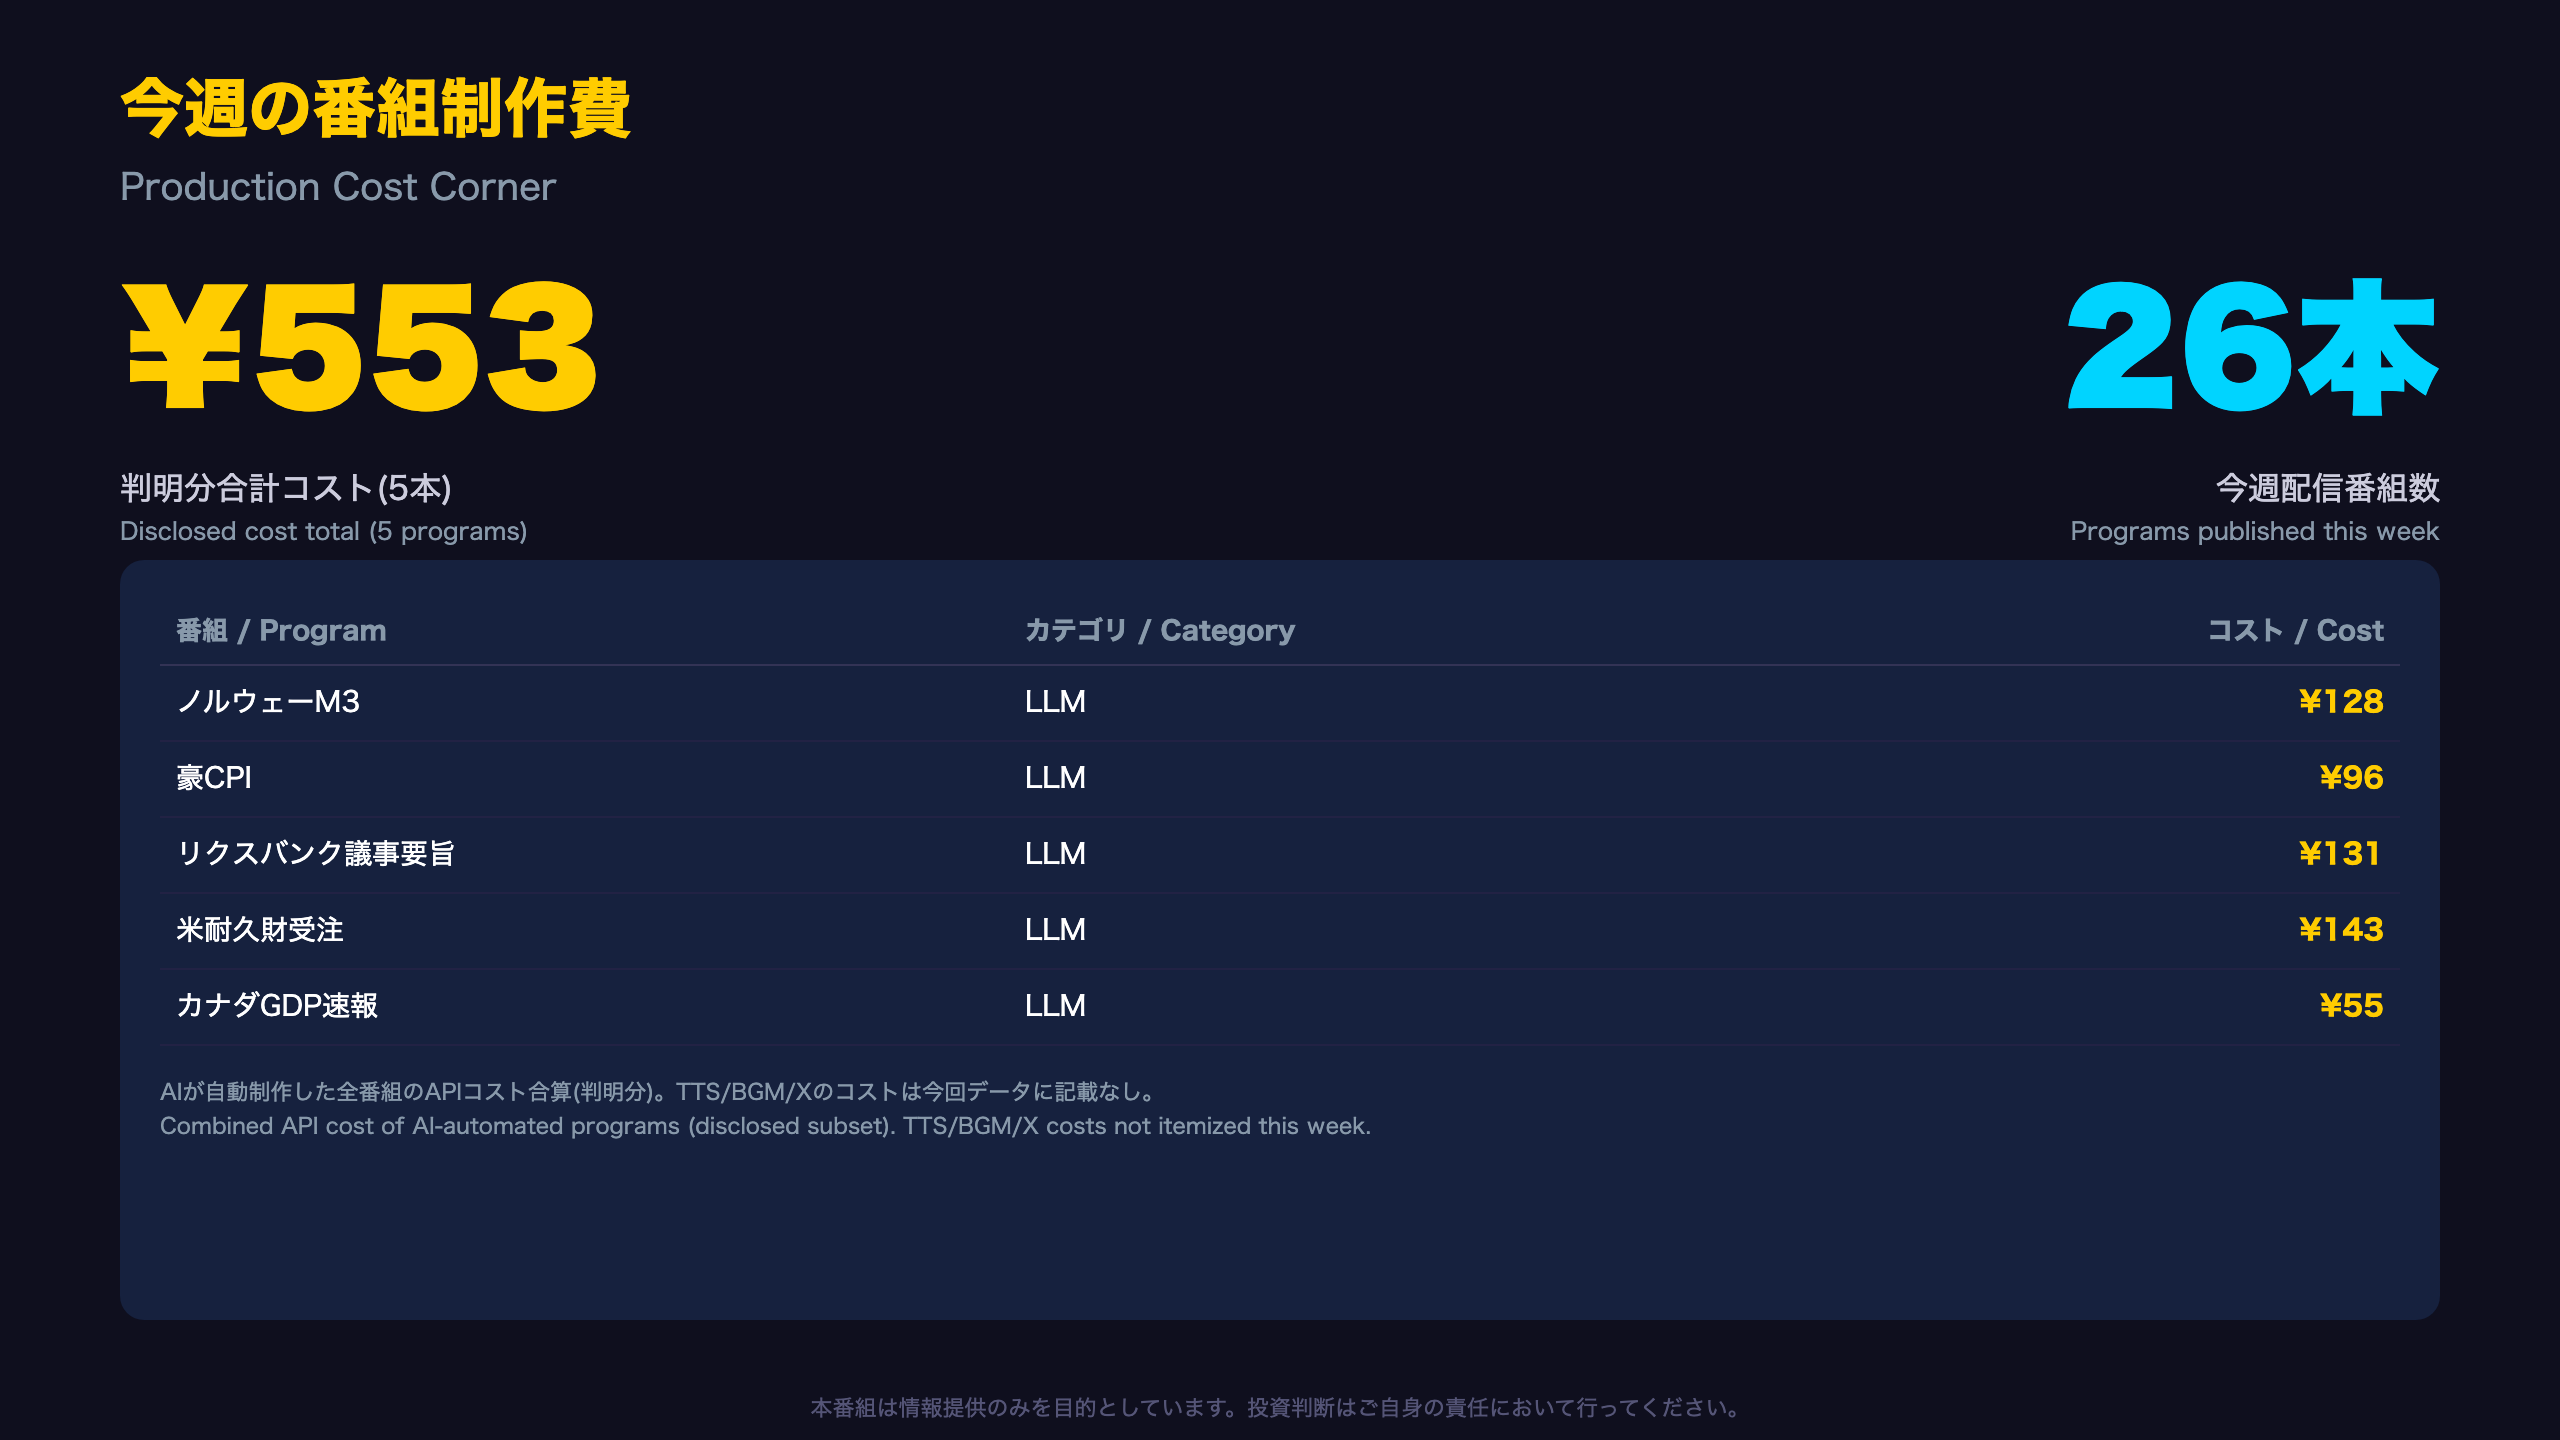
NFC Market Live operates on a system where AI parses primary sources — economic indicators, corporate earnings, central bank minutes — and automatically generates video scripts, blog articles, and social posts. Of the 26 programs published this week, only five included an explicit production cost breakdown in the source text.
Disclosed Cost Breakdown
| Program | Cost |
|---|---|
| Norway M3 slowdown | ¥128 |
| Australia CPI (core stays sticky) | ¥96 |
| Riksbank minutes (hawkish signal) | ¥131 |
| US durable goods orders | ¥143 |
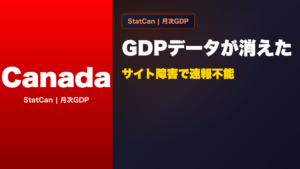
| Canada GDP data outage | ¥55 |
| Disclosed total | ¥553 (~$3.47 at ¥159/USD) |
Exchange rates cited in source reports ranged between 159.1 and 159.3 JPY per USD.
Limits of Disclosure
For context, US investors should note this is roughly the cost of a cup of coffee to fully produce, script, and voice an institutional-grade macro research video — a stark contrast to traditional financial media production costs. Of the remaining 21 programs, cost sections were either absent from the available text or truncated within ellipses in the source data, so they are excluded from this tally. Similarly, none of the five disclosed programs included cost breakdowns for TTS (text-to-speech), BGM generation, or X (Twitter) posting — categories that exist in the production pipeline but were not itemized in this week’s dataset. As a result, a fully comprehensive weekly total across all programs and cost categories cannot be calculated from the available data; only the disclosed subset is presented here.
This transparency-first approach is itself part of an ongoing effort to make the cost structure of AI-automated financial journalism independently verifiable.
来週の注目イベントカレンダー / Next Week’s Calendar
Four Key Checkpoints for Next Week
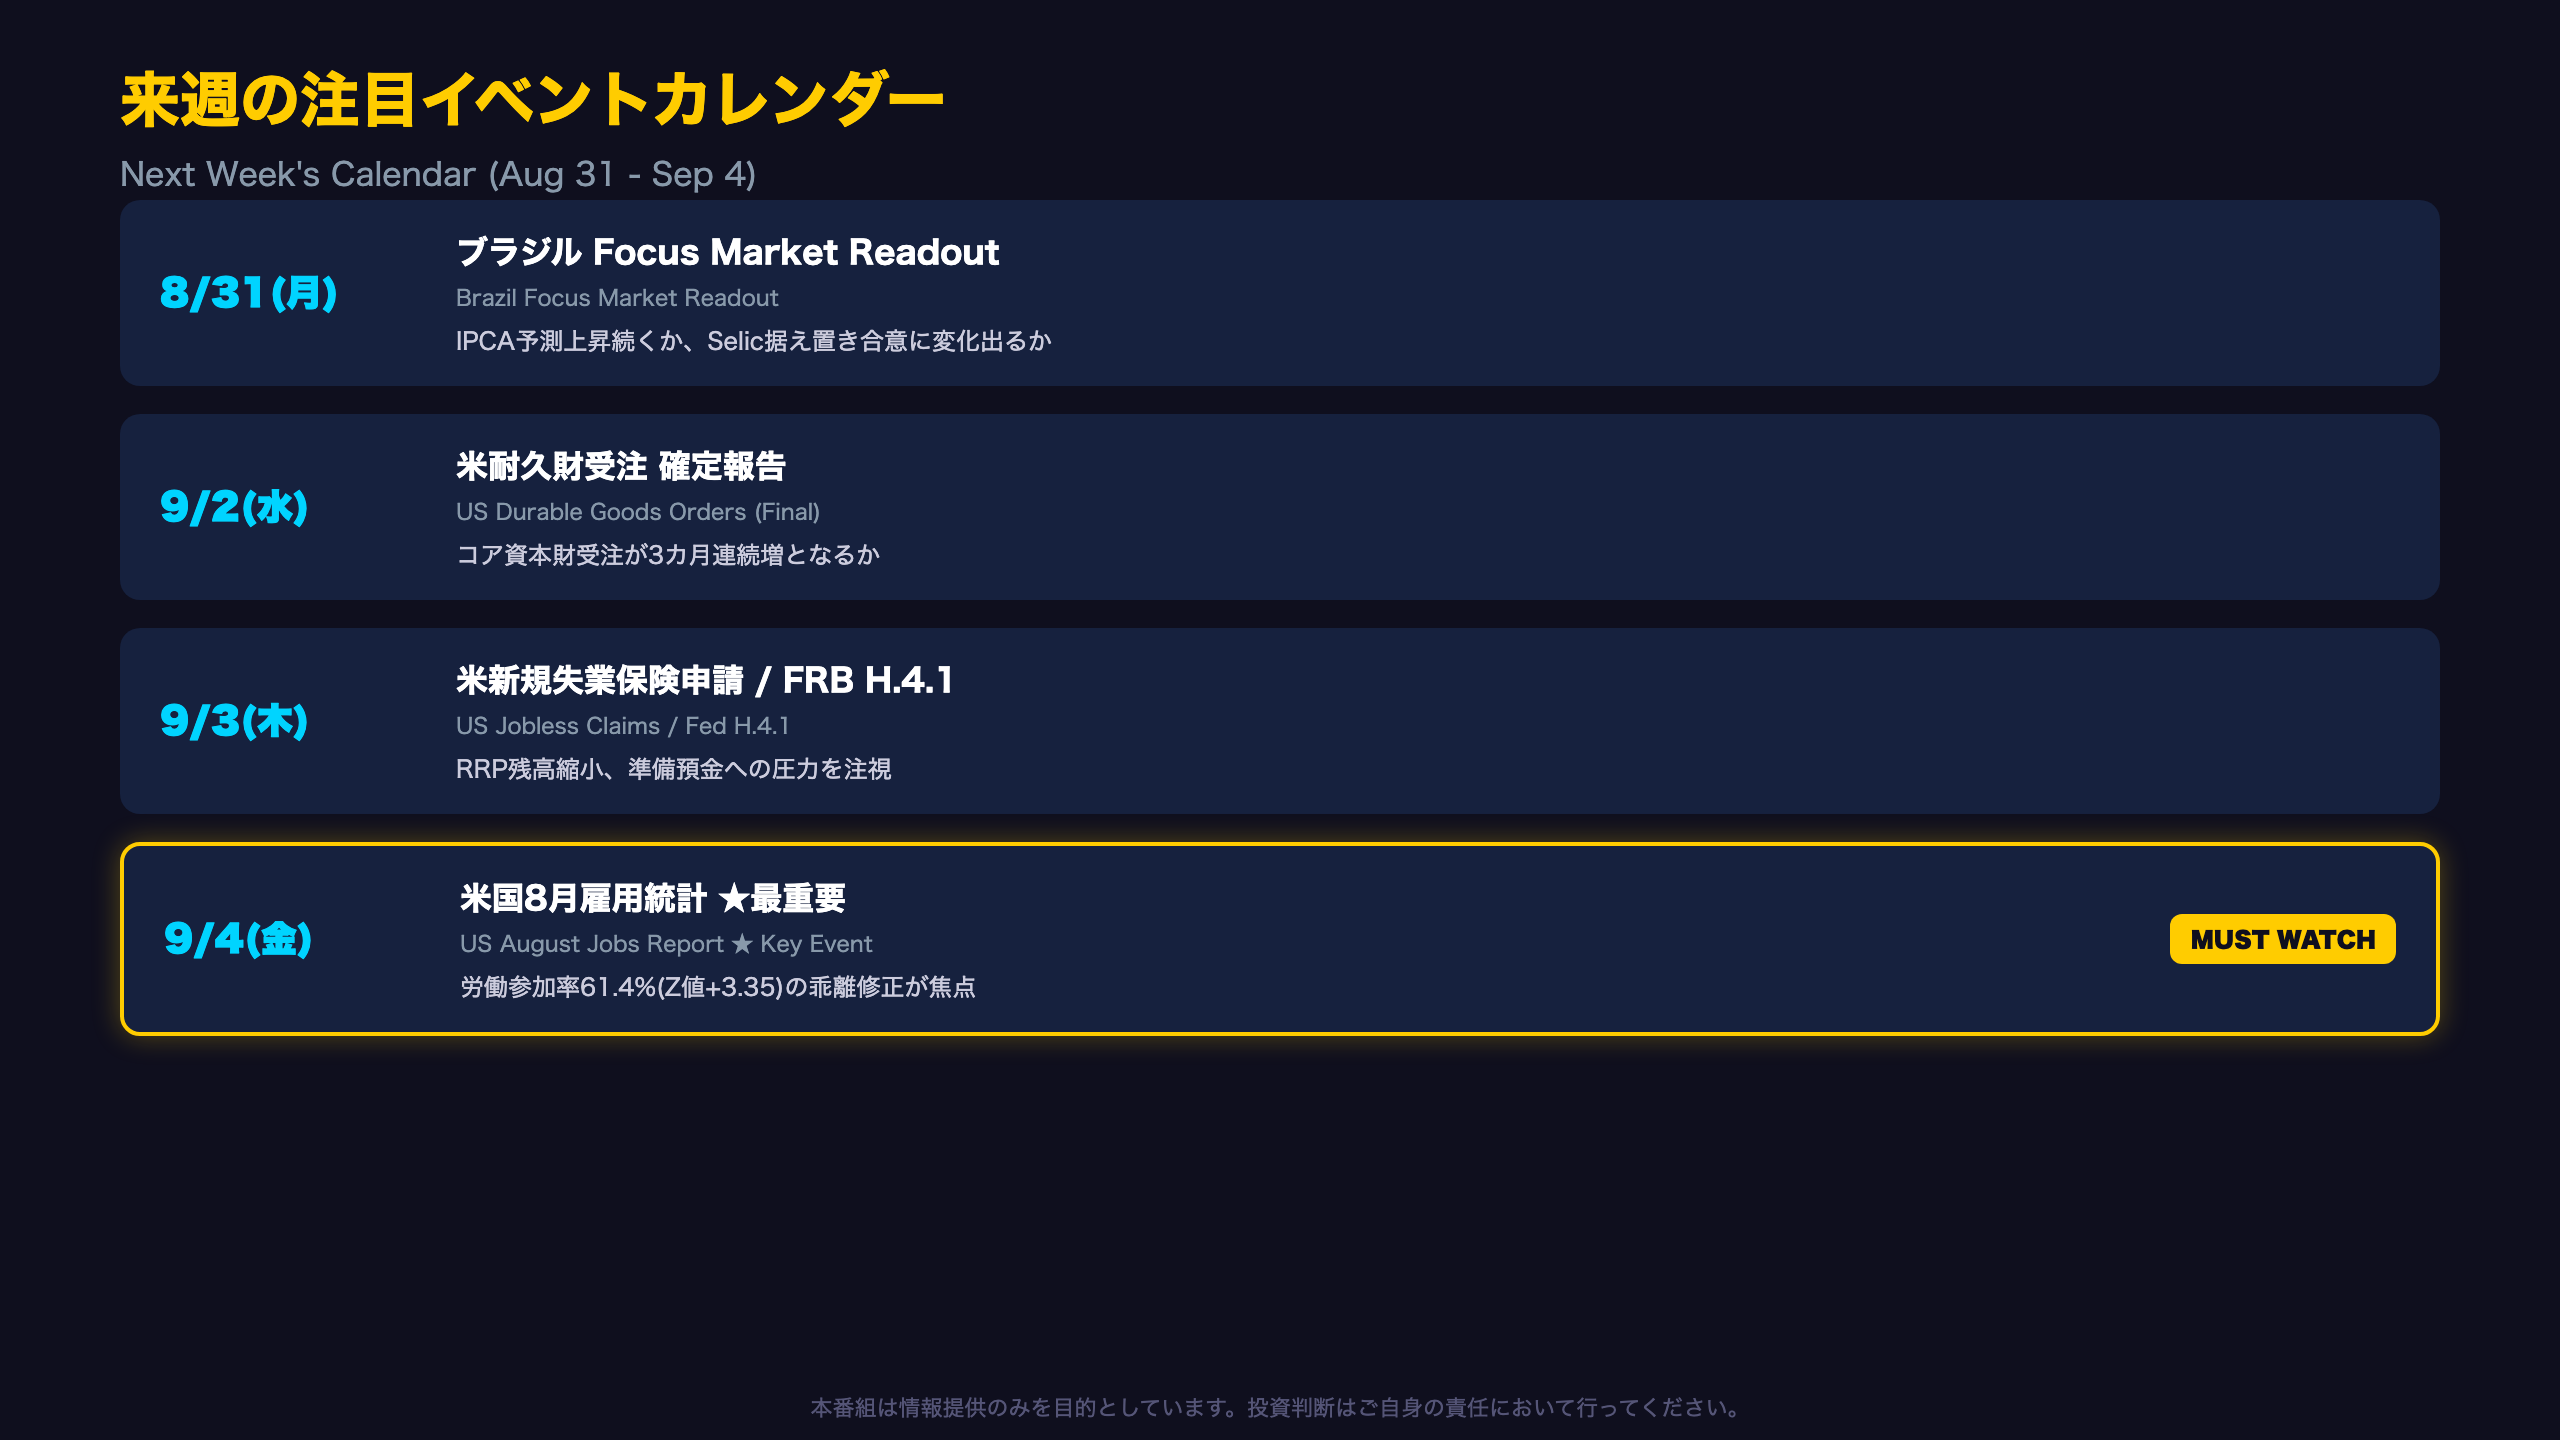
Monday, Aug 31: Brazil’s Focus Market Readout
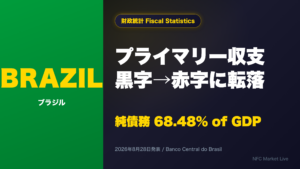
This week’s report showed 12-month-ahead IPCA inflation expectations rising for a third straight week to 4.42%, even as Selic rate forecasts stayed frozen across all maturities (2026-2029) for a 16th consecutive week. The Focus survey is Brazil’s equivalent of the Fed’s Survey of Professional Forecasters — a weekly poll of over 100 market economists tracked closely by Banco Central do Brasil (BCB). Whether this “frozen” Selic consensus holds, or rising inflation expectations start to crack it, is the key question for next week.
Wednesday, Sep 2: US Durable Goods Orders (Final Report)
June’s advance data showed core capital goods orders (nondefense capital goods excluding aircraft — a closely watched proxy for business investment intentions) rising for a second straight month ($82.6B → $84.4B → $85.4B, April-June). However, the Census Bureau explicitly notes this survey’s confidence intervals cannot be computed, making it premature to call a two-month streak a definitive investment “bottom.” Whether the final read confirms a third month of gains is the test.
Thursday, Sep 3: Jobless Claims & Fed H.4.1
Recent weekly data showed initial claims at 203,000 with a four-week average of 205,500, both trending modestly higher. The Fed’s balance sheet report (H.4.1) will also be watched, as reverse repo (RRP) balances have shrunk to $362.2 billion — a shallow buffer that could amplify pressure on bank reserves if Treasury General Account (TGA) balances continue rebuilding, a dynamic reminiscent of the 2019 repo market stress (though current reserve levels remain historically ample).
Friday, Sep 4: US August Jobs Report ★ Biggest Event of the Week
This week’s anomaly-detection analysis flagged the labor force participation rate as showing the largest deviation of any indicator over the past seven days, with a Z-score of +3.35 (actual: 61.4% vs. regime-typical 62.376%). Per the model’s own guidance, Z-scores above 3.0 “tend to rise ahead of regime transitions” — meaning whether this deviation corrects or widens further in next week’s jobs report will be an important signal for policy under the Fed’s new leadership.
Note: the “Z-score above 3.0” threshold is a statistical model reference point only, not a forecast of actual policy outcomes.
Disclaimer: This article is for informational purposes only. All investment decisions are made solely at your own risk.