📺 Watch the Full Video Analysis
This article was automatically generated by the NFC Market Live AI analysis system. (Updated: 2026-08-10 07:13 JST)
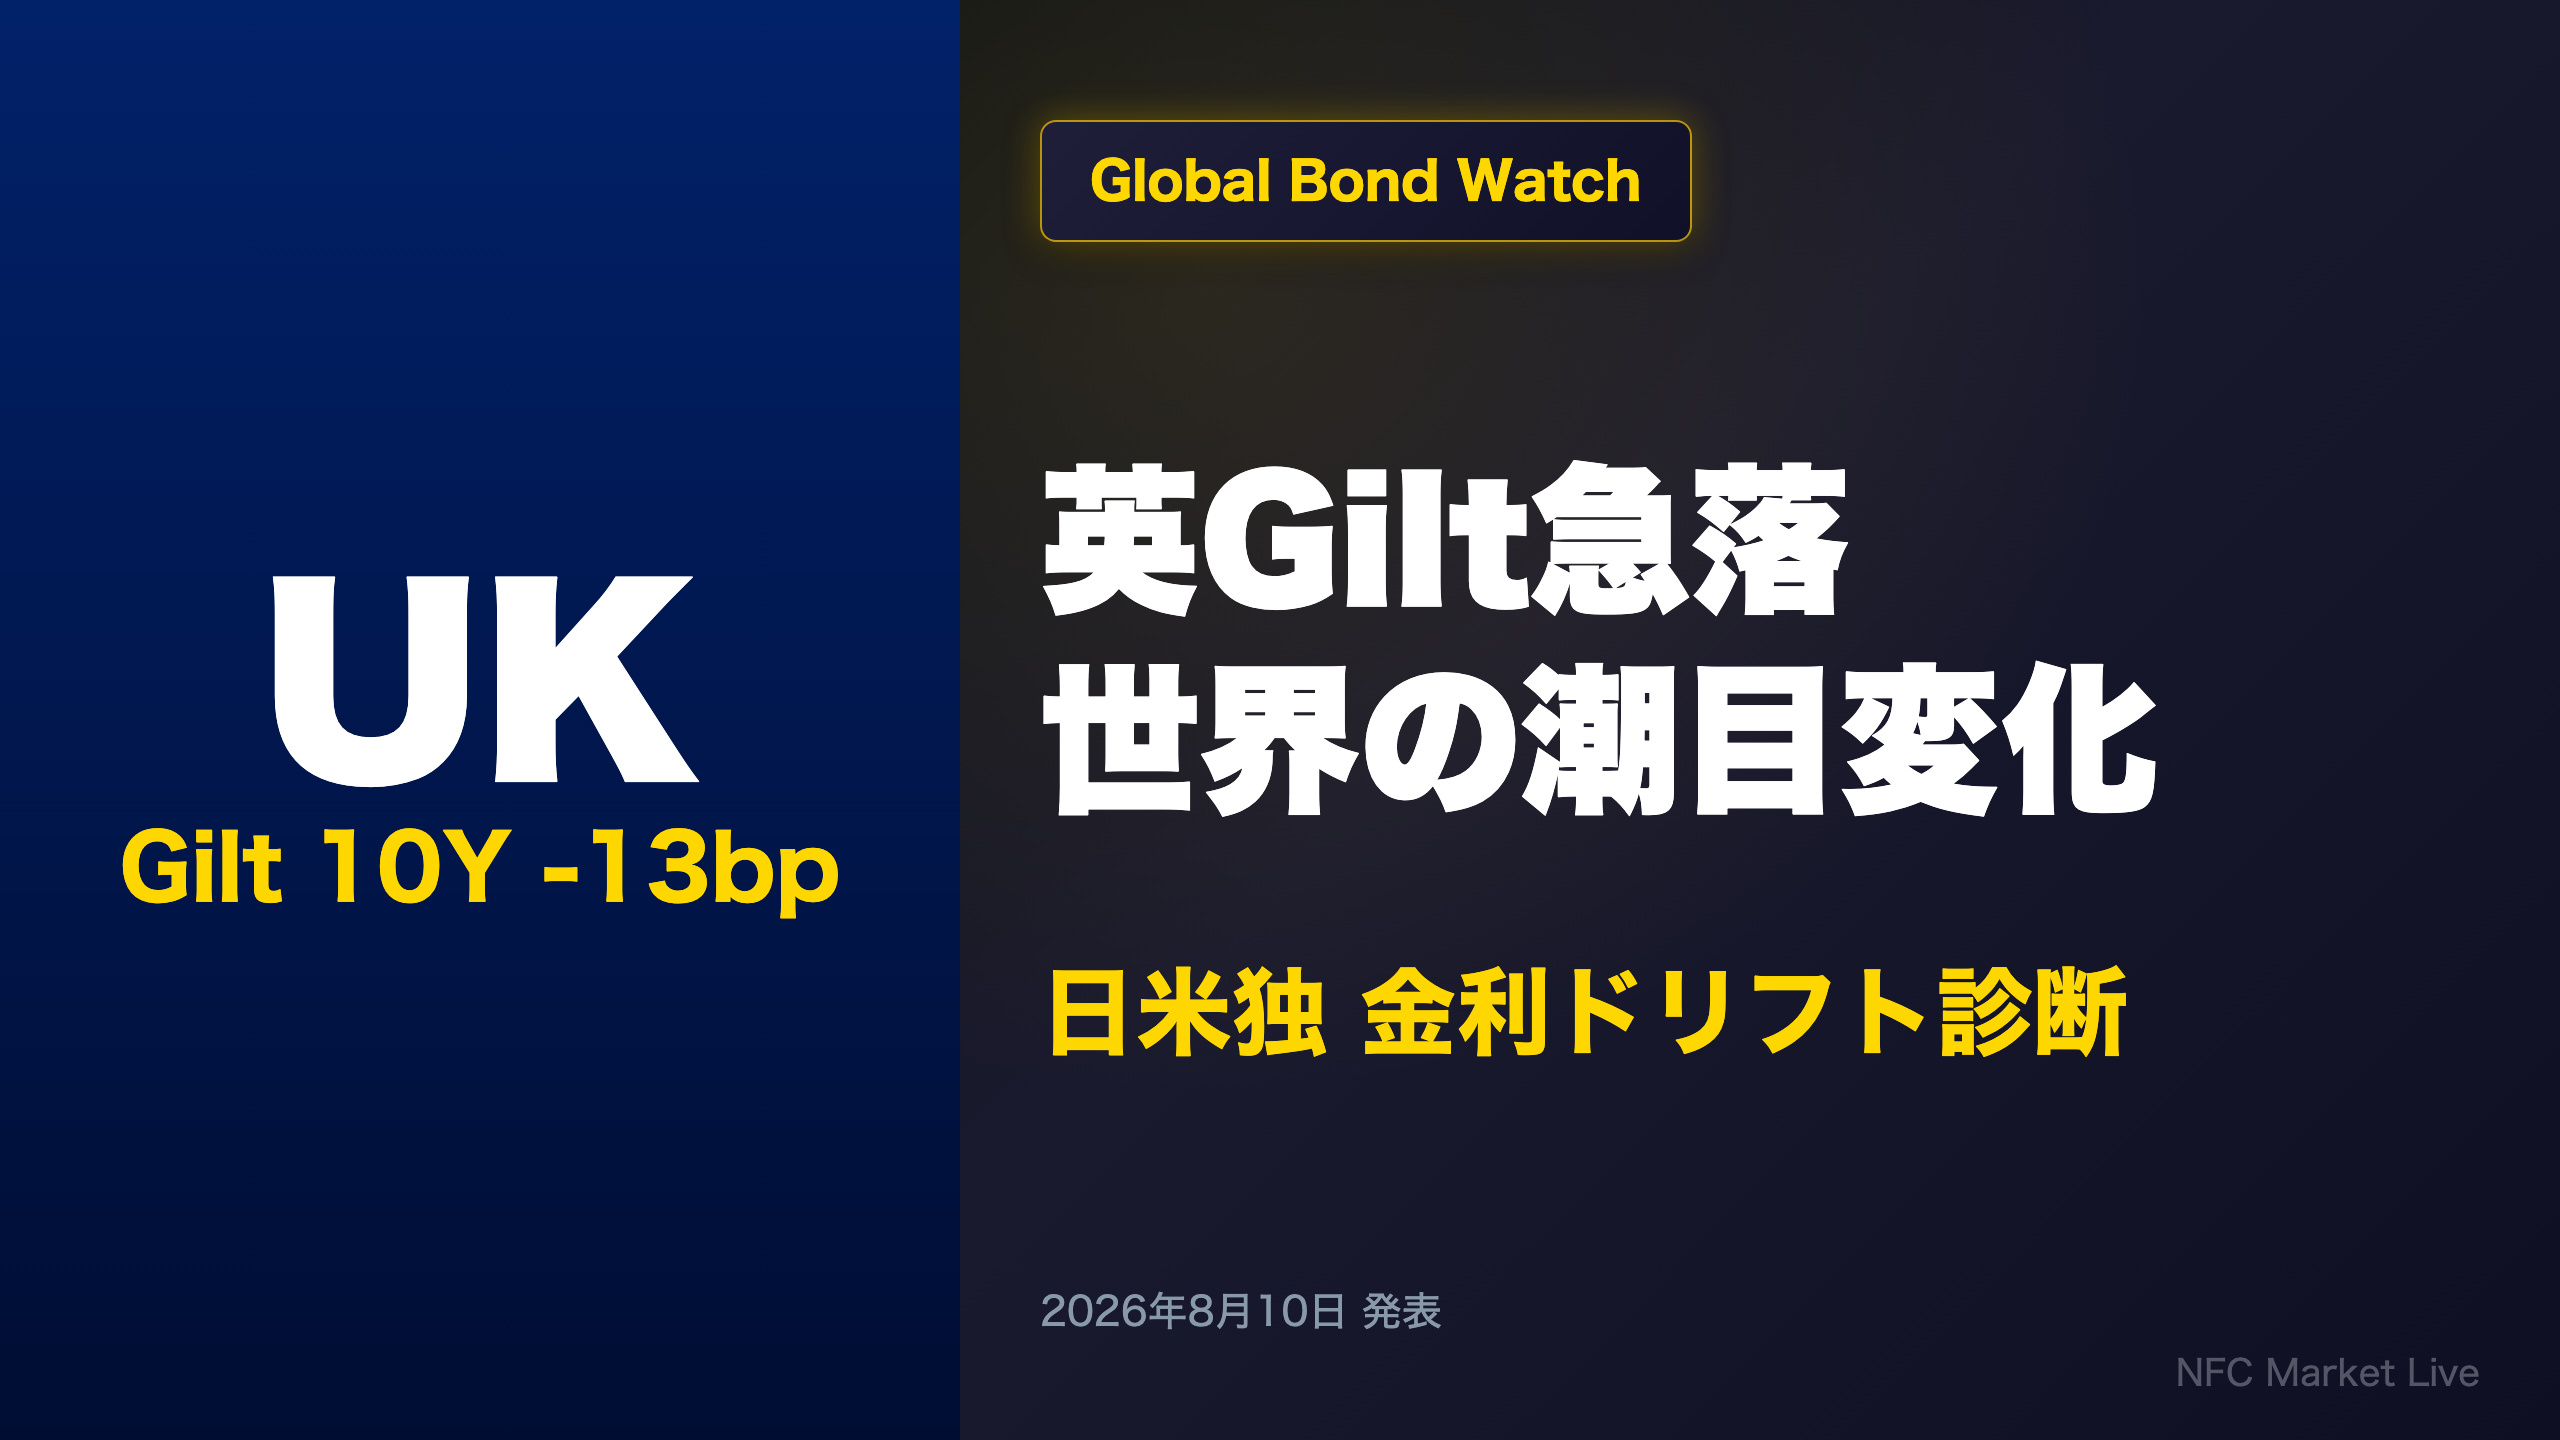
📊 This week’s global bond story: UK 10Y Gilts plunged 13bp, easing a key stress point in the global selloff narrative.
🇯🇵 Meanwhile, Japan’s JGB curve flattened — 2Y yields rose while 10Y/30Y fell, and auction bid-to-cover ratios softened across tenors.
🇺🇸 US Treasuries stayed remarkably calm, term spread intact.
💡 The US-Japan 10Y spread widened to 1.92pt. We check this against NFC’s proprietary HMM regime signals.
グローバル金利スナップショット / Global Rate Snapshot
What the UK Gilt Drop Really Means
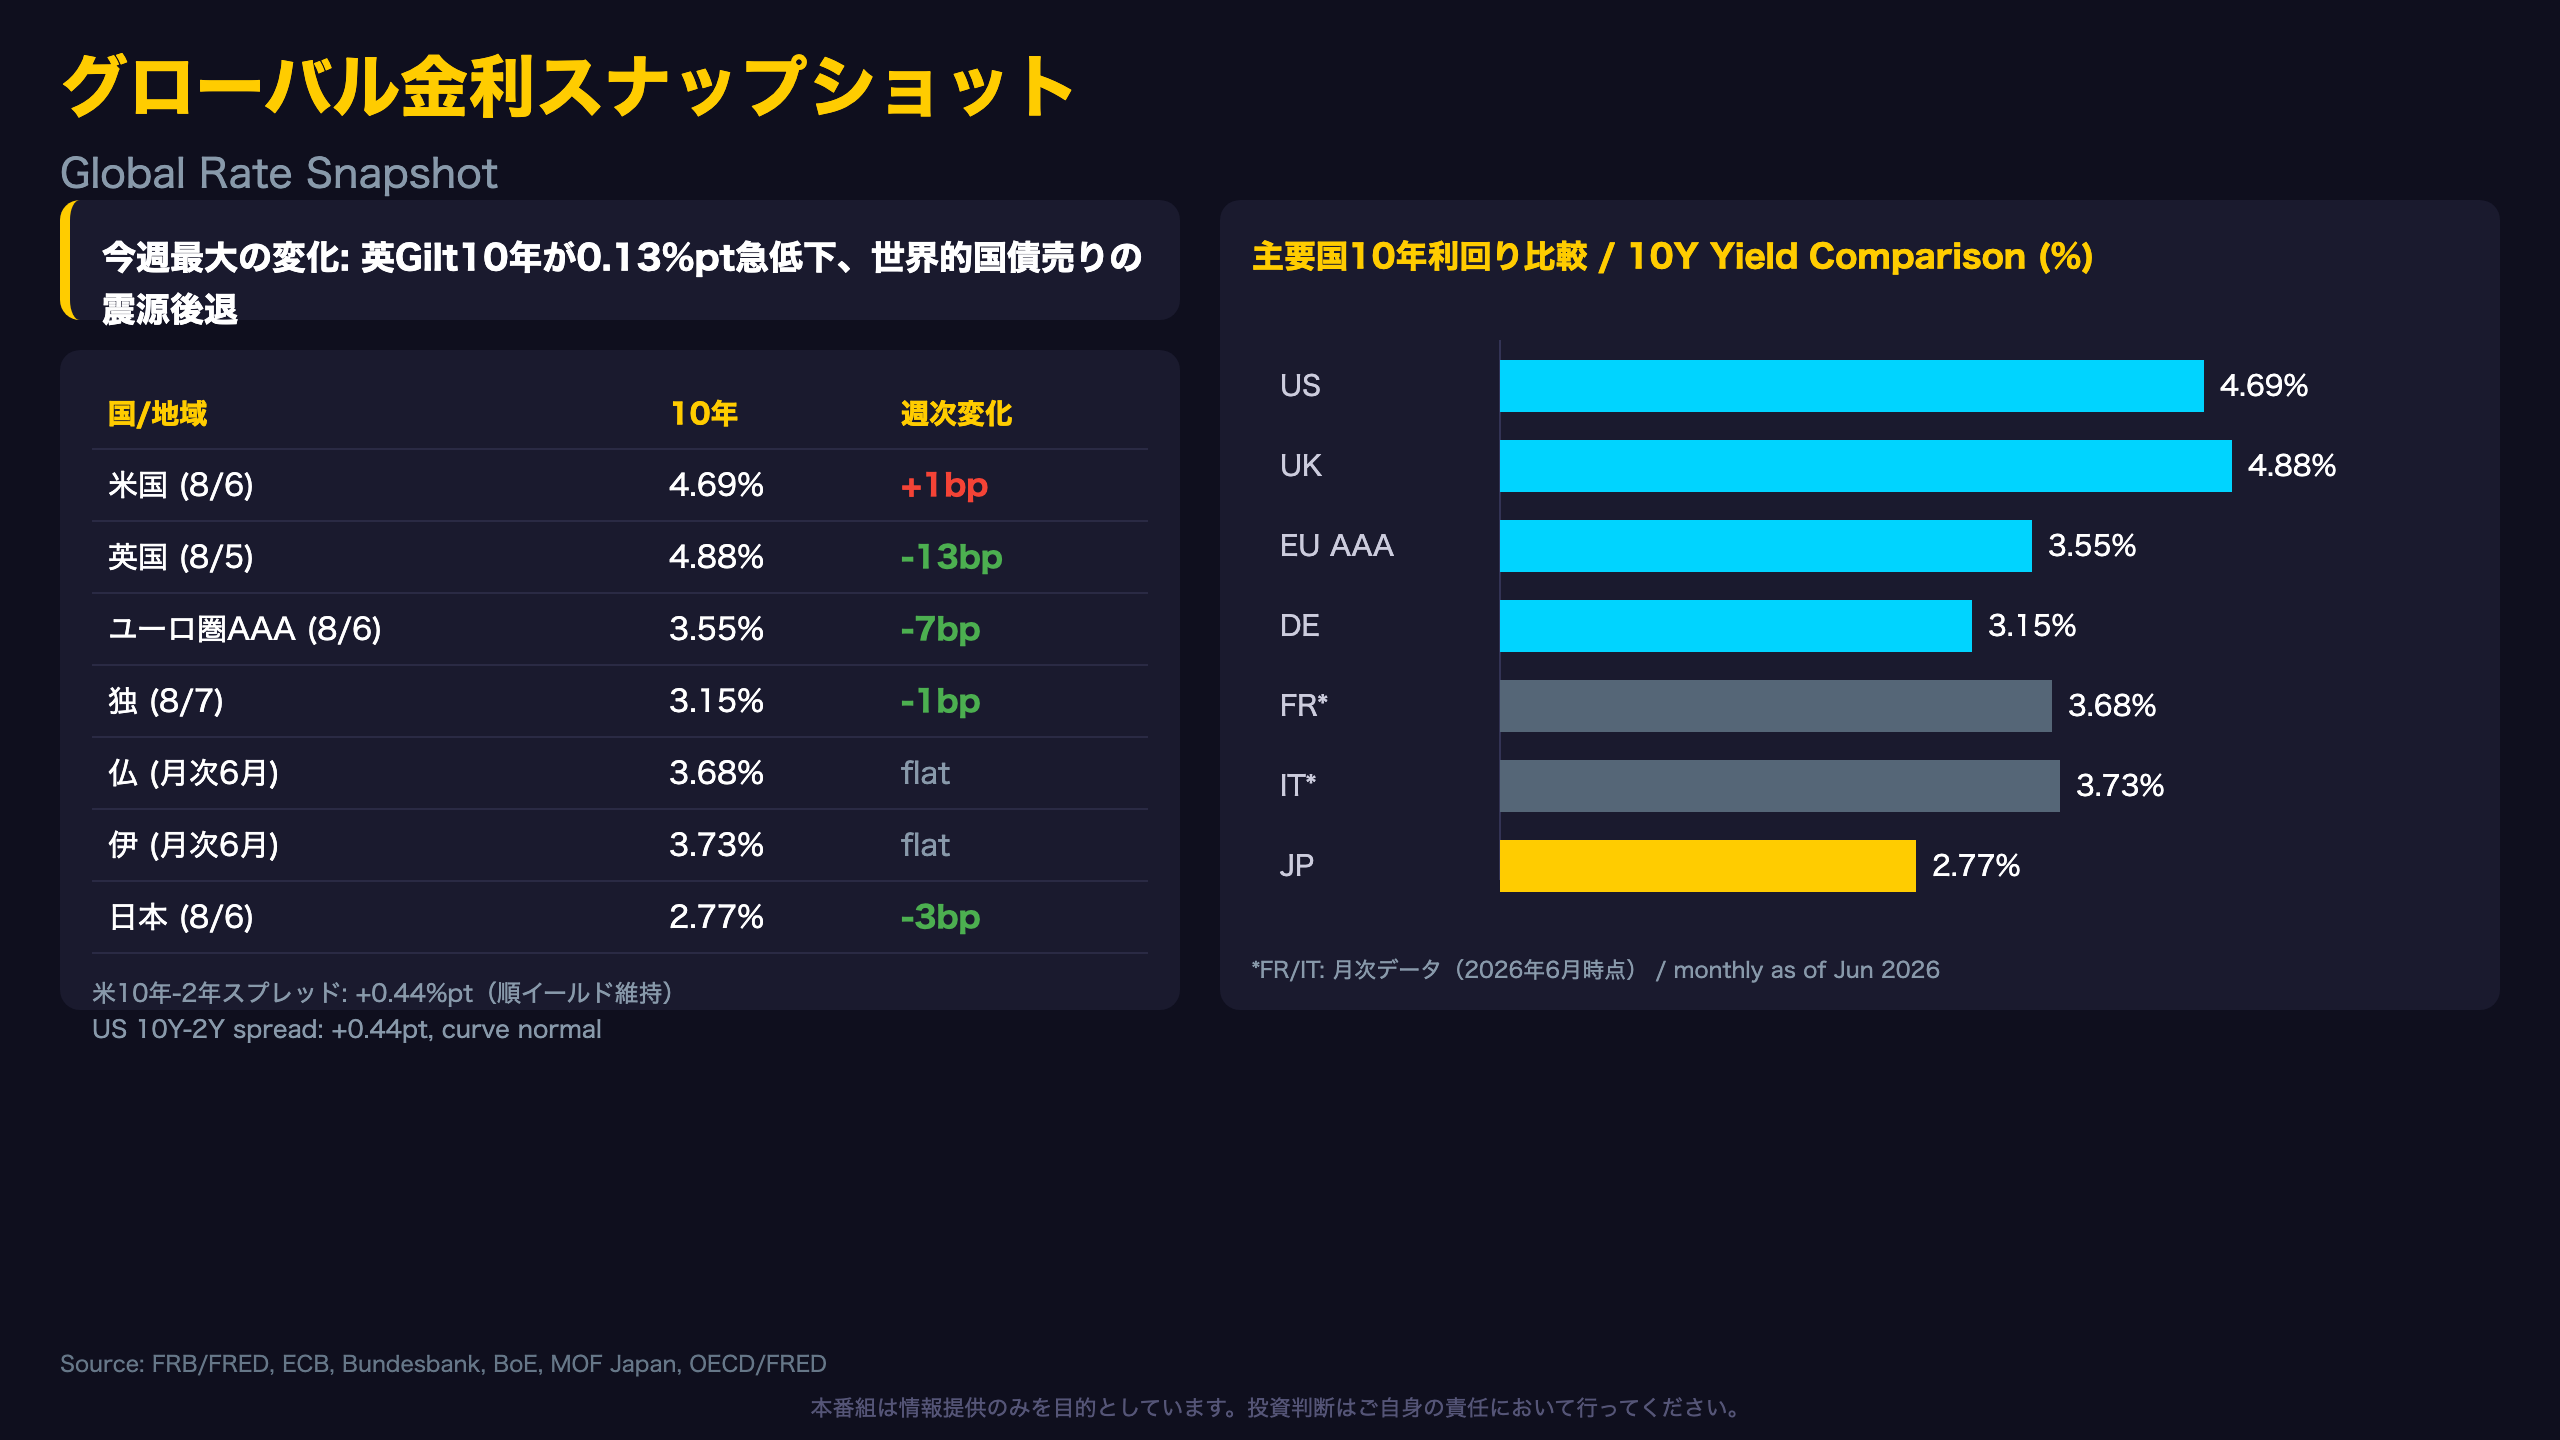
The UK 10-year Gilt yield fell to 4.88% as of August 5, down 13 basis points from 5.01% a week earlier (July 29). UK Gilts had been hovering above the psychologically important 5% level for weeks — widely cited as the epicenter of a broader “global bond selloff” narrative tied to fiscal concerns and sticky inflation. This week’s pullback suggests that particular stress point eased, at least temporarily.
By contrast, the US Treasury curve was remarkably quiet. The 2-year (4.25%), 10-year (4.69%), and 30-year (5.22%) yields — all as of August 6 — moved just 1-2bp versus the prior week. The 10-year minus 2-year term spread held at +0.44 percentage points, essentially unchanged from +0.45pt, keeping the curve in normal (upward-sloping) territory. For readers unfamiliar with US rates: this term spread is the same metric that famously inverted ahead of past recessions; its continued positive reading is a mild reassurance, though the underlying yield level (nearly 4.7% on the 10-year) remains historically elevated versus the pre-2022 era.
Japan’s JGB curve tells yet another story: the 2-year yield rose 6bp to 1.56% (hawkish BOJ repricing at the short end) while the 10-year and 30-year yields both declined. This flattening — short rates up, long rates down — diverges from both the UK’s broad-based rally and the US’s flat stability, underscoring that this week’s global bond market moves were driven by country-specific dynamics rather than a single global factor.
米国債入札 Deep Dive / US Treasury Auction
Why Falling “Indirect Bidder” Shares Matter
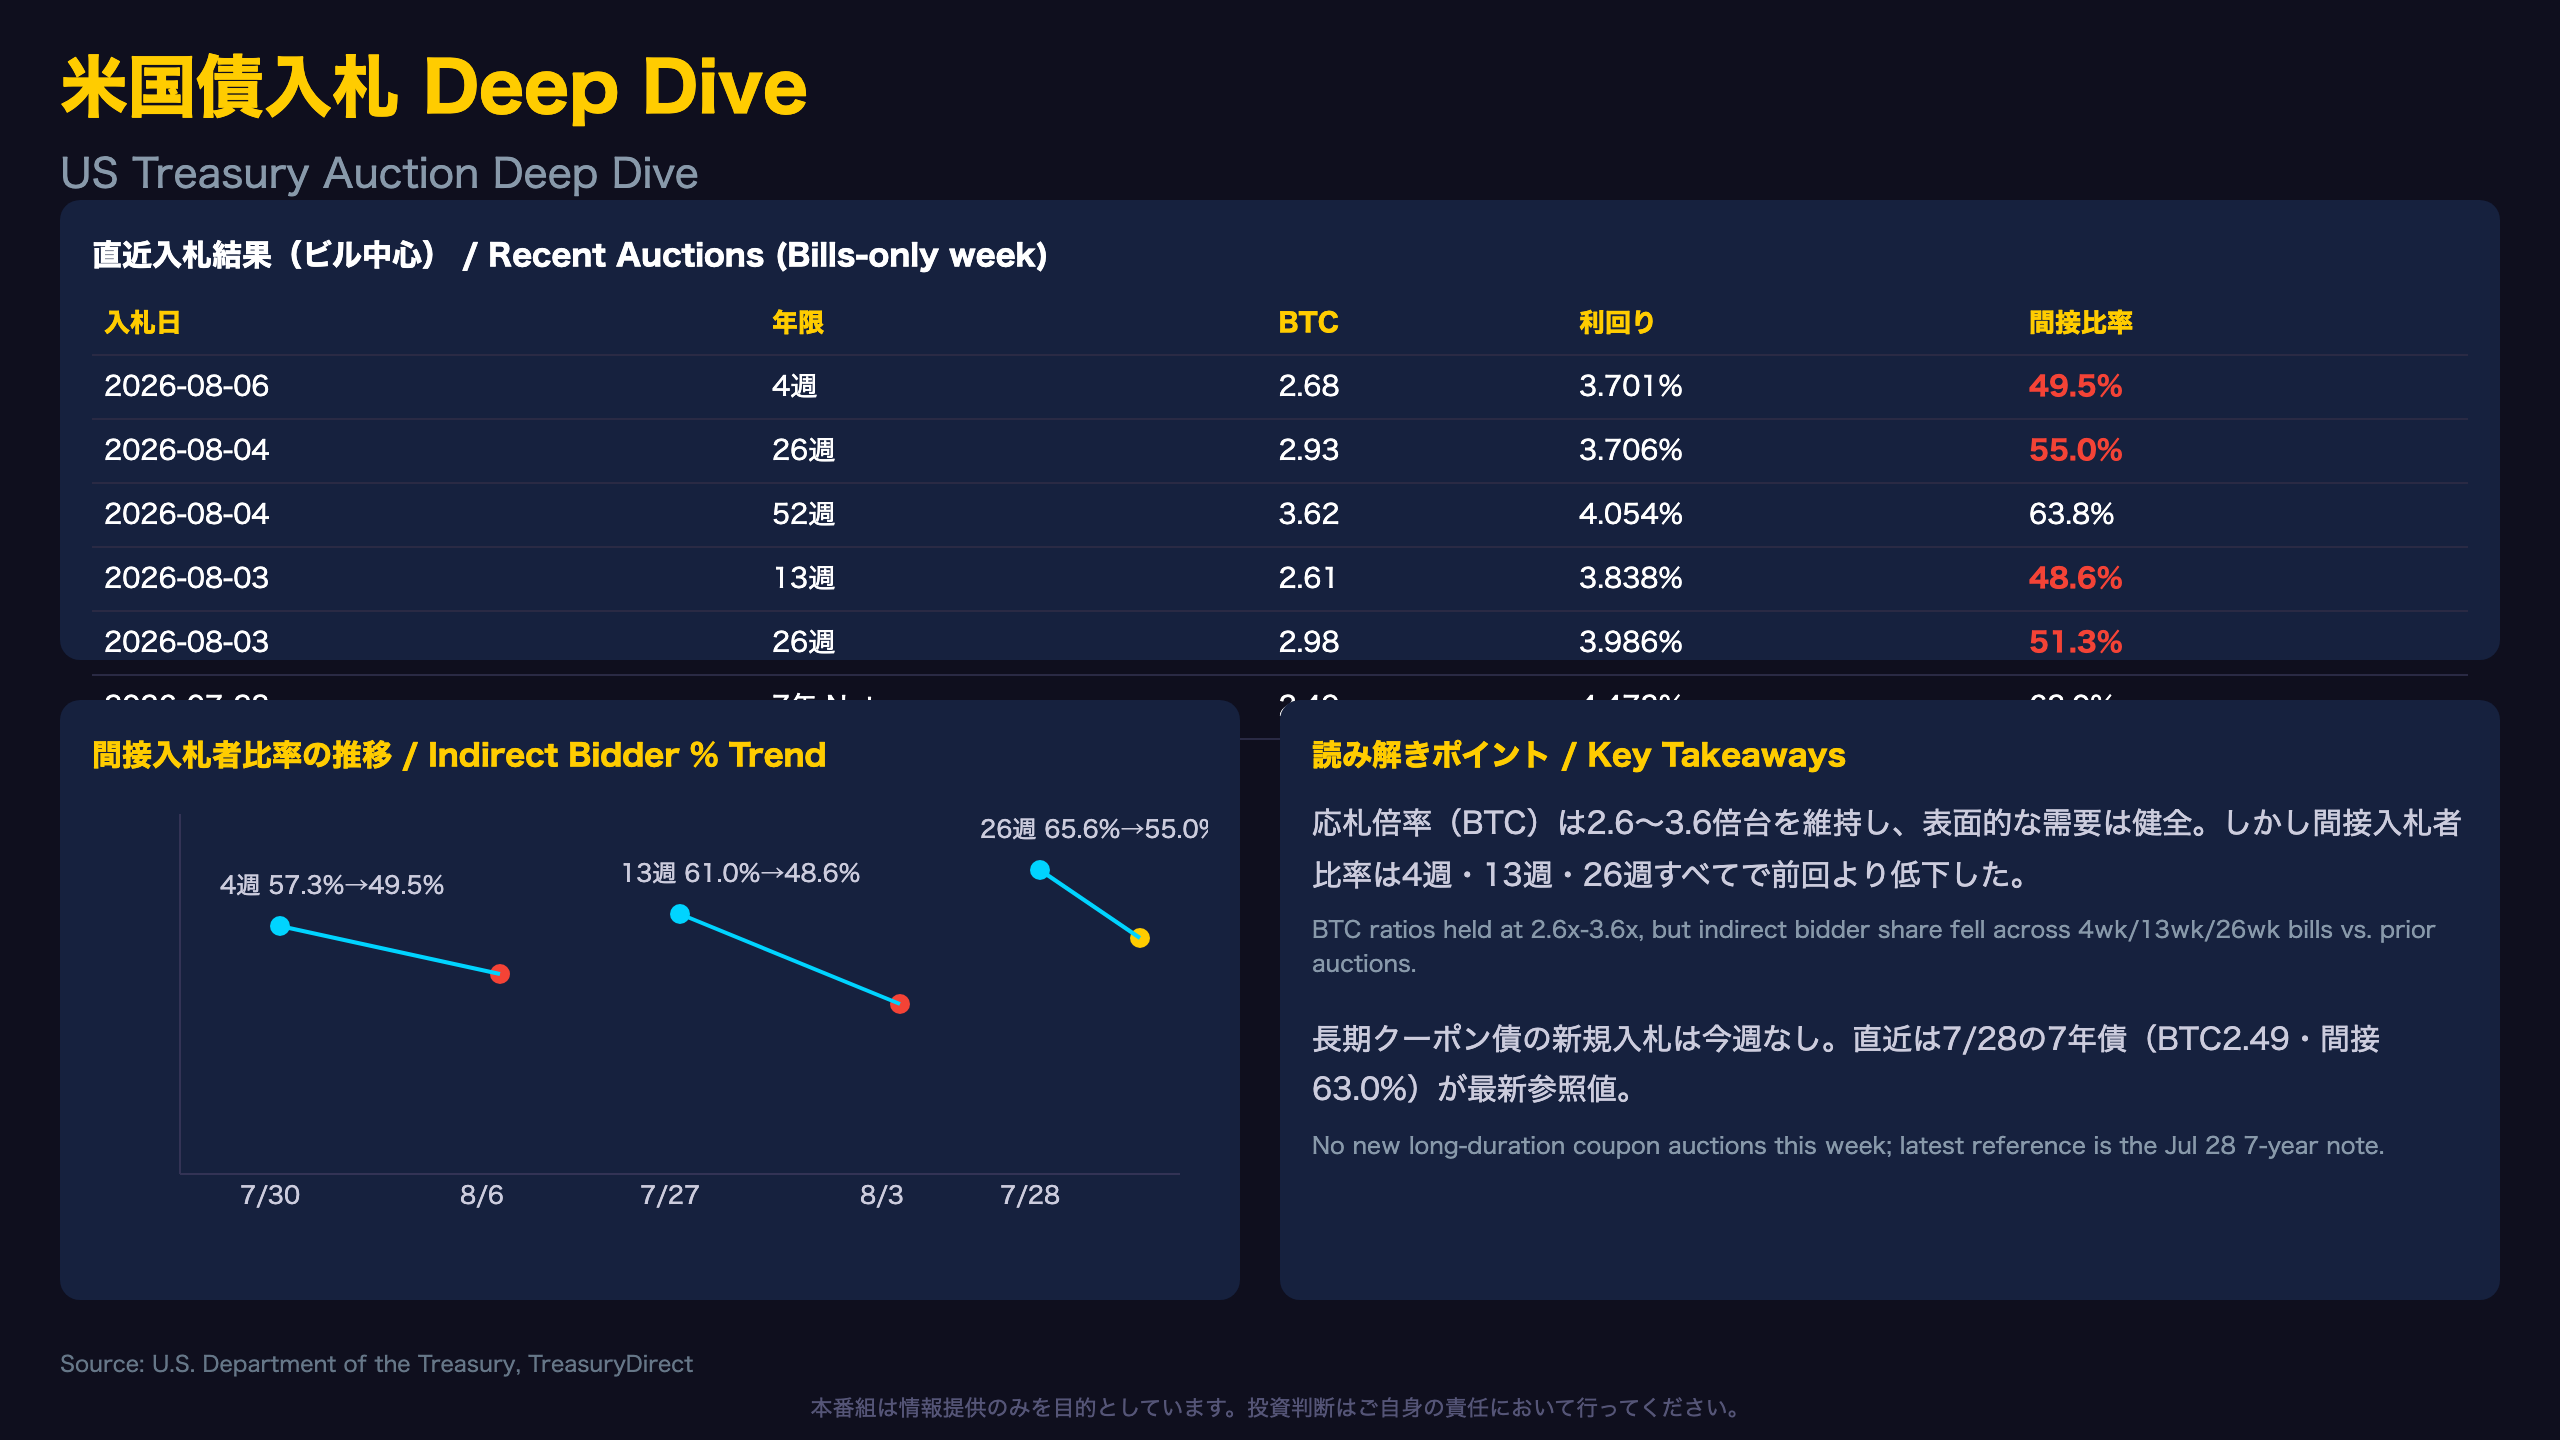
This week’s (Aug 3-6) US Treasury auction calendar was bill-only — no new coupon (Note/Bond) issuance. Headline demand looked healthy: bid-to-cover (BTC) ratios held in the 2.6x-3.6x range across tenors, comparable to prior auctions.
Look under the hood, though, and a more nuanced picture emerges in the “indirect bidder” category — the proxy for foreign central bank and sovereign wealth participation that global macro investors watch closely:
- 4-week bill: 49.5% (Aug 6) vs. 57.3% (Jul 30) — down 7.8pt
- 13-week bill: 48.6% (Aug 3) vs. 61.0% (Jul 27) — down 12.4pt
- 26-week bill: 55.0% (Aug 4) vs. 65.6% (Jul 28) — down 10.6pt
US Treasury auctions are watched globally as a gauge of foreign appetite for dollar assets, similar to how JGB bid-to-cover ratios are watched for BOJ policy credibility. A falling indirect bidder share across three consecutive bill tenors, even as overall BTC ratios stayed firm, suggests domestic primary dealers may have absorbed any softening in foreign demand rather than yields needing to rise to clear the auctions.
This is a single-week observation, not a structural shift — but worth monitoring ahead of mid-August’s 10-year and 30-year coupon auctions, which will offer a cleaner read on longer-duration foreign appetite.
ヨーロッパ債券市場 / European Bond Markets
European Bonds: Gilt-Led Risk-Off Retreat
The UK 10-year Gilt’s sharp 13bp decline was this week’s headline European story, falling to 4.88% by August 5 — a clear retreat from the 5%+ levels flagged in recent weeks as a stress point. This wasn’t purely a UK phenomenon: the ECB’s Euro Area AAA 10-year yield (a composite benchmark of top-rated euro sovereigns) also fell to 3.55% (Aug 6), down 7bp from 3.62%.
Unlike the US Treasury market, the eurozone has no single common bond — each member state issues its own debt, and the spread between countries like France (OAT) or Italy (BTP) versus Germany’s Bund (the benchmark “risk-free” euro asset) is the market’s real-time gauge of fiscal and political risk, conceptually similar to emerging-market sovereign spreads over US Treasuries.
Germany’s 10-year Bund was essentially flat at 3.15% (Aug 7) vs. 3.16% (Jul 31). France’s OAT and Italy’s BTP remain monthly data (latest: June 2026, unchanged at 3.68%/3.73%). Their spreads over Bund widened marginally — OAT-Bund to 53bps (from 52) and BTP-Bund to 58bps (from 57) — a 1bp move within normal noise, not a clear signal of deteriorating sentiment.
日本国債・日銀政策金利 / JGB & BOJ
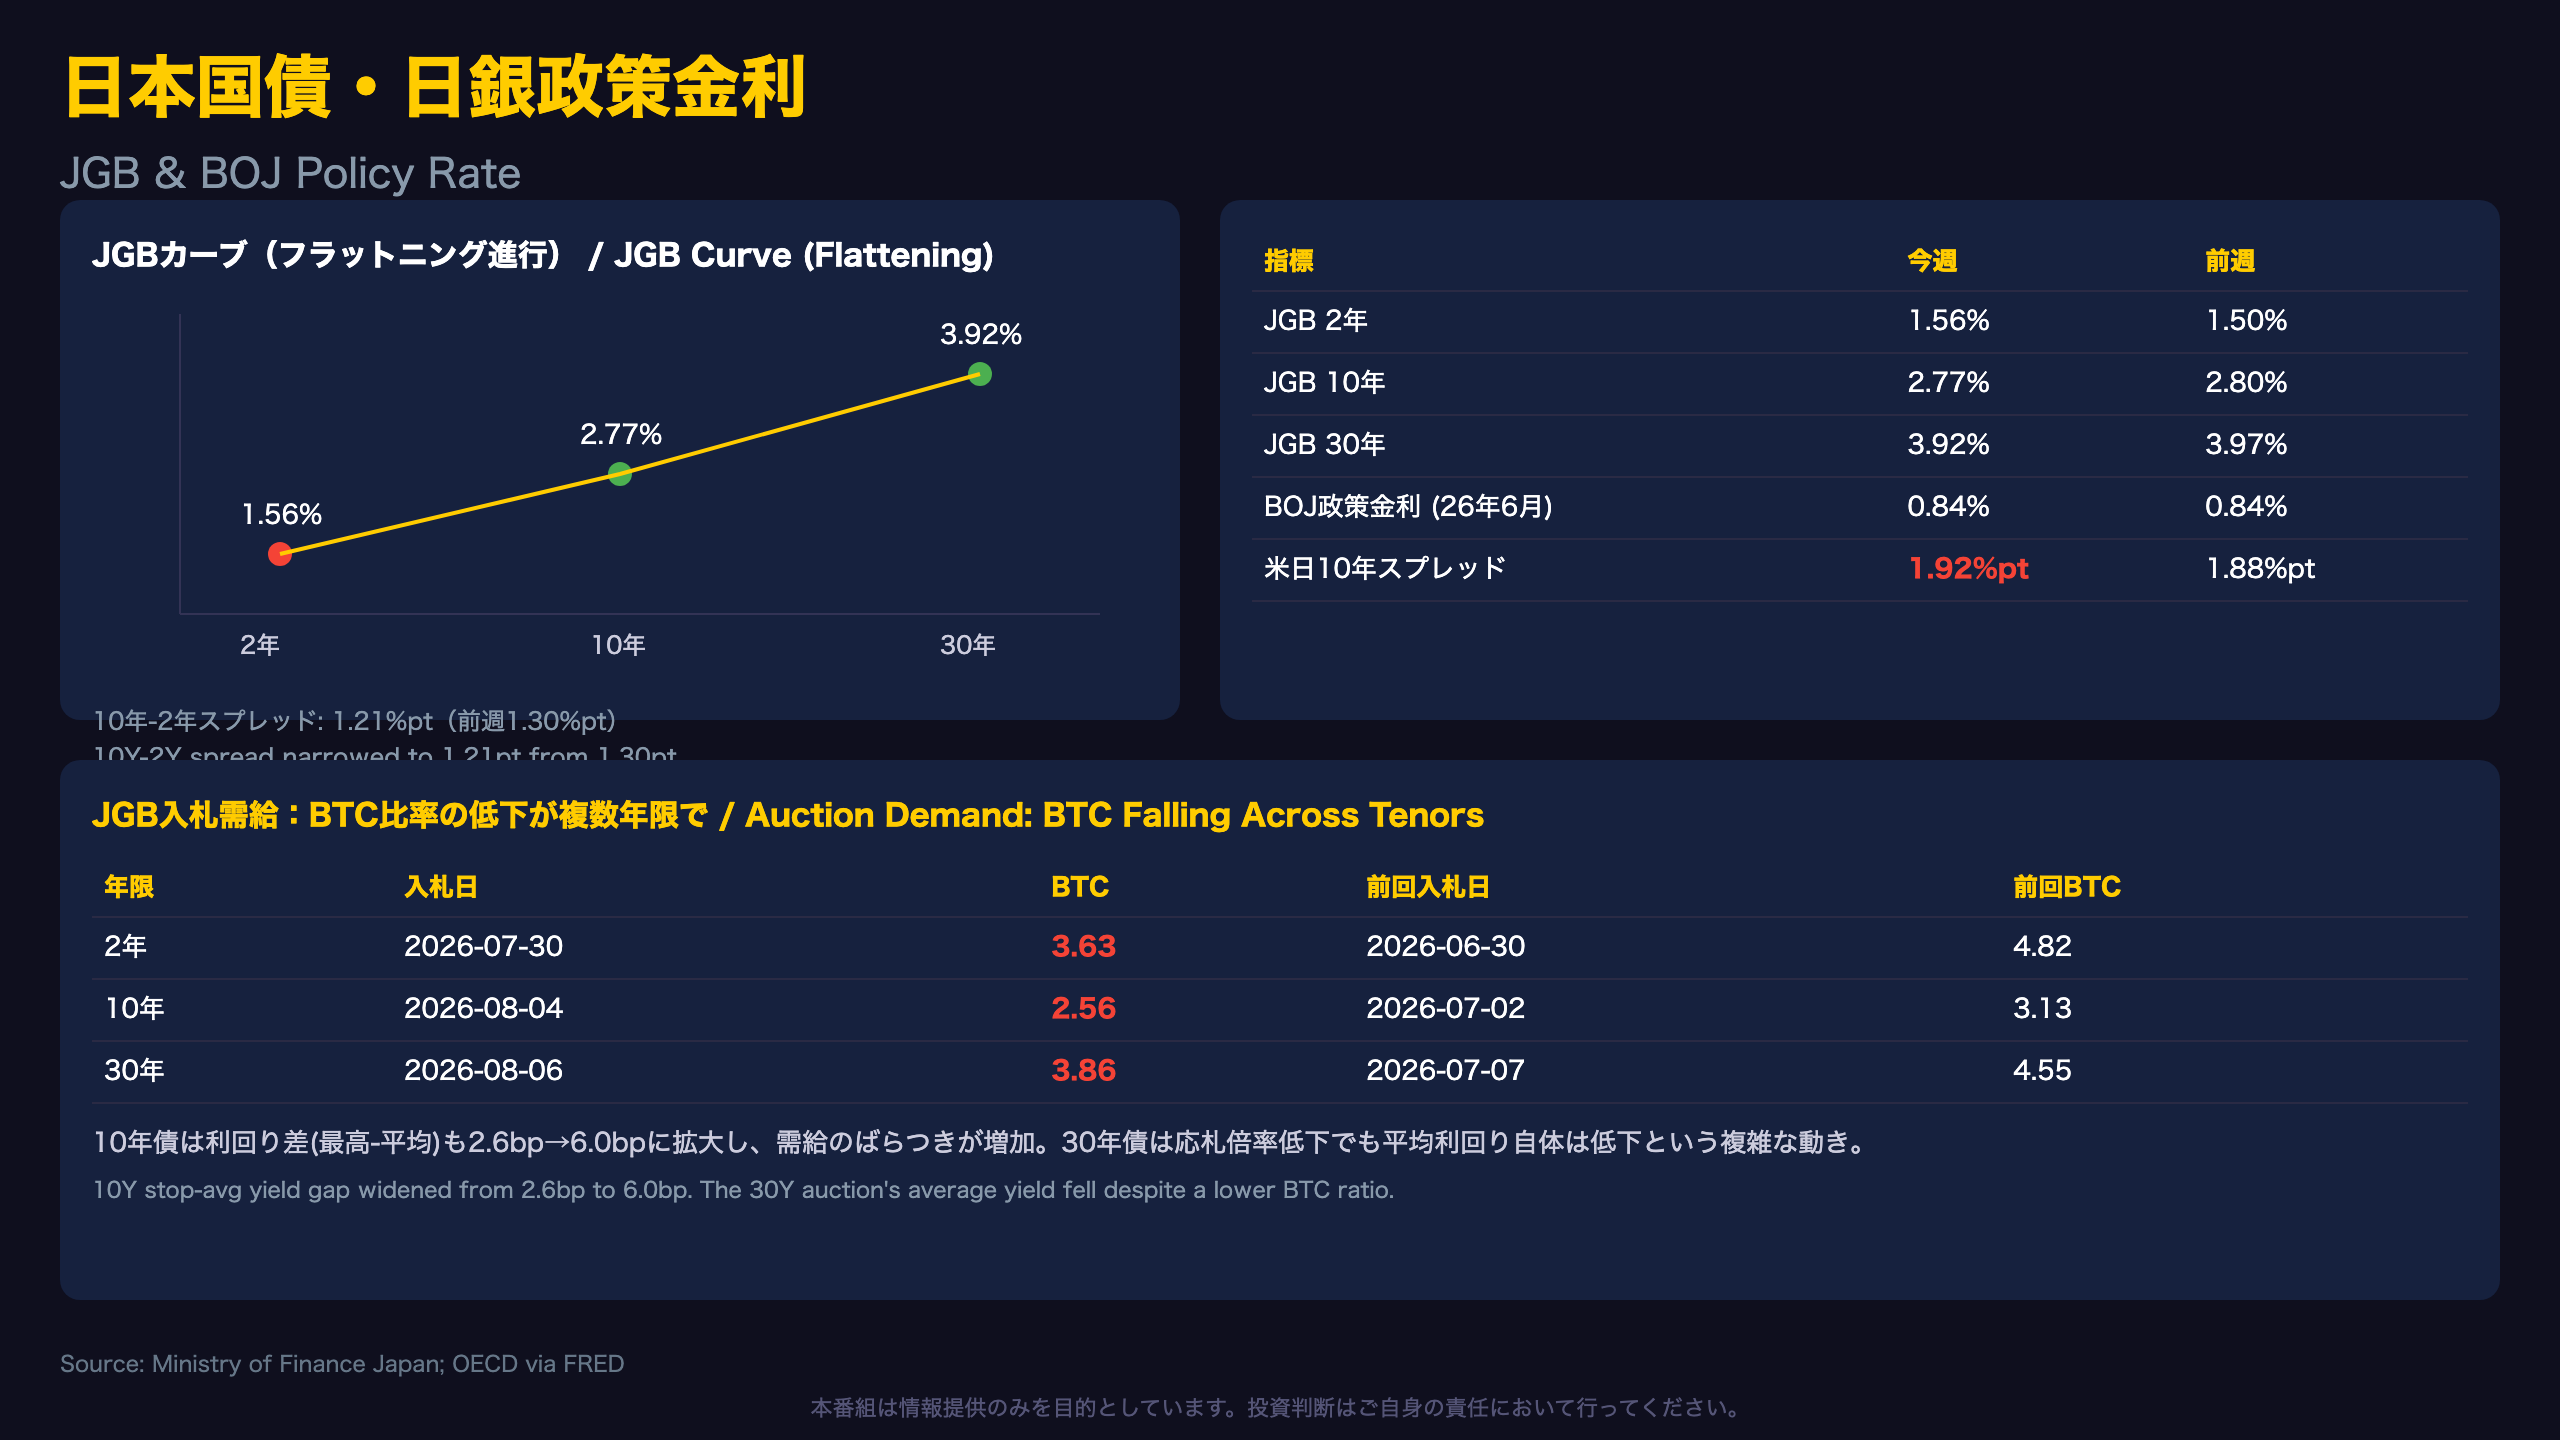
Cracks Appearing in JGB Auction Demand
Japan’s 10-year minus 2-year yield spread narrowed to +1.21 percentage points, down from +1.30pt on July 30 — driven mainly by a 6bp rise in the 2-year yield, which likely reflects growing market conviction that the Bank of Japan will continue its rate-hike cycle. For context, JGB yields remain far below US Treasury levels in absolute terms (Japan’s 10-year at 2.77% vs. the US 10-year at 4.69%), but the direction of change — not the level — is what matters for BOJ policy-normalization trades.
A closer look at auction data reveals softening demand across multiple tenors:
- 2-year (Jul 30): bid-to-cover 3.63x, down from 4.82x (Jun 30)
- 10-year (Aug 4): bid-to-cover 2.56x, down from 3.13x (Jul 2)
- 30-year (Aug 6): bid-to-cover 3.86x, down from 4.55x (Jul 7)
The 10-year auction also showed a widening gap between the average and highest accepted yield (6.0bp vs. 2.6bp in the prior auction) — a classic sign of dispersion in investor demand. Curiously, the 30-year auction’s average yield actually fell (3.937% vs. 3.993%) even as its bid-to-cover ratio dropped, showing that “demand quality” and “absolute yield level” don’t always move in lockstep.
The BOJ’s policy rate stood at 0.84% as of June 2026 (OECD data, monthly). The widening US-Japan 10-year spread (1.92pt, up from 1.88pt) is one of the key inputs into USD/JPY carry-trade economics, though this week’s JGB demand softening is a domestic factor carry traders should weigh alongside the rate differential.
FX・CFDへの含意 / Trade Implications
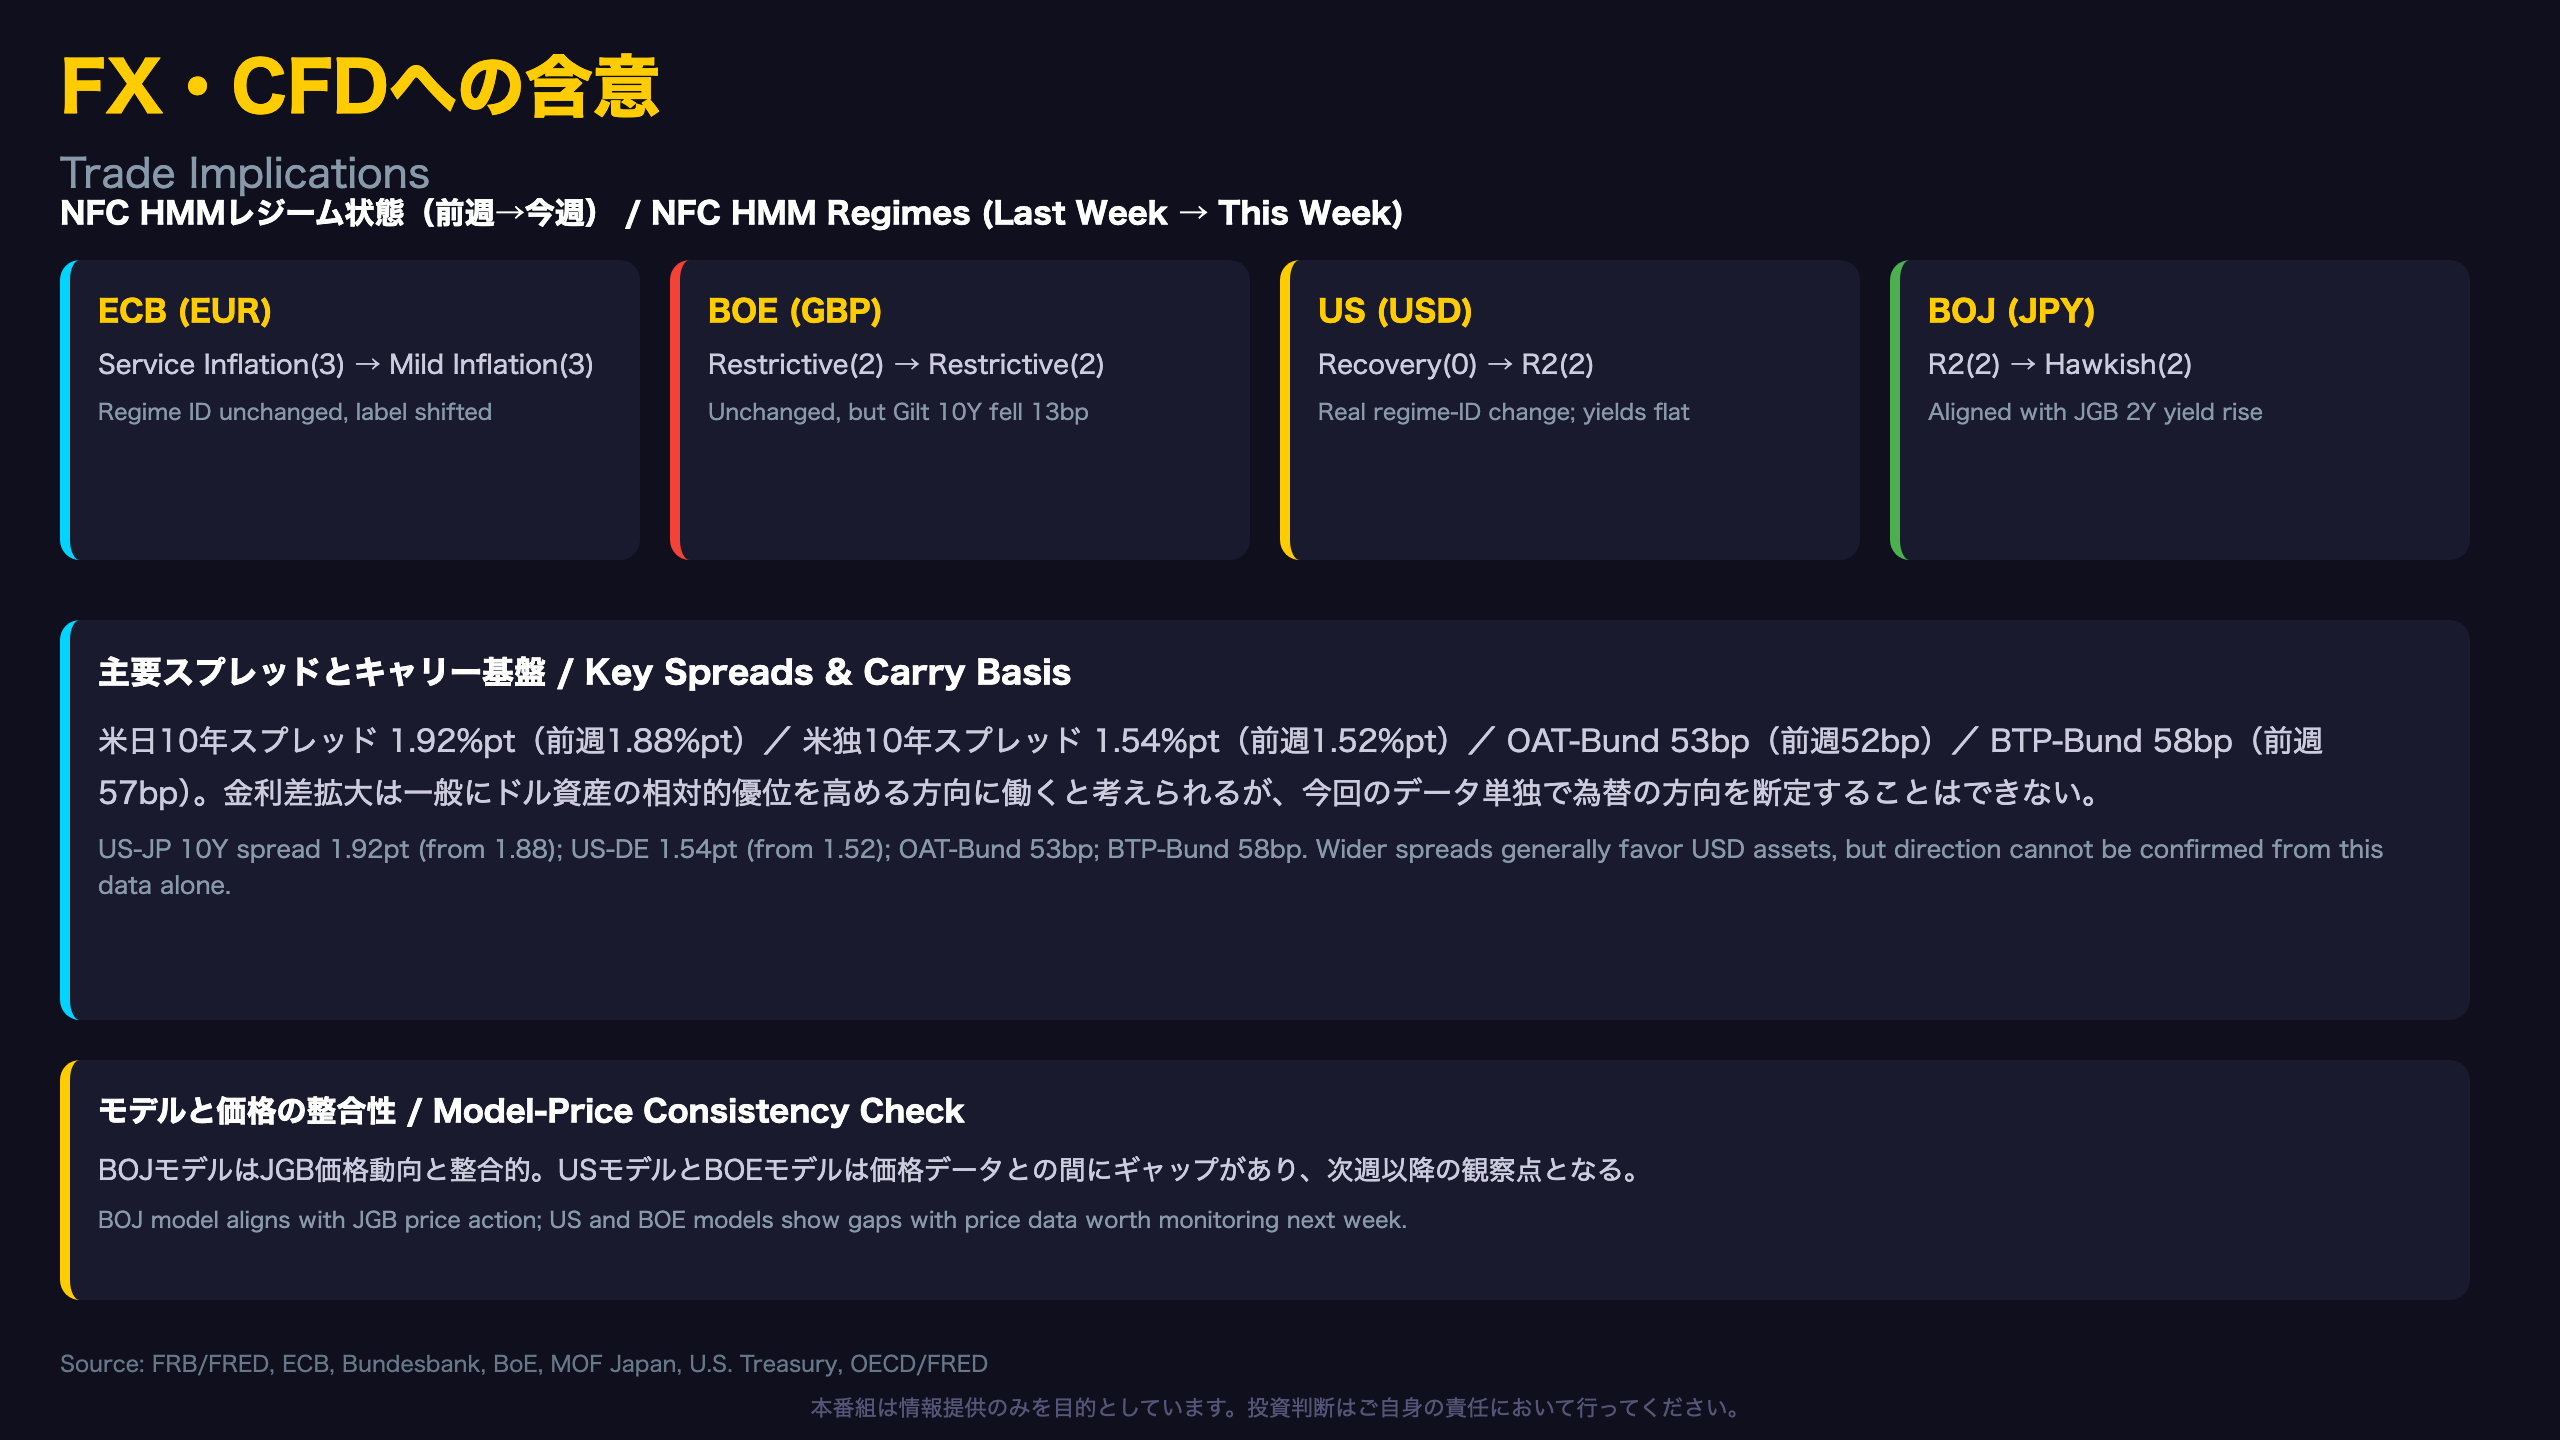
Cross-Checking HMM Regimes Against Bond Data
NFC’s Hidden Markov Model (HMM) framework classifies each central bank’s policy environment into statistically-derived regimes. This week’s readings:
| Model | Last Week | This Week |
|---|---|---|
| ECB | Service Inflation (3) | Mild Inflation (3) |
| BOE | Restrictive (2) | Restrictive (2) |
| US | Recovery (0) | R2 (2) |
| BOJ | R2 (2) | Hawkish (2) |
The most notable shift: the US model’s regime ID actually changed (0→2), yet the Treasury curve barely moved (1-2bp this week). This gap between a real statistical shift and static yields is worth watching alongside this week’s softer indirect-bidder share in bill auctions.
The BOJ model kept its regime ID but relabeled to “Hawkish” — consistent with the JGB 2-year yield’s rise and the flattening term spread, a case of model-price alignment.
The BOE stayed “Restrictive” even as the 10-year Gilt fell 13bp. For context, “restrictive” describes a policy stance still cooling inflation via higher rates — distinct from the direction yields move day-to-day. This mismatch may reflect non-monetary factors like easing fiscal-risk premia rather than a policy shift.
Regime labels describe the statistical character of the current environment, not price forecasts. This week’s divergences are themselves useful data points to track going forward.
Disclaimer: This article is for informational purposes only. All investment decisions are made solely at your own risk.