📺 Watch the Full Video Analysis
This article was automatically generated by the NFC Market Live AI analysis system. (Updated: 2026-08-09 10:16 JST)
📊 This week’s NFC Market Live Weekly Programming Review.
Earnings-themed Shorts dominated the top rankings, hitting a 65.7% retention rate 📈.
Meanwhile, 8 of 24 new long-form videos recorded zero views 💦.
💰 Weekly production cost hit 5,964 yen, with one program costing 701 yen alone. An RBI-related program’s social posting cost came in at roughly 10x the channel average ⚠️.
Subscribers grew +4, but the engagement rate plunged from 0.732% to 0.131% 📉.
A full data-driven breakdown of what worked, what didn’t, and what’s next.
オープニング:今週の全体サマリー
This Week’s Snapshot
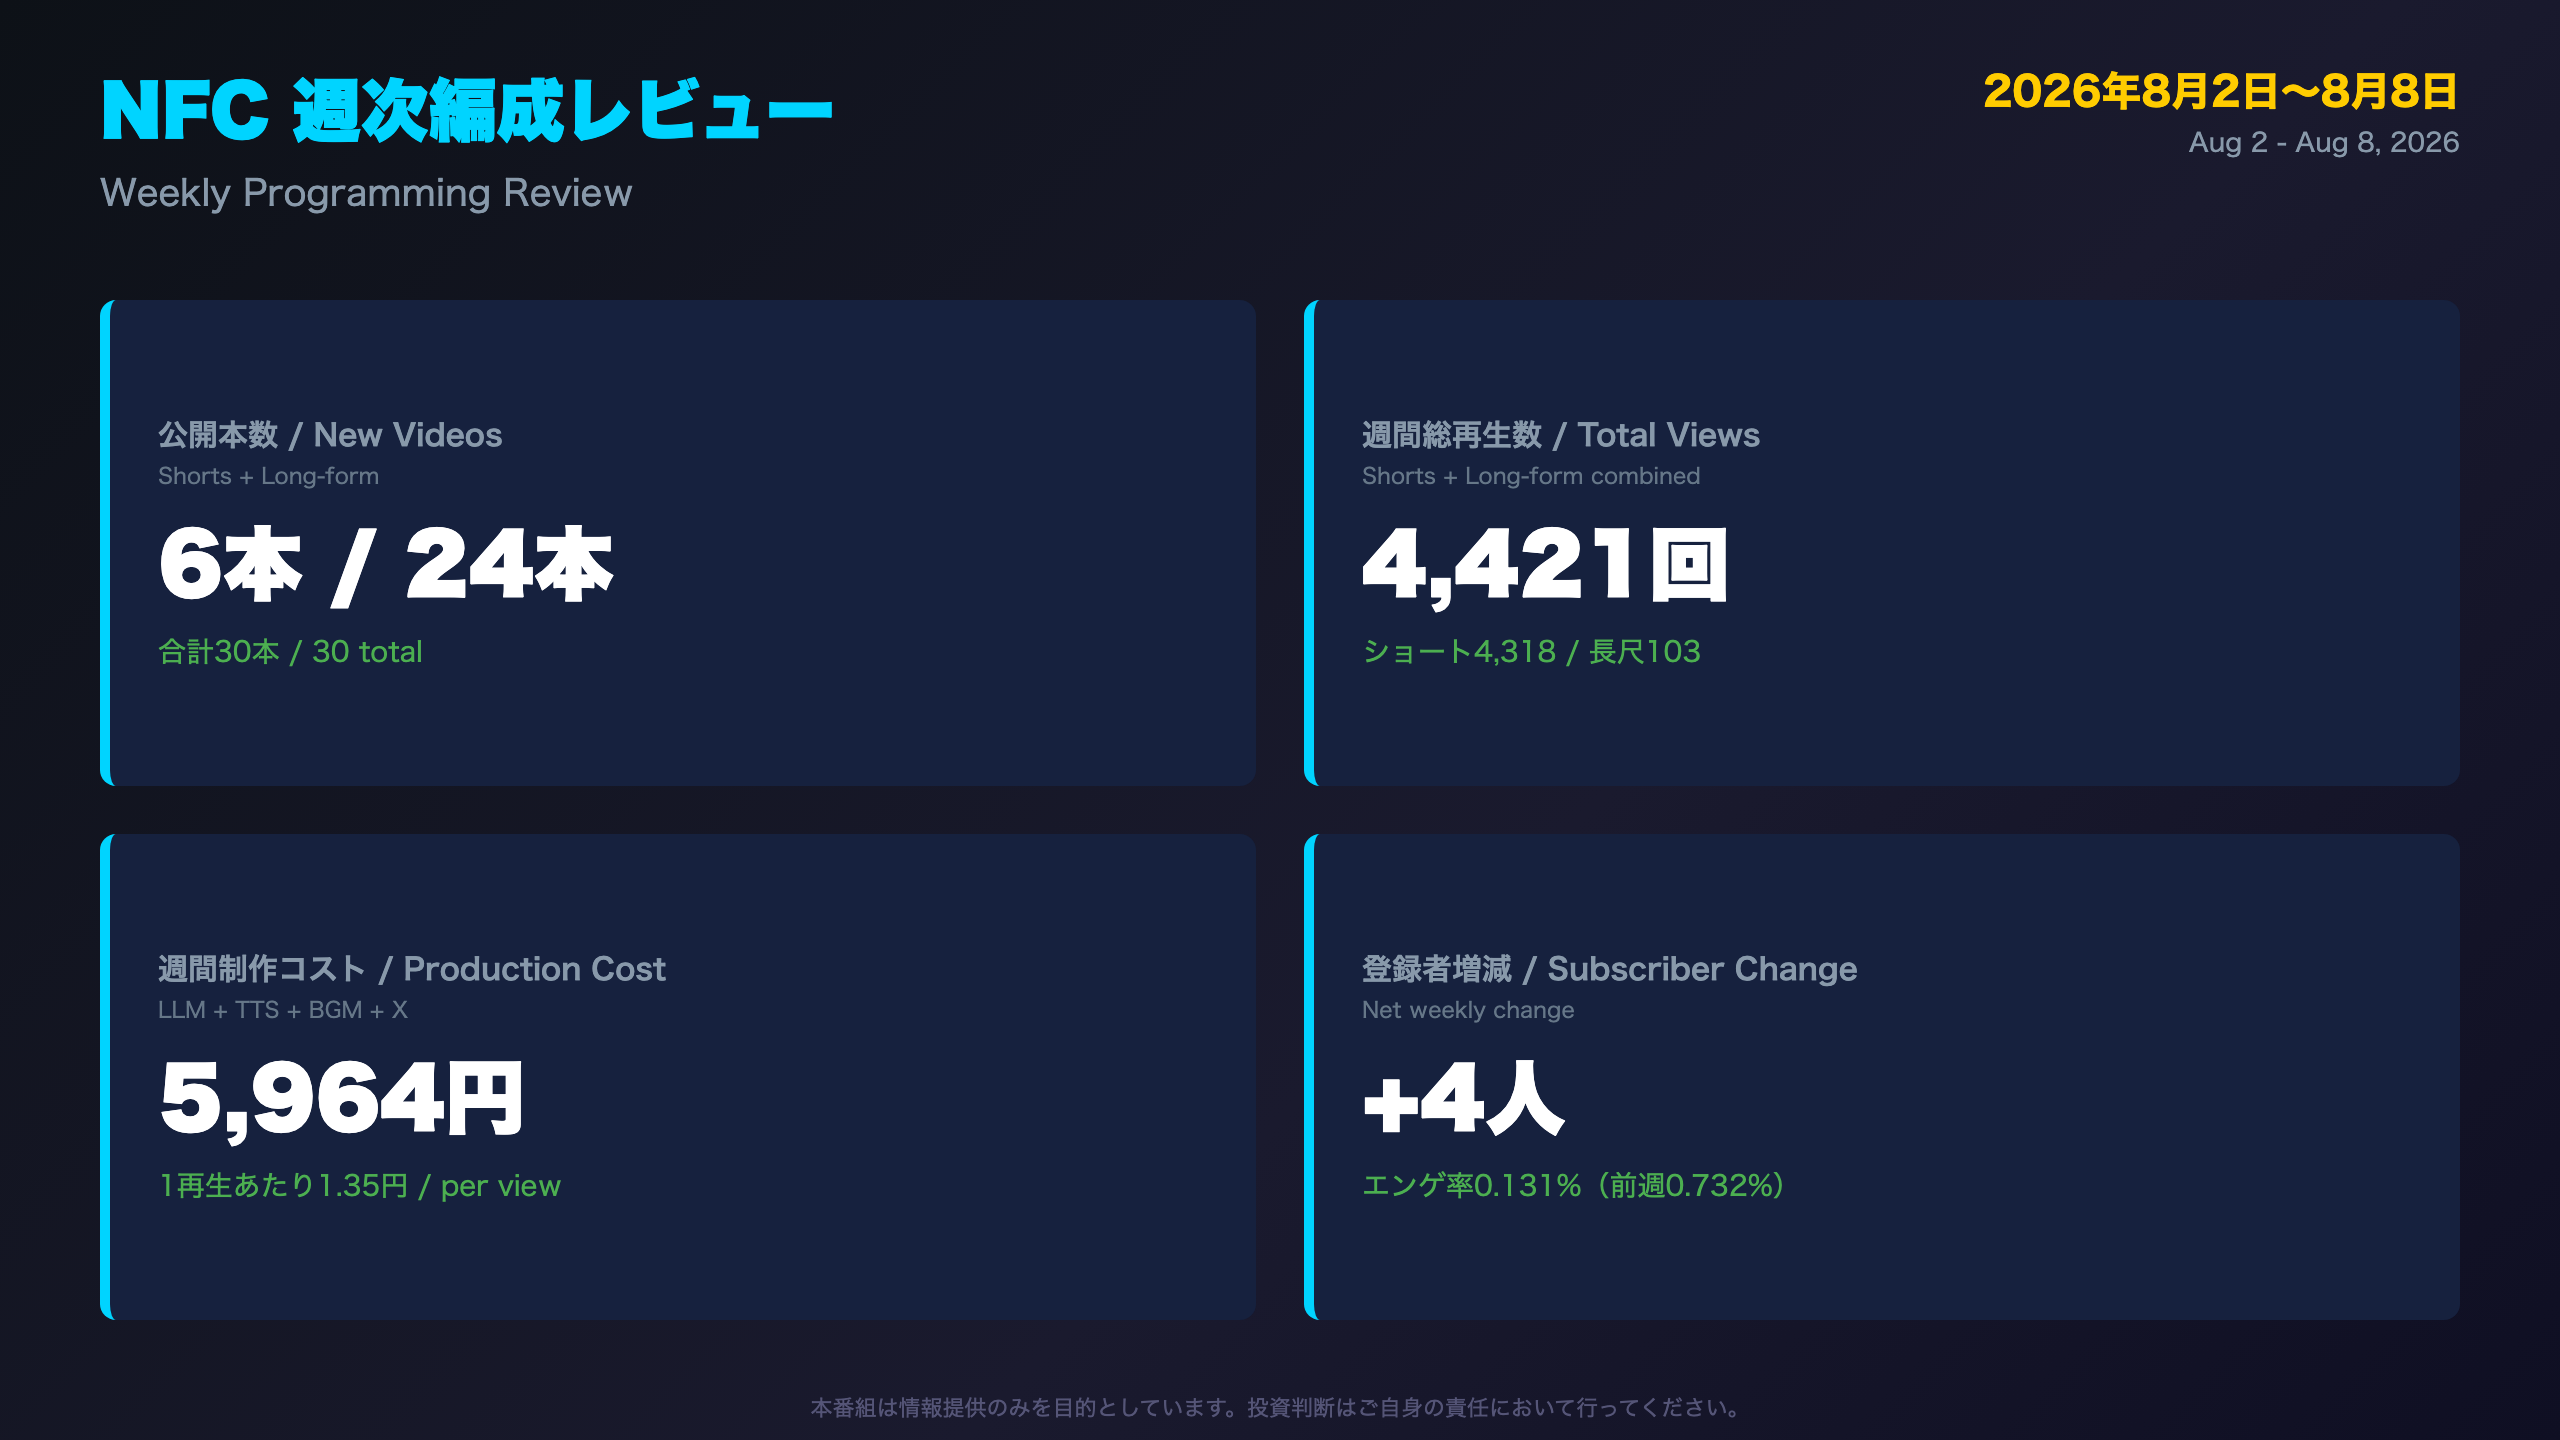
NFC Market Live published 30 new videos (6 Shorts, 24 long-form) during the review period of August 2-8, 2026, generating a combined 4,421 views at a total production cost of 5,964 yen, or 1.35 yen per view.
Context for International Readers
NFC Market Live is a Japanese-language financial news channel covering macro data releases (BOJ, BLS, BCB, Banxico, RBI) and corporate earnings. Unlike a single flagship broadcast, the channel runs a high-frequency ‘rapid-fire’ model, publishing dozens of short videos per week alongside longer explainer segments, similar to a hybrid between a market-alert wire service and a specialized macro newsletter.
Key Metrics
- Subscriber growth: +4 net this week
- Engagement rate: 0.131% over the trailing 7 days, down sharply from 0.732% in the prior 7-day window, an area flagged for further investigation later in this review
- Prior 7-day total views: 11,309, which included two outsized single-day spikes (July 29-30, combined 4,706 views)
Why This Matters
A near-70% drop in engagement rate alongside relatively stable subscriber growth suggests that reach and depth of interaction may be diverging: more videos are going out, but each one is capturing proportionally less viewer action. This is a pattern worth monitoring rather than a definitive verdict, since it partly reflects analytics-reporting lag on this week’s newest uploads.
Relevance Going Forward
For subscribers using this channel to track Japanese and emerging-market macro releases, none of this changes the substance of the underlying financial analysis, but it does inform which formats and cadences the channel will prioritize going forward.
今週新規ショート動画 成績リスト
Format-Level Retention Patterns
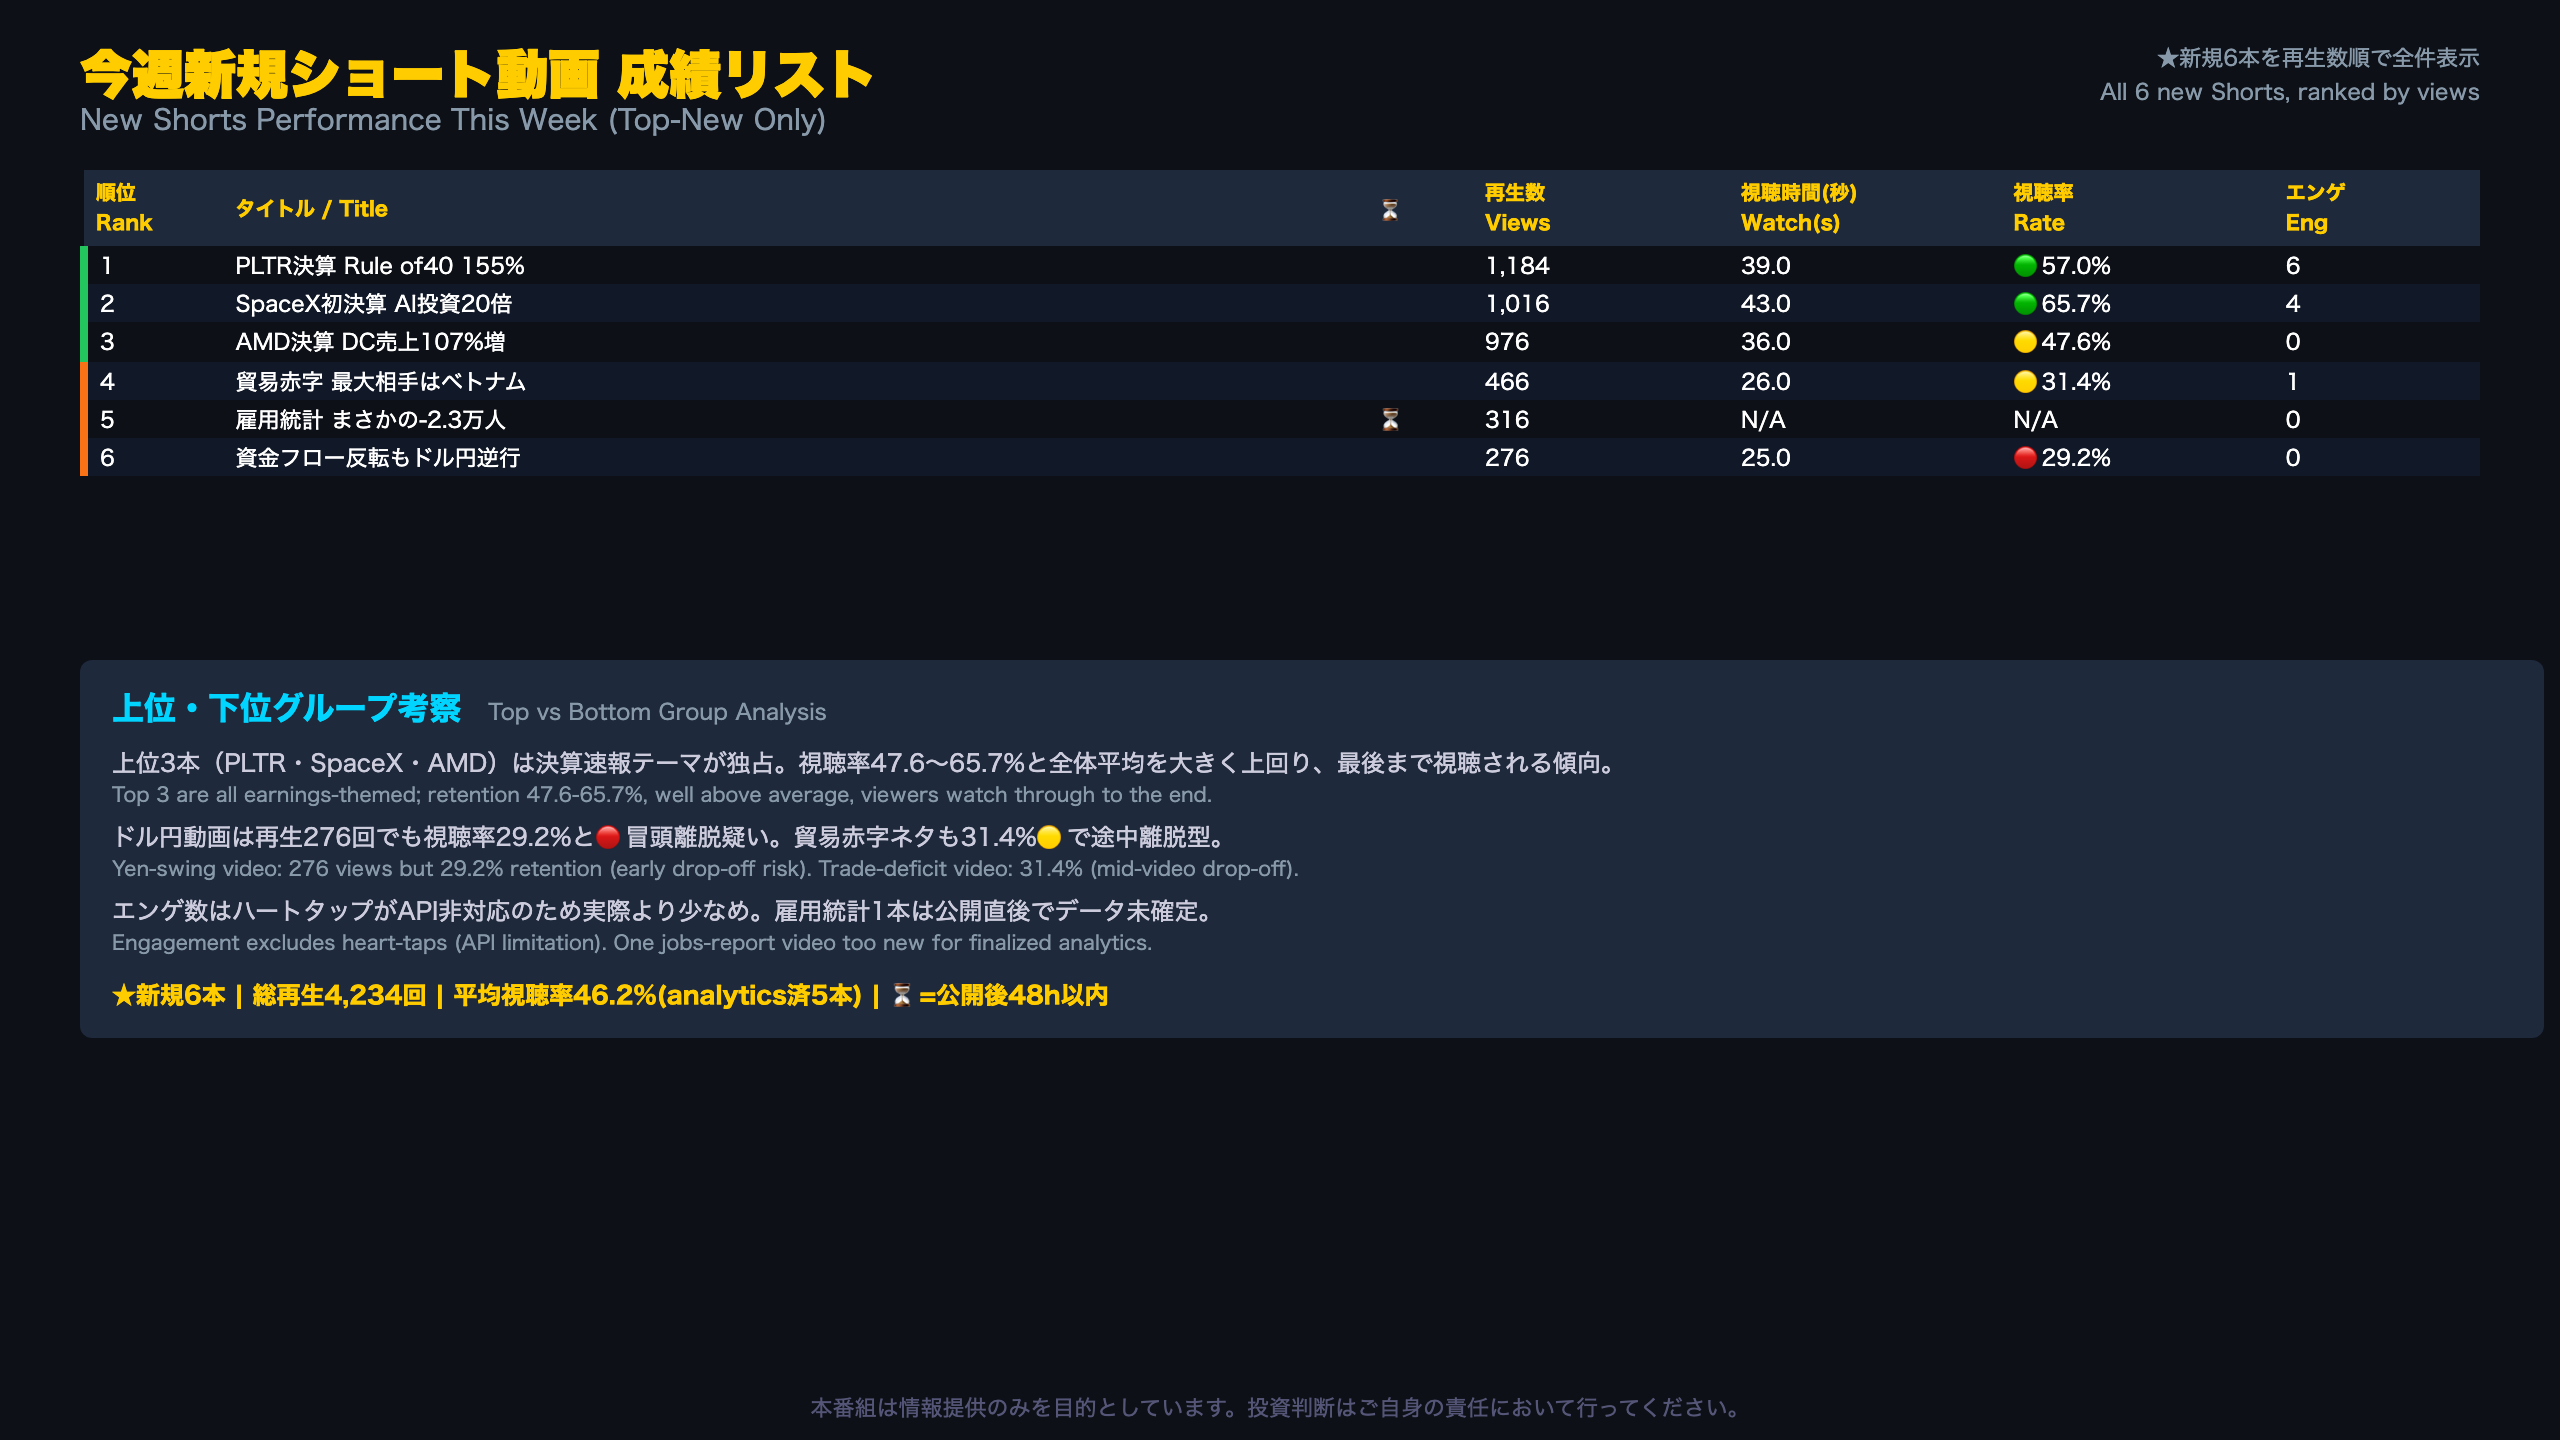
Of the six new Shorts published this week, three earnings-focused videos (Palantir, SpaceX, AMD) captured the top view counts. SpaceX’s video, at just 43 seconds, posted a 65.7% average view rate, meaning viewers watched nearly the entire clip on average.
Context: What ‘View Rate’ Means Here
Average view percentage measures how much of a video’s total duration the average viewer completed. For short-form video under 60 seconds, industry benchmarks generally consider anything above 50% strong retention, making this week’s top performers (57-65.7%) comparably healthy versus platform norms.
Retention Breakdown
- Strong retention (>60%): 2 videos, led by SpaceX (65.7%)
- Moderate (30-60%): 3 videos, Palantir (57.0%), AMD (47.6%), trade-deficit video (31.4%)
- Weak (<30%): 1 video, the yen-swing Short (29.2%)
The yen-swing video is a useful case study: it drew a respectable 276 views but the lowest retention rate of the week. One plausible interpretation is that the thumbnail and hook generated clicks, but the body of the video failed to sustain interest, though with only a single data point this remains a hypothesis rather than a confirmed pattern.
Looking Ahead
As Q2 earnings season winds down, next week’s data will show whether earnings-themed Shorts can maintain this retention advantage once fresh earnings catalysts become scarcer, a natural stress test for the format.
今週新規長尺動画 成績リスト
Watch-Time Signals Beyond Raw View Counts
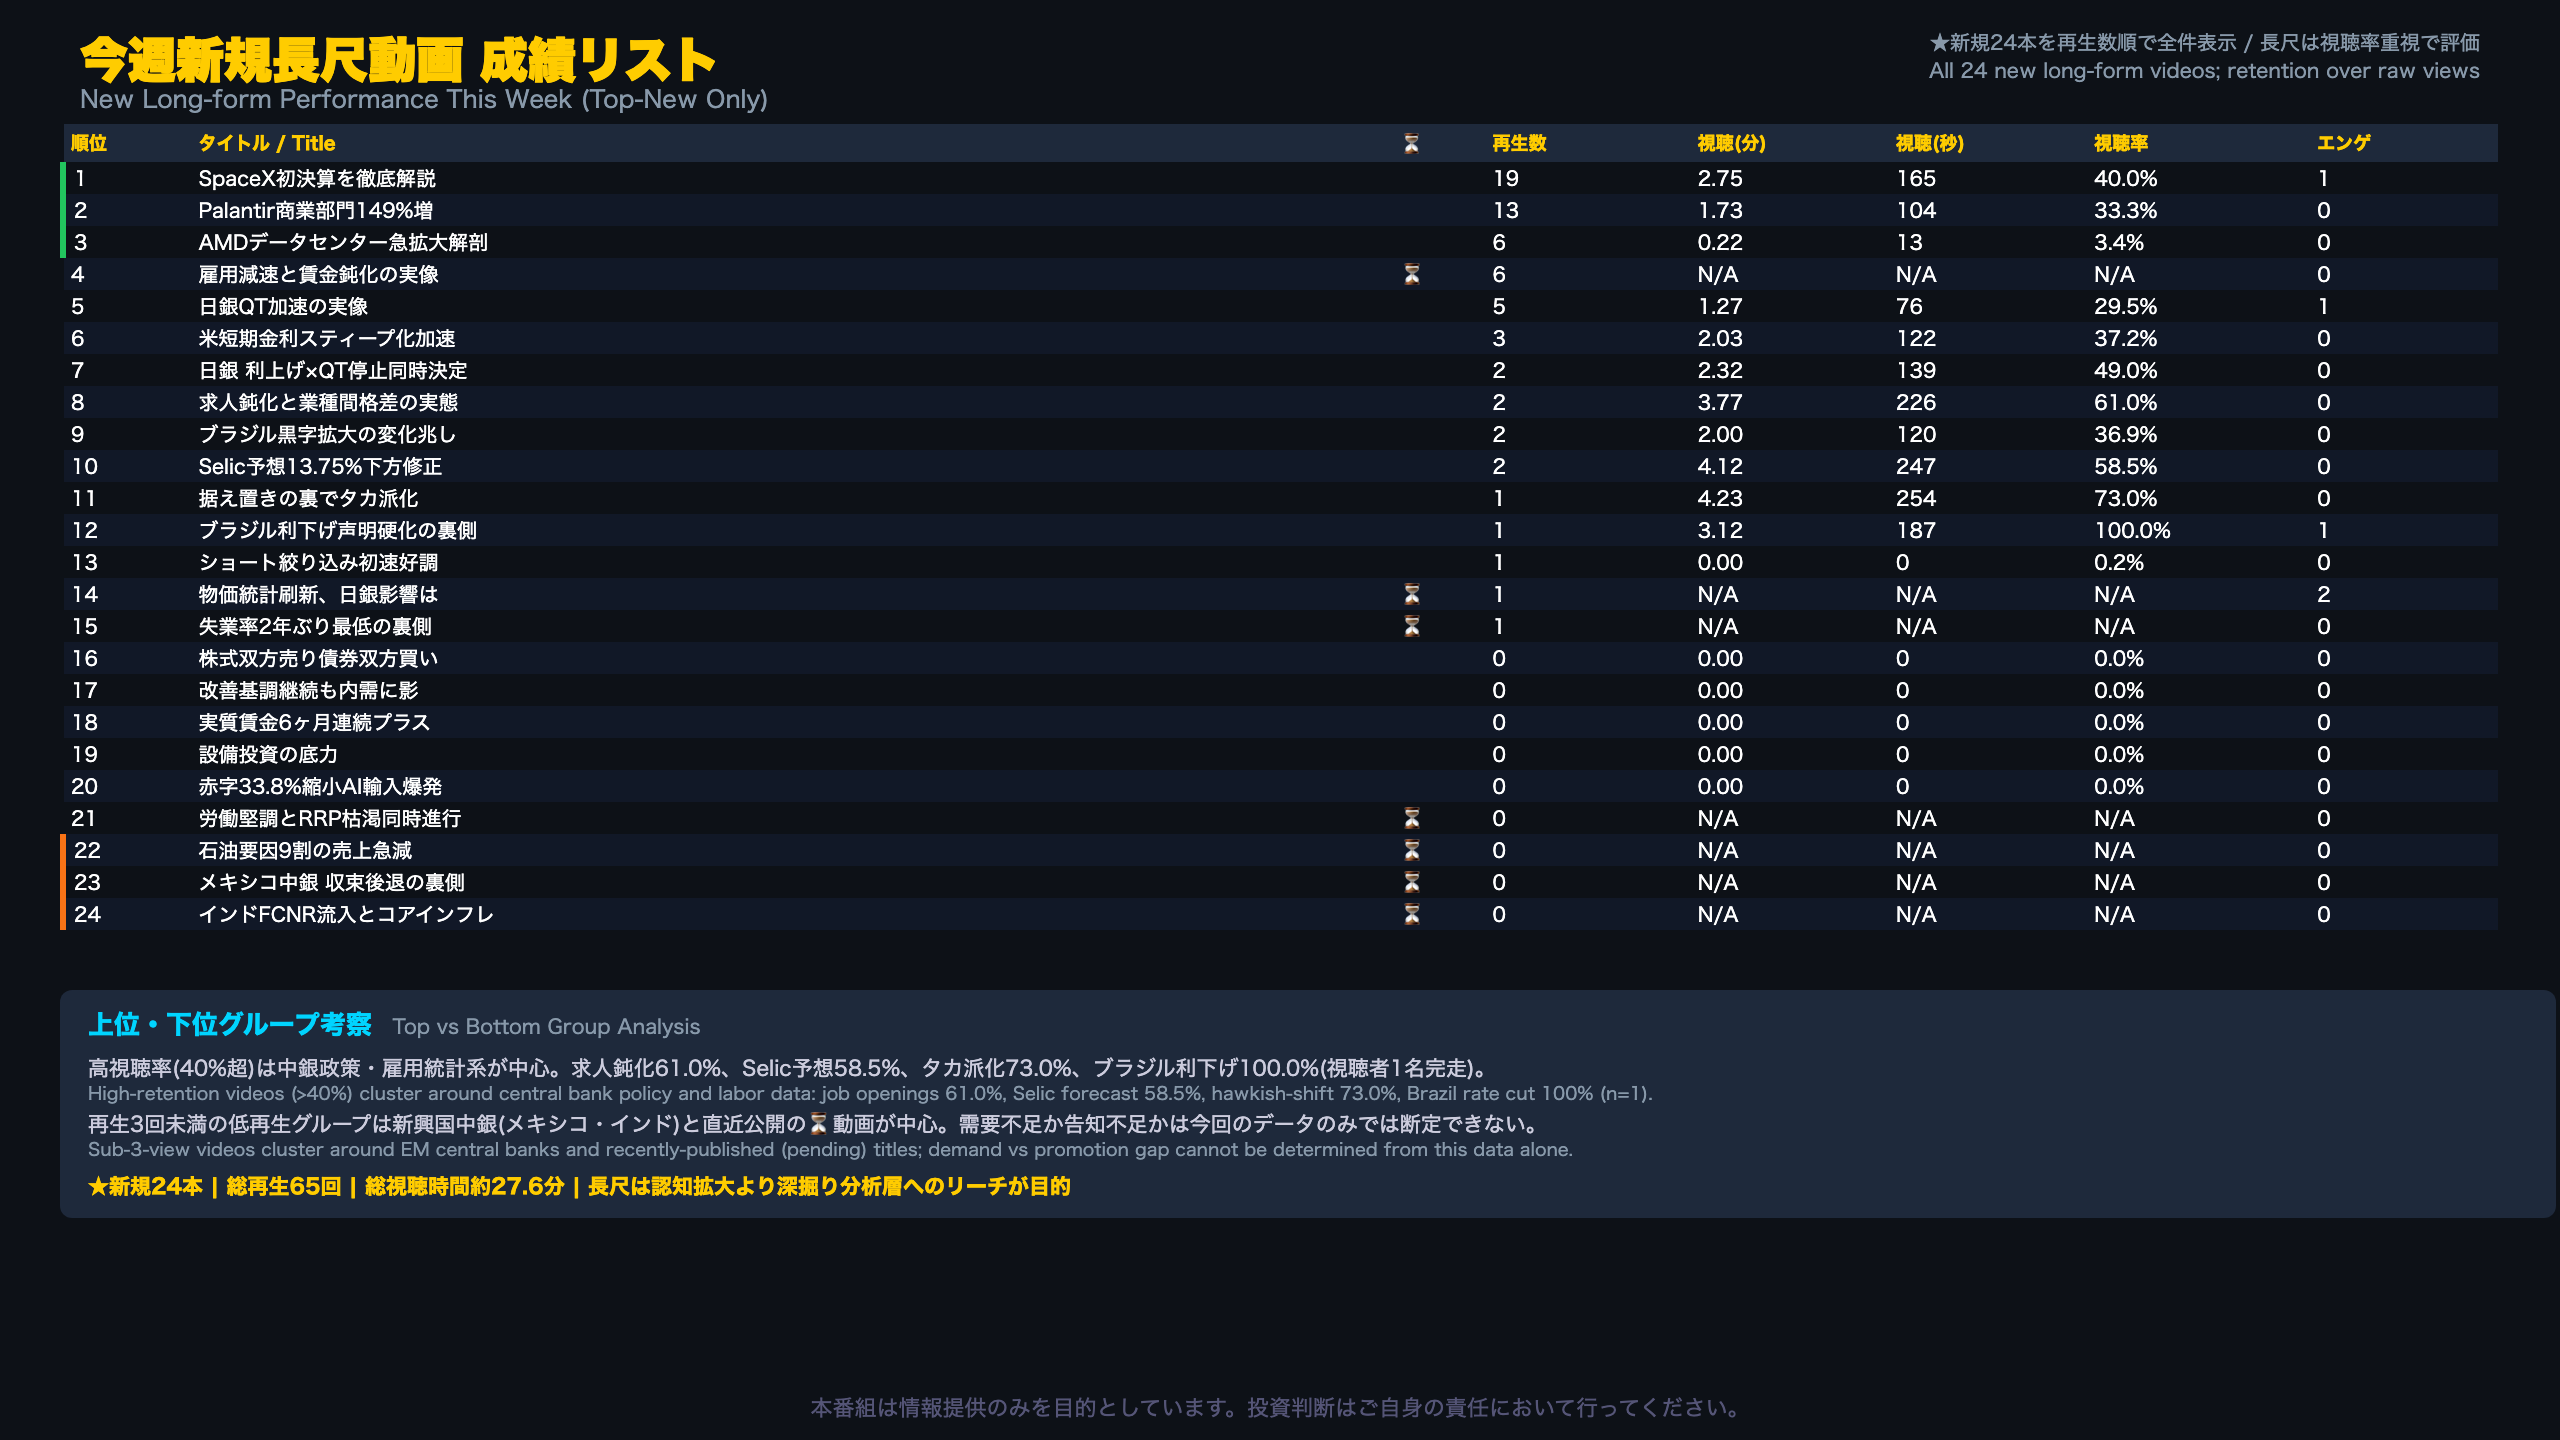
Looking at total watch time rather than view count reveals a different ranking. The Brazil Selic-forecast episode (4.12 min), the BOJ hawkish-shift episode (4.23 min), and the Brazil central bank rate-cut episode (3.12 min, 100% view rate) lead the pack. That last video had only a single recorded view, but that one viewer watched the entire clip, a small but telling signal of content quality (statistically limited given n=1).
Context: Why Long-Form Differs From Shorts
NFC’s long-form videos are explainer-style ‘Deep Dive’ segments analyzing specific data releases (e.g., U.S. jobs reports, BOJ minutes, Brazil’s COPOM statement), comparable to how sell-side research shops publish both flash notes and full analyst reports. Unlike Shorts, these are aimed at investors who want the full analytical context.
The Zero-View Cluster
Eight long-form videos recorded zero views this week. Six are flagged with analytics-lag, published August 5-7, too recent for confirmed data. The remaining two, a U.S. capex video and a trade-deficit video, have had more time to accumulate views but haven’t. It’s not possible to determine from this data alone whether this reflects low demand for emerging-market central bank content specifically, or simply a promotion and discovery gap.
What to Watch Next Week
Once analytics for the flagged videos finalize, the team should re-examine the first 48-hour growth curve to see whether these titles simply needed more time.
28日間チャンネル成長トレンド
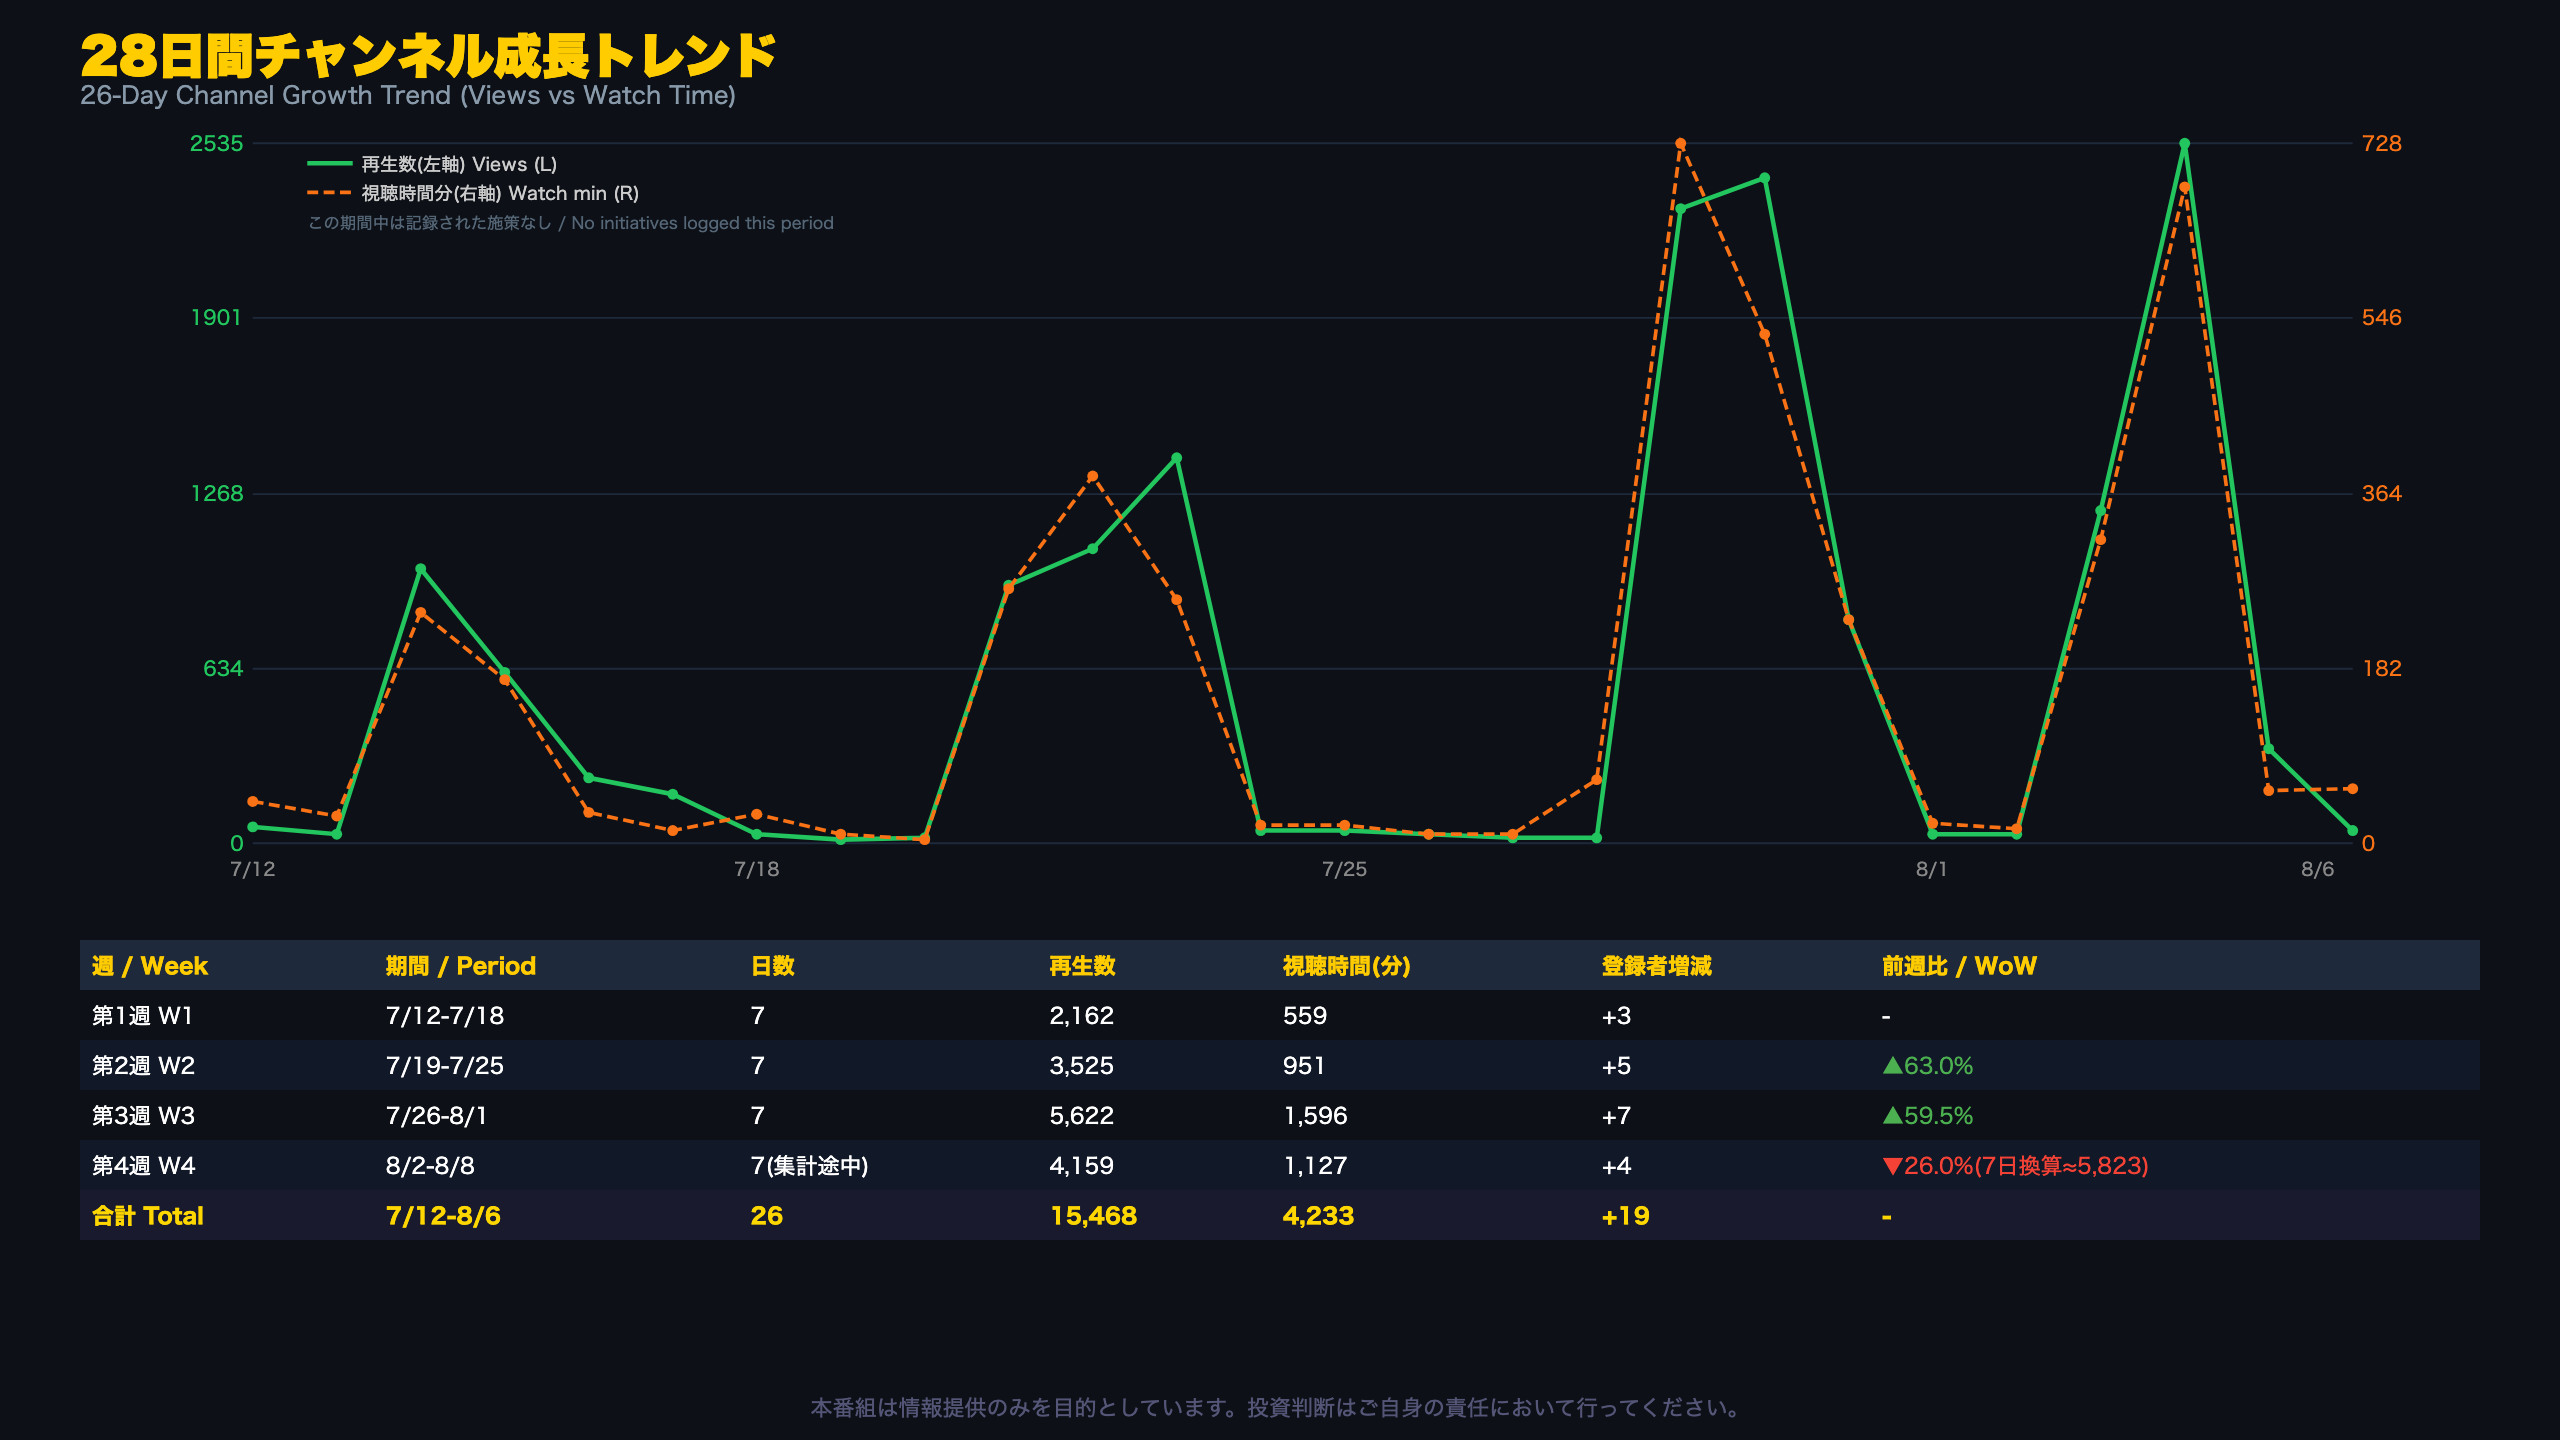
A Rare Clean Baseline Period
Because no marketing or programming initiatives were logged during this 26-day window, this period offers an unusually clean look at views driven purely by content mix and publish-day timing, without the noise of promotional campaigns.
Weekly Trend Table
| Week | Period | Views | Watch Time (min) | Subscriber Change |
|---|---|---|---|---|
| Week 1 | Jul 12-18 | 2,162 | 559 | +3 |
| Week 2 | Jul 19-25 | 3,525 | 951 | +5 |
| Week 3 | Jul 26-Aug 1 | 5,622 | 1,596 | +7 |
| Week 4 | Aug 2-8 | 4,159 (partial) | 1,127 | +4 |
On a confirmed-data basis, Week 4 views dropped 26.0% from Week 3. But Week 4’s data only runs through August 6; extrapolated to a full seven days, it comes out to roughly 5,823 views, nearly matching Week 3. Whether growth genuinely decelerated, therefore, can’t be confirmed until next week’s finalized numbers arrive.
A Notable Divergence: August 3
On August 3, the channel logged 1,204 views but only 316 minutes of total watch time, about 15.7 seconds per view, below the ratio seen on August 4 (roughly 16.2 seconds per view). This hints that that day’s content may have faced above-average early drop-off, though a single day’s data isn’t enough to draw firm conclusions.
For International Readers
For channels covering niche financial and macro content, high day-to-day view volatility tied to publish cadence rather than smooth organic growth curves is a common pattern, and this channel’s data is broadly consistent with that norm.
今週の番組制作コスト分析
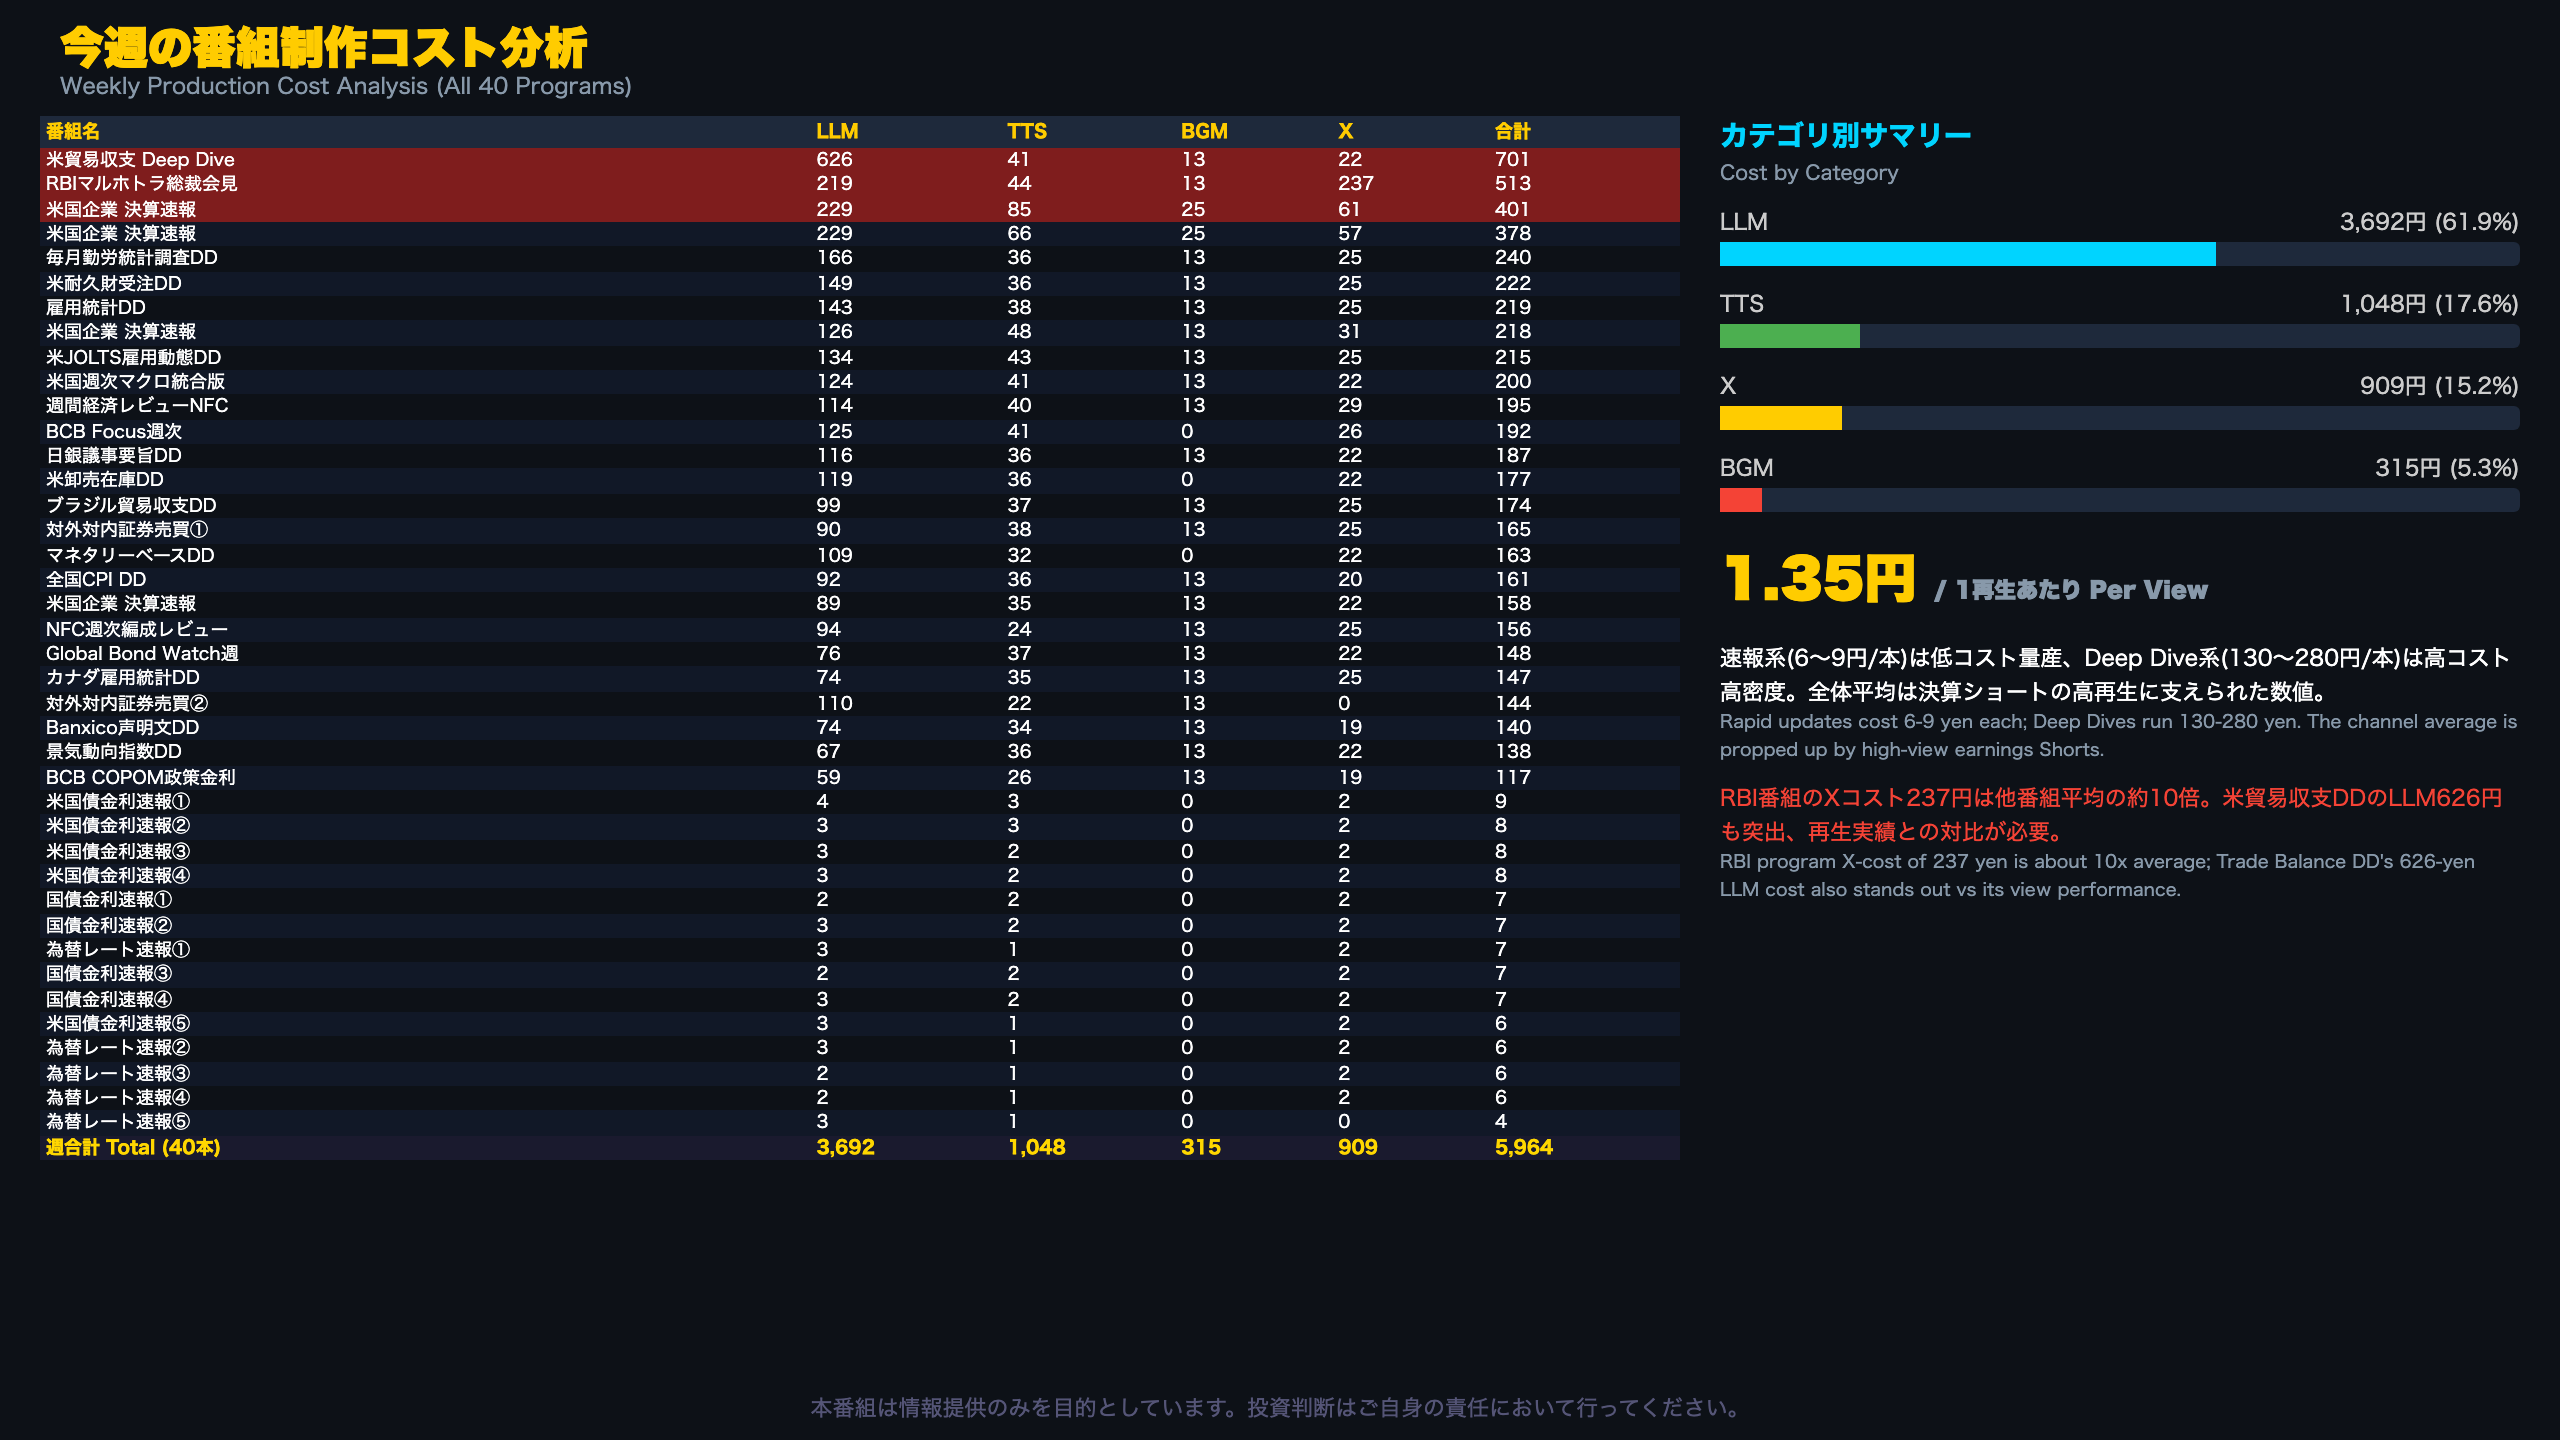
Cost Breakdown and Where the Outliers Are
Weekly production spend totaled 5,964 yen, split across LLM generation (3,692 yen, 61.9%), text-to-speech (1,048 yen, 17.6%), social posting on X (909 yen, 15.2%), and background music (315 yen, 5.3%). The LLM share dominates because Deep Dive-style explainer episodes require longer, more complex analytical scripts than rapid-fire updates.
Two Standout Outliers
- U.S. Trade Balance Deep Dive (701 yen): LLM costs alone were 626 yen, 6.8x the average program’s LLM spend of roughly 92 yen. This warrants comparison against actual view performance, since the corresponding long-form video appears to have generated limited traction this week.
- RBI Governor Malhotra Press Conference (513 yen): Social posting costs hit 237 yen, roughly 10x the typical program’s spend of 20-30 yen. This is worth investigating; it could reflect a configuration error such as duplicate posts or oversized media generation, rather than intentional spend.
Context: What Is ‘The Deep Dive’ Format?
NFC’s ‘Deep Dive’ franchise refers to longer-form explainer episodes analyzing specific data releases, such as U.S. jobs reports, BOJ minutes, or Brazil’s COPOM statement, comparable to how sell-side research shops publish both flash notes and full analyst reports. Rapid-fire updates (e.g., ‘US Treasury Yield Flash’) are the flash-note equivalent: cheap at 6-9 yen each and high-frequency.
Efficiency Read
The channel-wide cost-per-view of 1.35 yen looks efficient, but this average is likely skewed downward by high-view earnings Shorts. The true cost-per-view for standalone Deep Dive long-form episodes is almost certainly much higher, given several posted zero or single-digit views this week.
来週の番組制作方針
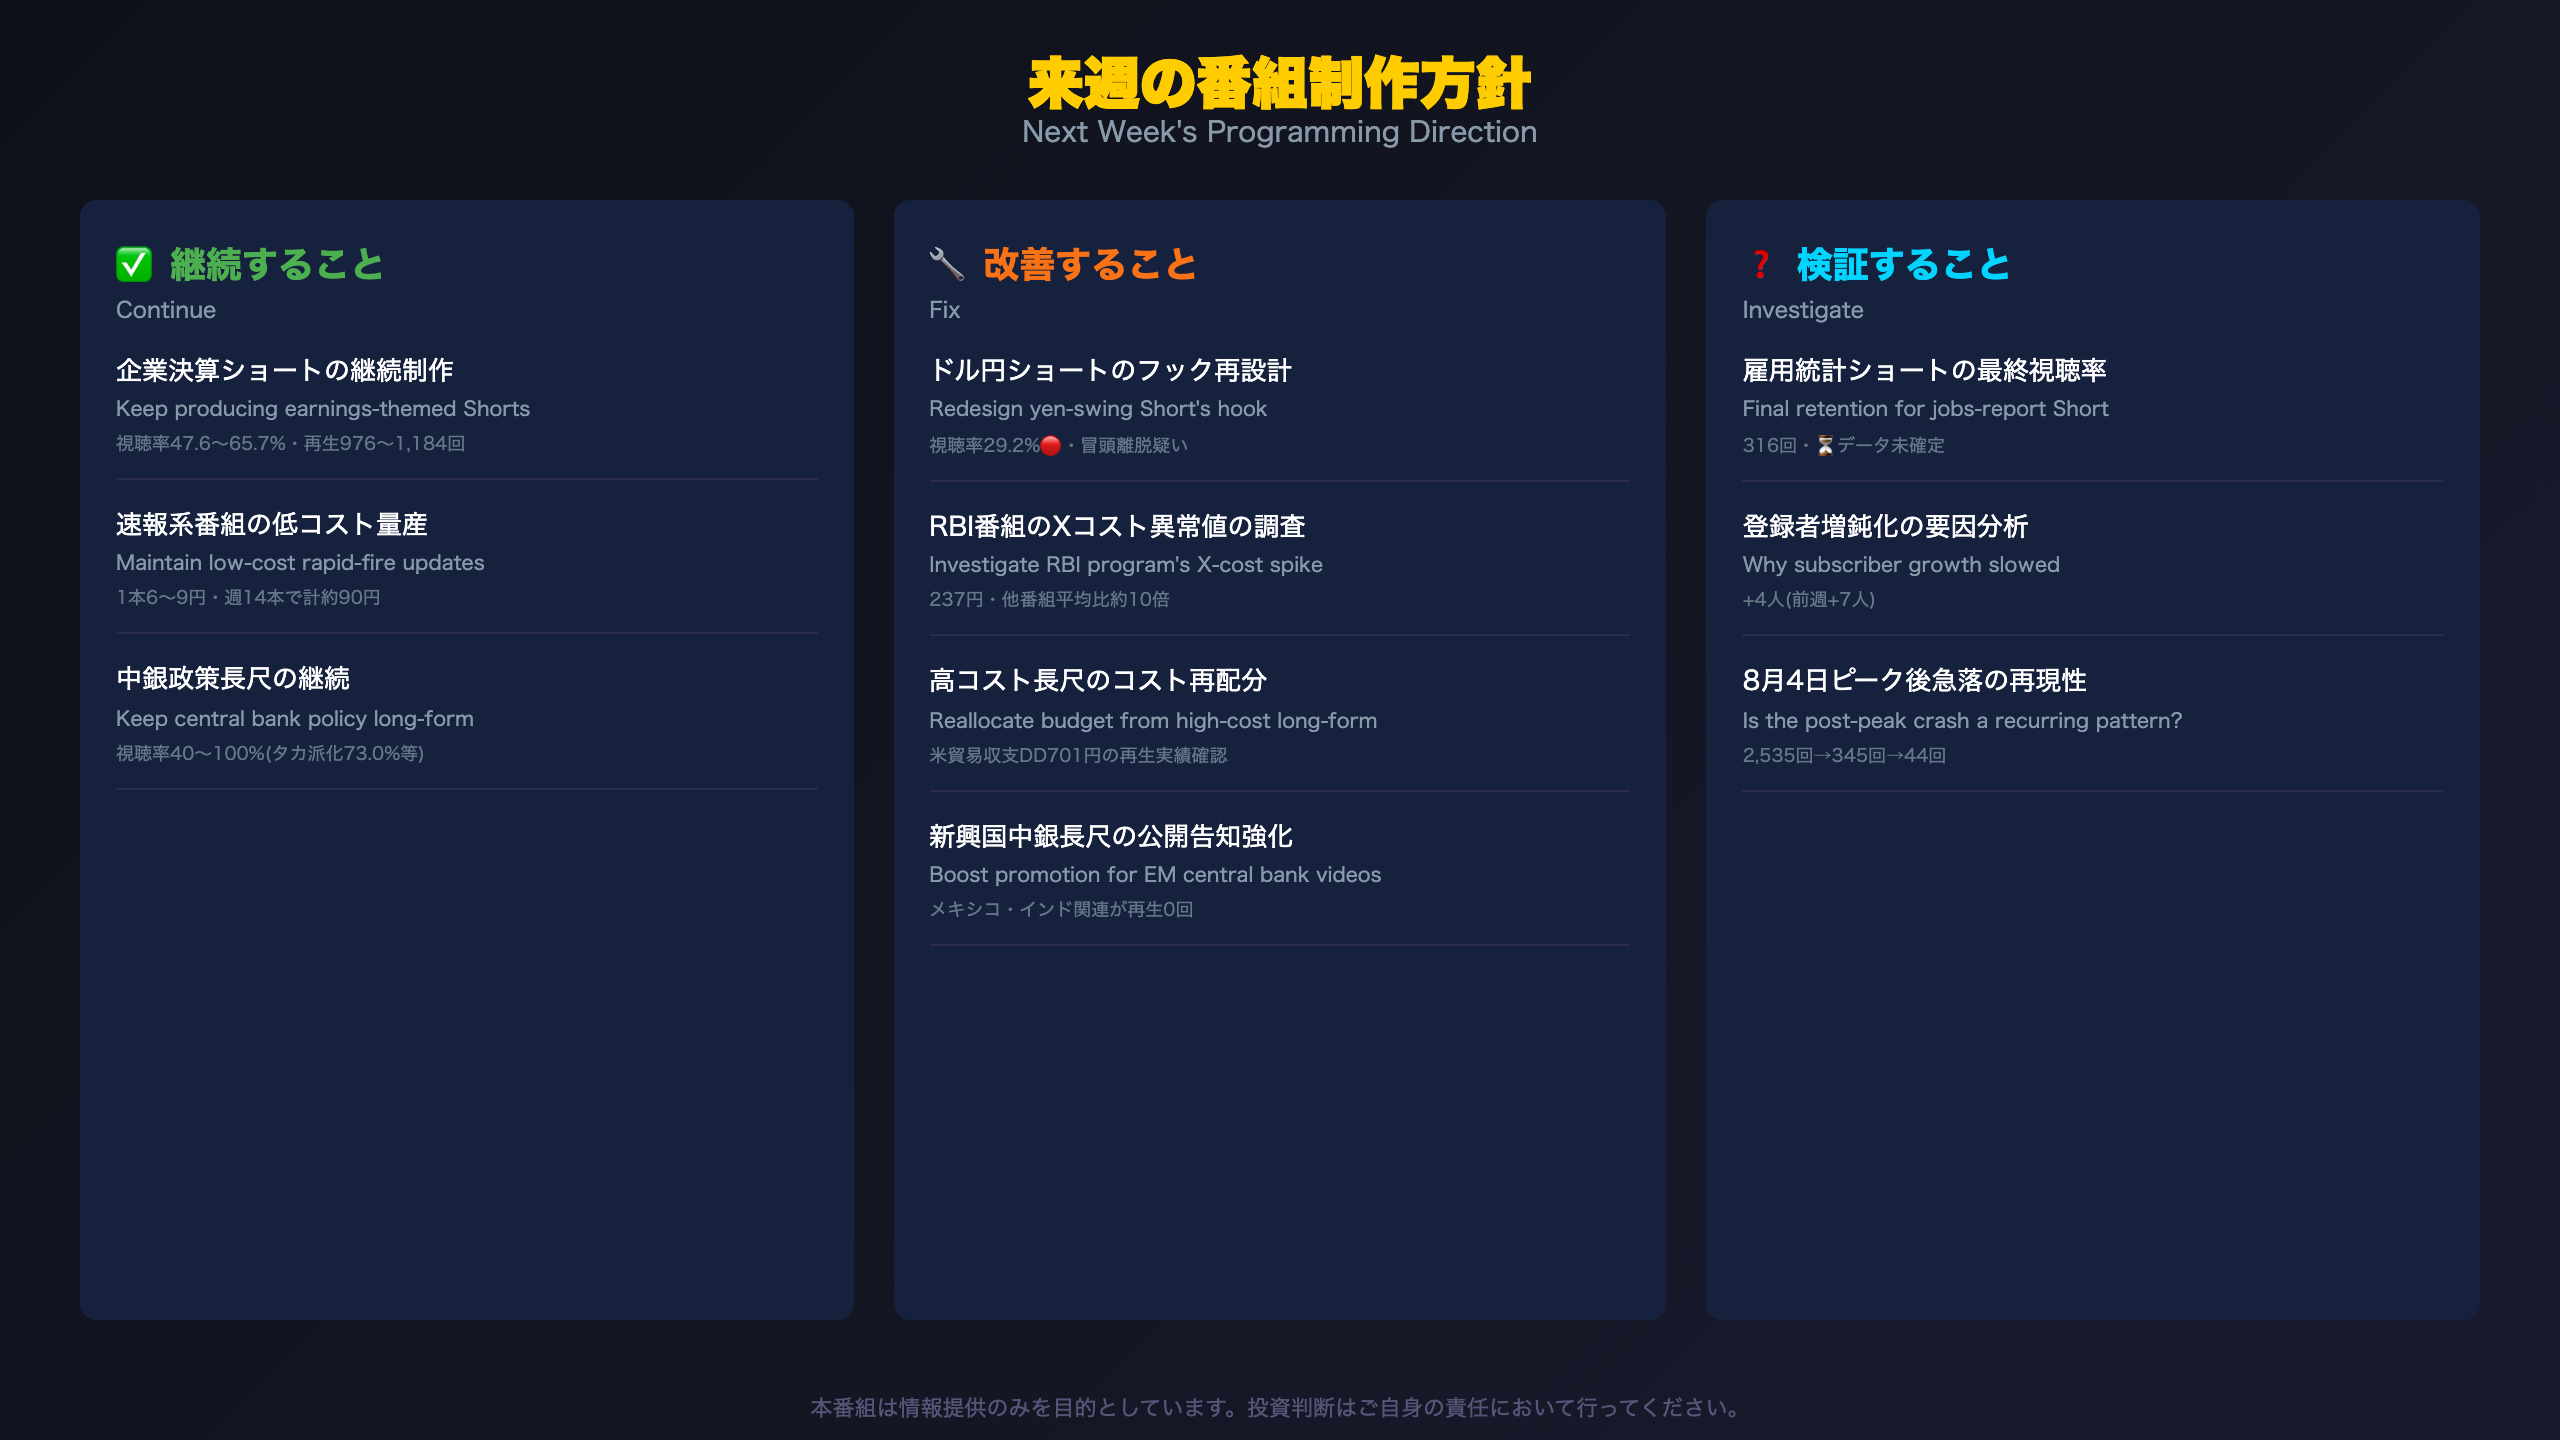
Detailed Action Plan for Next Week
Based on this week’s findings, three tracks will guide next week’s programming review.
Continue (with supporting evidence)
- Earnings-themed Shorts (47.6-65.7% view rate, 976-1,184 views)
- Low-cost rapid-fire updates (6-9 yen each, roughly 90 yen total across 14 videos)
- Central-bank policy long-form episodes (40-100% view rate)
Fix (actionable items)
- Redesign the hook for the yen-swing Short (29.2% view rate, flagged as early drop-off)
- Investigate the RBI program’s 237-yen social-posting cost, roughly 10x the typical program average
- Cross-check the U.S. Trade Balance Deep Dive’s 701-yen cost against its actual view performance and reallocate budget if warranted
- Improve publish timing and promotion for emerging-market central bank long-form content (Mexico, India), where several videos recorded zero views
Investigate (open questions)
- Final view rate for the U.S. jobs report Short, currently showing 316 views but unconfirmed analytics
- The drivers behind slower subscriber growth (plus 4 this week versus plus 7 the prior week)
- Whether the August 4 peak of 2,535 views, followed by 345 and then 44 views, is a one-off or a recurring cadence effect
Since this is the channel’s first documented weekly review, effect-tracking for these action items will build cumulatively starting with next week’s report.
Disclaimer: This article is for informational purposes only. All investment decisions are made solely at your own risk.