📺 Watch the Full Video Analysis
This article was automatically generated by the NFC Market Live AI analysis system. (Updated: 2026-09-25 17:40 JST)
📊 Deep dive into the ECB’s August 2026 monetary statistics.
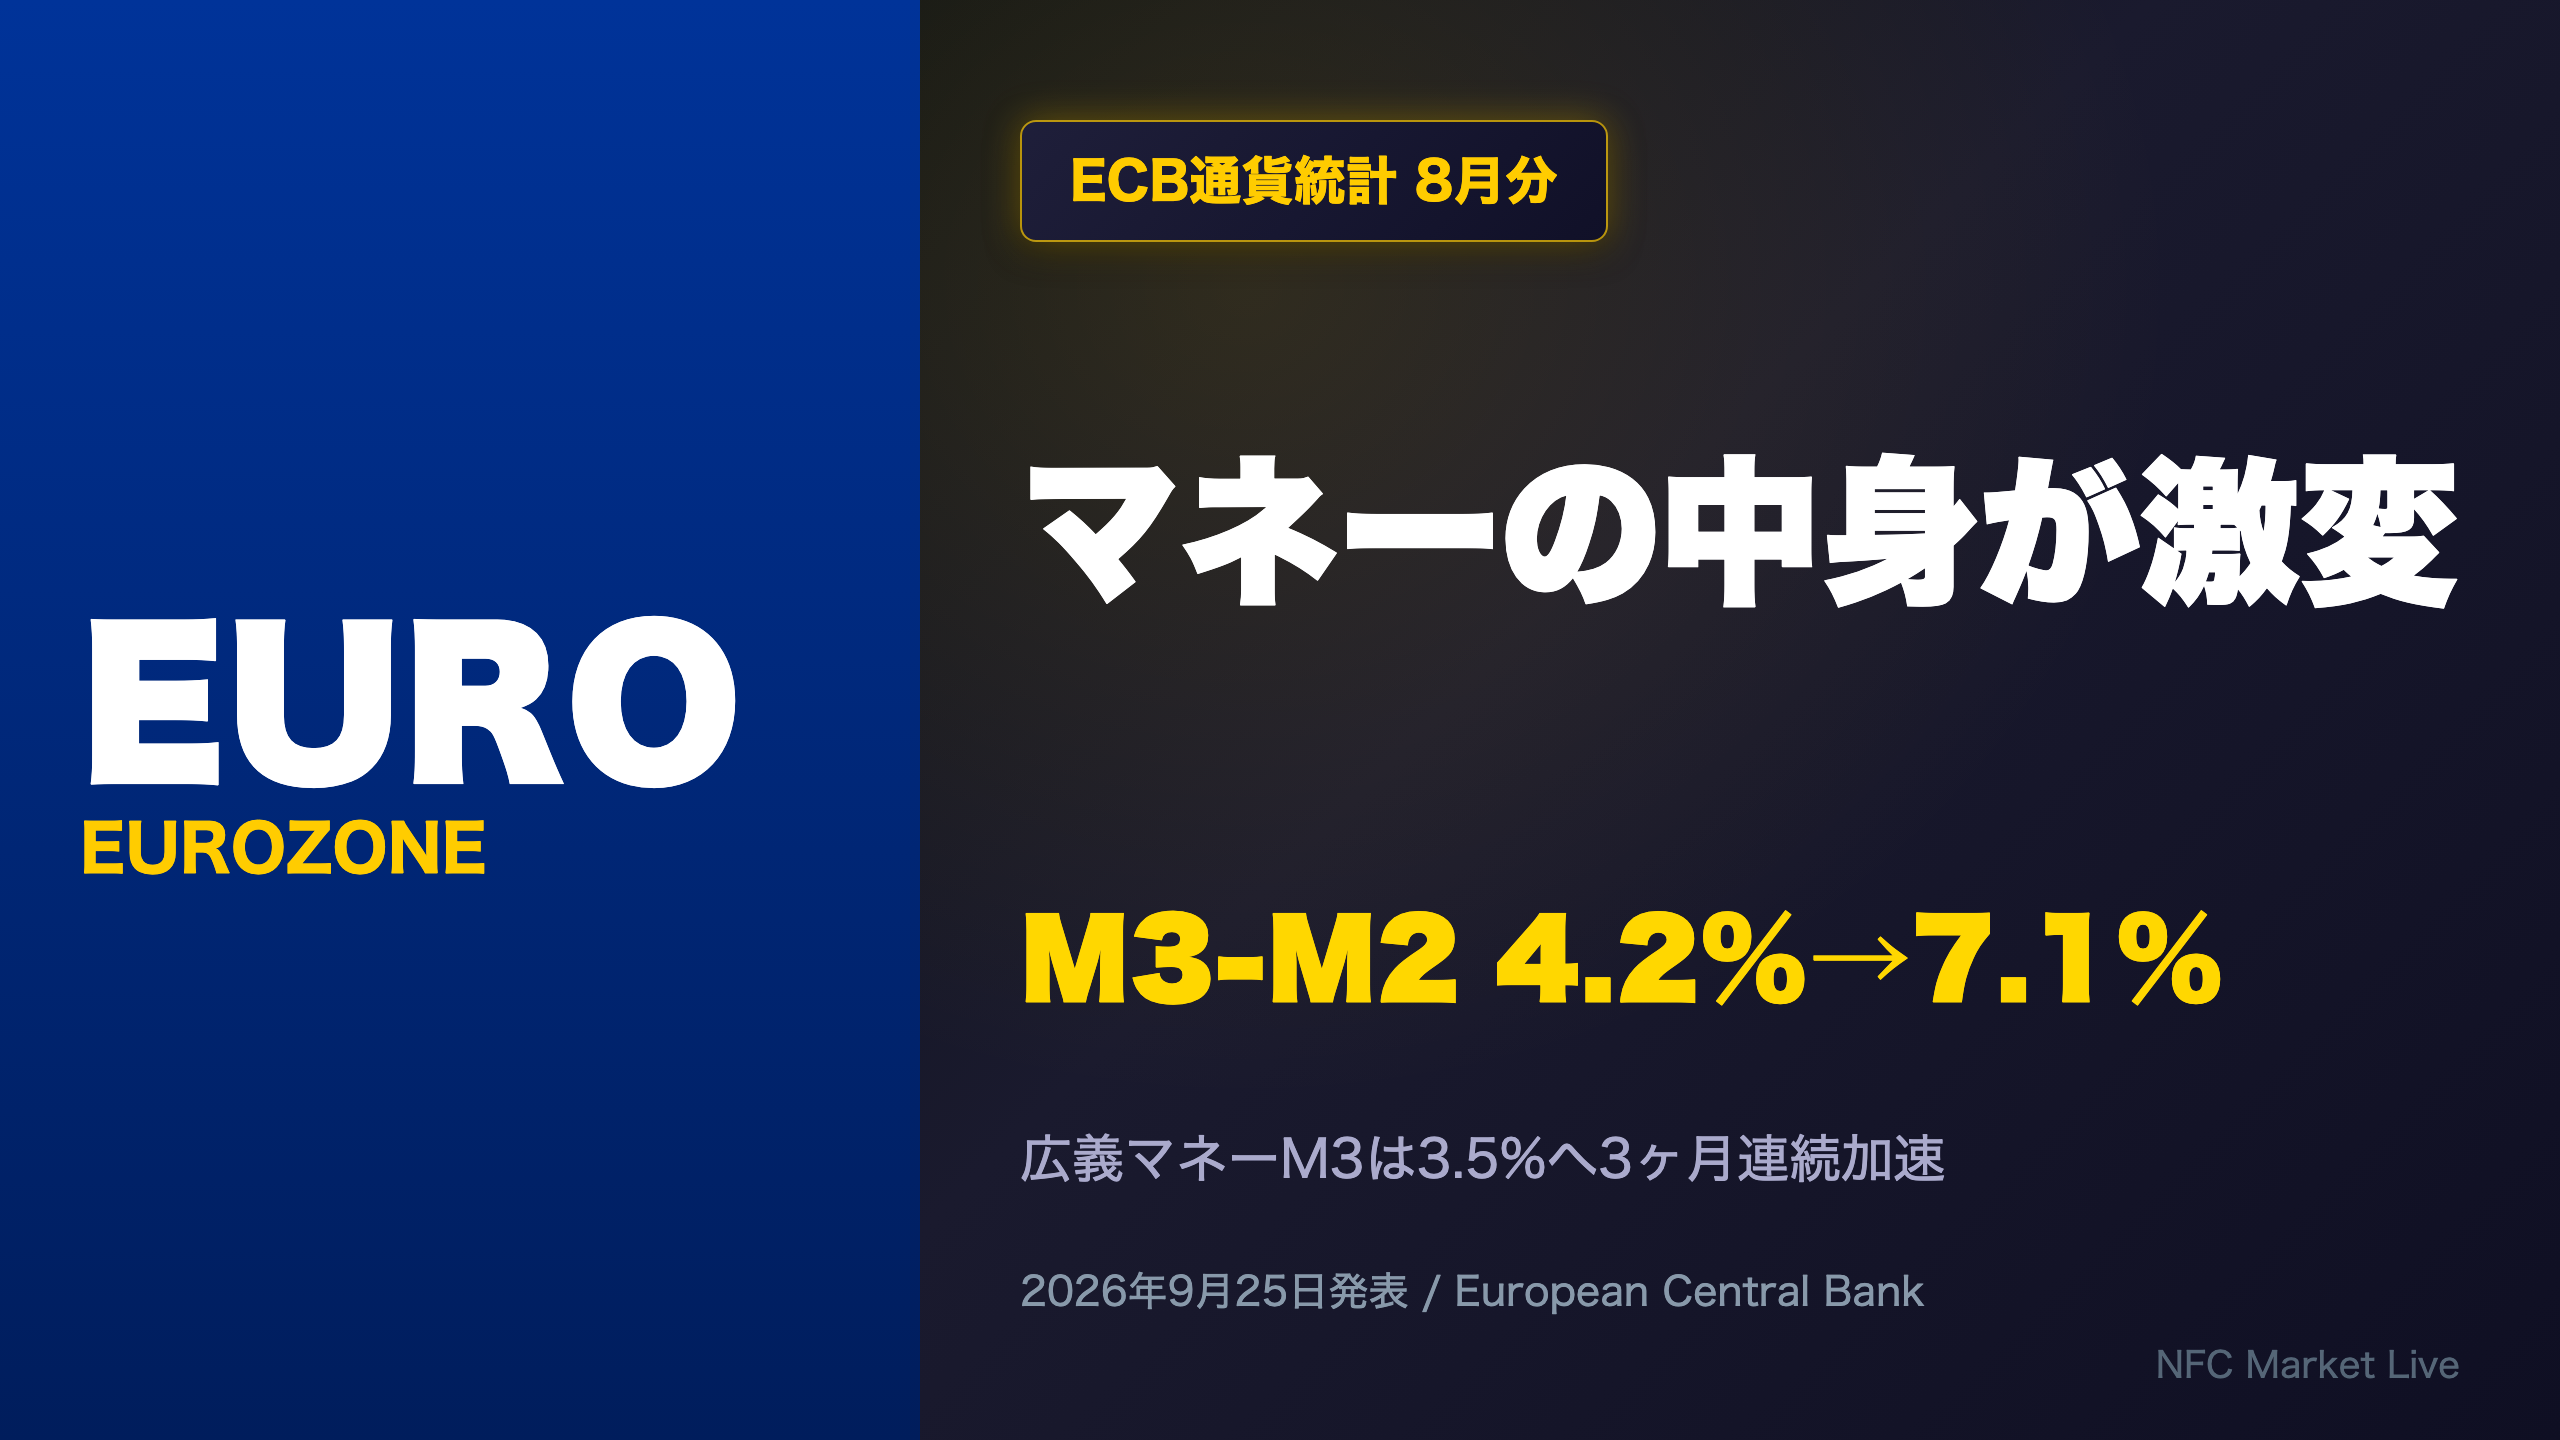
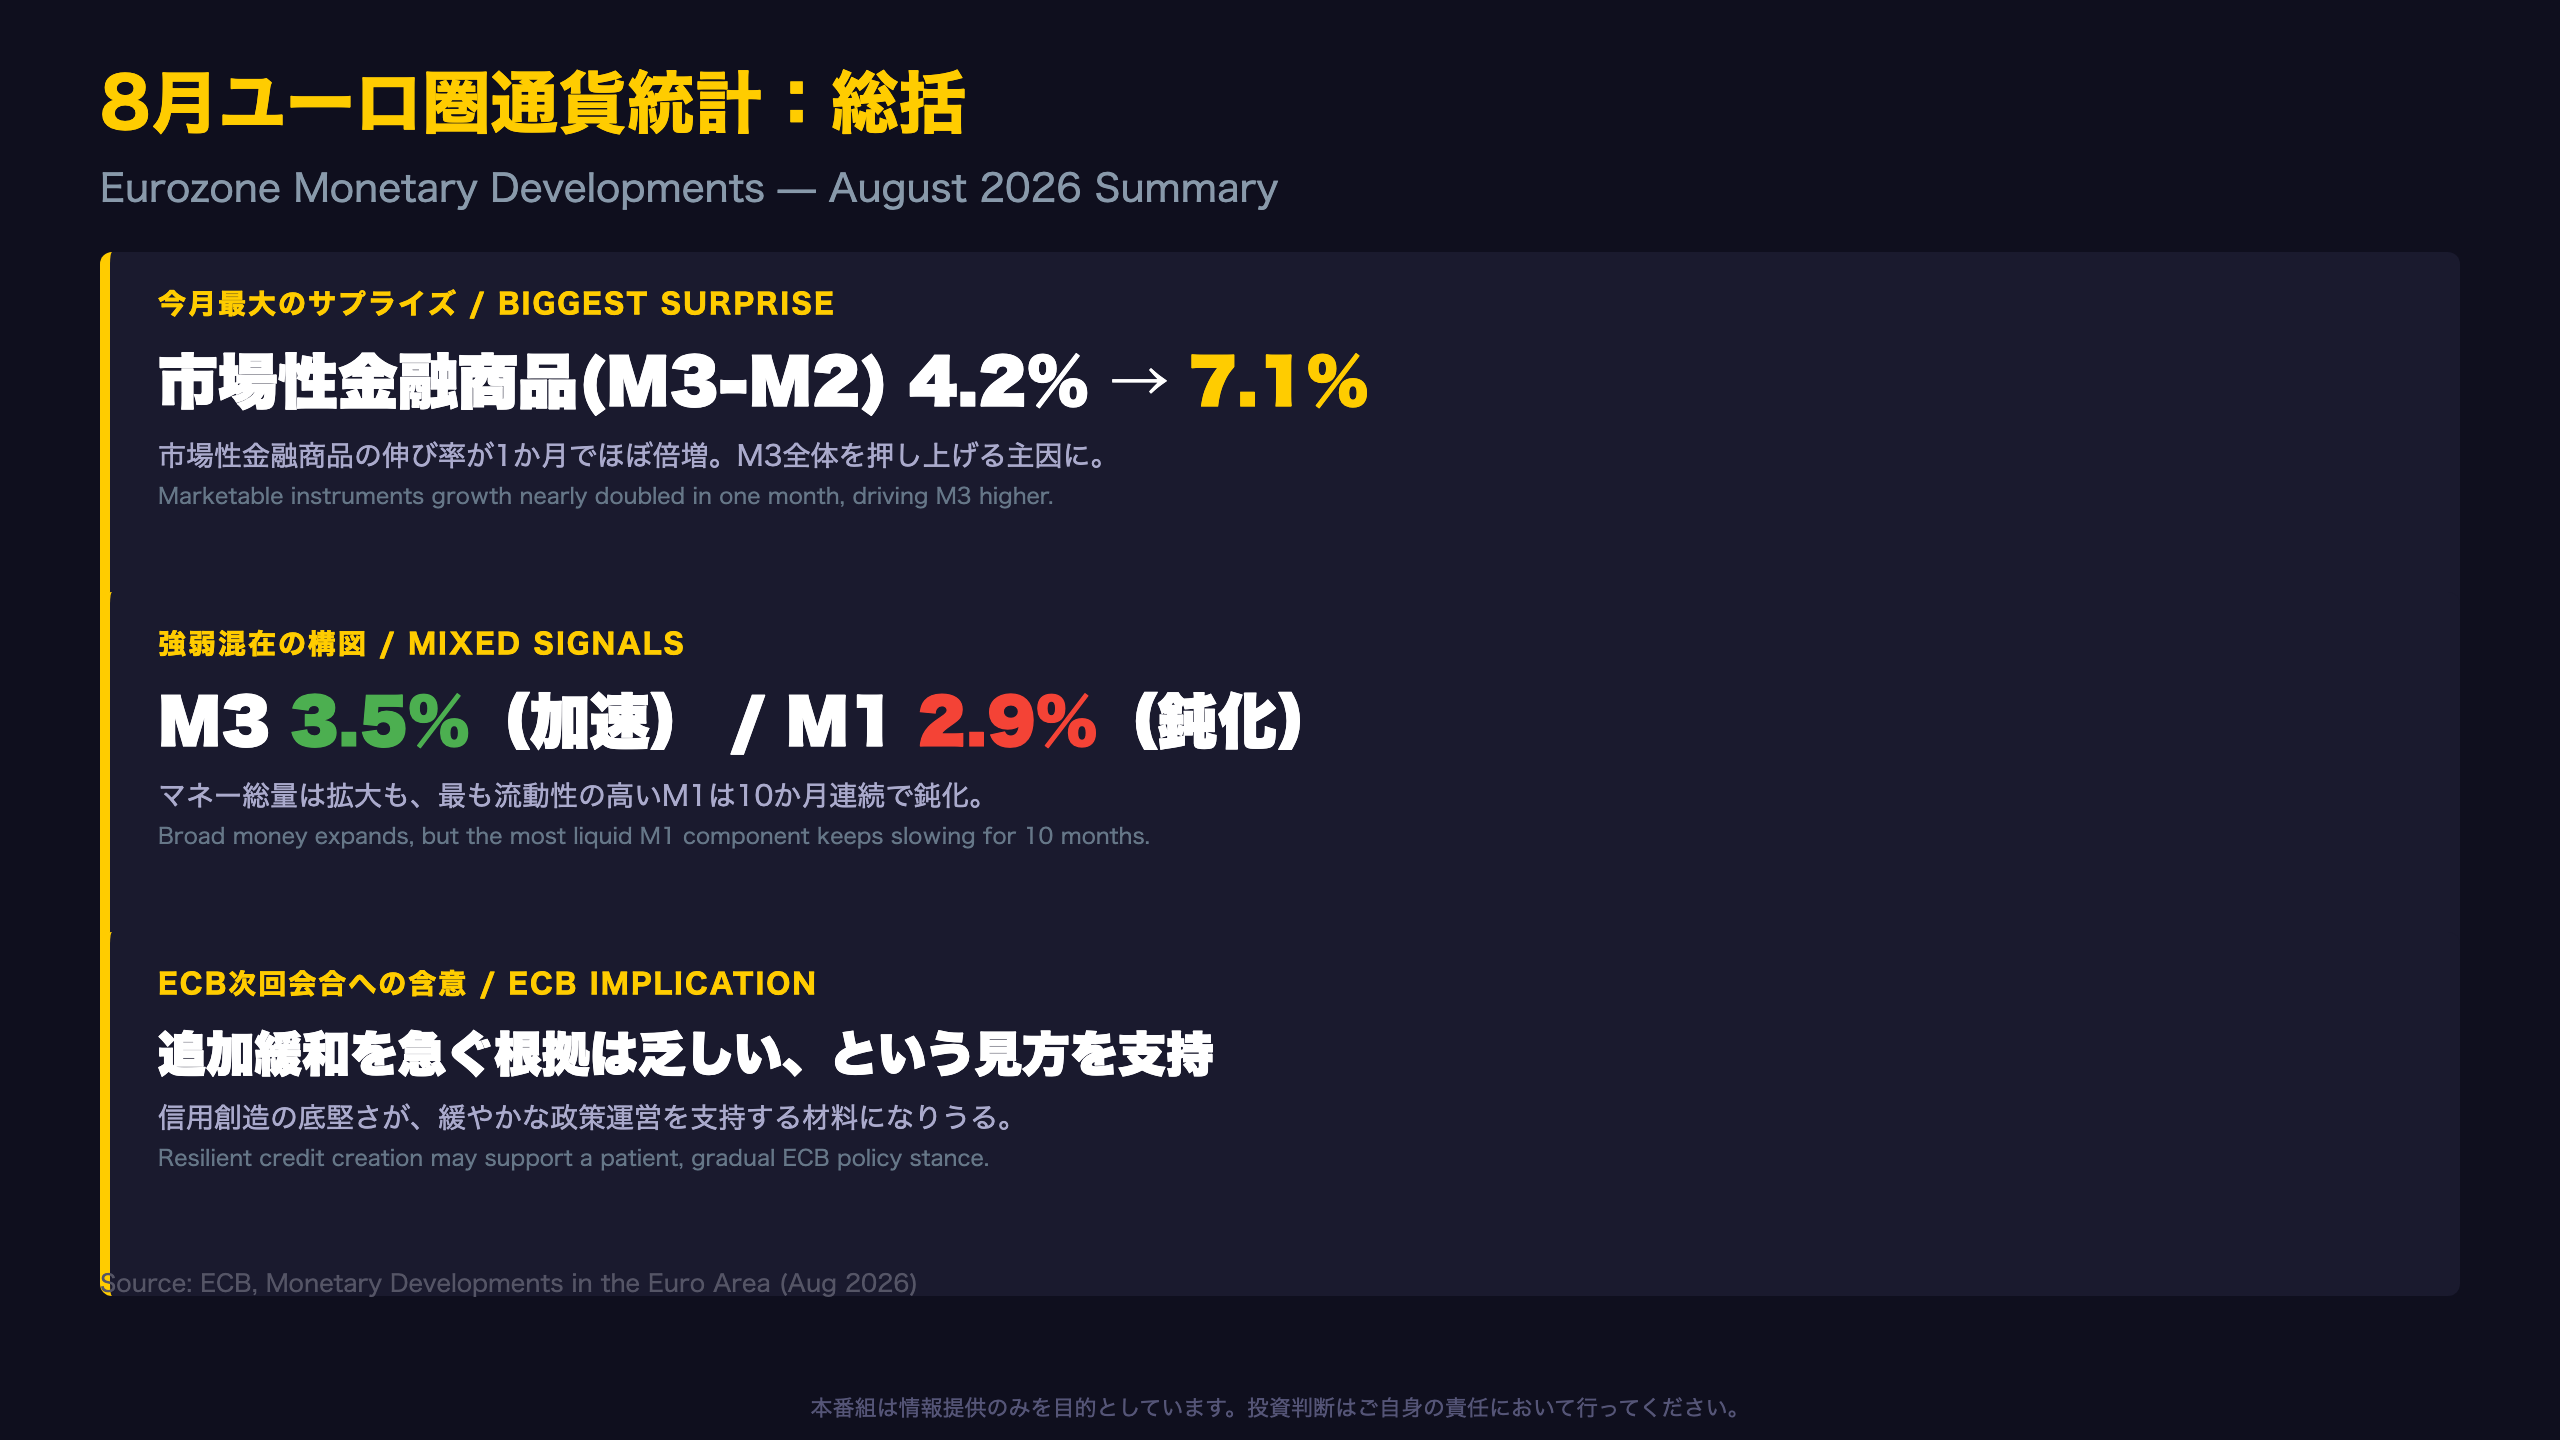
Broad money M3 accelerated to 3.5% YoY for a third straight month, while marketable instruments (M3-M2) surged from 4.2% to 7.1%.
📈 Meanwhile M1 (cash & overnight deposits) kept slowing, down to 2.9%.
💡 Private sector credit accelerated to 4.3%, showing resilient credit creation, even as corporate loan growth eased slightly.
⚠️ We break down what the BOJ-ECB policy divergence means for EUR/JPY holders.
M3加速の裏で進む資金シフト
Understanding the ECB’s M3 “Reference Value”
For readers unfamiliar with eurozone monetary plumbing: M3 is the broadest money supply measure tracked by the ECB, roughly comparable to (though not identical to) the US Fed’s M2. Since 1998 the ECB has informally referenced a 4.5% annual M3 growth rate as consistent with price stability — no longer a formal policy pillar, but still widely watched.
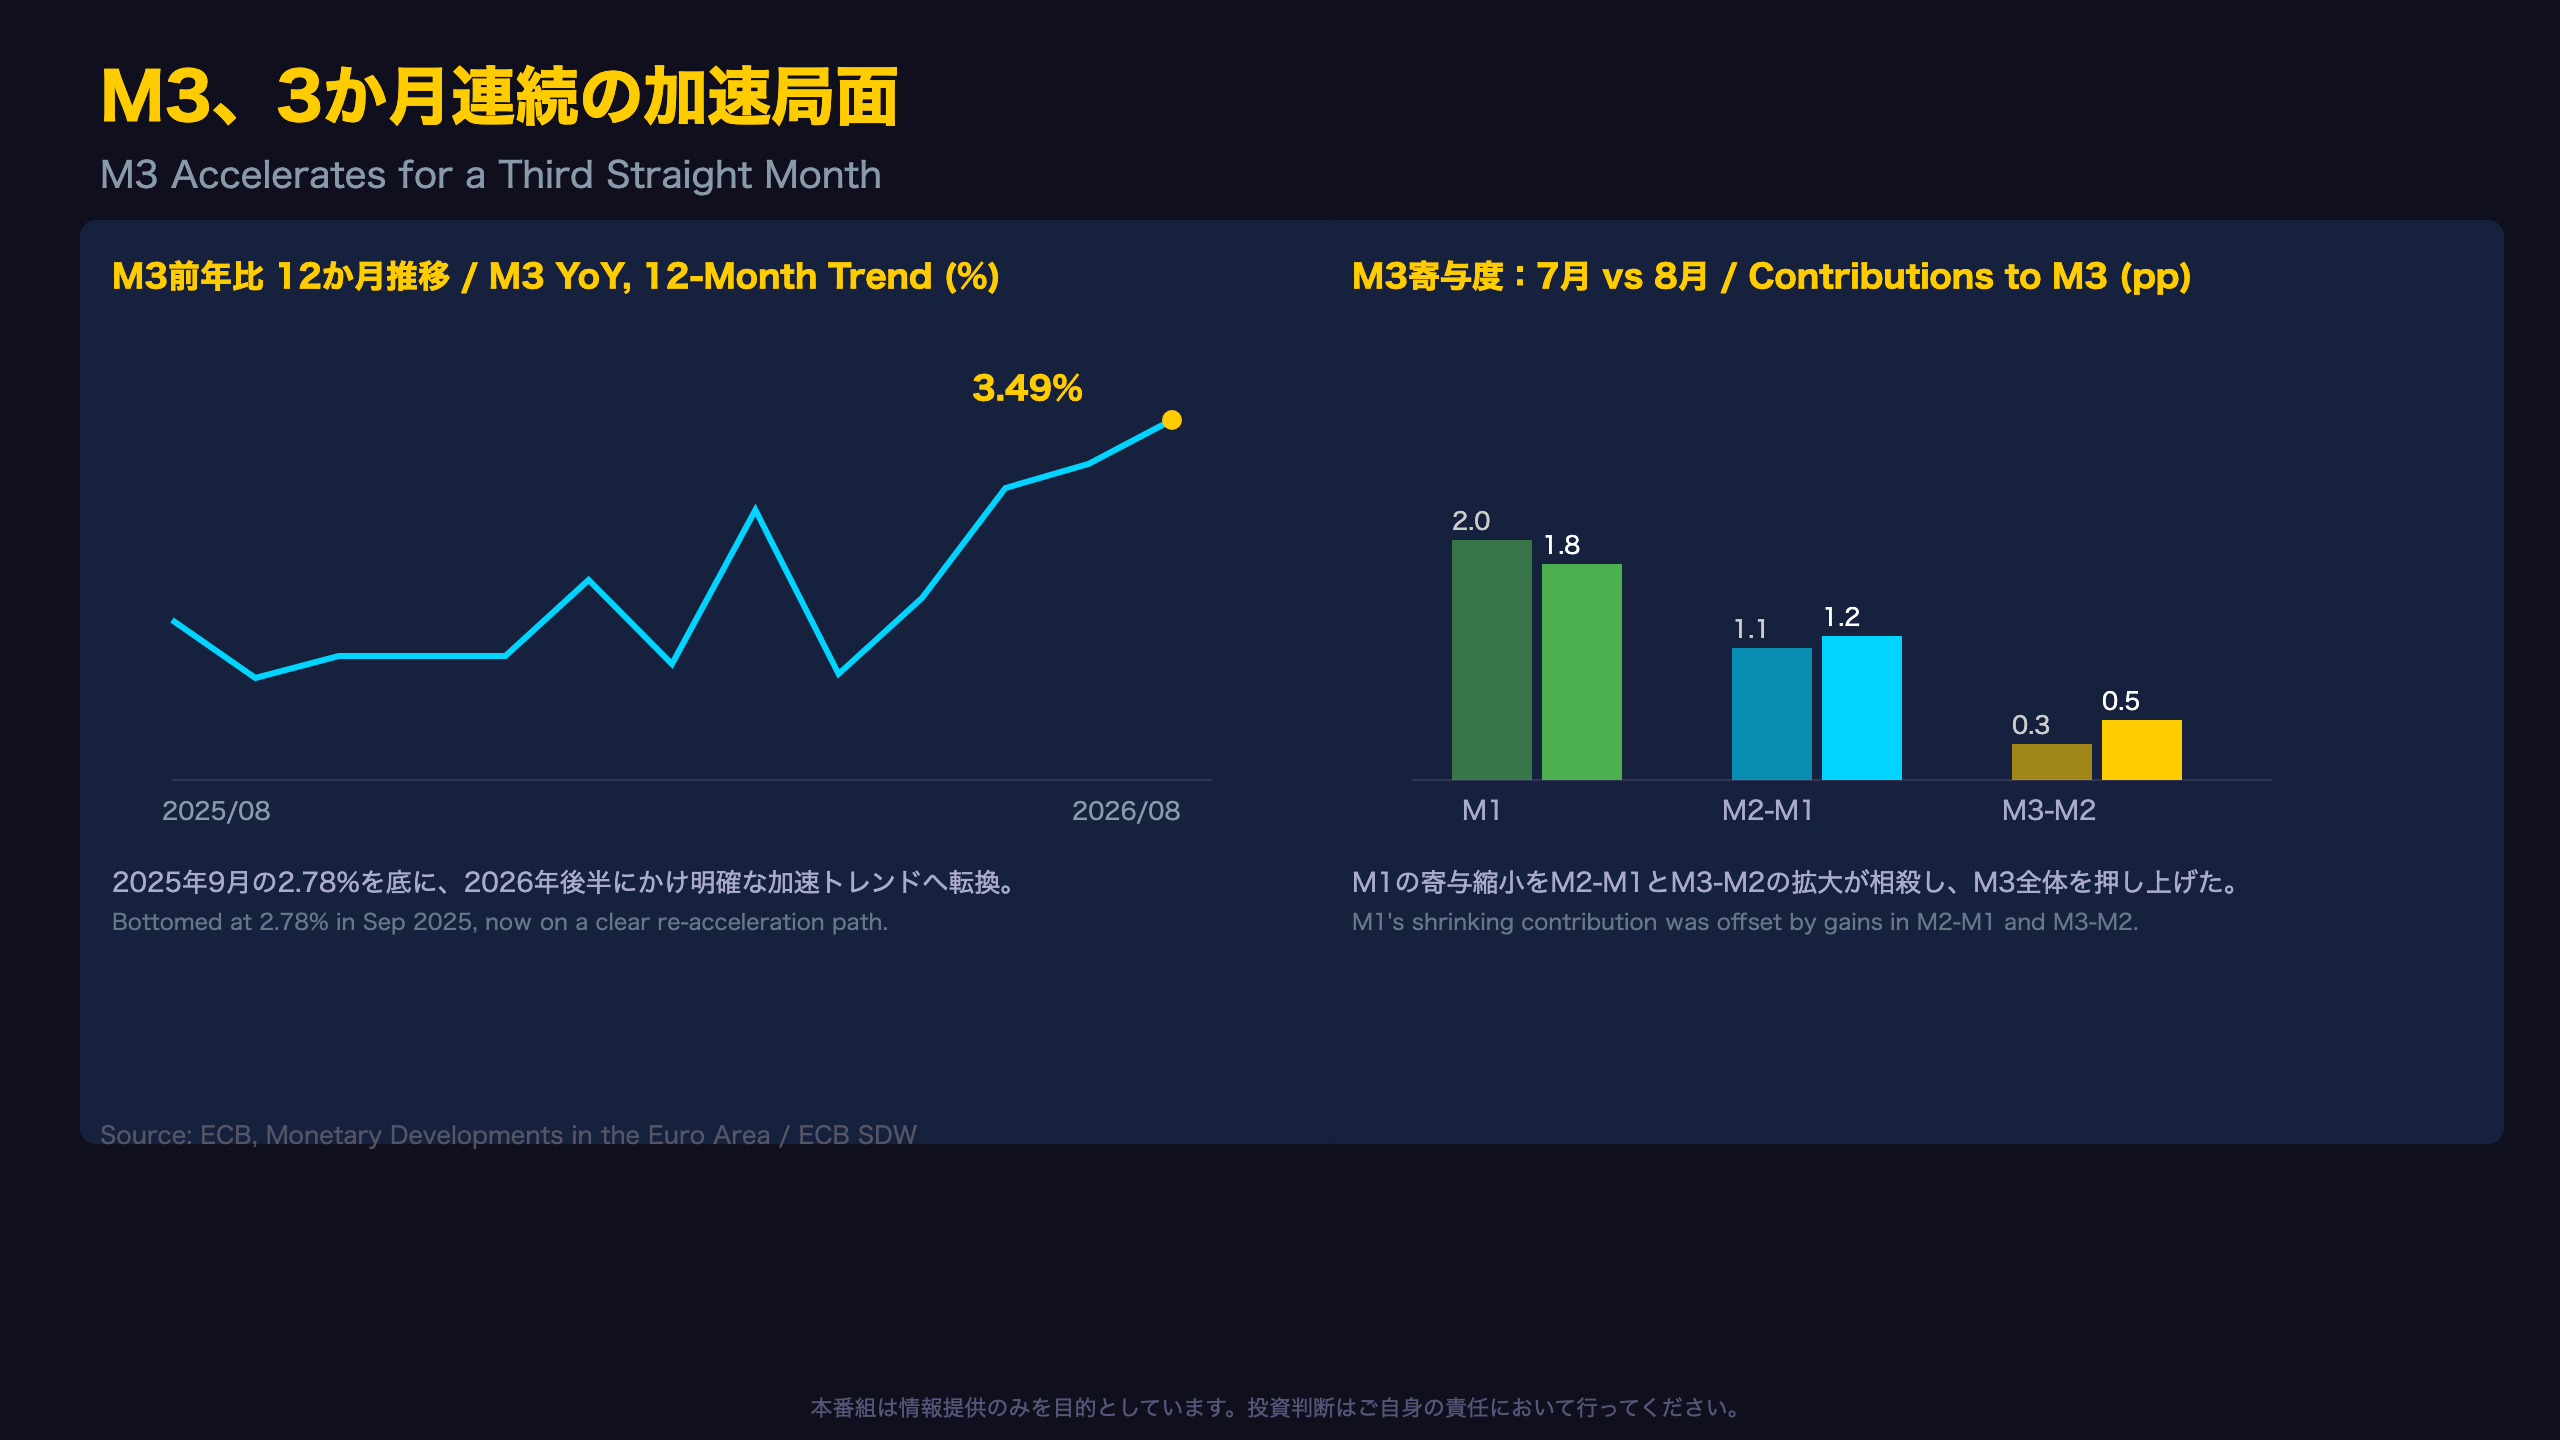
August’s 3.5% remains below that historical benchmark, but the trajectory matters more than the level. From a trough of 2.78% in September 2025, M3 growth has climbed for three consecutive months (3.3% in June, 3.4% in July, 3.5% in August), with the ECB’s release noting a “three-month average of 3.4%” — suggesting a trend shift rather than monthly noise.
Why this matters for investors: M3 has historically led eurozone HICP inflation by roughly 6-12 months. A reacceleration in broad money, if sustained, could argue against the ECB needing to cut rates aggressively — a dynamic relevant for EUR positioning versus the yen, particularly as the Bank of Japan continues policy normalization in the opposite direction.
However, the composition of this M3 acceleration is uneven — the narrowest, most liquid component (M1) is decelerating, while marketable instruments are surging. This bifurcation, detailed in later sections, complicates a simple “money growth equals inflation risk” narrative.
M3、3か月連続の加速局面
Decomposing M3: Where the Growth Is Coming From
Unlike the US Fed’s single M2 aggregate, the ECB breaks M3 into three tiers: M1 (currency plus overnight deposits — the most liquid, “spendable” money), M2 minus M1 (short-term time deposits and deposits redeemable at notice), and M3 minus M2 (marketable instruments like repos and money market fund shares — the least liquid tier).
Over the past year, M3 growth bottomed at 2.78% in September 2025 and oscillated in the 2.8%-3.2% range through the first half of 2026 before clearly re-accelerating: 3.3% in June, 3.4% in July, 3.5% in August.
The composition shift is the real story. M1’s contribution fell from 2.0 to 1.8 percentage points as its own growth decayed from a 5.25% peak in October 2025 to just 2.85% in August 2026 — a ten-month deceleration. Meanwhile, short-term deposits and marketable instruments picked up the slack, contributing 1.2 and 0.5 points respectively, up from 1.1 and 0.3 the prior month.
What this means for investors: this “portfolio shift” pattern typically emerges when depositors move idle cash into interest-bearing instruments while chasing yield, even in a rate-cutting cycle. It’s not necessarily inflationary in the near term since money isn’t flowing into immediate spending, but it reflects active portfolio management by eurozone savers and corporates rather than passive cash-hoarding.
対価構成に見る資金フローの正体
Reading the Balance Sheet: Where Is Eurozone Money Coming From?
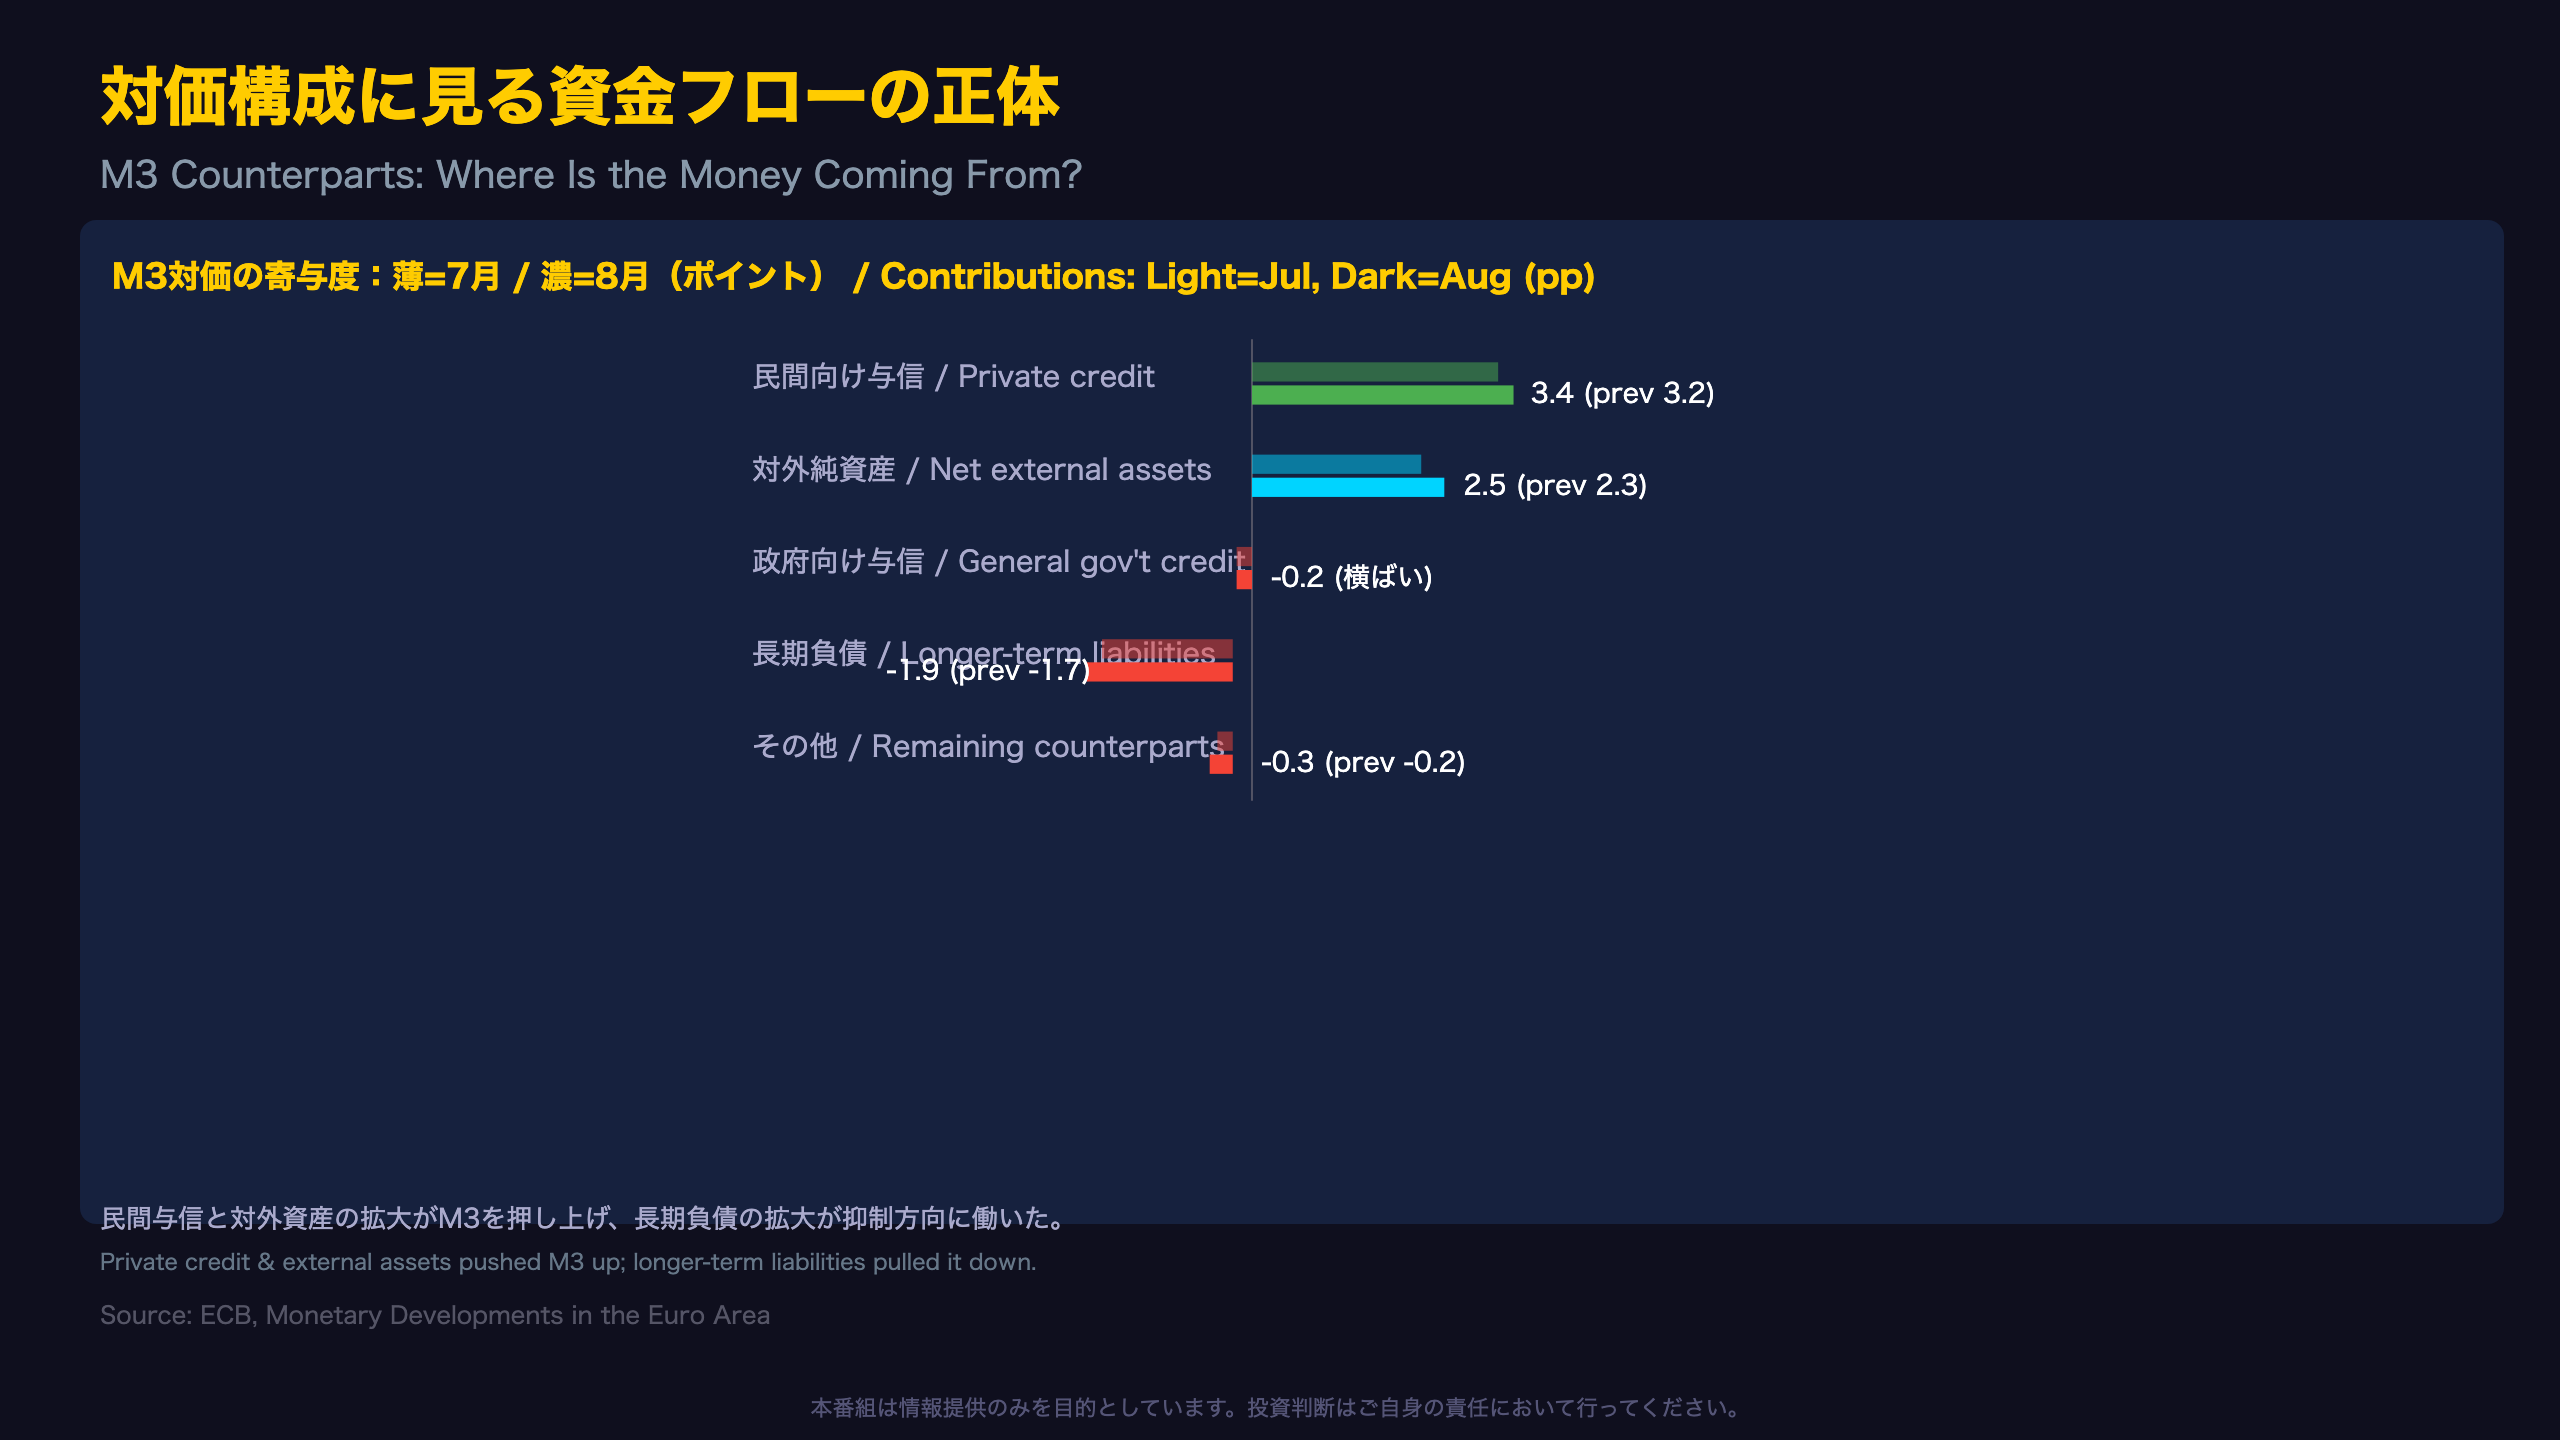
The ECB’s “counterparts of M3” framework decomposes money growth into its balance-sheet drivers — what banks are doing on the asset and liability side to create or absorb money, applied across the entire euro area banking system (MFIs).
The standout mover this month is “longer-term liabilities” — bank-issued deposits and bonds with maturities over two years — whose contribution became more negative, at -1.9 percentage points versus -1.7 in July. Because these liabilities are excluded from M3 by definition, an increase in them mechanically drags on M3 growth. This mirrors the M1-to-M2/M3 portfolio shift discussed elsewhere: households and corporates are locking cash into longer-duration instruments.
Meanwhile, net external assets — a proxy for capital flows into and out of the euro area — contributed 2.5 points, up from 2.3. Rising net external assets can reflect foreign investors adding euro-denominated assets, though currency valuation effects and cross-border banking flows complicate a clean interpretation.
For FX-focused readers: this modest uptick in net external assets is not, on its own, a strong signal for EUR strength, but it is one data point consistent with continued international demand for euro area assets rather than capital flight.
Credit to general government held flat at -0.2 points, suggesting banks’ role in financing eurozone governments remains contained and unchanged month-on-month.
M1急減速の正体:消えたお金か、動いたお金か
Not “Disappearing” Money — Money on the Move
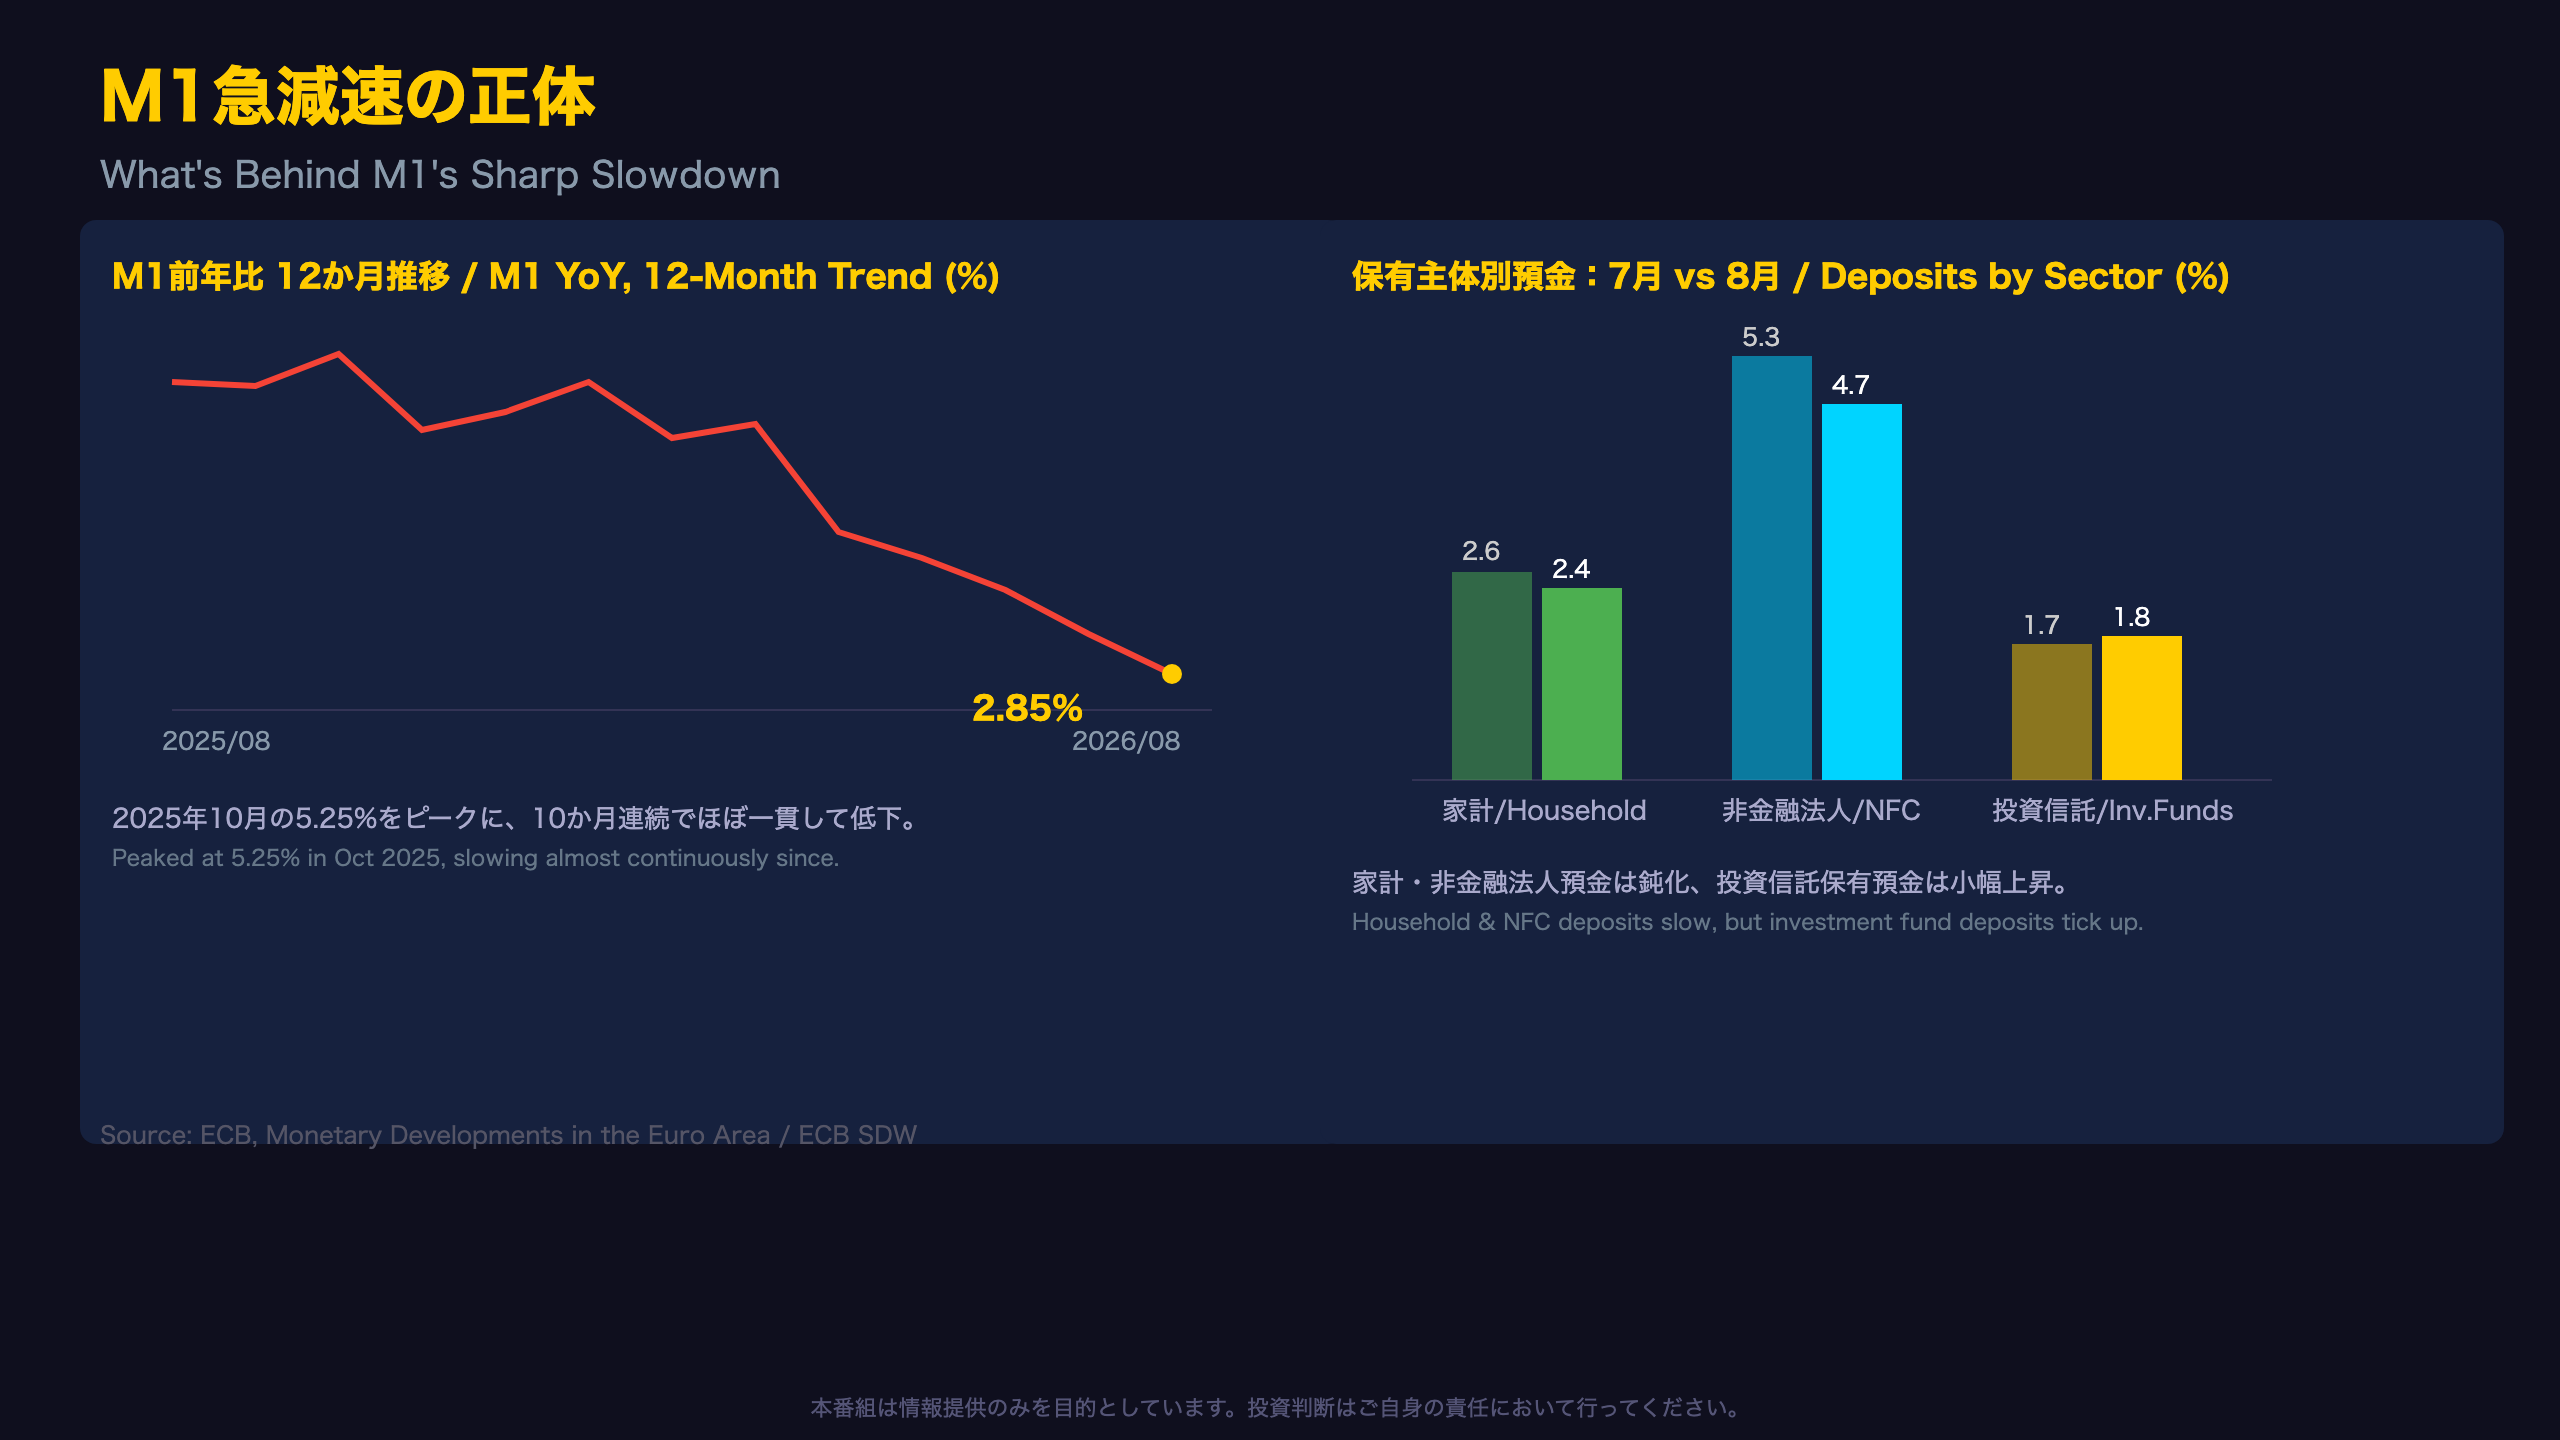
M1’s deceleration is striking on its face: from a 5.25% peak in October 2025 to just 2.85% in August 2026 — nearly halved in ten months. But interpreting this as eurozone liquidity “shrinking” would be misleading, since headline M3 is actually accelerating over the same period.
Breaking deposits down by holding sector tells a more nuanced story. Household deposit growth slowed from 2.6% to 2.4%, and non-financial corporate (NFC) deposit growth eased from 5.3% to 4.7%.
「the annual growth rate of deposits placed by households decreased to 2.4% in August from 2.6% in July, while… non-financial corporations decreased to 4.7% in August from 5.3%」
Meanwhile, deposits held by investment funds (excluding money market funds) actually ticked up, from 1.7% to 1.8% — a small but directionally consistent signal that households and corporates may be redirecting idle cash toward fund-based investment vehicles rather than simply parking it in overnight accounts.
Context for international readers: this dynamic echoes what US money-market observers saw in 2023, when depositors moved cash from near-zero-yield checking accounts into money market funds as rates rose. In the eurozone’s case, even with the ECB in a rate-cutting cycle, term deposits and marketable instruments still appear relatively attractive — though this is a plausible interpretation rather than a certainty, since it rests on a single month’s acceleration alongside M1’s slowdown.
与信データが映す投資マインドの温度差
Credit Data Reveals a Split in Investment Appetite
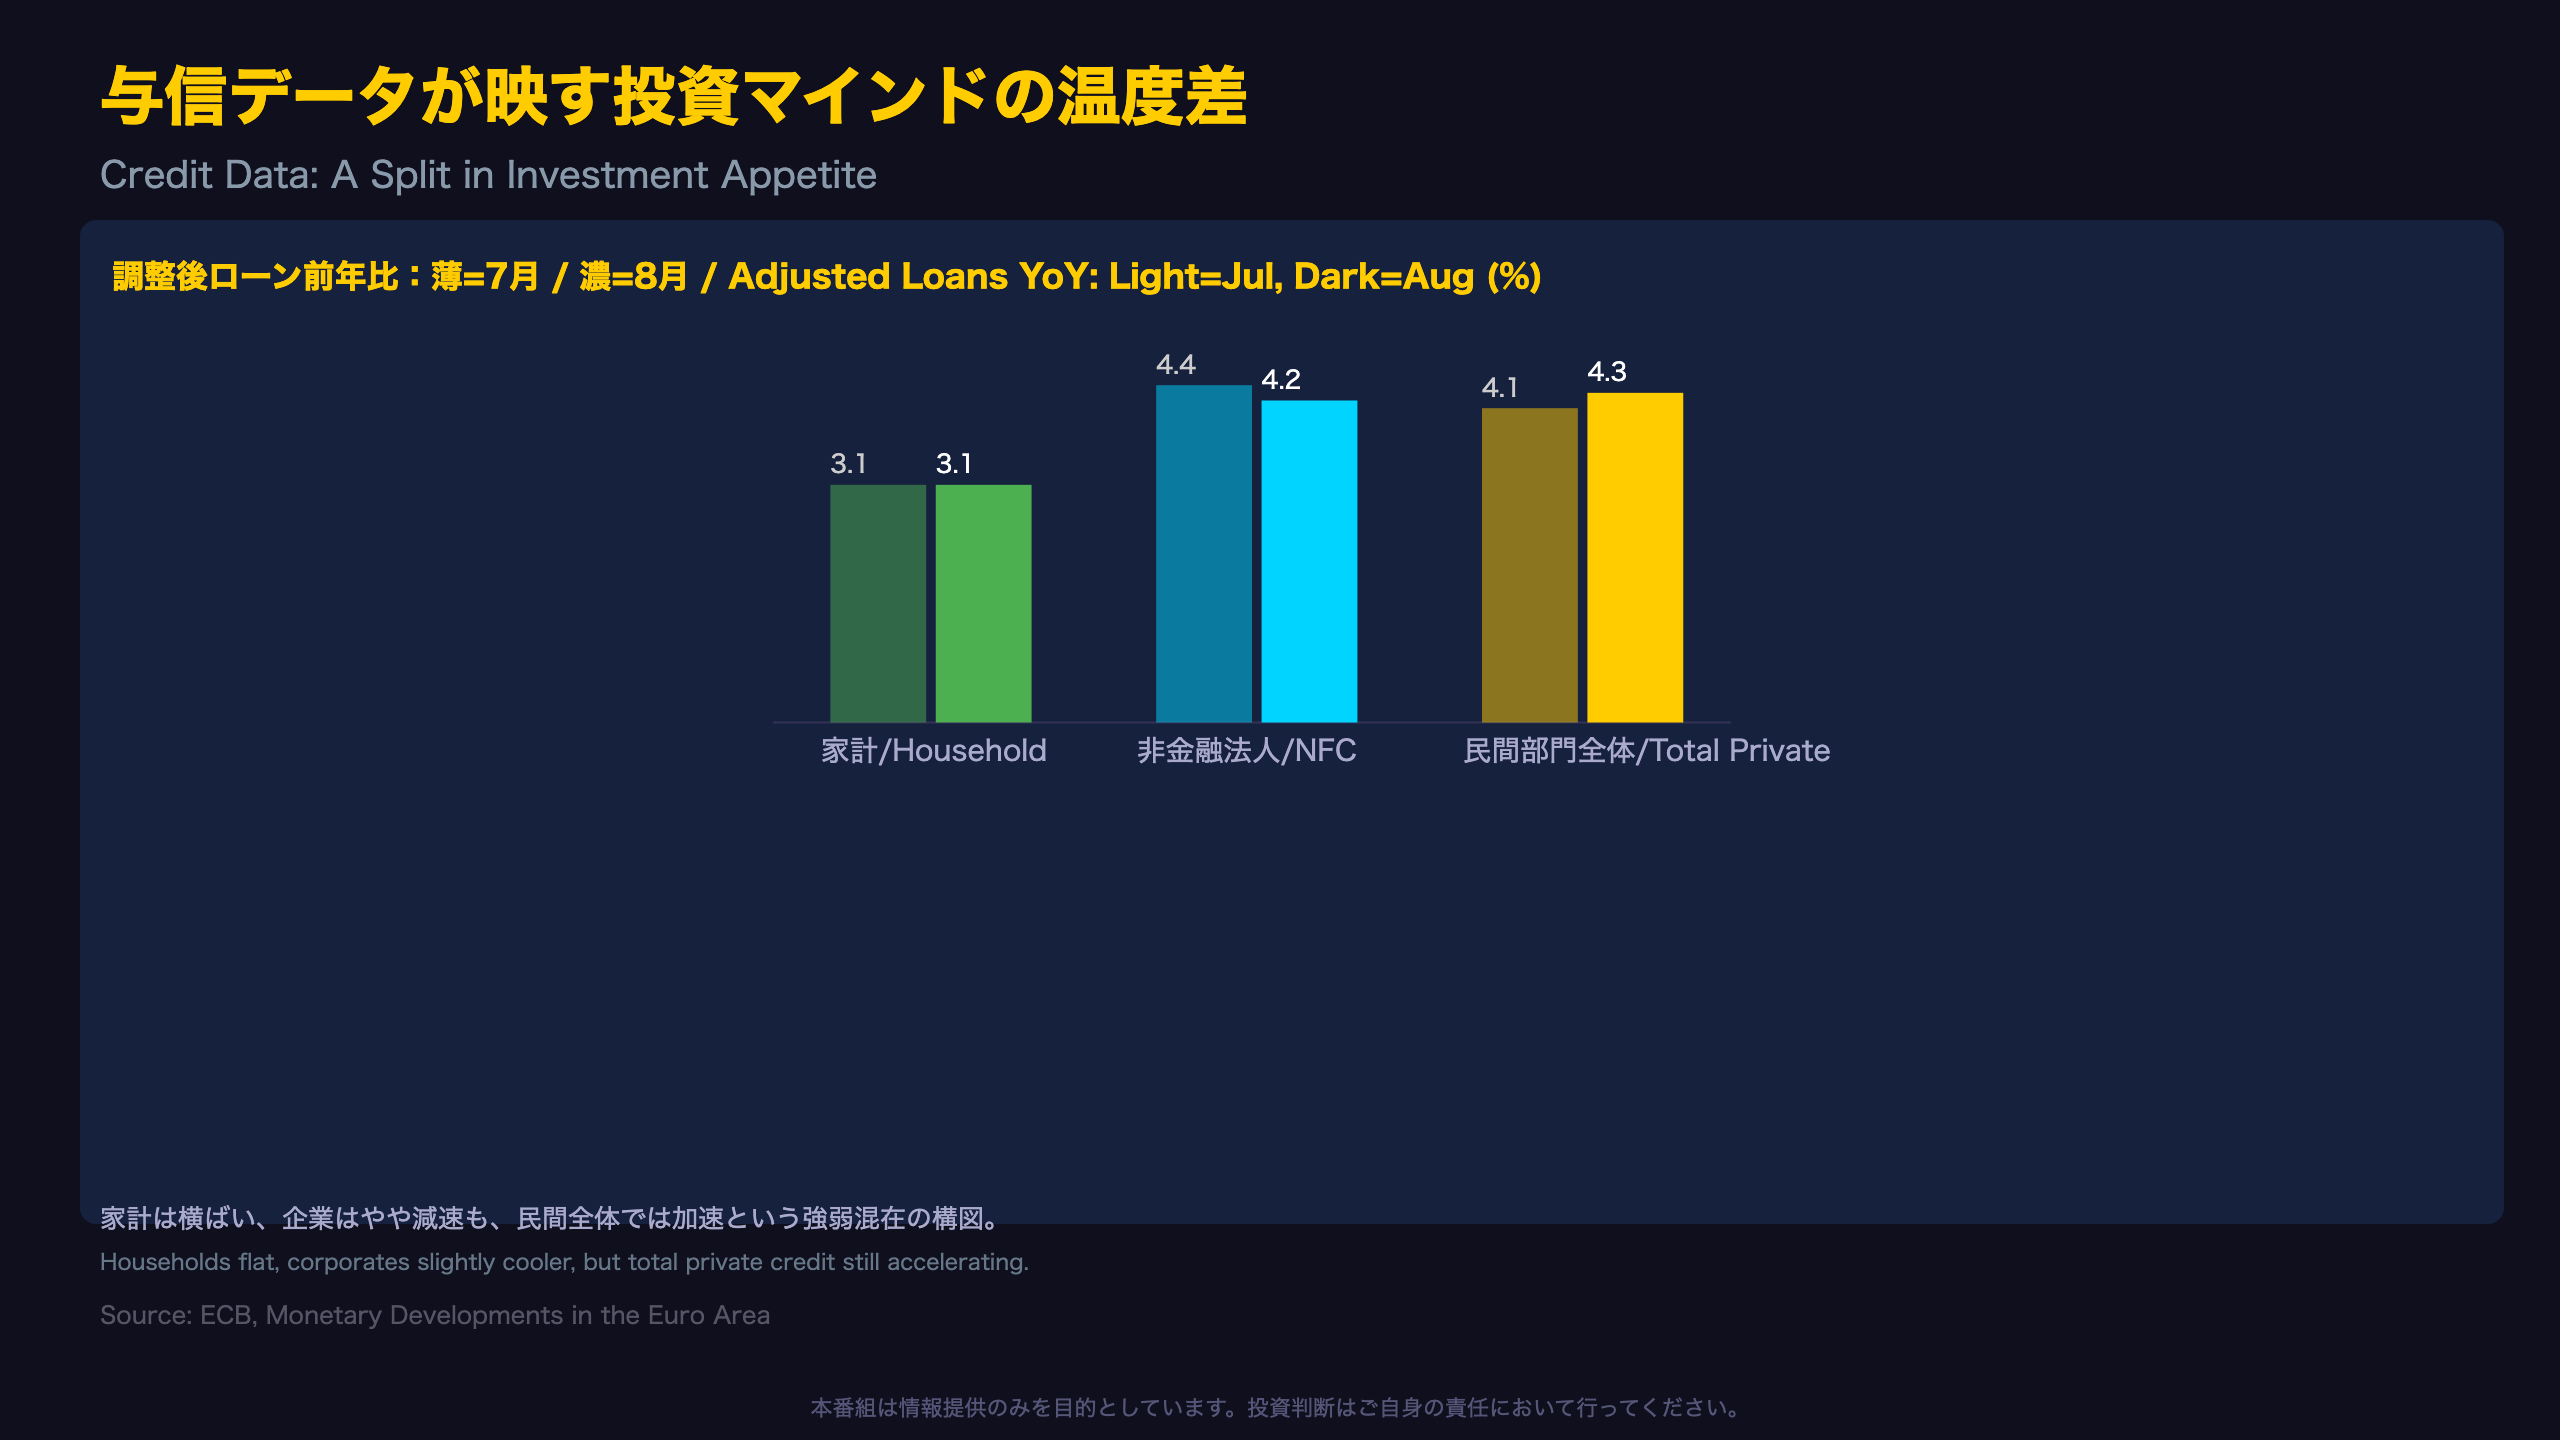
Adjusted loans to households — the ECB’s preferred credit metric, stripped of securitization and cash-pooling distortions — held flat at 3.1% year-on-year for a second straight month. This is roughly comparable to watching US mortgage and consumer credit growth: steady household borrowing signals confidence in employment and income prospects, even during an ECB rate-cutting cycle.
Loans to non-financial corporations (NFCs) — the eurozone’s rough equivalent of US commercial & industrial loan growth — decelerated from 4.4% to 4.2%.
「the annual growth rate of adjusted loans to non-financial corporations decreased to 4.2% in August from 4.4% in July」
Notably, total adjusted loans to the private sector still accelerated overall, from 4.1% to 4.3% — the fastest pace in roughly a year. Since this outpaces the sum of household and NFC growth alone, other private-sector borrowers (insurers, pension funds, non-bank financial institutions) may be contributing to the upside.
Credit to general government turned more negative, at -0.6% versus -0.5% in July, suggesting banks are playing a smaller relative role in financing eurozone government deficits — consistent with governments relying more on direct bond issuance to non-bank investors.
Bottom line for investors: this is not a uniformly bullish or bearish credit picture. Corporate borrowing momentum may be peaking, but household and aggregate private credit demand remain resilient — a combination that argues against both an imminent credit crunch and an overheating scenario.
EUR/JPY保有者が押さえるべき政策の非対称性
M3, Inflation, and the BOJ-ECB Policy Divergence
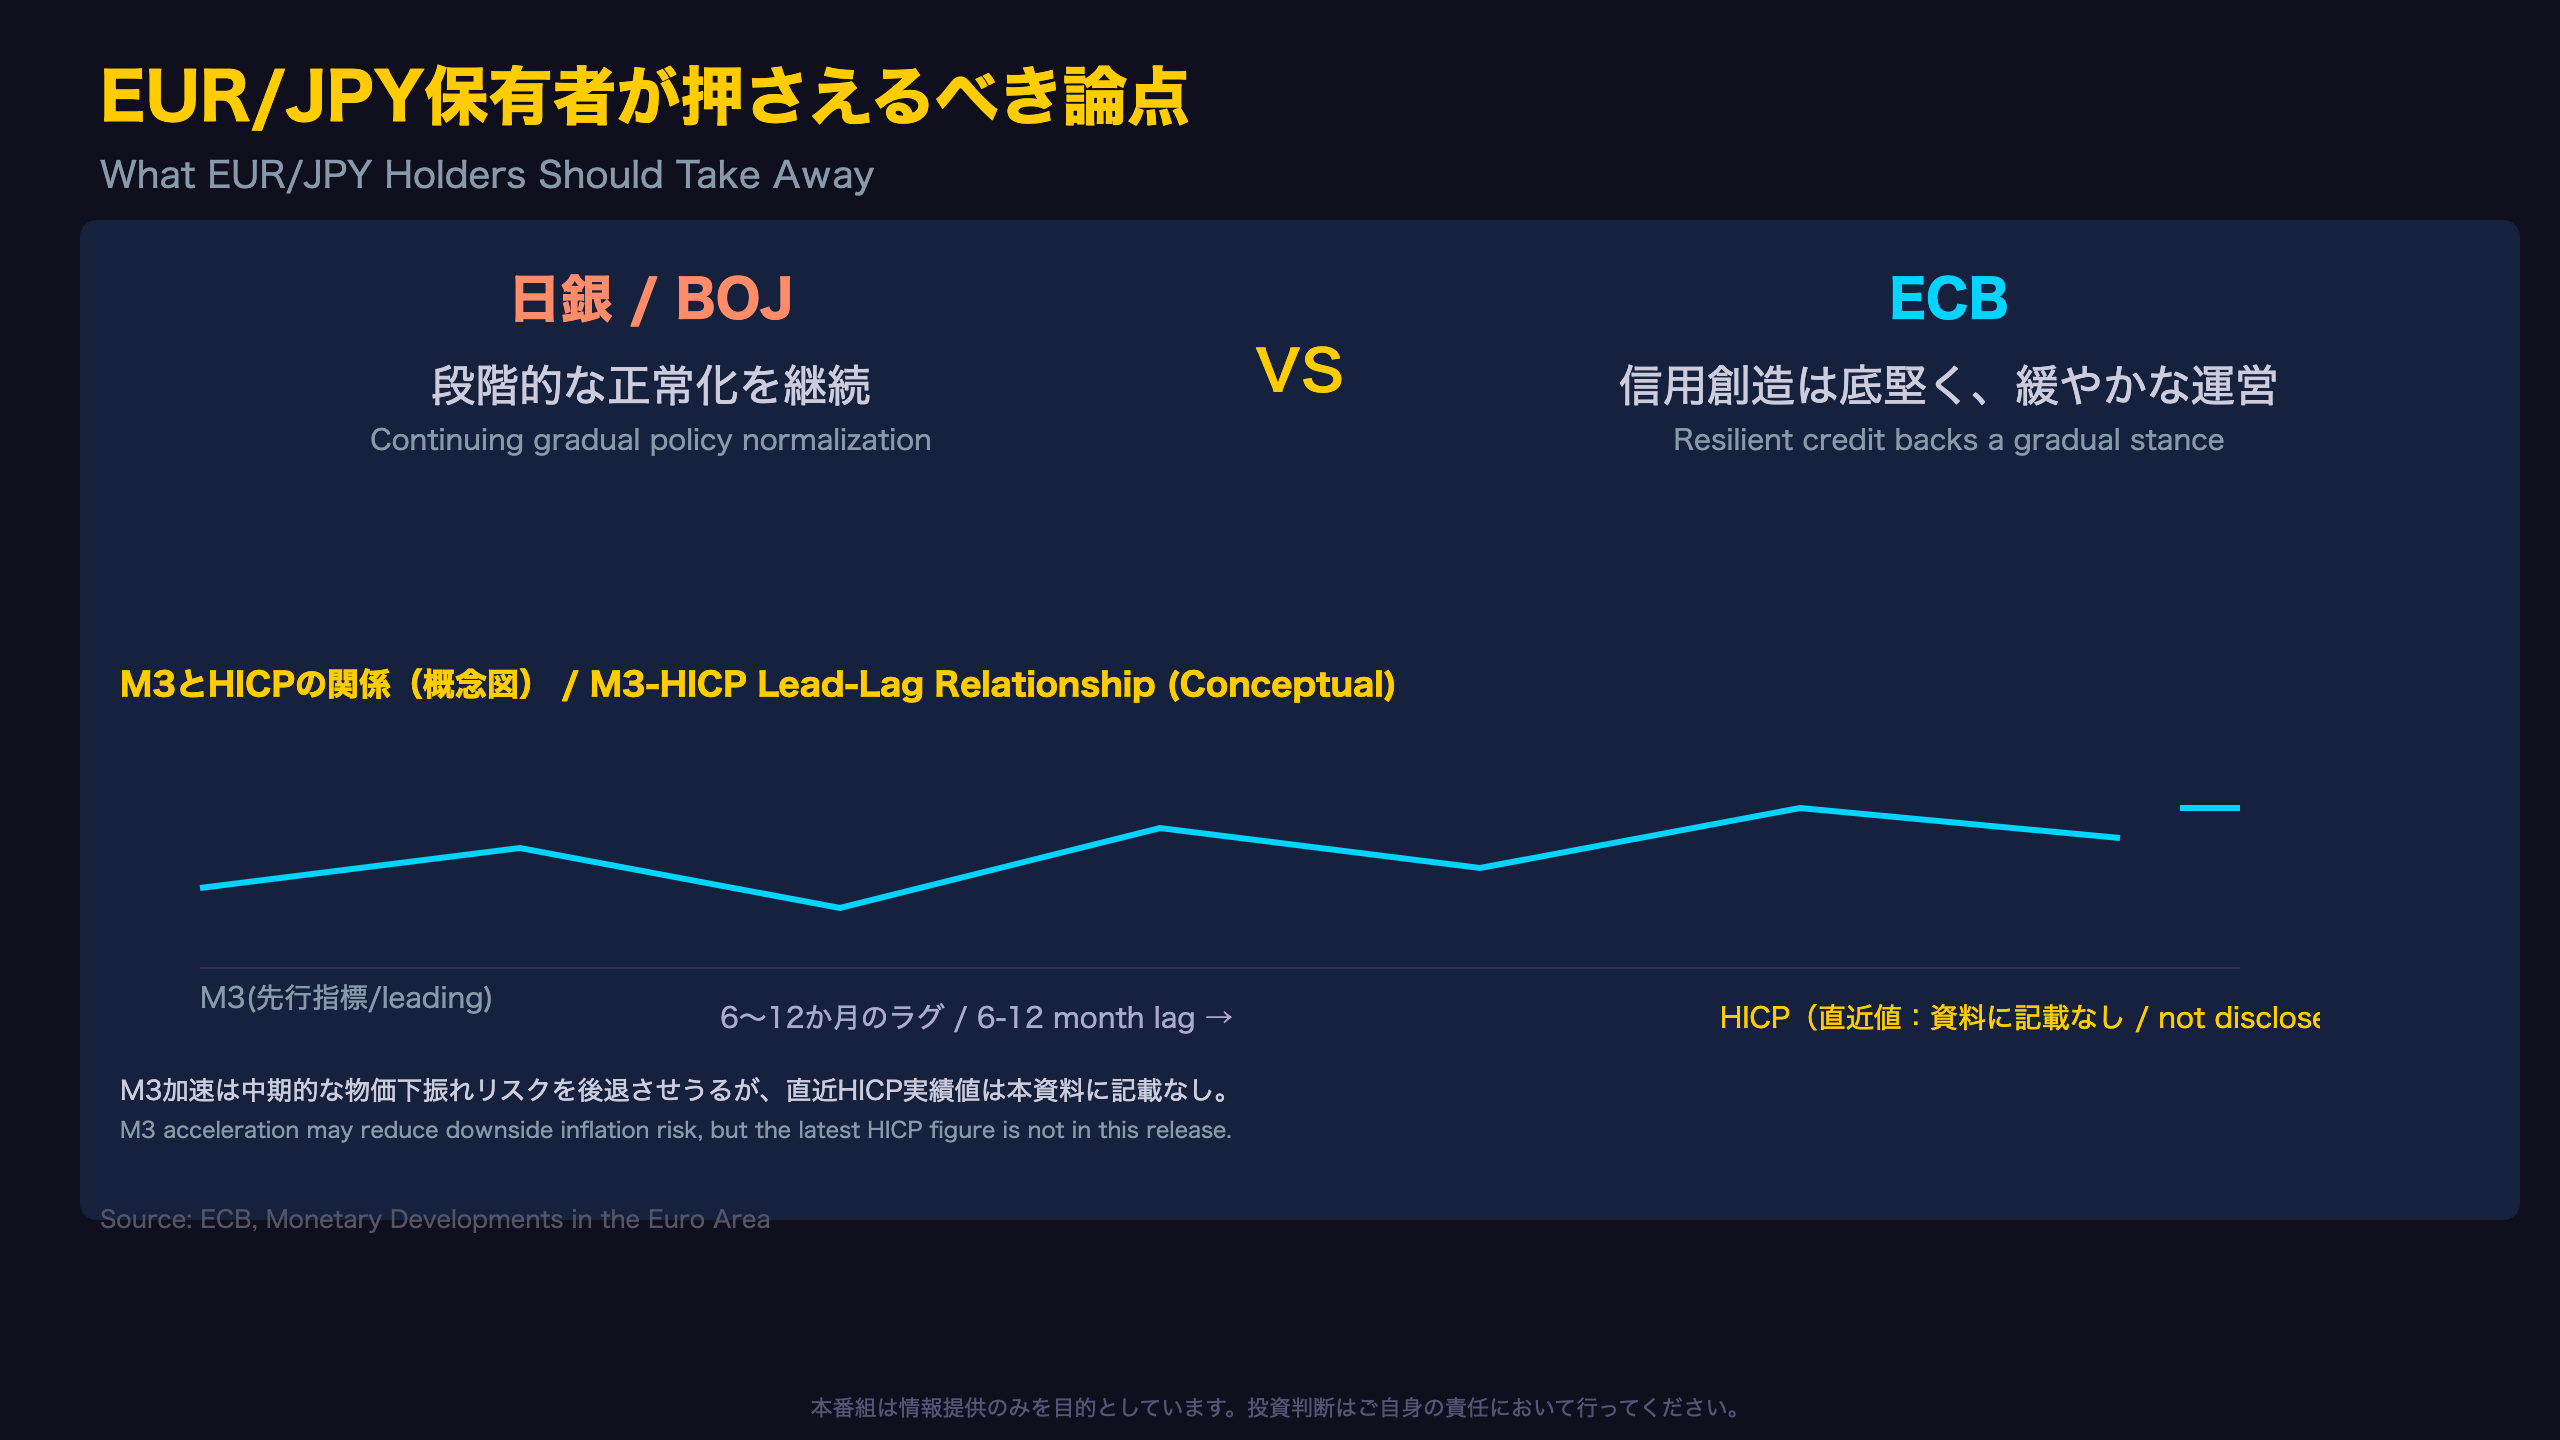
Monetary analysis is one of the ECB’s “two pillars” (alongside economic analysis) for assessing medium-term inflation risk. The working assumption, developed over decades of ECB research, is that M3 growth leads eurozone HICP inflation by roughly six to twelve months. This release does not include the latest HICP print, so a direct comparison isn’t possible here — a limitation worth flagging rather than glossing over.
For context, English-speaking readers should note that HICP (Harmonised Index of Consumer Prices) is the eurozone’s equivalent of the US CPI, though methodologically distinct (HICP excludes owner-occupied housing costs, unlike US CPI). The ECB’s inflation target is “2% over the medium term,” a framework roughly comparable to the Fed’s 2% PCE target, though transmission mechanisms and time horizons differ.
The BOJ-ECB asymmetry: while the Bank of Japan continues gradually normalizing policy (moving rates higher from historic lows), this month’s ECB data — resilient credit growth, accelerating M3 — suggests the ECB may not feel urgency to cut rates further in the near term. A narrowing (or at least stabilizing) policy-rate differential between the two central banks is one of several factors that can influence EUR/JPY over the medium term, alongside risk sentiment, trade flows, and carry-trade positioning.
This is an inference drawn from monetary data, not an ECB policy statement — actual rate decisions depend on the full inflation and growth picture, not money supply data alone.
What to watch next: the September euro area monetary release is due in late October 2026. The key question is whether this month’s surge in marketable instruments (M3-M2) proves to be a one-off or the start of a sustained structural shift.
Disclaimer: This article is for informational purposes only. All investment decisions are made solely at your own risk.