This article was automatically generated by the NFC Market Live AI analysis system. (Updated: 2026-10-08 20:42 JST)
📄 Primary Source
European Central Bank
https://www.ecb.europa.eu//press/accounts/2026/html/ecb.mg261008~a10153d090.en.html
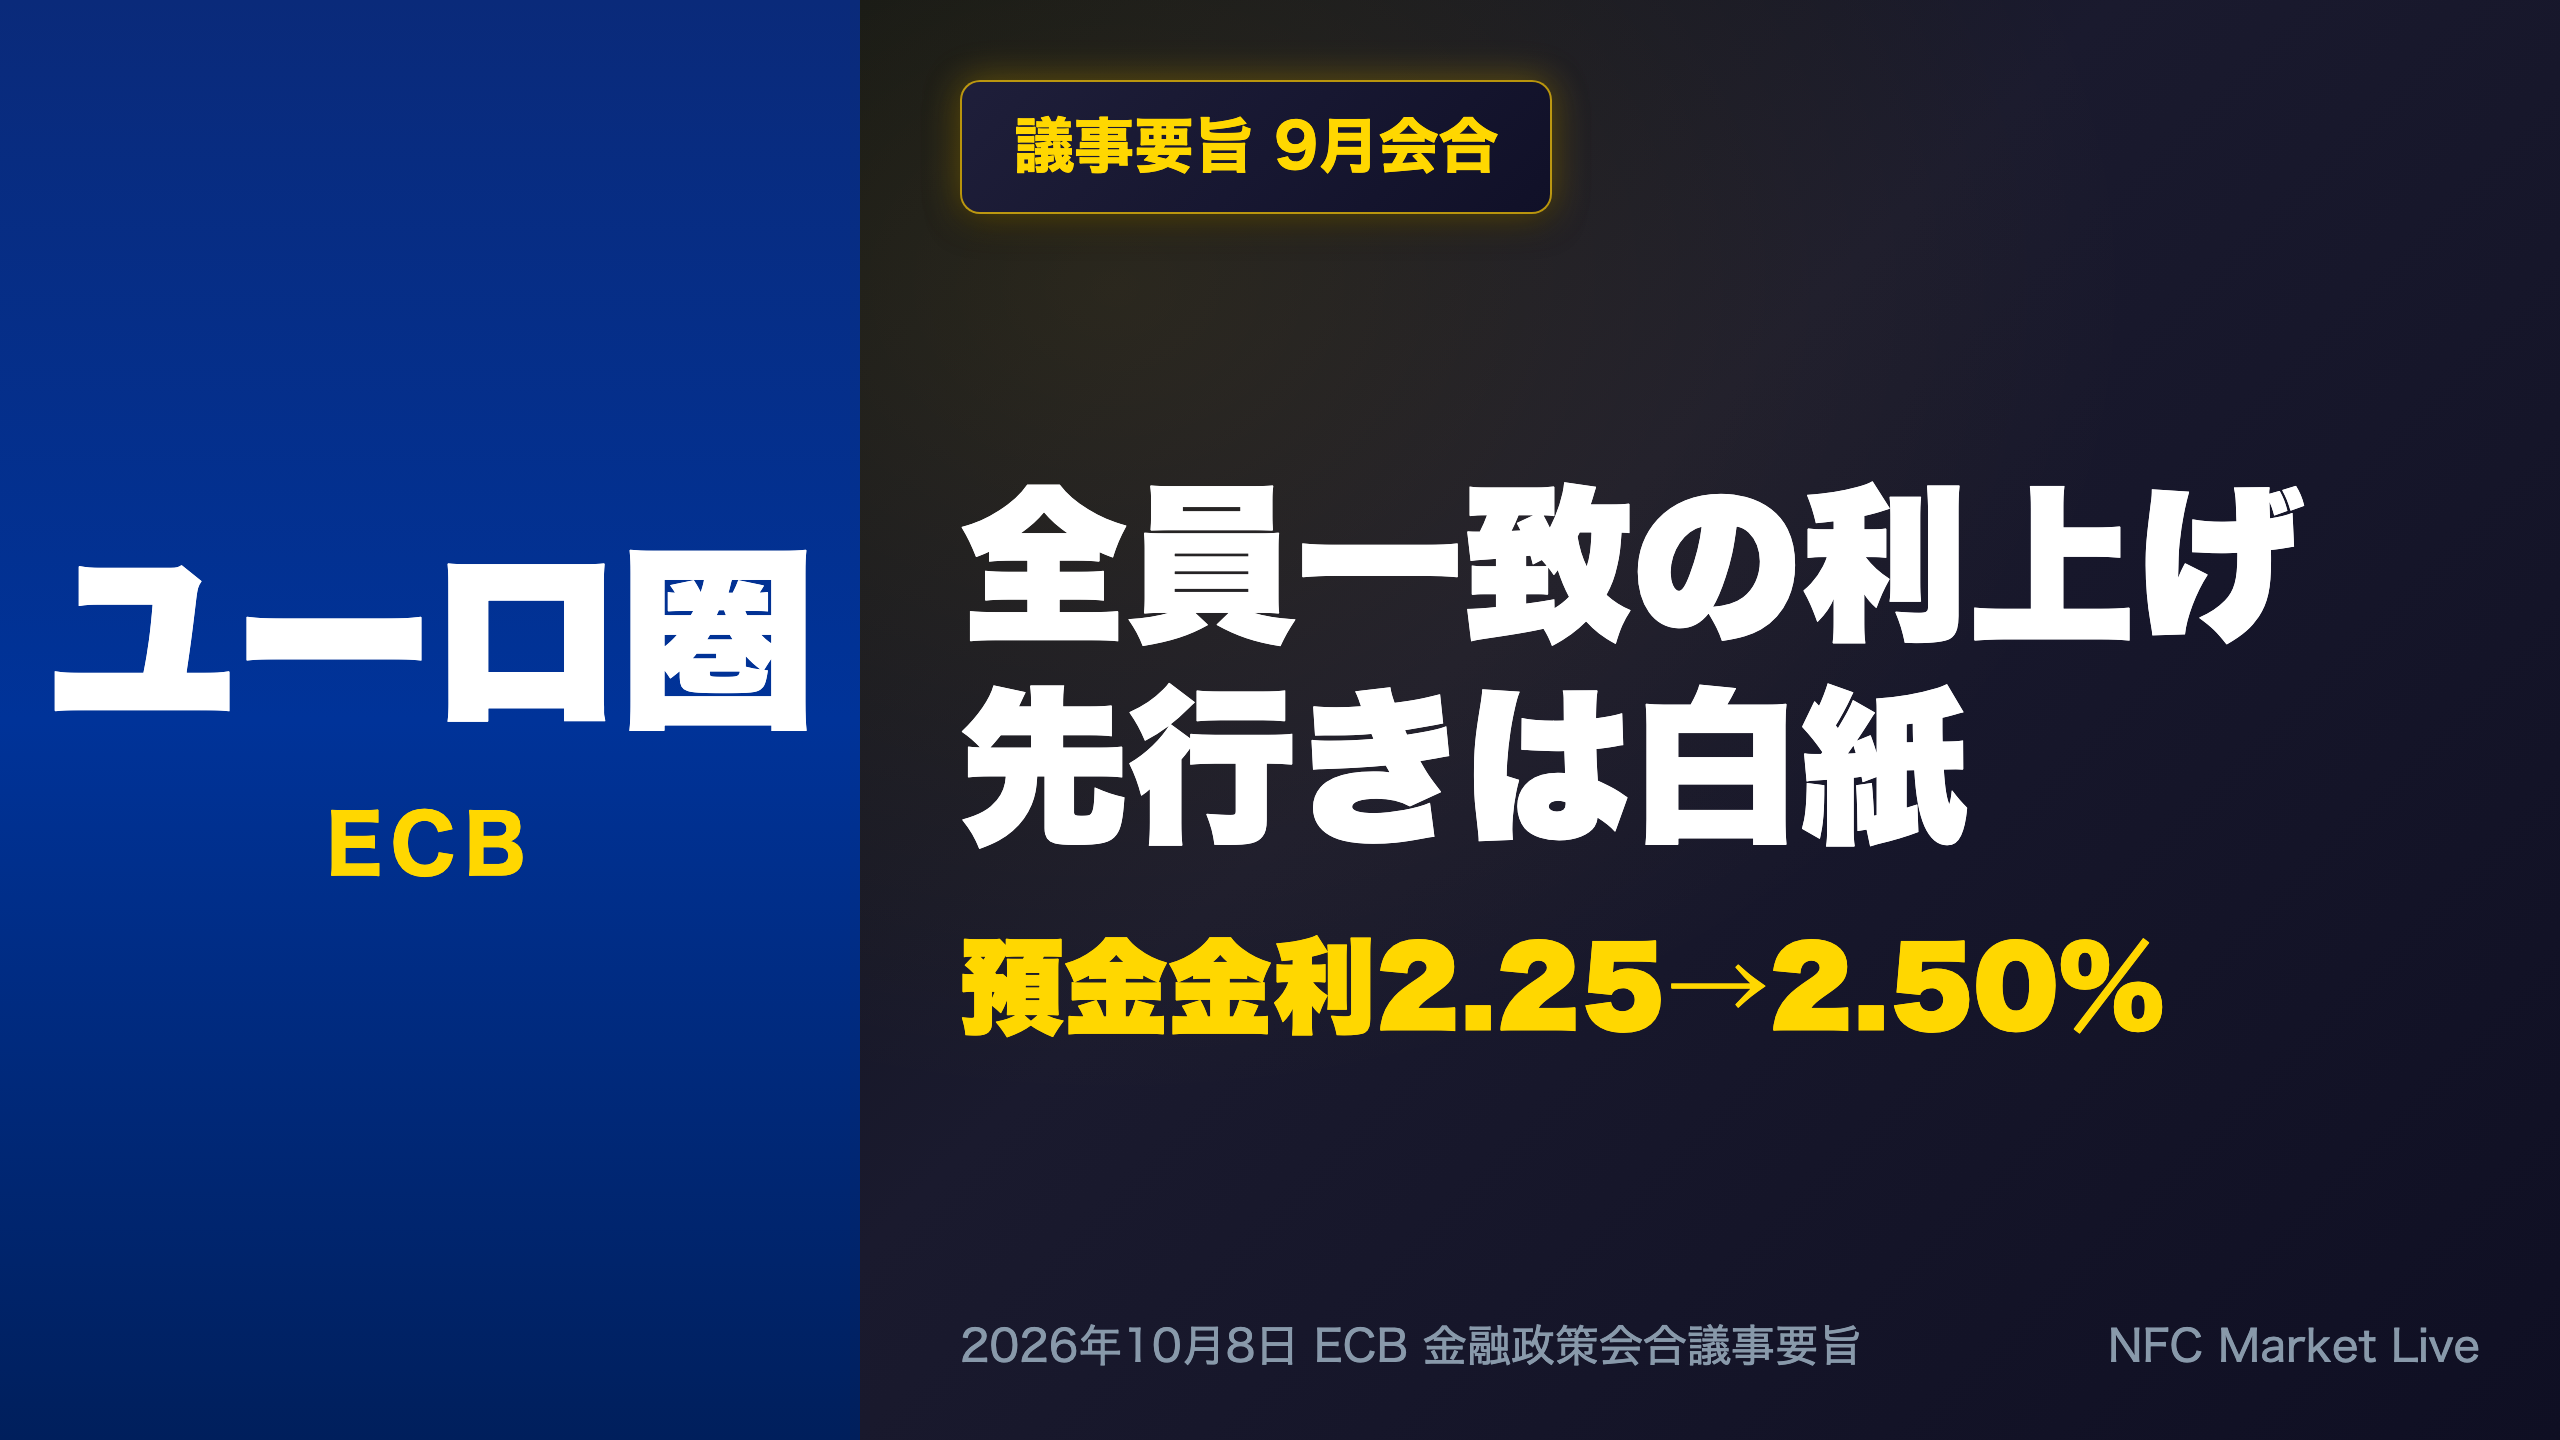
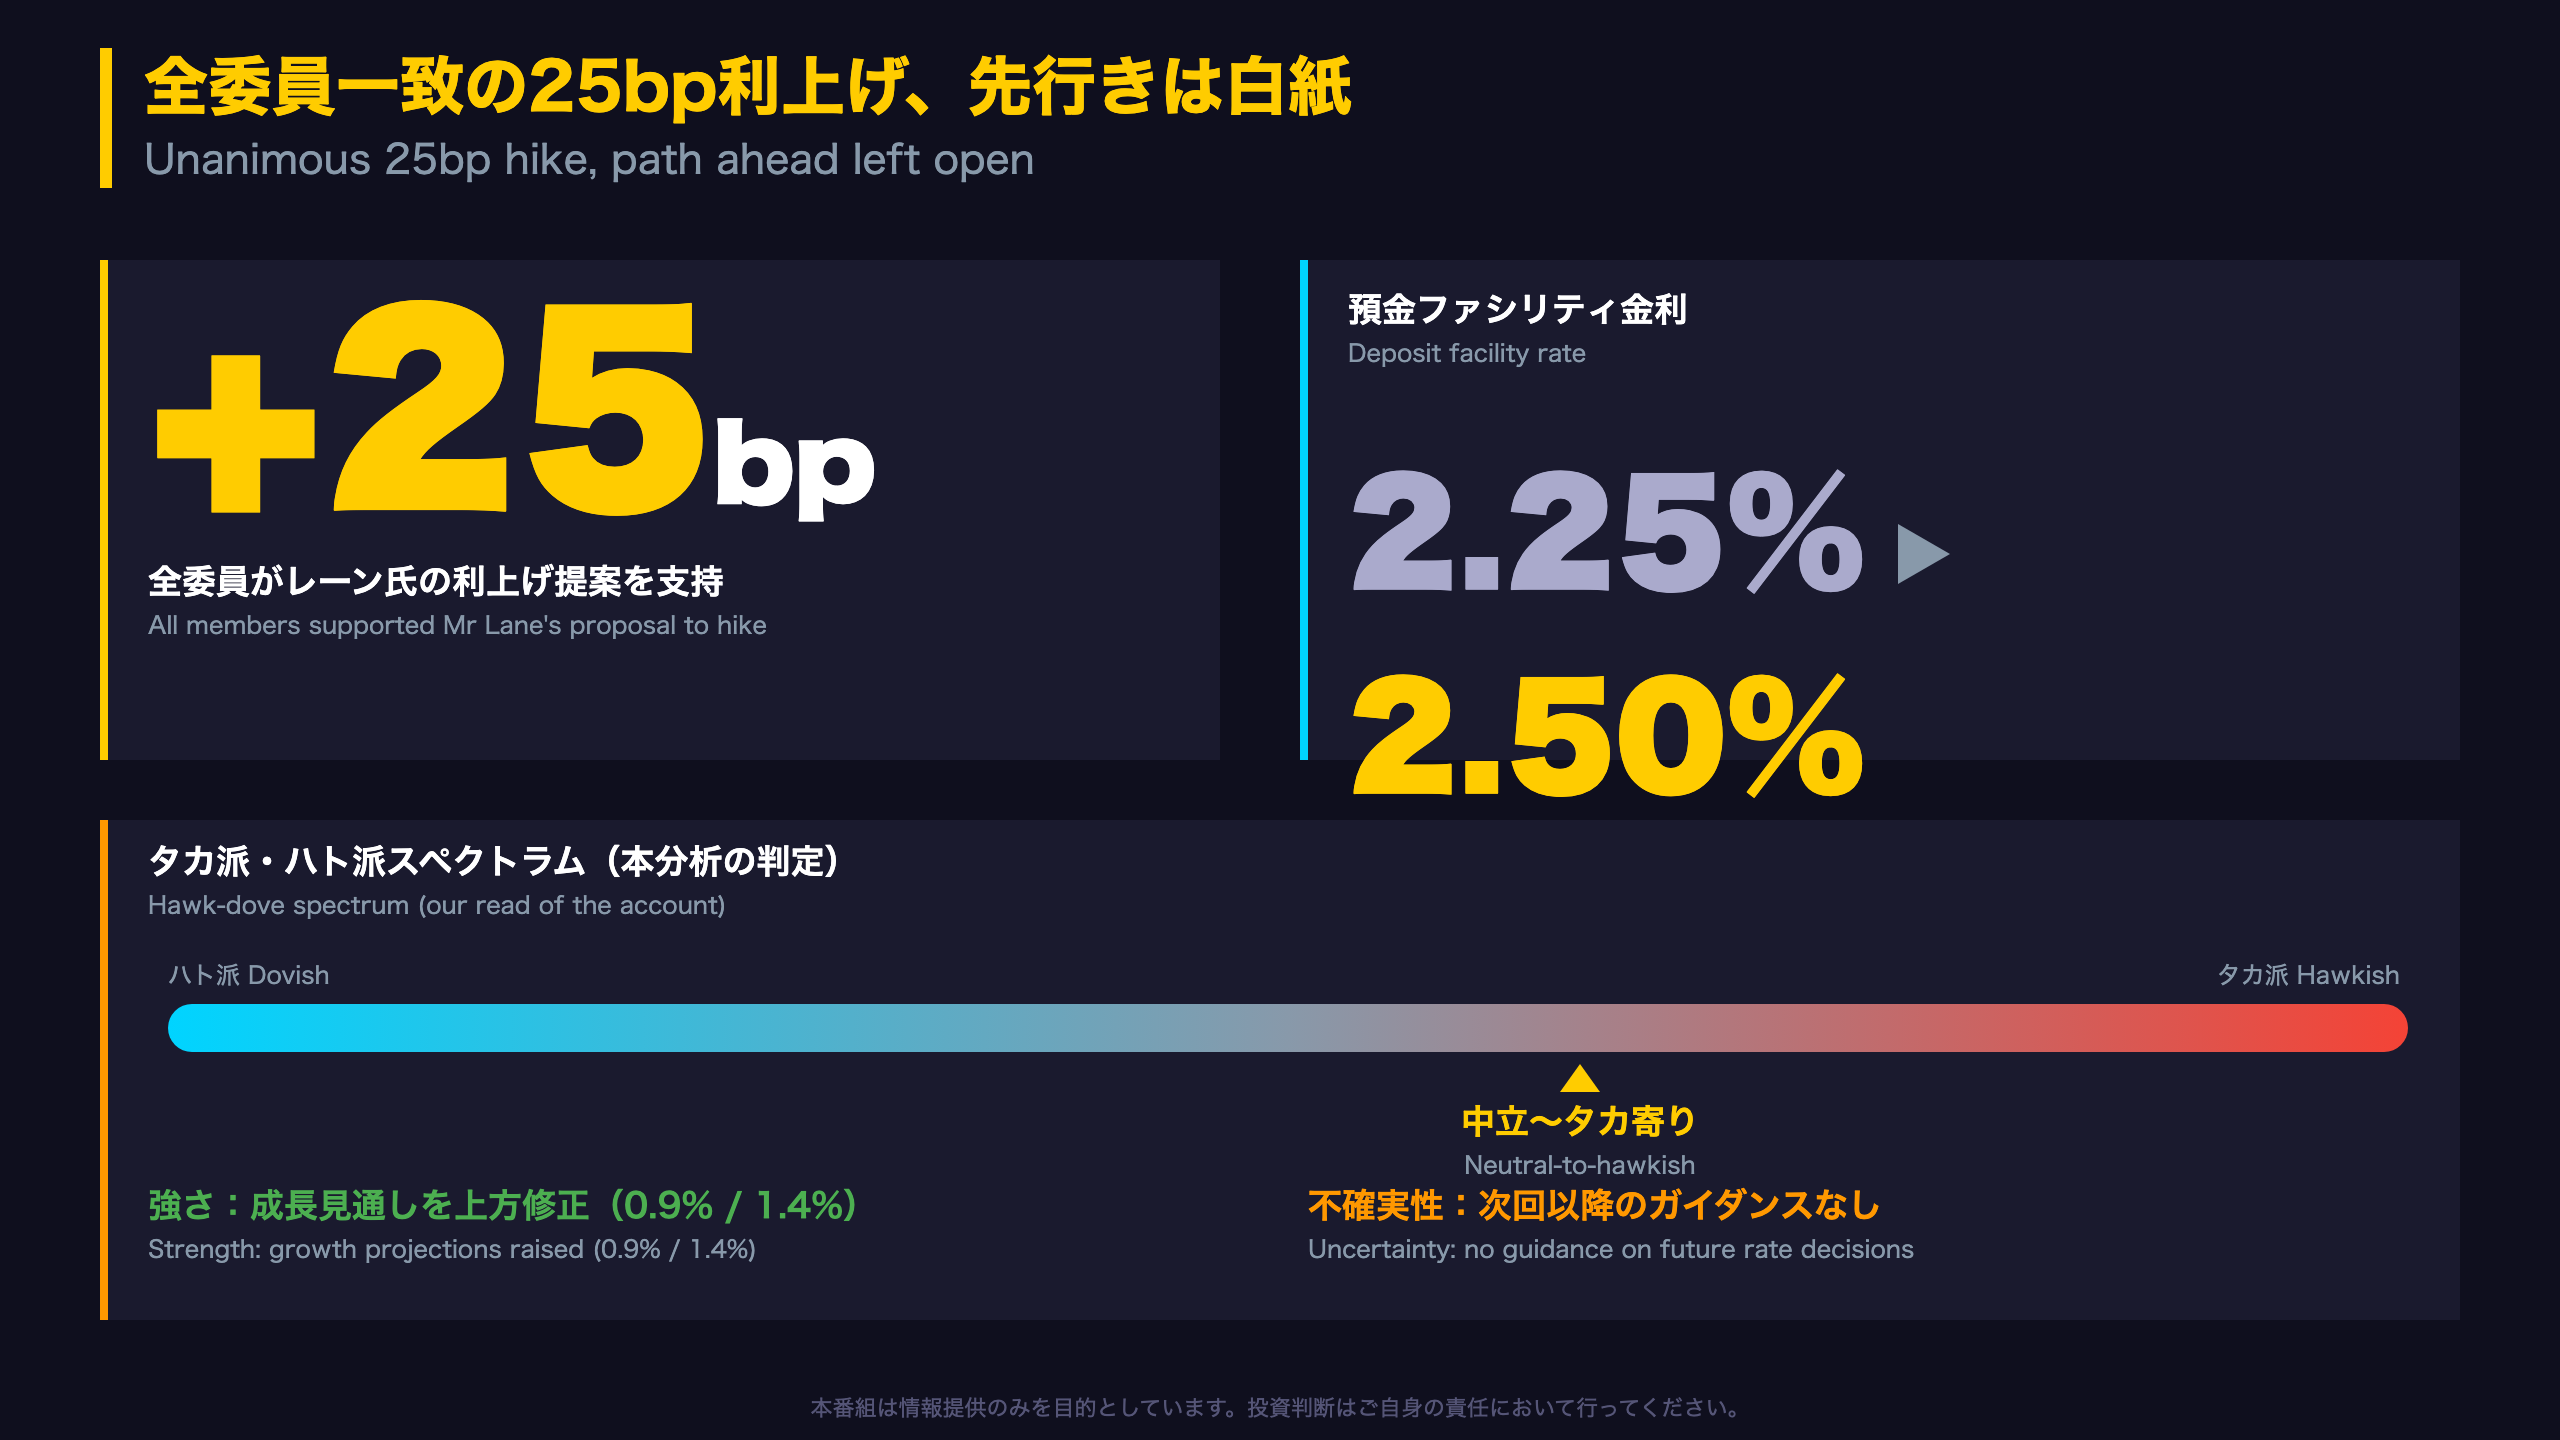
📊 The ECB released the account of its Sept 9-10 meeting: all members backed a 25bp hike, taking the deposit facility rate to 2.50%.
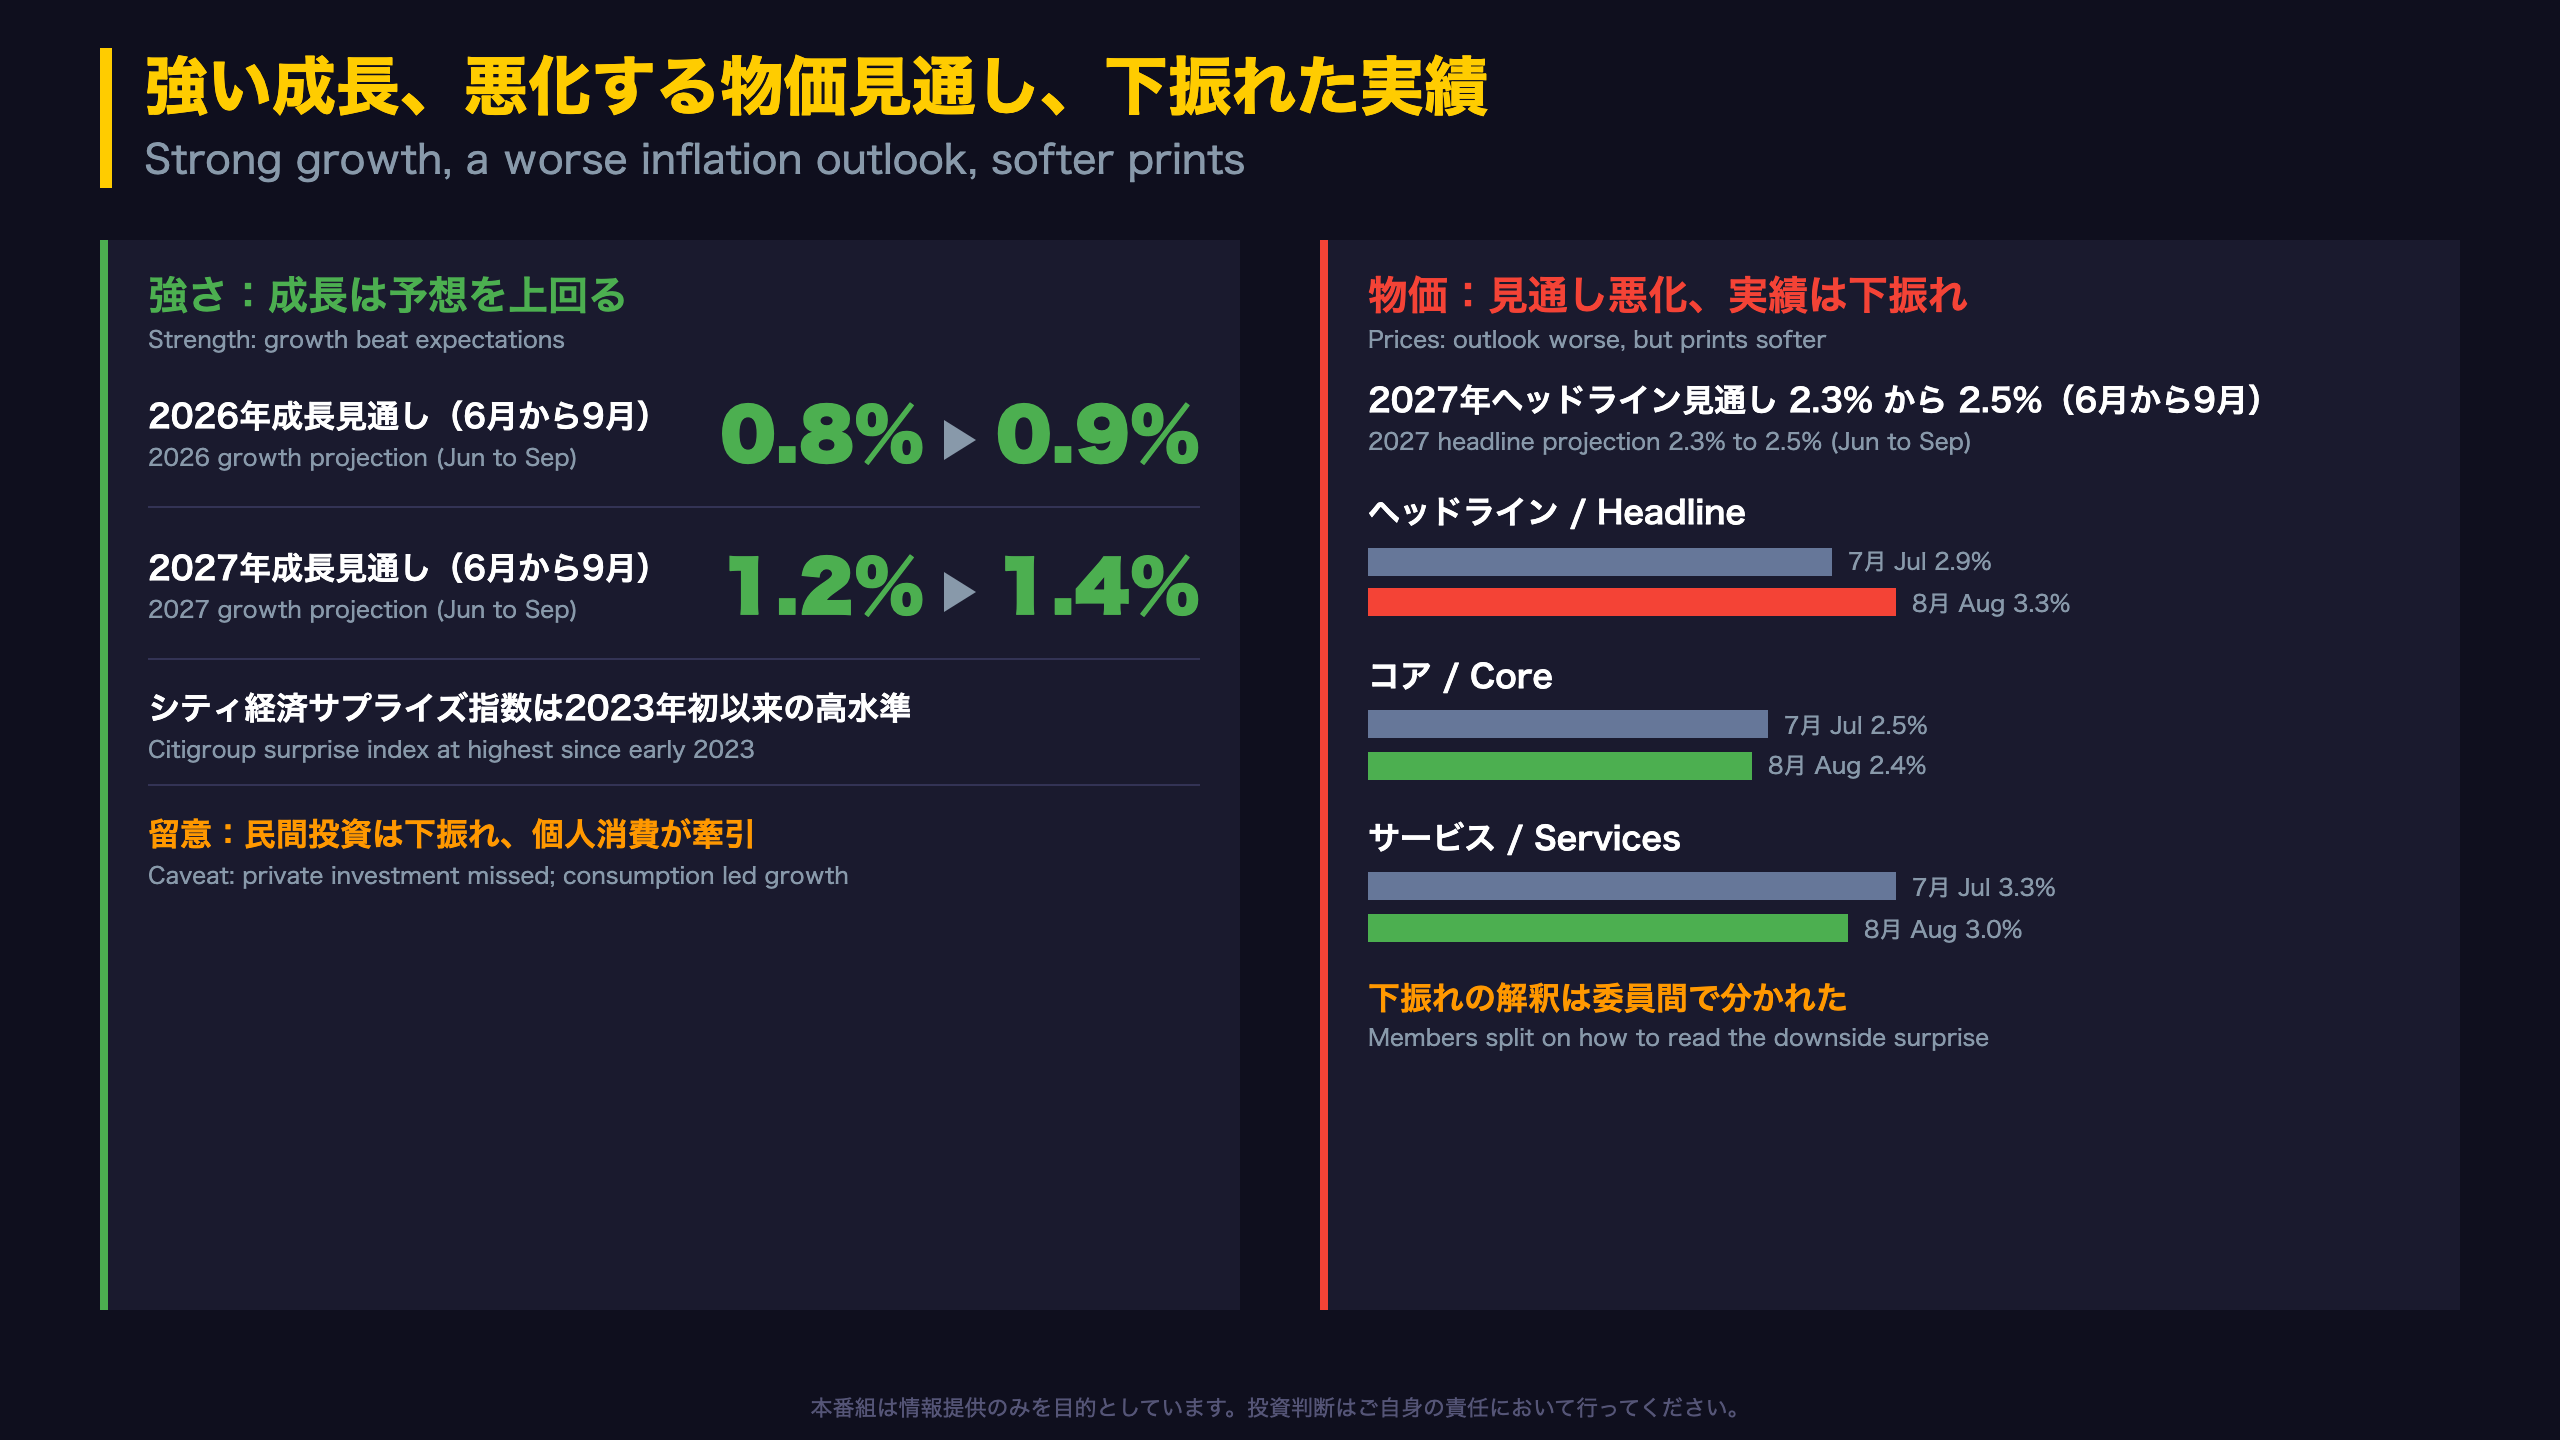
📈 Staff raised growth projections to 0.9% (2026) and 1.4% (2027) and lifted 2027 inflation to 2.5%. Yet August core inflation eased to 2.4% and services to 3.0%, slightly below expectations.
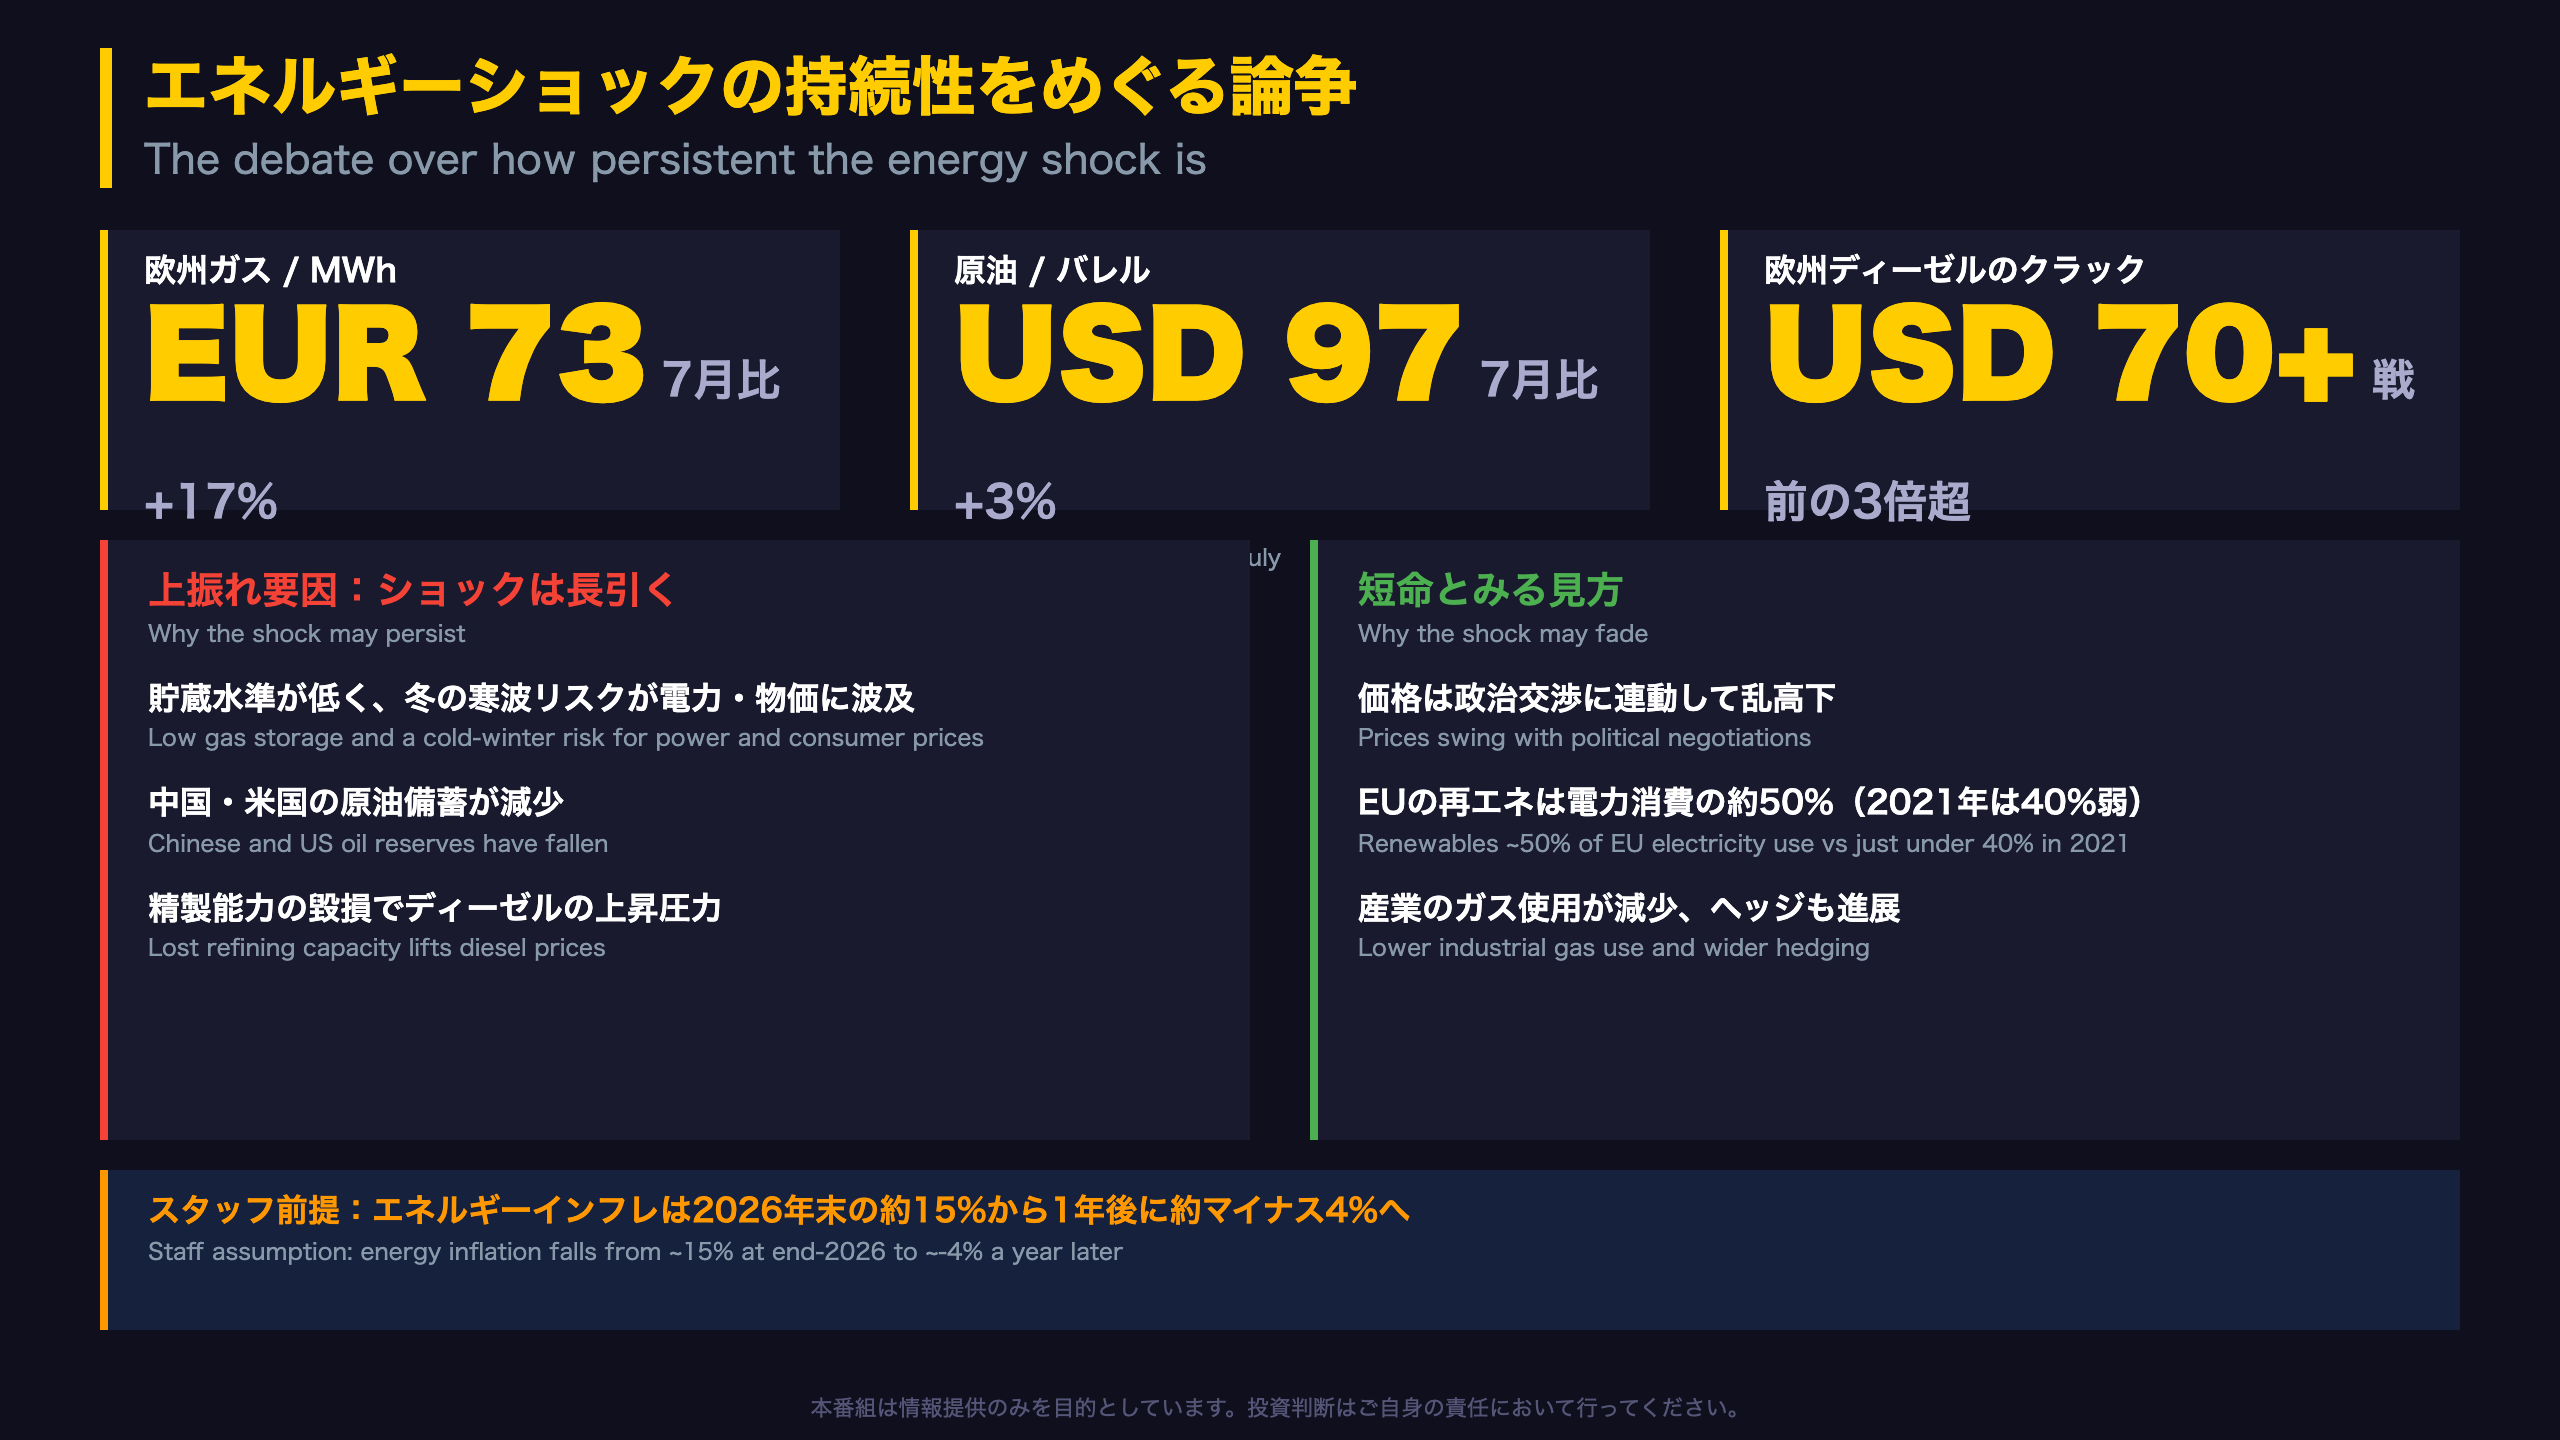
⚠️ The big debate: how persistent is the energy shock? Gas at EUR 73/MWh is 17% above July, but prices have swung with political talks, and some members see the shock as shorter-lived.
💡 Markets price 84bp of hikes by end-2027, while the analyst survey points to a plateau at 2.50%. The Council deliberately gave no guidance on the rate path.
The Ultimate Summary:全委員一致の25bp利上げ、先行きは白紙
What this document is
The ECB publishes an anonymised Account of each monetary policy meeting about four weeks after the decision. Unlike the Fed’s minutes, it rarely attributes views to named policymakers; the wording (‘all members’, ‘some’, ‘it was argued’) is the signal. This account covers the 9-10 September 2026 meeting in Berlin and was released on 8 October 2026.
The decision
The Governing Council raised the three key rates by 25bp, lifting the deposit facility rate (the ECB’s main policy rate) from 2.25% to 2.50%. The account states that all members supported the proposal by Chief Economist Philip Lane.
Compared with June
- Growth projections for 2026 and 2027 rose by 0.1 and 0.2 percentage points to 0.9% and 1.4%.
- Headline inflation projections for 2027 and 2028 rose by 0.2 and 0.1 points to 2.5% and 2.1%.
- Core inflation is projected above 2% throughout the horizon (2.5%, 2.6%, 2.3%).
International context
The account notes that US market pricing points to one or two Fed hikes in 2026, so both central banks are discussing tightening, not easing, which is unusual in this cycle. Euro area policymakers also stress that the AI investment boom dominates US growth far more than euro area growth.
Independent take
The key feature is the mix: a unanimous vote paired with a refusal to pre-commit. For rate markets, the debate is less about whether the ECB can hike and more about how many more steps are needed. Next catalyst: the next account, due 26 November 2026.
強い成長、悪化する物価見通し、下振れた実績
Reading the growth surprise
The account describes second-quarter euro area growth as better than expected, supported by private consumption, government spending (Germany’s fiscal package and Next Generation EU funding) and exports. The Citigroup Economic Surprise Index, a gauge of how data compare with forecasts, stood at its highest since early 2023. For an English-speaking reader, note that this is a surprise measure, not a level of growth.
But not all of it is robust
- Private investment surprised to the downside.
- One argument was that consumption was mechanically helped by lower-than-expected inflation, so the worse inflation outlook could slow spending.
- The Council debated whether the upside reflected less negative supply shocks (the temporary summer dip in energy prices) or positive demand shocks (AI and fiscal policy). The first would reduce inflation risks; the second would raise them.
Inflation: outlook up, data down
August flash HICP was 3.3% (July: 2.9%), driven by energy at 14.3%, partly reflecting refining margins. Yet headline readings in July and August were slightly below expectations, core slipped to 2.4% and services to 3.0%. A downside surprise in core ‘might indicate some overestimation of the strength of indirect effects’. Others argued the low prints were largely backward-looking (for example, very low food inflation unlikely to persist).
Compared with June
In June, services inflation had jumped to 3.5% and policymakers worried about persistence; by August it had fallen to 3.0%. Growth projections rose from 0.8% and 1.2% to 0.9% and 1.4%.
Why it matters
The ECB’s three-part reaction function weighs the inflation outlook, underlying inflation and policy transmission. A soft core print weakens the second leg, while higher energy paths strengthen the first. Watch services inflation in the next releases.
エネルギーショックの持続性をめぐる論争
Why energy dominates ECB thinking
Europe imports most of its energy, so oil, gas and refined fuels feed quickly into HICP inflation. The staff baseline uses futures curves, which imply a steep fall in energy prices through 2027. The account shows members disagreeing on whether markets are too optimistic about that path.
The numbers
- Oil: USD 97/bbl, up 3% since July (about USD 94 in June).
- European gas: EUR 73/MWh, up 17% since July, the highest since early 2023 and roughly 50% above the June level of about EUR 50.
- European diesel crack spreads (the margin between refined diesel and crude): above USD 70/bbl, more than three times pre-war.
Bearish-for-inflation vs. benign readings
Upside risks: low gas storage heading into winter; falling Chinese and US oil inventories; destroyed refining capacity in the Middle East and Russia; El Niño and heatwaves lifting food commodities.
Benign view: the shock is ‘essentially politically driven’; prices track US-Iran talks; renewables supplied around 50% of EU electricity by end-2025 versus just under 40% in 2021; industrial gas demand is lower and many firms hedged. One speaker suggested a settlement of the Middle East conflict this autumn was possible.
Market perspective
This is the Eurozone equivalent of the debate on whether supply shocks should be ‘looked through’. In June the Council concluded it no longer could; in September the focus moves to refining and gas. Staff projects energy inflation falling from almost 15% at end-2026 to about -4% a year later, which mechanically pulls headline inflation toward 2% in 2027. If futures prove too low, that base effect disappears. Watch gas storage data and diesel margins.
二次的効果は「まだ見えない」が、油断は禁物
What are ‘second-round effects’?
The ECB distinguishes direct effects (higher fuel prices), indirect effects (energy costs feeding into goods and services prices) and second-round effects (wages and expectations adjusting upward, making inflation self-sustaining). This is the core of the ECB’s worry after 2022, and it is why wage data matter so much for rate decisions.
The evidence so far
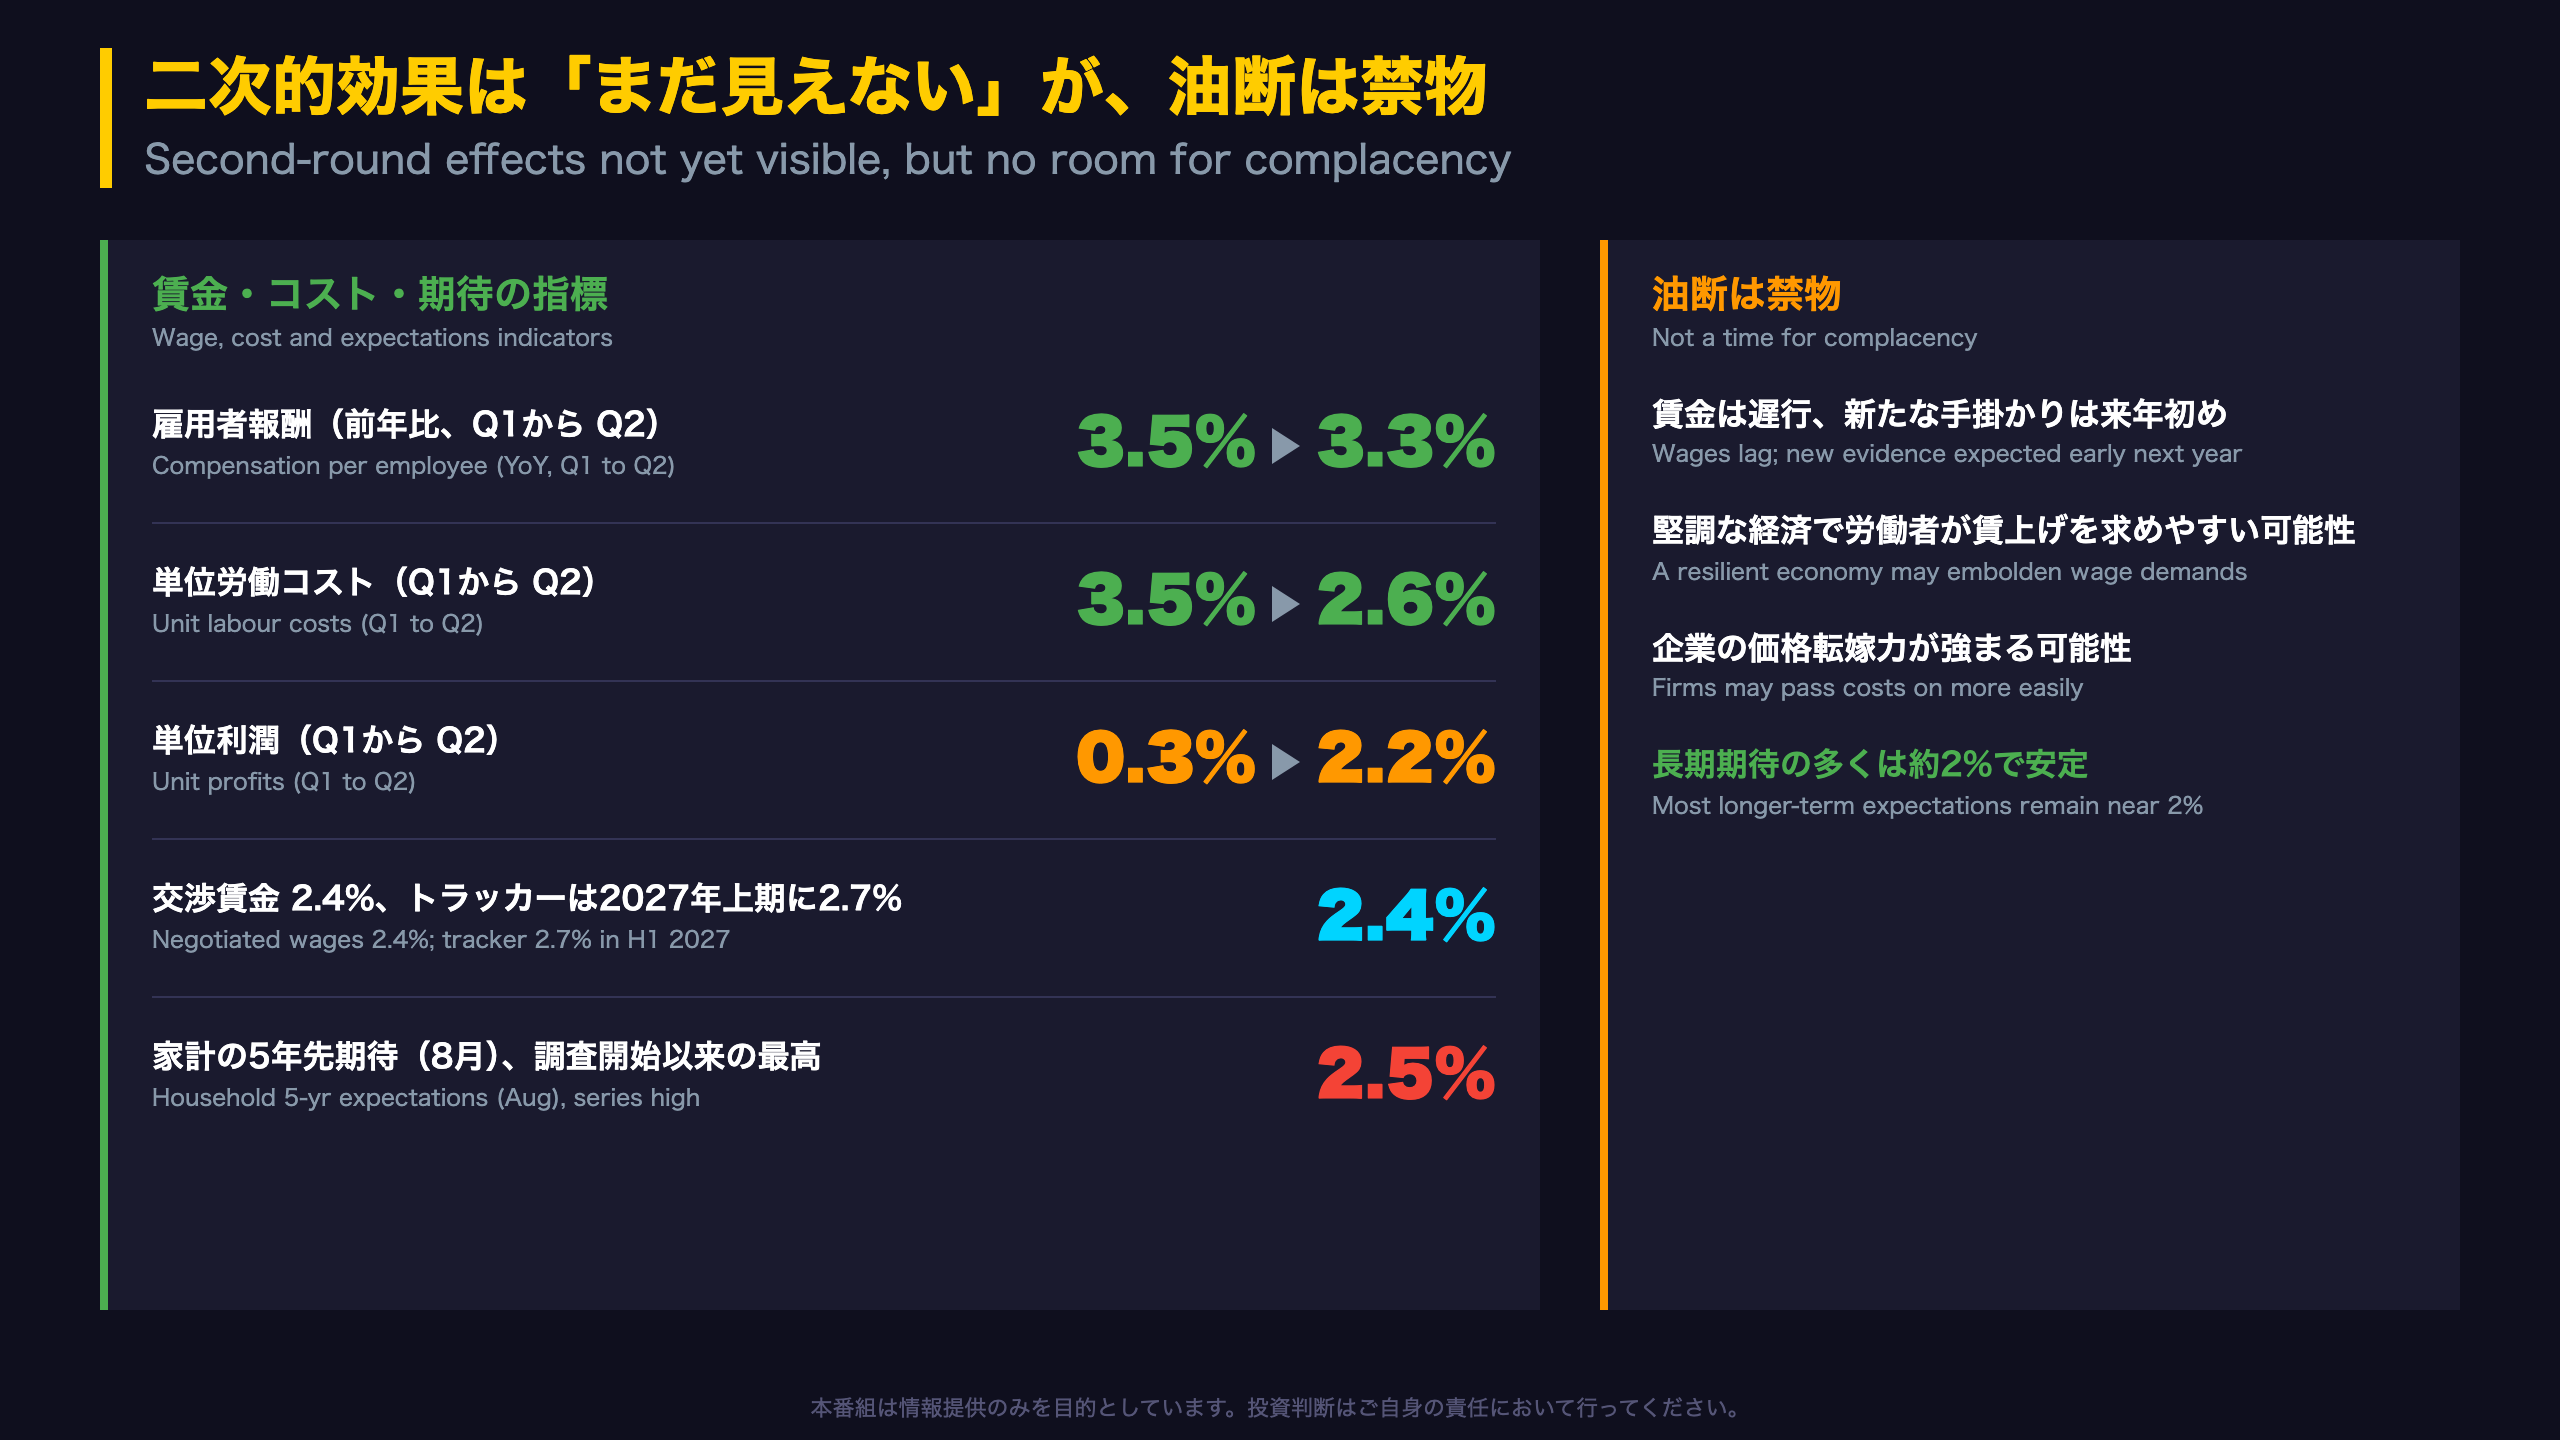
- Compensation per employee: 3.3% in Q2 (Q1: 3.5%).
- Unit labour costs: 2.6% (Q1: 3.5%), helped by faster productivity.
- Unit profits: 2.2% (Q1: 0.3%), so profits, not labour costs, are absorbing the shock for now.
- Negotiated wages: 2.4%, with the ECB wage tracker pointing to 2.7% in H1 2027.
The account concludes there had been no second-round effects on wages so far.
Expectations
The Consumer Expectations Survey showed five-year-ahead household expectations at 2.5% in August, the highest since the series began in late 2022. The account warns that such surveys ‘typically contain some bias’, so changes over time matter more than levels. Market-based and expert measures of longer-term expectations remain near 2%.
Contrasting views
Optimists see a cooling labour market and AI-related job threats moderating wage claims. Cautious voices note that wages react with lags, and that a resilient economy and the memory of 2022 could embolden workers to seek lost purchasing power. Staff already assume a partial wage response in the projections.
Implication
This is a ‘wait for evidence’ stance: absent clear wage acceleration, the case for additional hikes depends more on energy and services prices. Key checkpoint: early-2027 wage settlements.
金利パスは白紙:市場とサーベイの乖離、中立の発信
Market vs. survey: the key gap
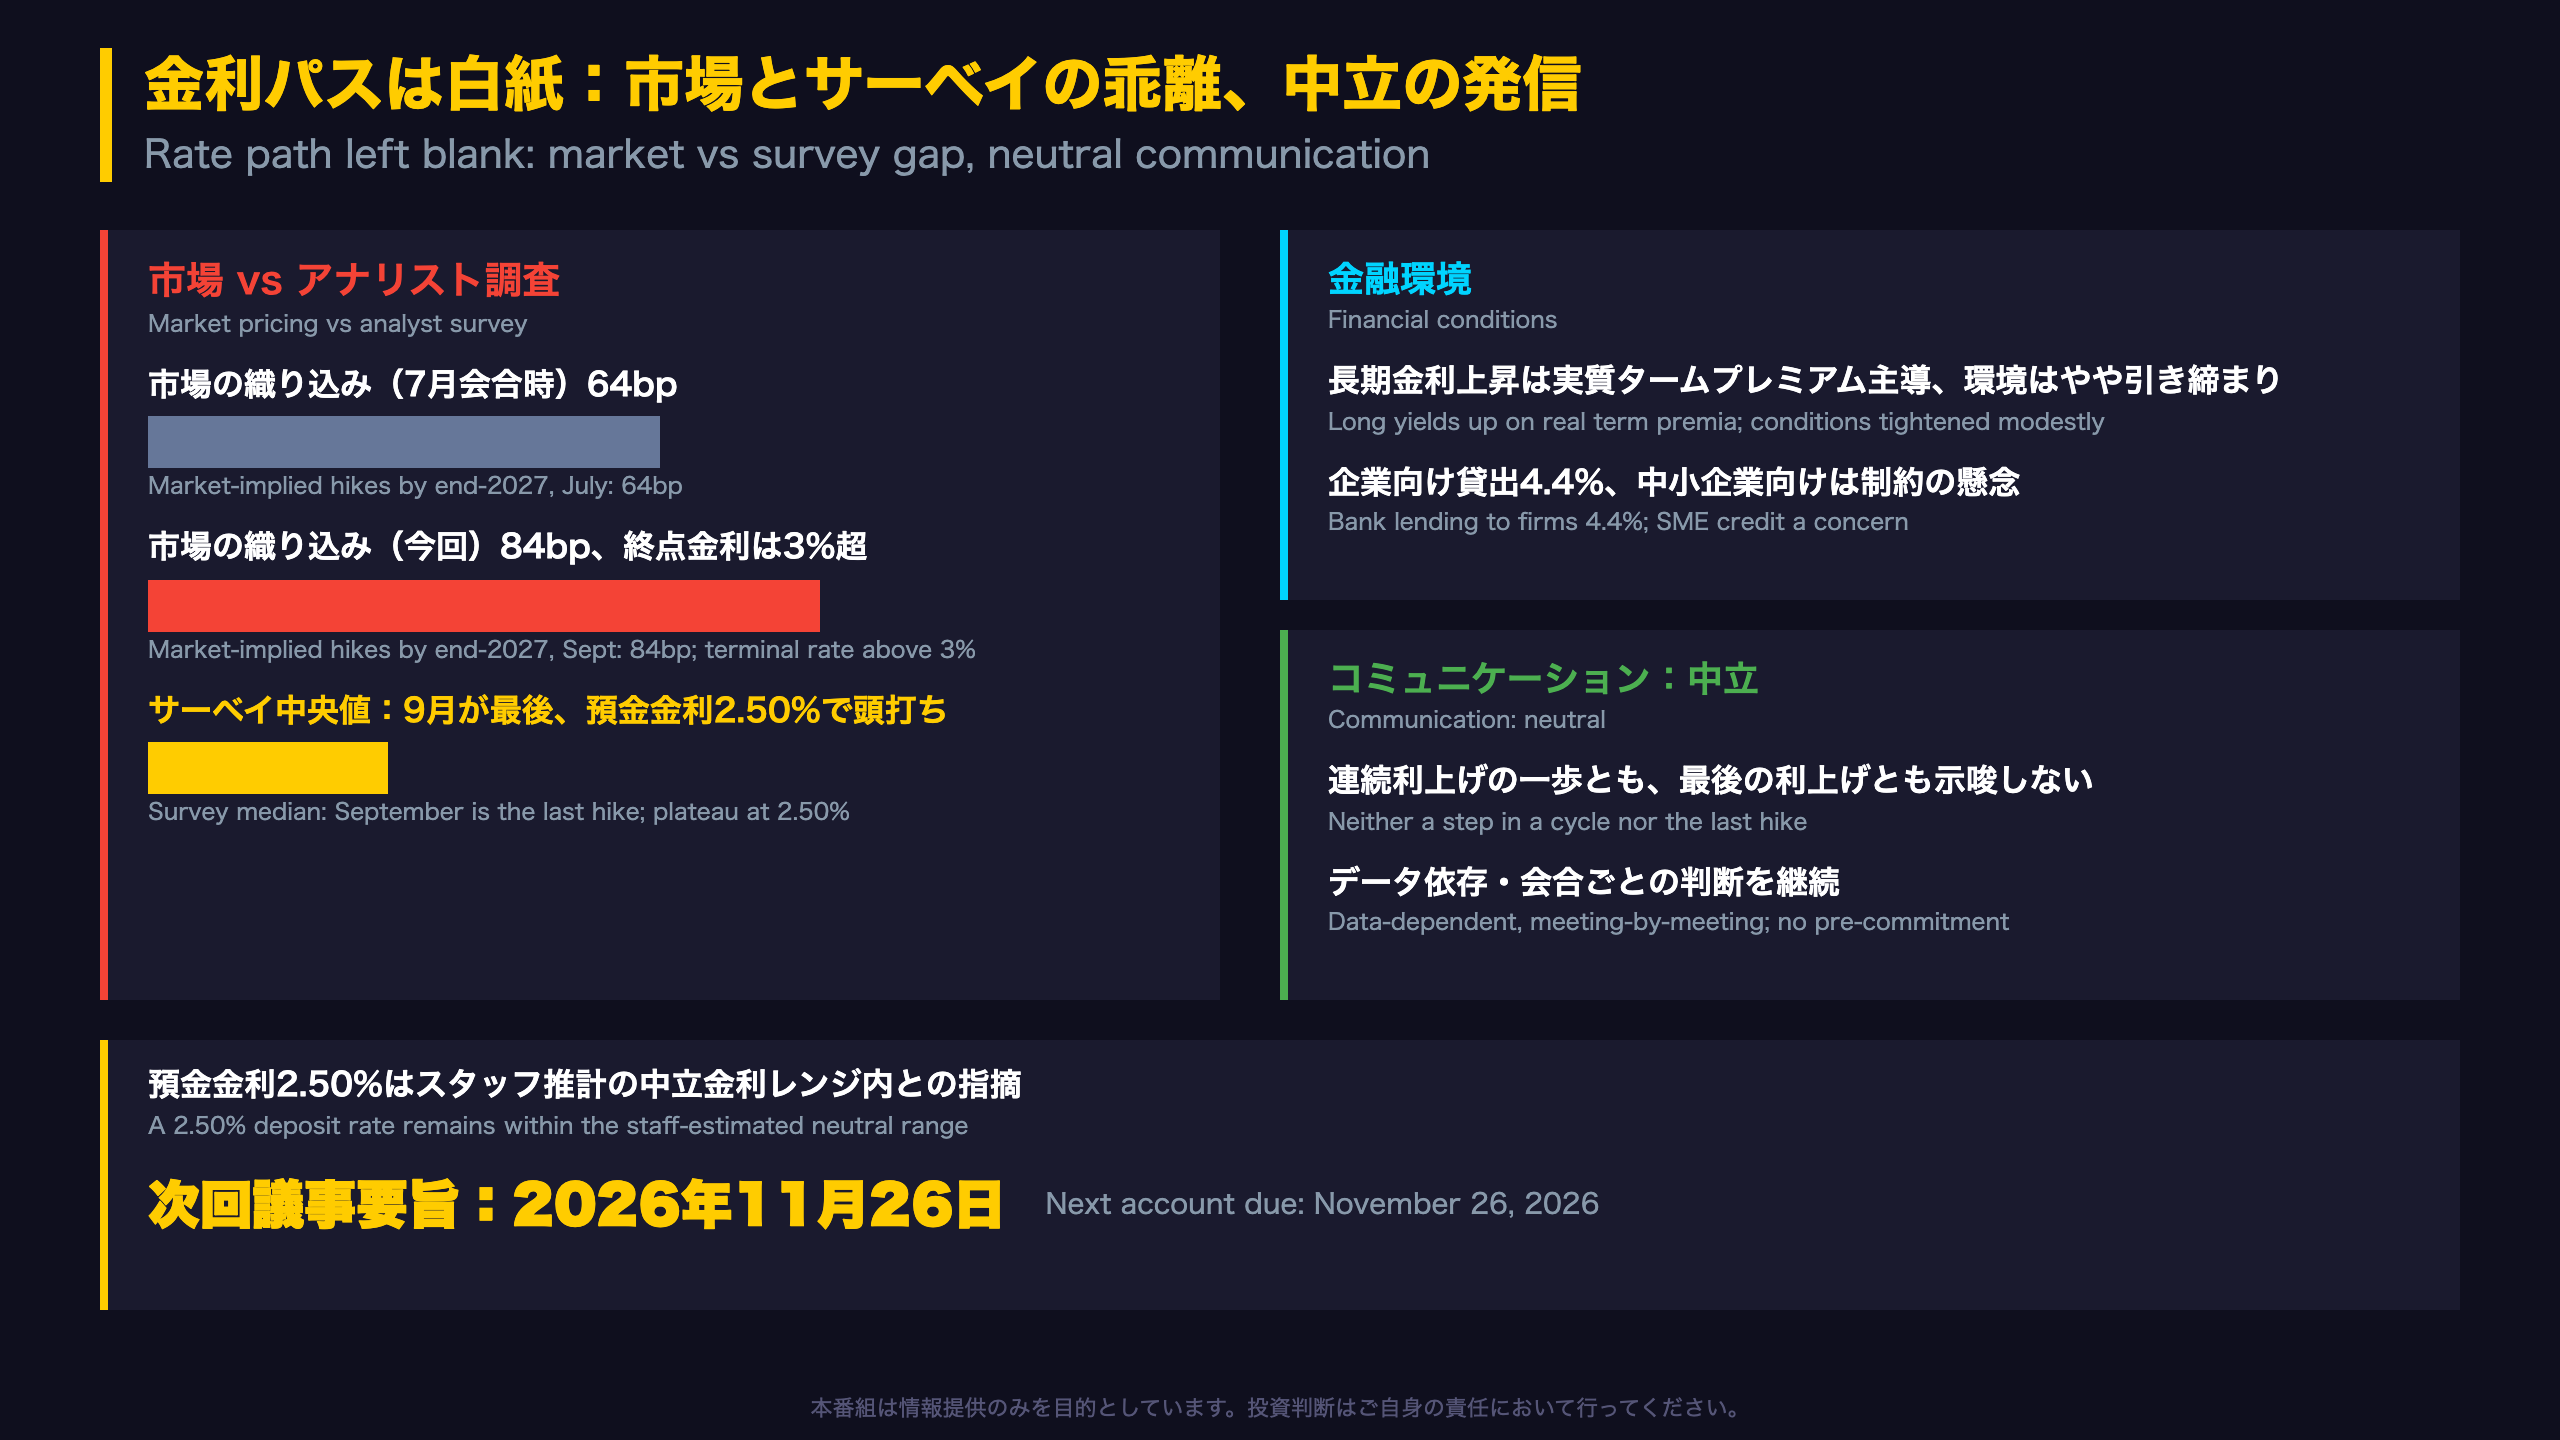
Market pricing implies 84bp of hikes by end-2027, up from 64bp at the July meeting, with the terminal rate above 3% for the first time in this hiking cycle. The Survey of Monetary Analysts, plus Bloomberg and Reuters polls, point to a 2.50% plateau after September. The account attributes part of the gap to risk premia in the curve and the earlier timing of surveys, but says the reasons ‘warranted further examination’.
Why long yields matter
The global rise in long-dated yields originated in the US (heavy issuance, fiscal worries, inflation uncertainty). In the euro area, the long end rose mainly through higher real term premia, reflecting more debt supply and fiscal uncertainty, while the front end moved on inflation compensation and rate expectations. Staff estimate that the share of euro area term-premium variation explained by US term-premium shocks has fallen to about 20%. Sovereign spreads were stable.
Credit conditions
Bank lending to firms grew 4.4% y/y in July; lending rates were 3.8%. But growth is uneven: AI-related and larger firms obtain more credit, while SMEs, which rely on bank lending rather than private credit, may be squeezed. The account asks for further analysis.
Communication stance
The Council reiterated a data-dependent, meeting-by-meeting approach with no pre-commitment: neither ‘another step in a predetermined tightening cycle’ nor ‘the last rate hike’. One consideration: a 2.50% deposit rate remains within staff’s estimated neutral range, supporting a ‘proportionate’ response.
What to watch
Compare this with June, when members said waiting had lost its option value. Now the debate is about how much more is needed. Next account: 26 November 2026.
Disclaimer: This article is for informational purposes only. All investment decisions are made solely at your own risk.