📺 Watch the Full Video Analysis
This article was automatically generated by the NFC Market Live AI analysis system. (Updated: 2026-06-29 18:39 JST)
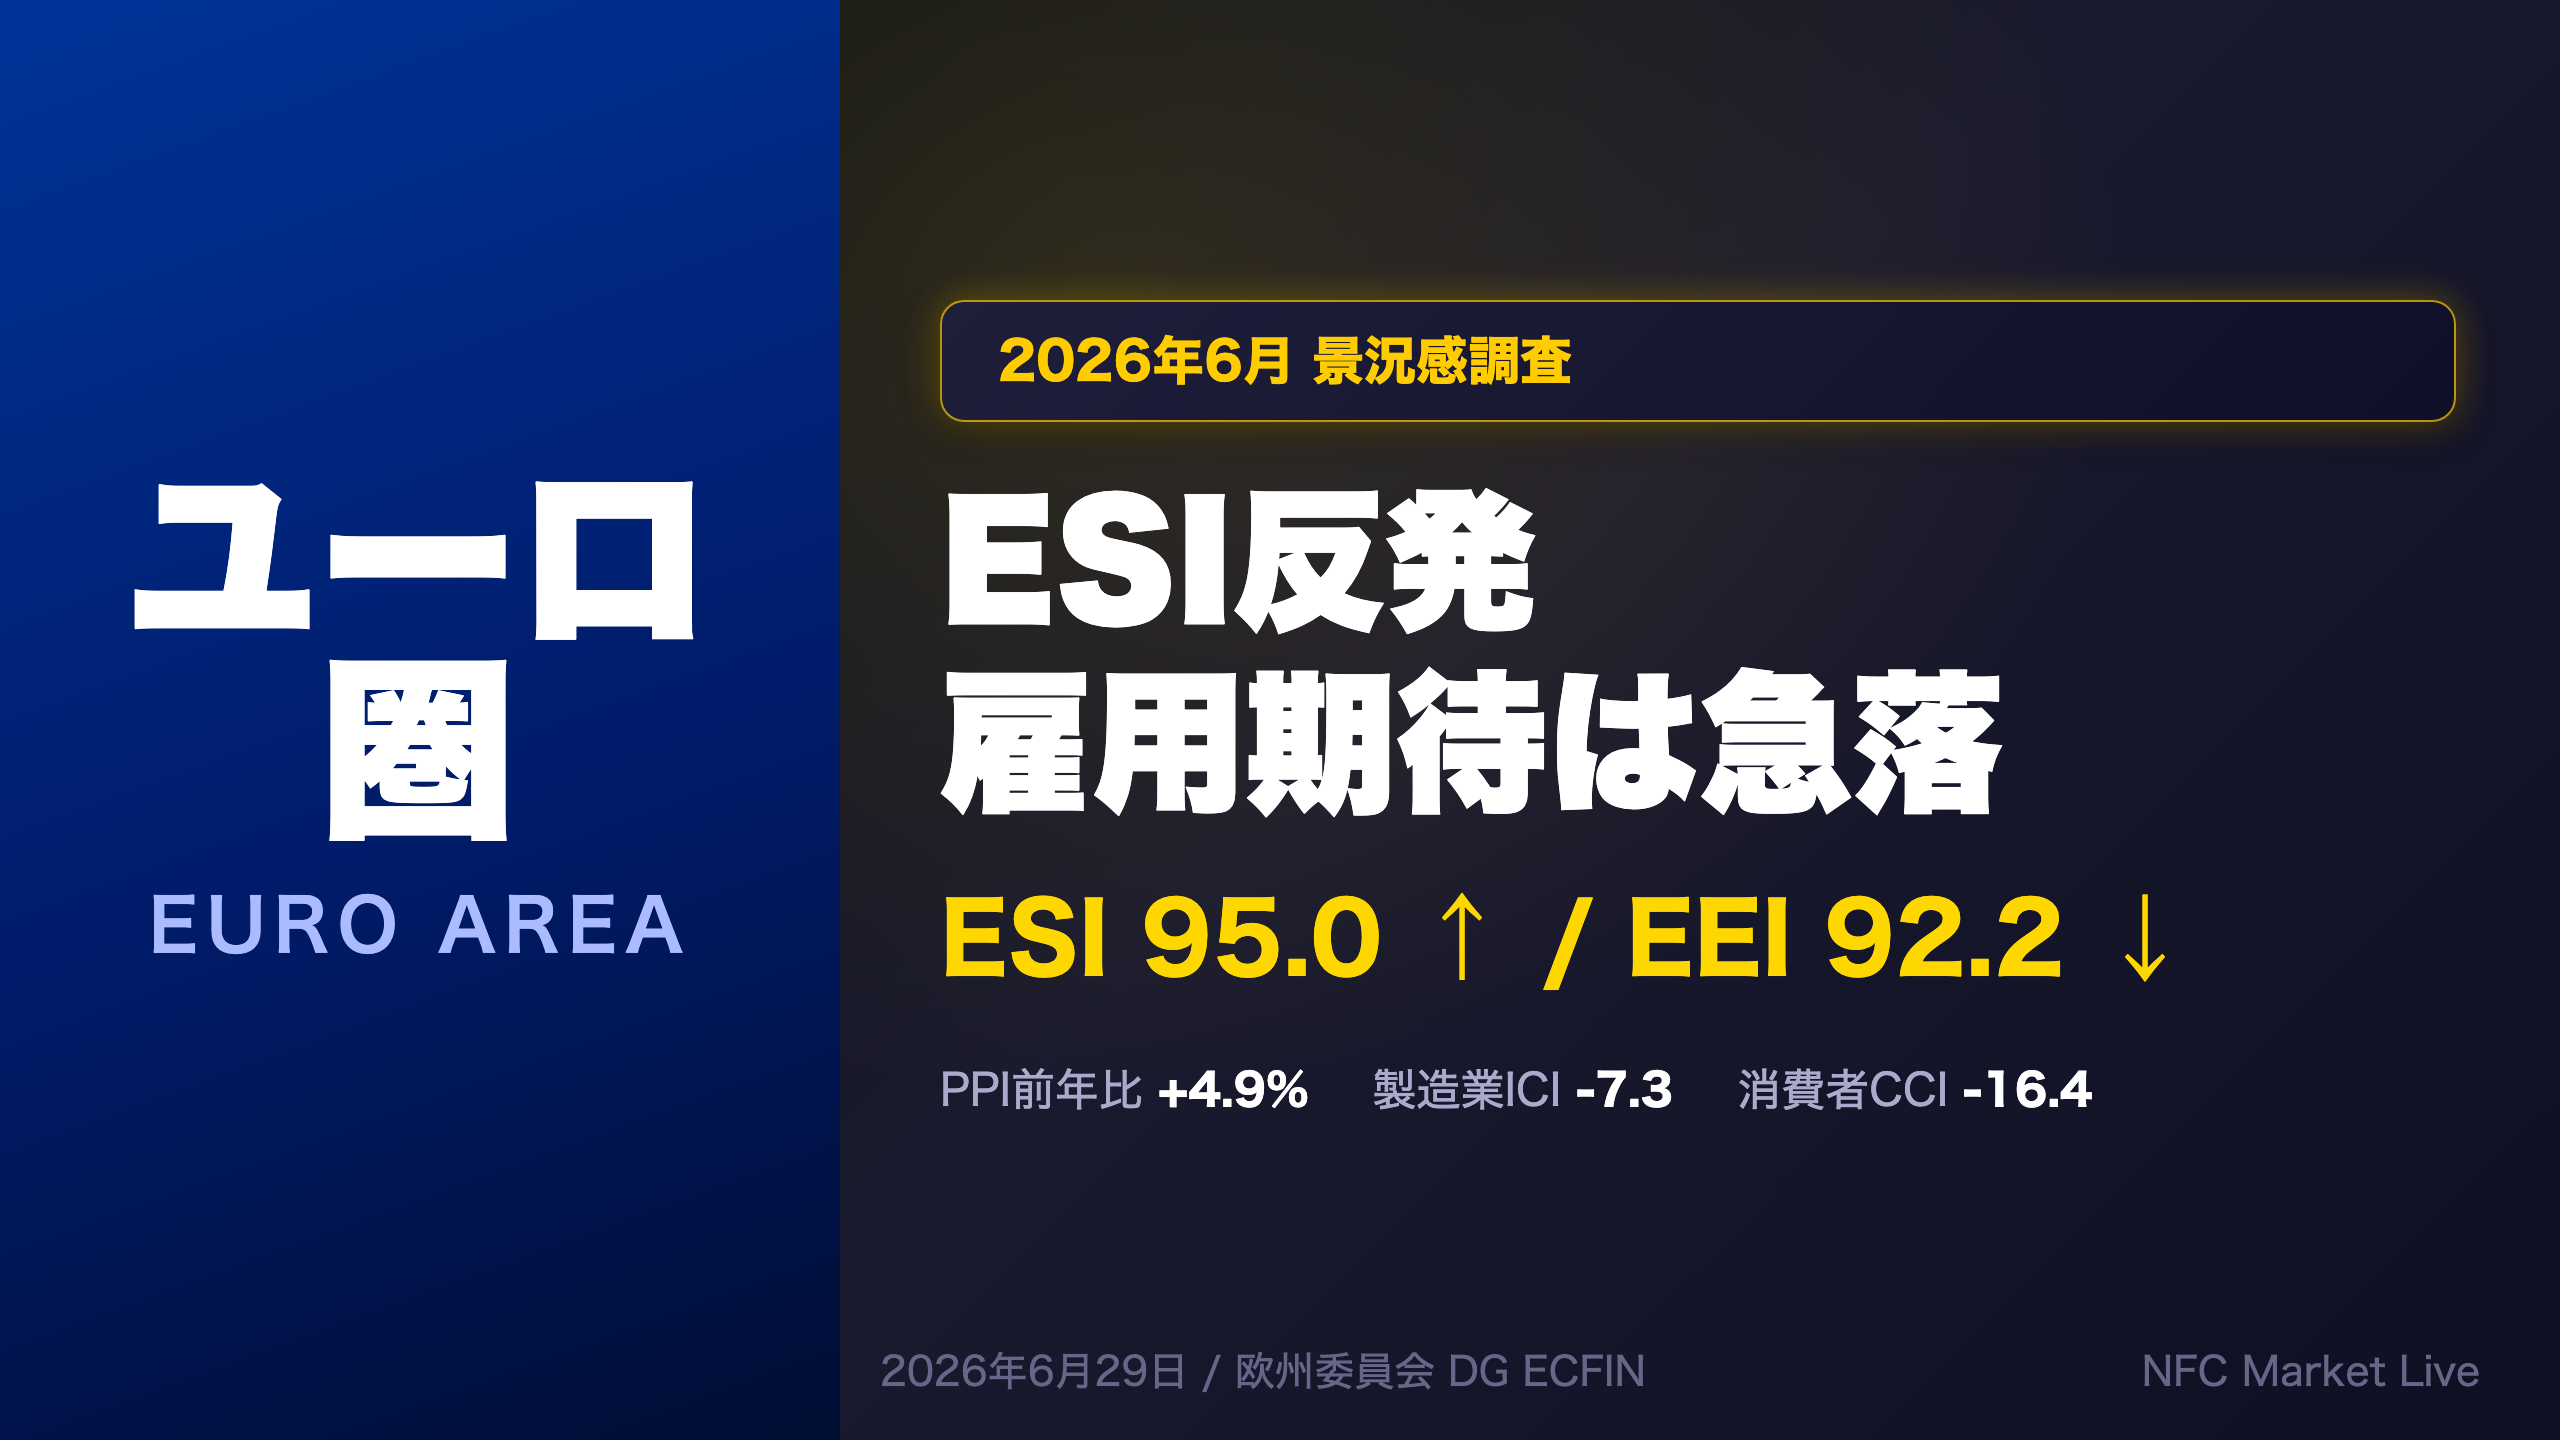
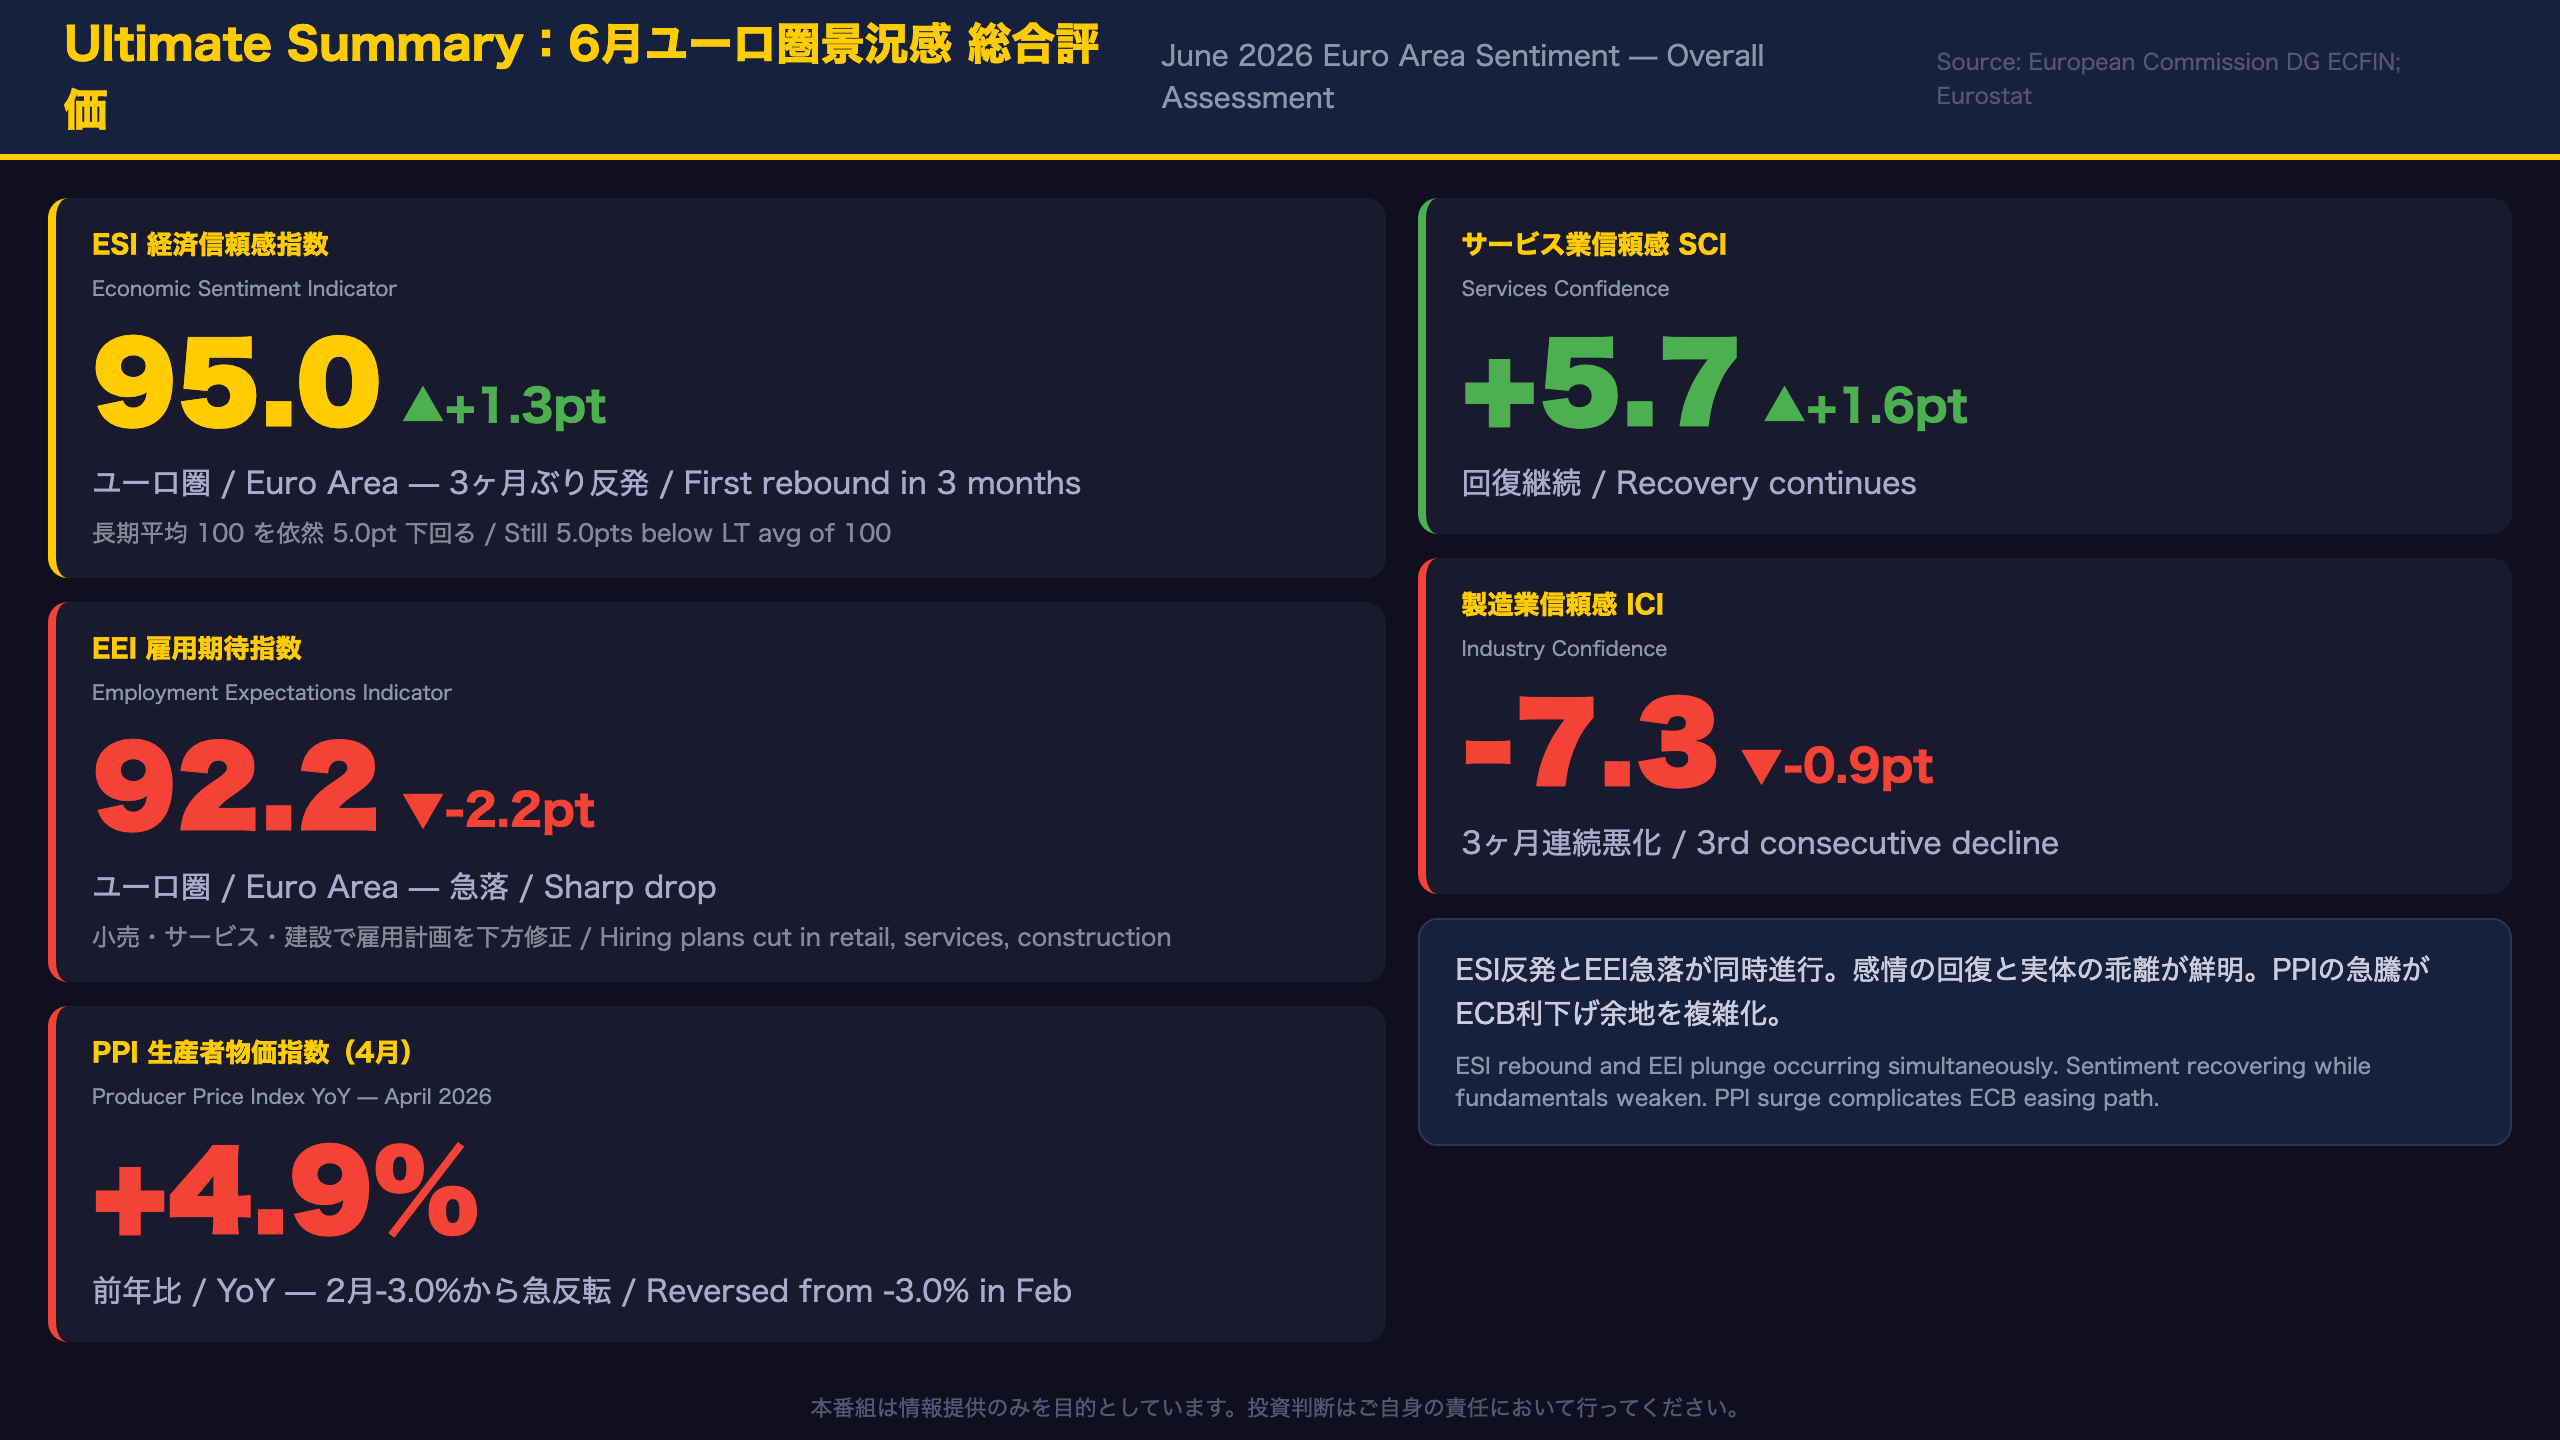
Euro Area ESI rose +1.3pts to 95.0 in June 2026, but the Employment Expectations Index (EEI) plunged -2.2pts to 92.2. Meanwhile, PPI surged to +4.9% YoY in April. We break down what this divergence means for ECB policy and EUR/JPY for Japanese investors holding euro-denominated assets.
Ultimate Summary: 6月ユーロ圏景況感の総合評価
Euro Area Sentiment June 2026: A Month of Contradictions
What Is the ESI and Why Does It Matter?
The Economic Sentiment Indicator (ESI) is a composite index published monthly by the European Commission’s Directorate-General for Economic and Financial Affairs (DG ECFIN). It aggregates confidence surveys across five sectors: industry, services, retail trade, construction, and consumers. A reading of 100 represents the long-term average (2000–2025); values above 100 indicate above-average optimism, while values below signal below-average confidence.
The ESI is one of the key inputs the European Central Bank (ECB) uses in its “economic analysis” pillar when assessing the growth outlook — alongside hard data like GDP and employment.
June 2026: The Headline Numbers
| Indicator | June 2026 | MoM Change | vs. LT Average |
|---|---|---|---|
| ESI (Euro Area) | 95.0 | +1.3pts | -5.0pts |
| EEI (Euro Area) | 92.2 | -2.2pts | -7.8pts |
| Industry ICI | -7.3 | -0.9pts | Below zero |
| Services SCI | +5.7 | +1.6pts | Positive |
| Consumer CCI | -16.4 | +1.8pts | Well below avg |
The Rare Divergence: ESI Up, EEI Down
It is relatively uncommon for the ESI and EEI to move in opposite directions in the same month. The EEI’s sharp drop of 2.2 points was driven by downward revisions to hiring plans across retail, services, and construction — with only industry edging up. This divergence suggests that while businesses feel slightly more optimistic about current conditions, they are becoming more cautious about adding headcount — a potential leading indicator of slower wage growth ahead.
PPI Surge: A Complication for the ECB
The Producer Price Index (PPI) for the euro area — published by Eurostat — measures factory-gate prices and typically feeds through to consumer prices (HICP) with a 6–12 month lag. After plunging to -3.0% year-on-year in February 2026, PPI surged to +4.9% in April. This is a significant reversal that complicates the ECB’s easing path. The ECB has cut rates multiple times since mid-2024; a sustained PPI rebound could reduce the justification for further cuts.
International Comparison
For context, the US ISM Manufacturing PMI and the Conference Board Consumer Confidence Index serve analogous roles in the US. The euro area’s manufacturing sector has been underperforming its US counterpart for much of 2025–2026, reflecting Europe’s greater exposure to China demand weakness and energy price volatility.
Implications for EUR/JPY
Japanese investors holding EUR/JPY positions face a complex backdrop: the Bank of Japan (BOJ) is in a gradual tightening cycle, while the ECB has been easing. This policy asymmetry has generally been a headwind for EUR/JPY. The EEI’s sharp drop and manufacturing’s continued weakness could reinforce expectations for further ECB easing, while the PPI surge introduces uncertainty. The net direction for EUR/JPY cannot be determined from this data alone.
ESI・EEIの時系列トレンドと国別格差
ESI/EEI Time Series and Country-Level Divergence
The ESI Recovery in Context
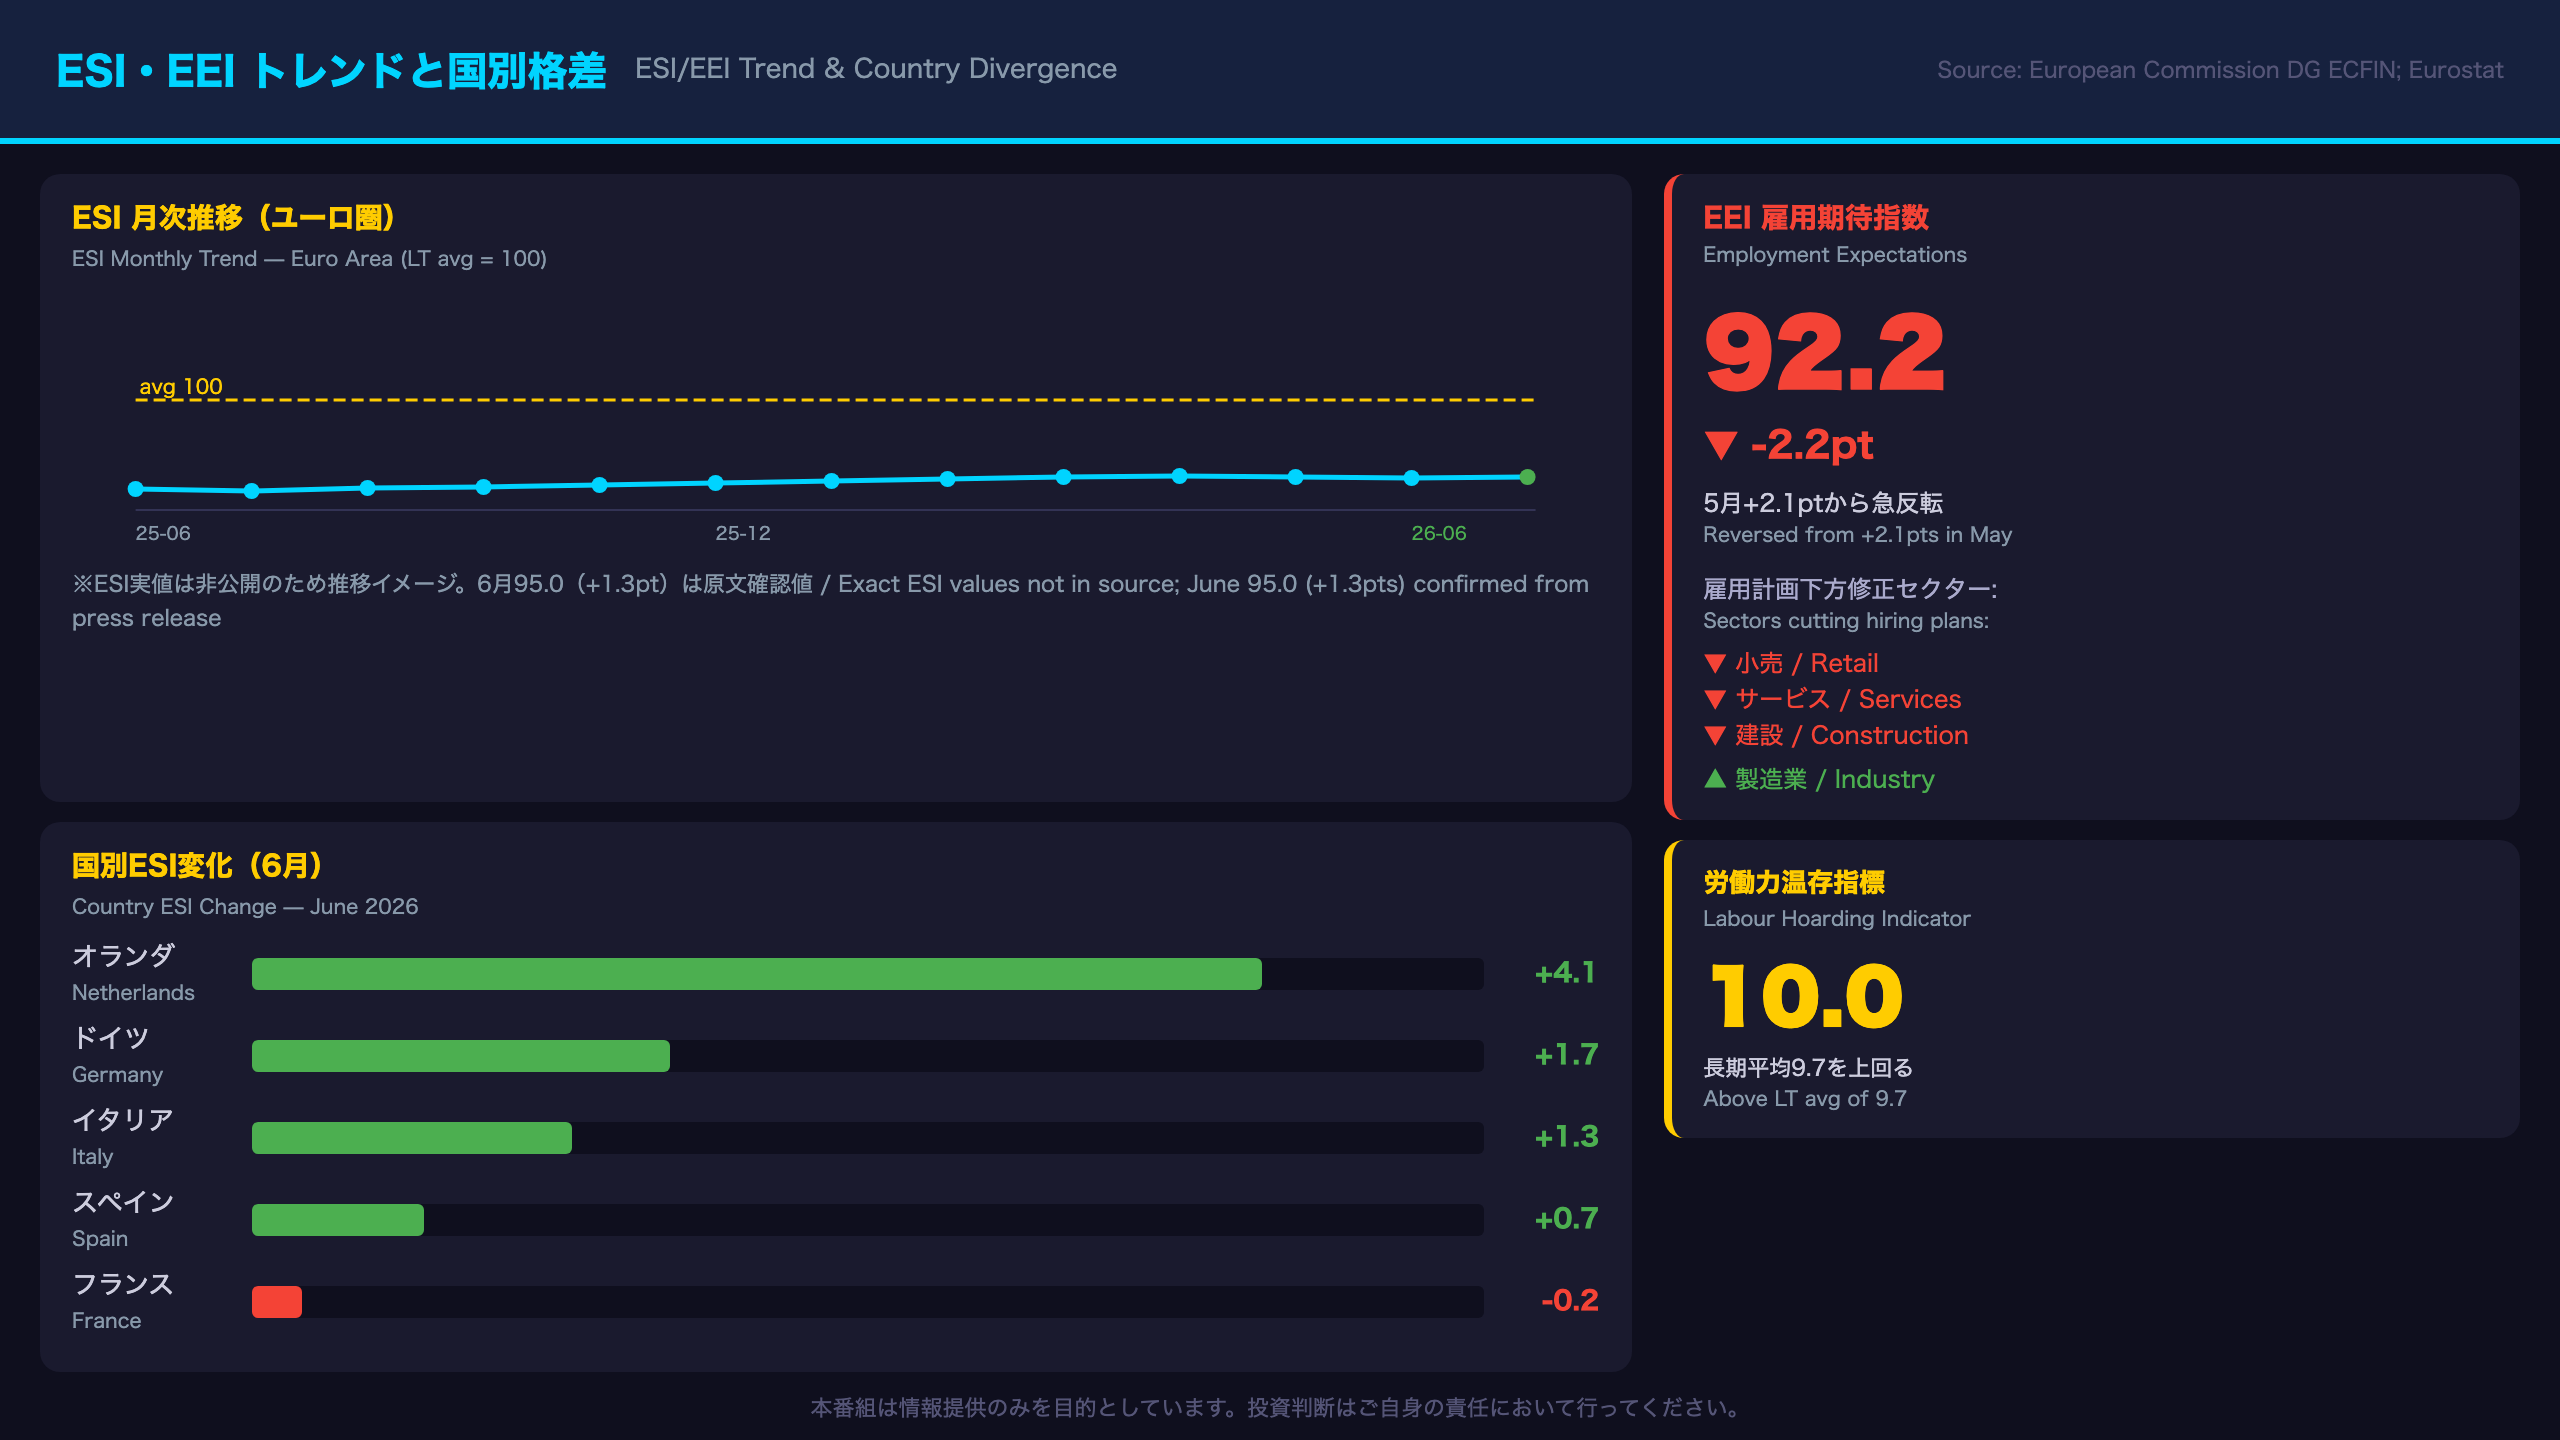
The ESI for the euro area has now recovered for two consecutive months (May: +0.3pts, June: +1.3pts) following a sharp decline in March-April 2026. However, at 95.0, it remains 5 points below the long-term average of 100 (calculated over 2000–2025). This is better described as a “gradual recovery from a trough” rather than a return to expansion territory.
Country-Level Breakdown
The country-level data reveals important divergences within the euro area:
- Netherlands (+4.1pts): The standout performer this month, though the drivers are not detailed in the press release.
- Germany (+1.7pts): Noteworthy given Germany’s heavy manufacturing dependence. The improvement likely reflects services and consumer components rather than industry, given that the overall ICI fell to -7.3.
- Italy (+1.3pts): Continues the Southern European recovery narrative driven by tourism and services.
- France (-0.2pts): Essentially flat, consistent with France’s more domestically-oriented, services-heavy economy.
This country-level divergence illustrates the classic challenge for the ECB: setting a single interest rate for economies at different cyclical positions — what economists call the “one-size-fits-all” problem.
EEI Reversal: A Warning Signal?
The EEI’s sharp reversal — from +2.1pts in May to -2.2pts in June — is notable. The Employment Expectations Indicator is considered a leading indicator for wage growth, which in turn feeds into services inflation. If the EEI continues to decline, it could reduce upward pressure on wages and, by extension, on services HICP — potentially giving the ECB more room to cut rates.
The EU Labour Hoarding Indicator at 10.0 (above its LT average of 9.7) suggests firms are retaining workers rather than expanding headcount — a pattern consistent with cautious business sentiment.
What to Watch Next
The next Business and Consumer Survey release is expected in late July 2026. Key questions: Does the EEI decline for a second consecutive month? Does the manufacturing ICI stabilize or continue its three-month slide? These will be critical inputs for the ECB’s September 2026 policy meeting.
セクター別信頼感の深掘り:製造業 vs サービス業の乖離
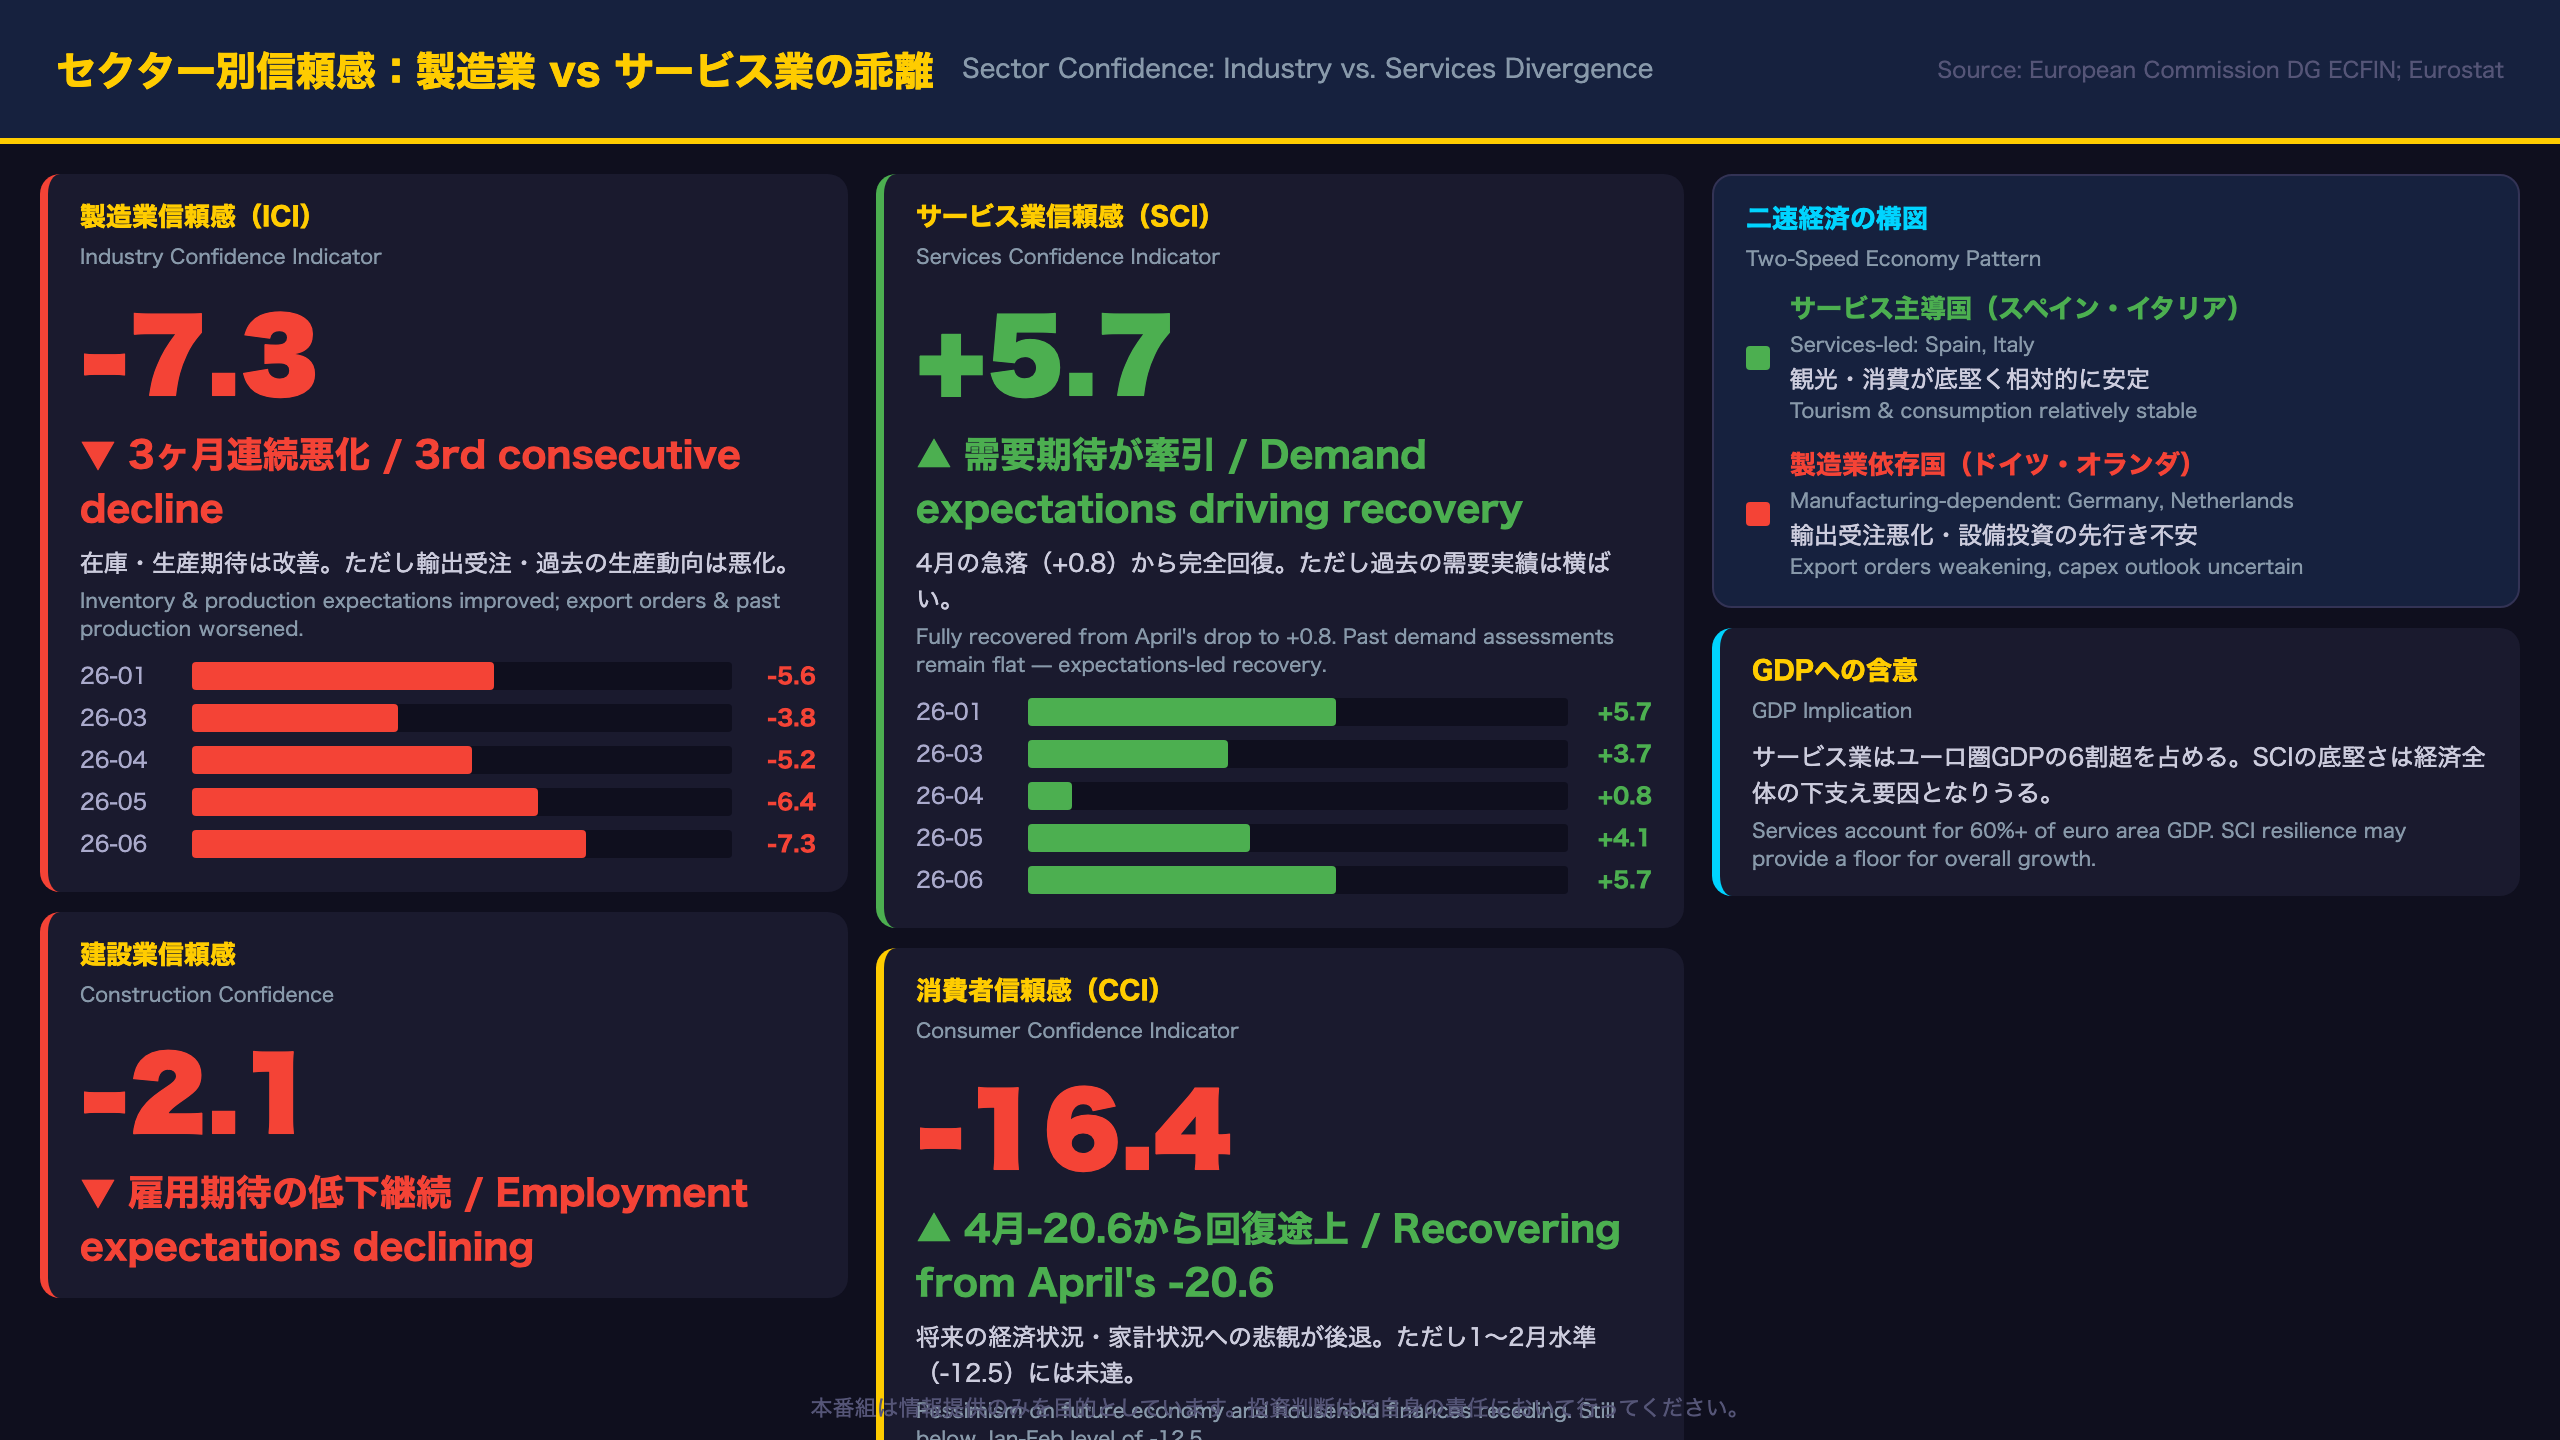
Sector Deep Dive: The Manufacturing vs. Services Structural Divergence
Manufacturing ICI: Three Months of Consecutive Decline
The Industry Confidence Indicator (ICI) measures manufacturing managers’ assessments of order books, production expectations, and finished goods inventories. A negative reading indicates below-average confidence.
The ICI’s trajectory in 2026 tells a story of false dawn followed by renewed weakness:
– January 2026: -5.6 (sharp recovery from -12.4 in December)
– March 2026: -3.8 (best reading since mid-2025)
– June 2026: -7.3 (third consecutive monthly decline)
The January-March recovery likely reflected optimism ahead of anticipated trade policy clarity. The subsequent deterioration from April onward — with export order books and past production assessments worsening — suggests that external demand headwinds have reasserted themselves.
Services SCI: Resilience with a Caveat
The Services Confidence Indicator (SCI) at +5.7 has fully recovered from April’s sharp drop to +0.8. Services account for over 60% of euro area GDP, making this the single most important sector for the overall economic outlook.
However, the press release notes an important nuance: the improvement was driven by forward-looking demand expectations, while assessments of past demand and past business situation remained broadly stable. This “expectations-led” recovery pattern warrants monitoring — if actual demand data fails to confirm the optimism, a reversal is possible.
Consumer Confidence: Recovering but Scarred
The Consumer Confidence Indicator (CCI) at -16.4 has improved for two consecutive months from April’s trough of -20.6. However, it remains well below the January-February 2026 level of approximately -12.5, suggesting that the shock from March-April has not been fully absorbed.
The Two-Speed Economy Implication
The manufacturing-services divergence creates a “two-speed economy” within the euro area:
– Manufacturing-dependent economies (Germany, Netherlands): Face continued headwinds from weak export demand and industrial confidence.
– Services/tourism-driven economies (Spain, Italy): Benefit from the services sector’s relative resilience.
This divergence complicates ECB policy: a rate cut that supports manufacturing-dependent Germany may be less necessary for already-recovering Spain. This is the classic “one-size-fits-all” challenge of euro area monetary policy.
PPI急騰の深層:ECB政策への含意
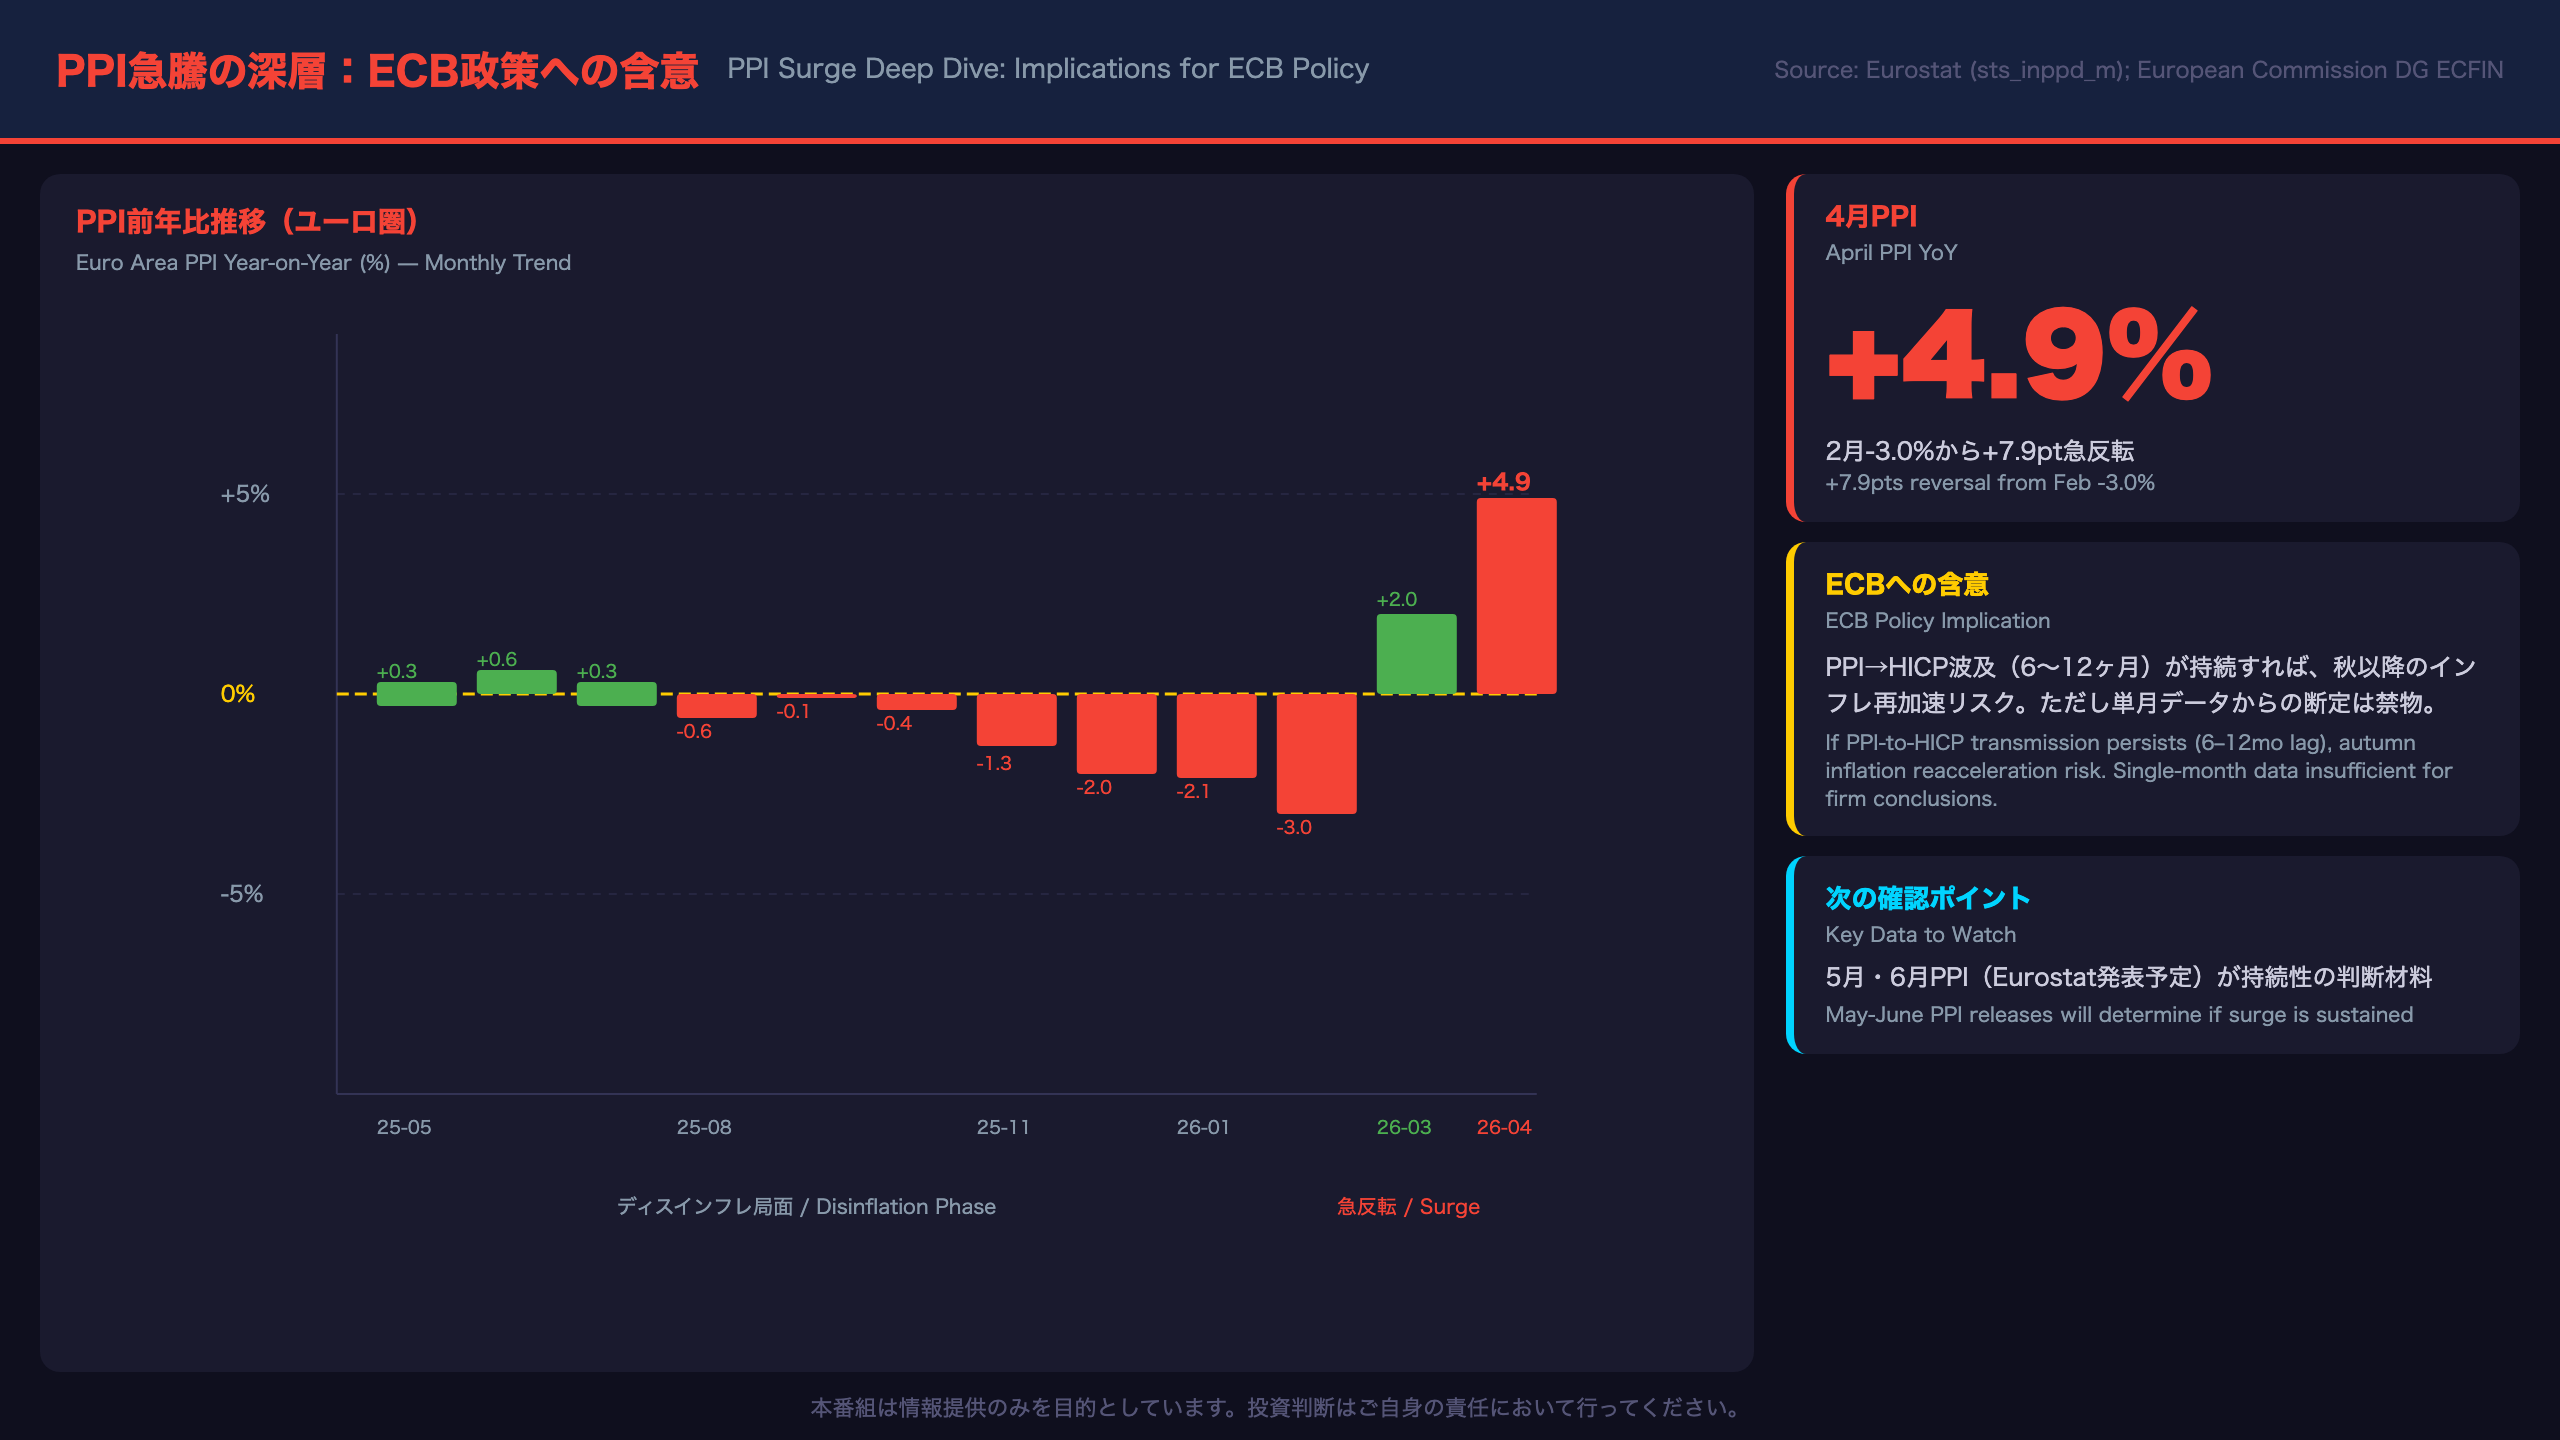
PPI Surge Deep Dive: From Disinflation to Rapid Reversal
The Full PPI Picture
The euro area Producer Price Index (PPI), published by Eurostat under the series sts_inppd_m, measures prices at the factory gate — before goods reach consumers. It is widely used as a leading indicator for consumer price inflation (HICP), with an estimated transmission lag of 6–12 months.
| Month | PPI YoY | Context |
|---|---|---|
| Aug 2025 | -0.6% | Turned negative |
| Feb 2026 | -3.0% | Deepest deflation |
| Mar 2026 | +2.0% | Sharp reversal |
| Apr 2026 | +4.9% | Accelerating |
The 7.9 percentage point swing from February to April is striking. For context, a move of this magnitude in a two-month period is unusual and warrants careful interpretation.
What Could Be Driving the Surge?
The source data does not provide a breakdown by component (energy, intermediate goods, consumer goods, capital goods). Based on general knowledge of PPI dynamics, energy price volatility is frequently the dominant driver of large month-to-month swings. Tariff effects — particularly if new trade barriers were implemented in early 2026 — could also be contributing to intermediate goods price increases. However, these are level-C inferences; the data alone cannot confirm the cause.
ECB Policy Implications: A Genuine Complication
The ECB’s dual mandate focuses on price stability (HICP target of 2% over the medium term) and supporting growth. The PPI surge creates a genuine tension:
The case for caution on further cuts: If PPI at +4.9% feeds through to HICP in H2 2026, the ECB may find itself having cut rates too aggressively. The ECB’s own models suggest PPI-to-HICP transmission of roughly 0.2–0.4x over 6–12 months, implying potential HICP upside of 1–2 percentage points — though this is a general estimate, not a forecast.
The case for continued easing: The EEI’s sharp drop and manufacturing ICI’s continued decline suggest demand-side inflation pressures remain subdued. If the PPI surge is energy-driven and temporary, the underlying disinflationary trend may reassert itself.
Key Data to Watch
Eurostat’s May and June 2026 PPI releases will be critical for determining whether the surge is sustained or reverting. The ECB’s July 2026 policy meeting statement — and whether it explicitly references PPI dynamics — will also be a key signal.
インプリケーション:ECB政策とEUR/JPYへの示唆
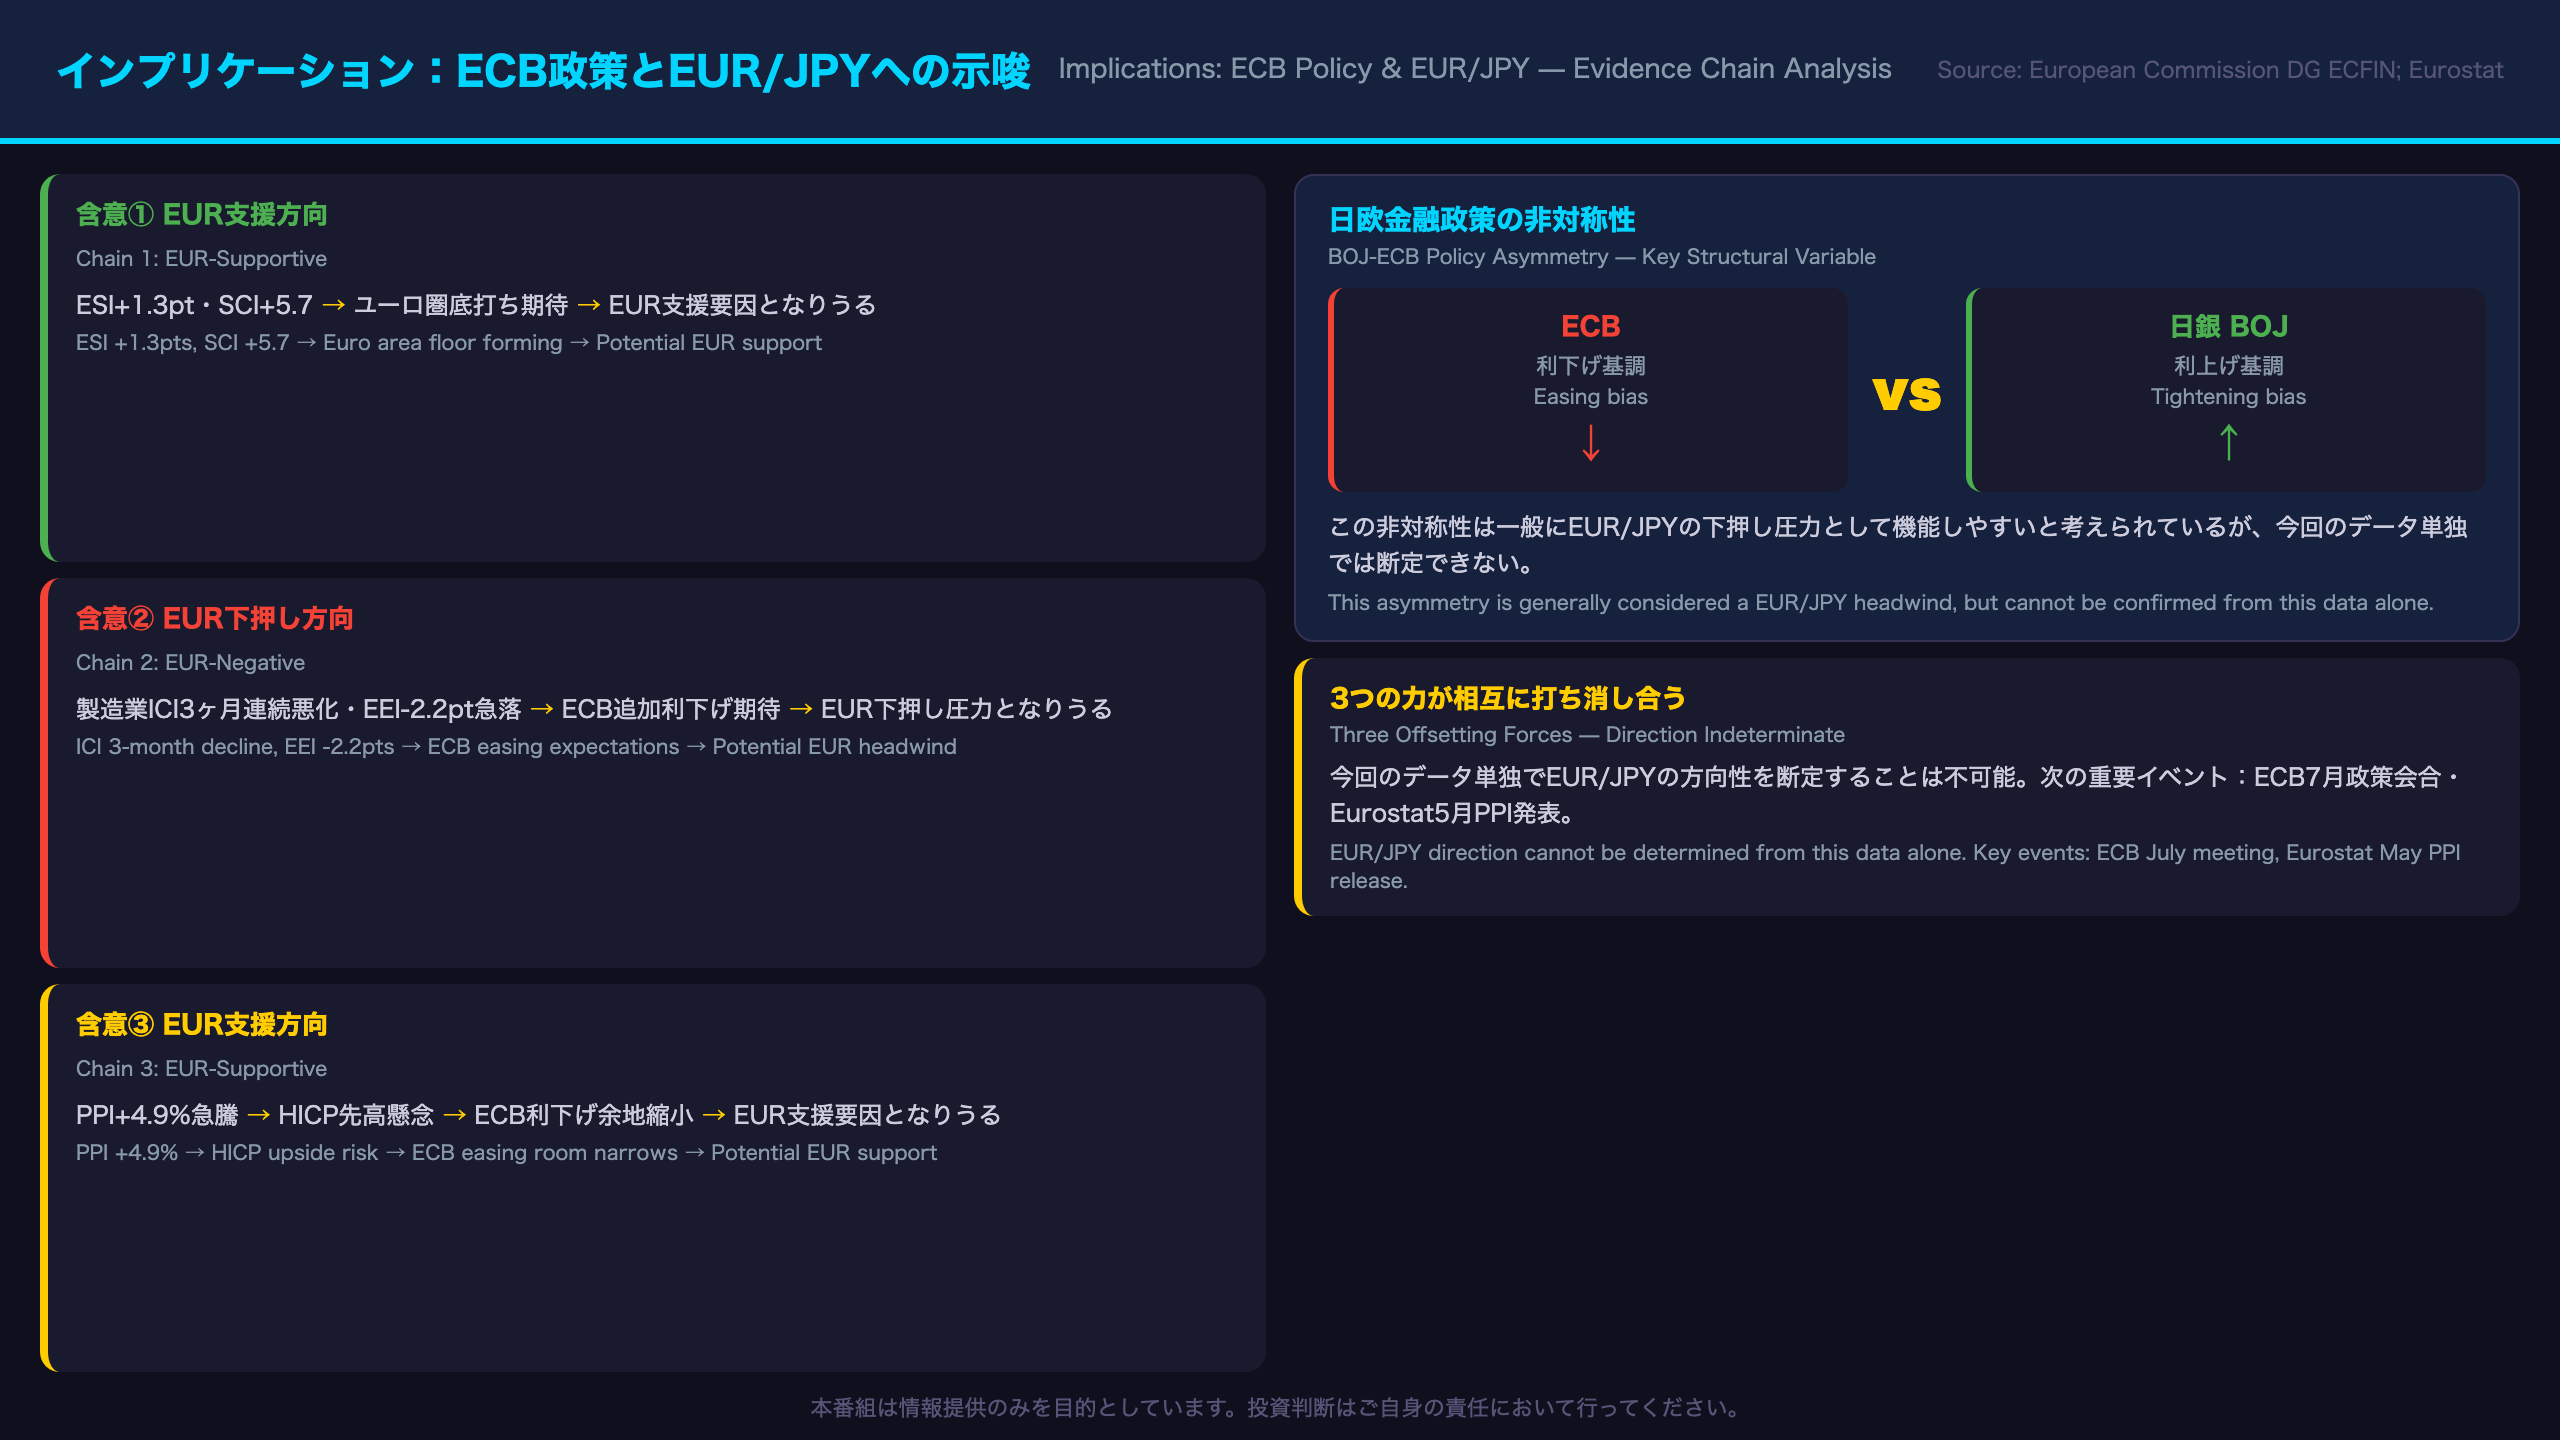
Market Implications: ECB Policy and EUR/JPY
The Evidence Chain Framework
Following the required evidence chain format: [data fact] → [economic mechanism] → [market implication]:
Chain 1 (EUR-supportive):
ESI +1.3pts to 95.0 + Services SCI +5.7 → Signals euro area economic floor forming → May support EUR by reducing expectations of sharp growth deterioration
Chain 2 (EUR-negative):
Industry ICI -7.3 (3rd consecutive decline) + EEI -2.2pts → Signals weakening real economy and labor market caution → May reinforce ECB easing expectations → Potential EUR headwind
Chain 3 (EUR-supportive):
PPI +4.9% YoY in April (from -3.0% in February) → If sustained, may feed through to HICP in H2 2026 → Reduces ECB’s room to cut rates → Potential EUR support
These three chains are operating simultaneously and in partially offsetting directions. EUR/JPY direction cannot be determined from this data alone.
The BOJ-ECB Policy Asymmetry
For Japanese investors, the structural backdrop is the divergence between:
– Bank of Japan (BOJ): In a gradual tightening cycle, having exited negative interest rate policy in 2024 and continuing to raise rates cautiously.
– European Central Bank (ECB): In an easing cycle since mid-2024, having cut rates multiple times.
This policy asymmetry is generally considered a structural headwind for EUR/JPY — as Japanese rates rise and European rates fall, the interest rate differential that previously favored holding EUR over JPY narrows. However, exchange rates are determined by many factors beyond interest rate differentials, including risk sentiment, current account balances, and geopolitical developments.
Checklist for Japanese Euro-Asset Holders
EUR/JPY FX deposit holders: Monitor the narrowing of the Japan-Europe interest rate differential. If the BOJ continues tightening while the ECB eases, the carry trade rationale for holding EUR weakens.
Euro-denominated fund investors: Services sector resilience is a positive signal for euro area consumer and services equities. Manufacturing weakness is a headwind for German industrial stocks.
FX traders: Key upcoming events — ECB July 2026 policy meeting (watch for PPI references in the statement) and Eurostat May 2026 PPI release.
Explicit Caveats on General Assumptions
The mechanism “PPI surge → HICP acceleration → ECB rate cut pause” is generally accepted in economic theory but cannot be confirmed from a single month of PPI data. Similarly, “Japan-Europe rate differential narrowing → EUR/JPY decline” is a general principle, not a forecast. Actual market outcomes depend on many variables beyond this dataset.
Disclaimer: This article is for informational purposes only. All investment decisions are made solely at your own risk.