📺 Watch the Full Video Analysis
This article was automatically generated by the NFC Market Live AI analysis system. (Updated: 2026-08-27 17:45 JST)
📊 The ECB released July 2026 Monetary Developments data.
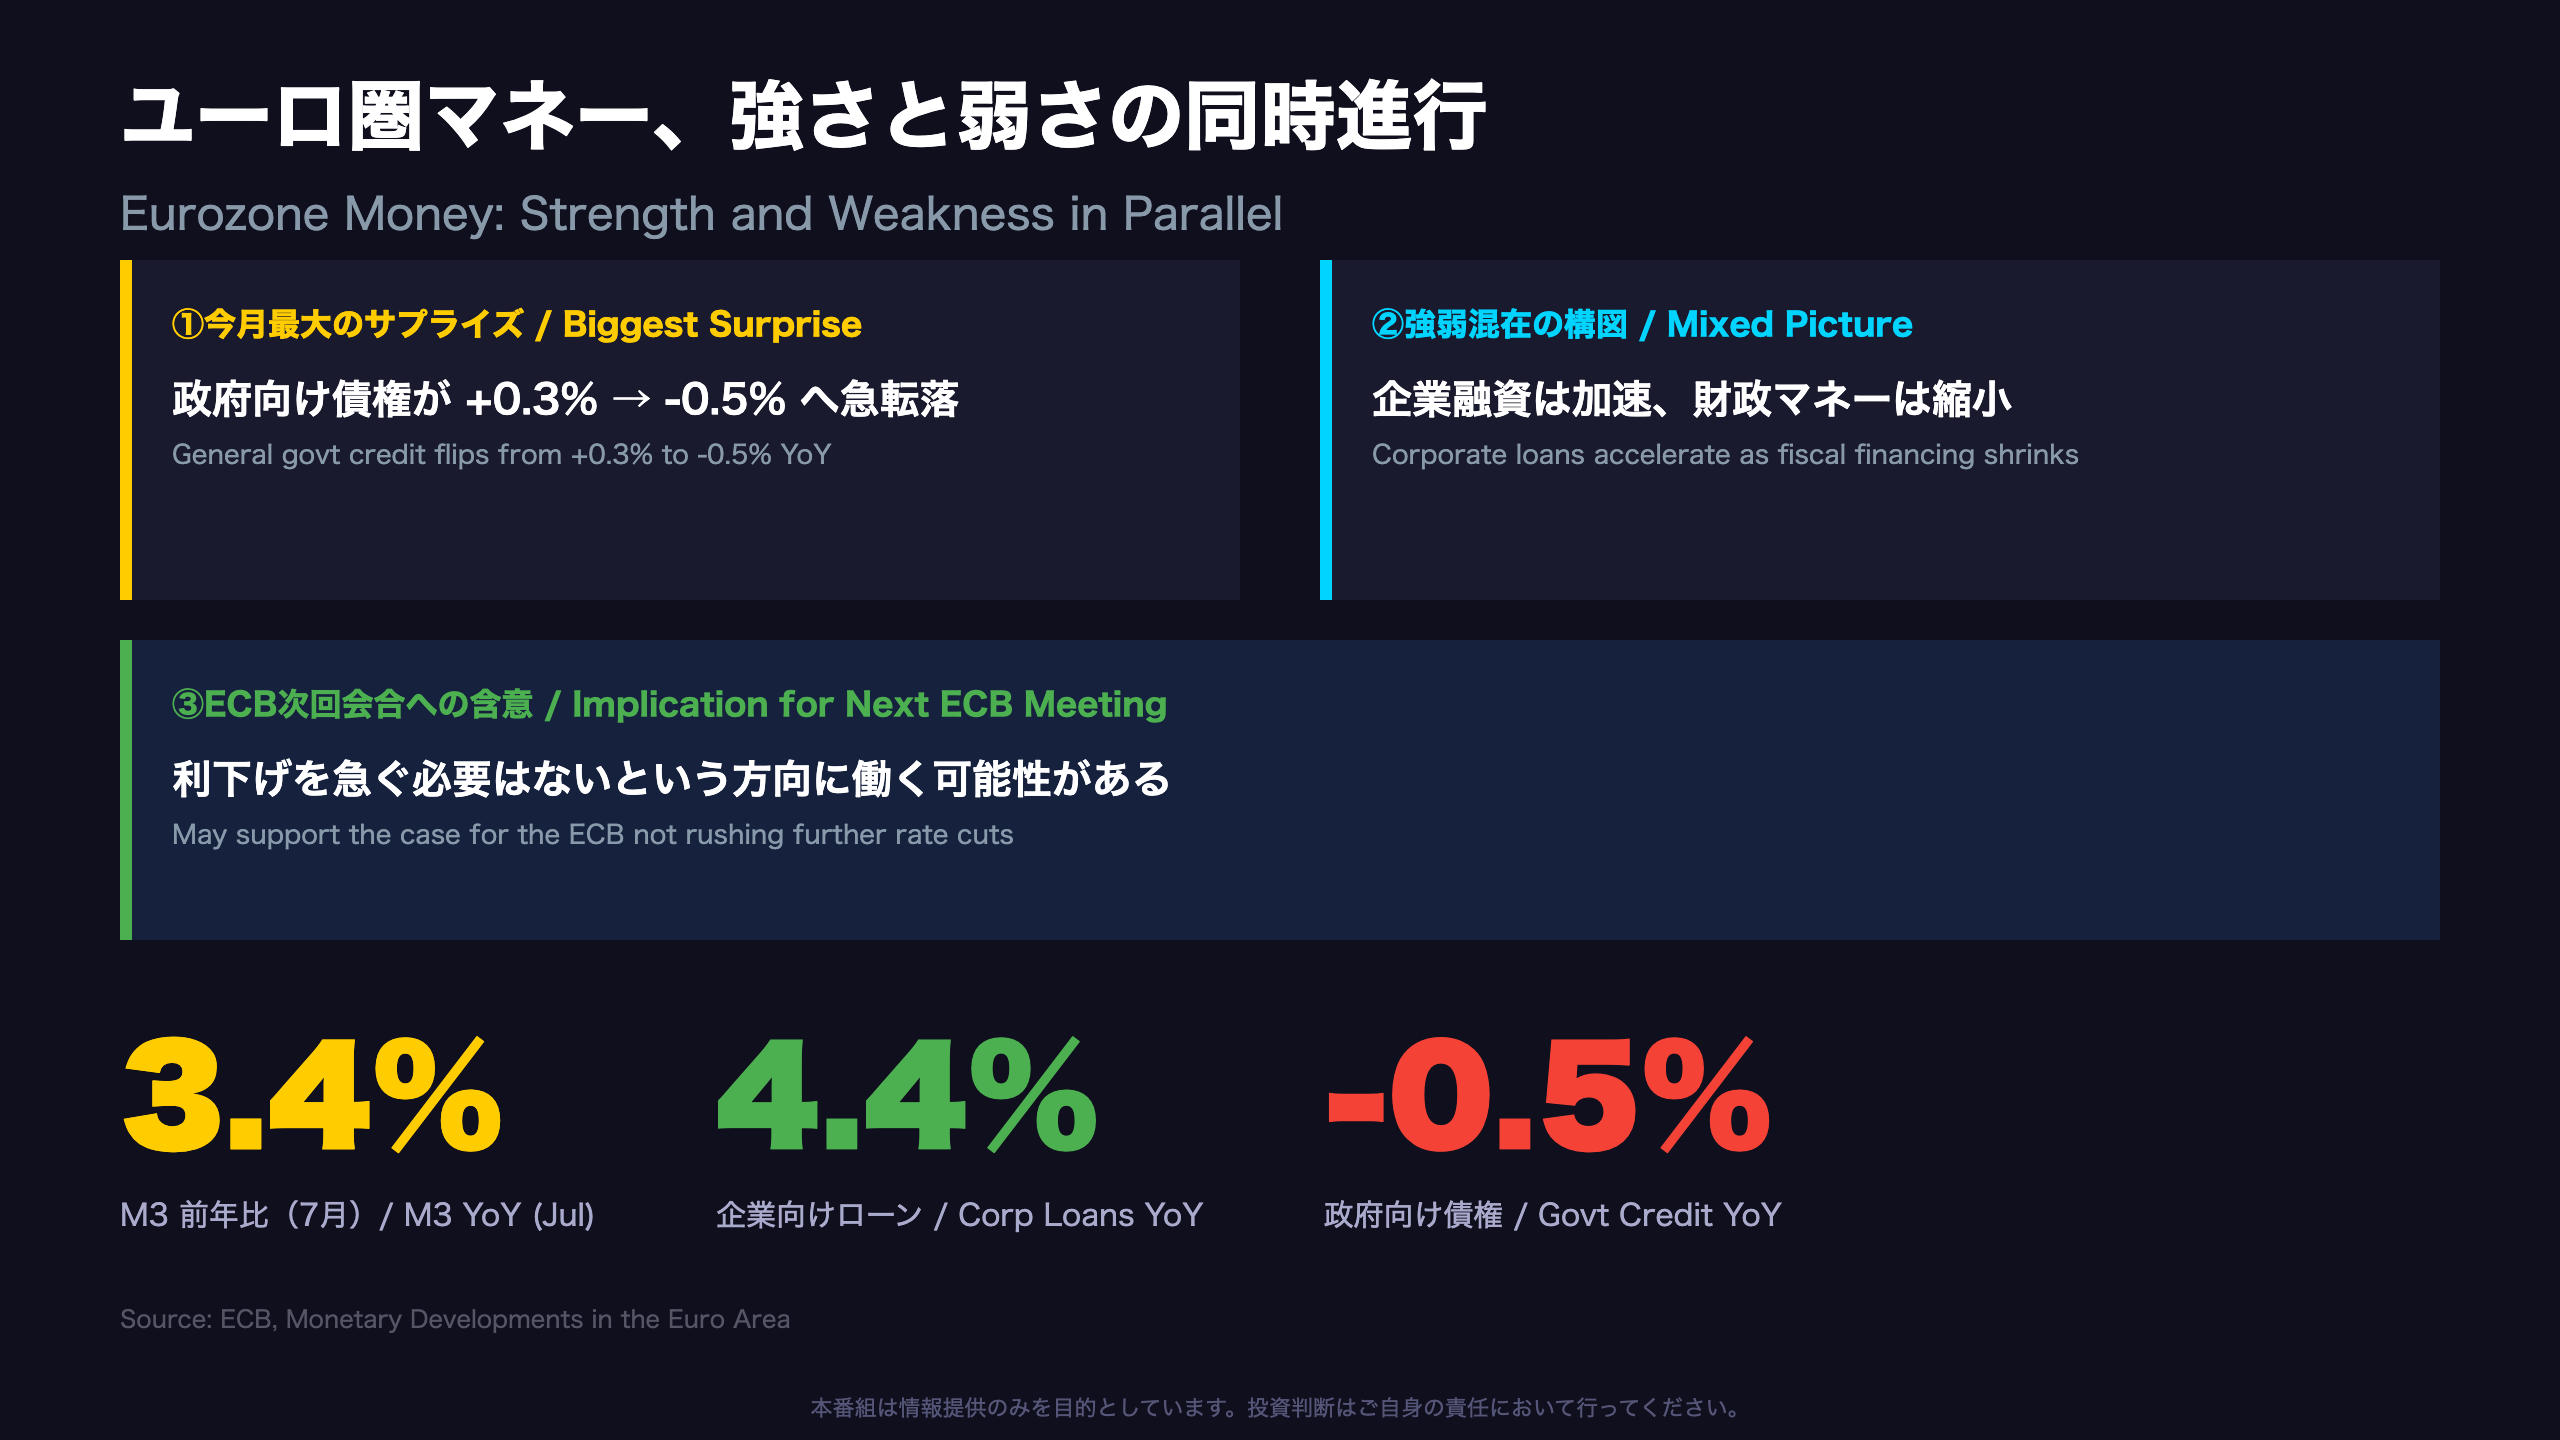
M3 annual growth edged up to 3.4% from 3.3%, with the 3-month average rising to 3.2%.
💡 The biggest surprise: credit to general government flipped from +0.3% to -0.5% YoY. Meanwhile, adjusted loans to non-financial corporations accelerated from 4.0% to 4.4%, showing resilient private-sector credit demand.
⚠️ M1 growth has steadily decelerated from over 5% to 3.15% over the past year, suggesting continued shift from overnight deposits toward interest-bearing accounts.
What EUR/JPY holders need to know about this split in the quality and quantity of eurozone money.
ユーロ圏マネー、強さと弱さの同時進行
Headline Takeaway
The July 2026 ECB Monetary Developments release reveals a striking divergence: the quantity of money is growing, but the quality of credit is splitting in opposite directions across sectors.
“The annual growth rate of claims on general government decreased to -0.5% in July from 0.3% in June” (ECB press release)
For readers unfamiliar with ECB terminology: M3 is the broad money aggregate the ECB monitors as part of its “monetary analysis” pillar, complementing its economic analysis of inflation. A swing from positive to negative growth in government credit within a single month is a notable move, even after seasonal adjustment.
Context for international readers
By comparison, the Federal Reserve’s M2 measure and the Fed’s credit aggregates don’t receive the same weight in policy communication that the ECB gives to M3 — a legacy of the ECB’s original two-pillar strategy. This makes ECB money-supply data more directly policy-relevant than equivalent US releases.
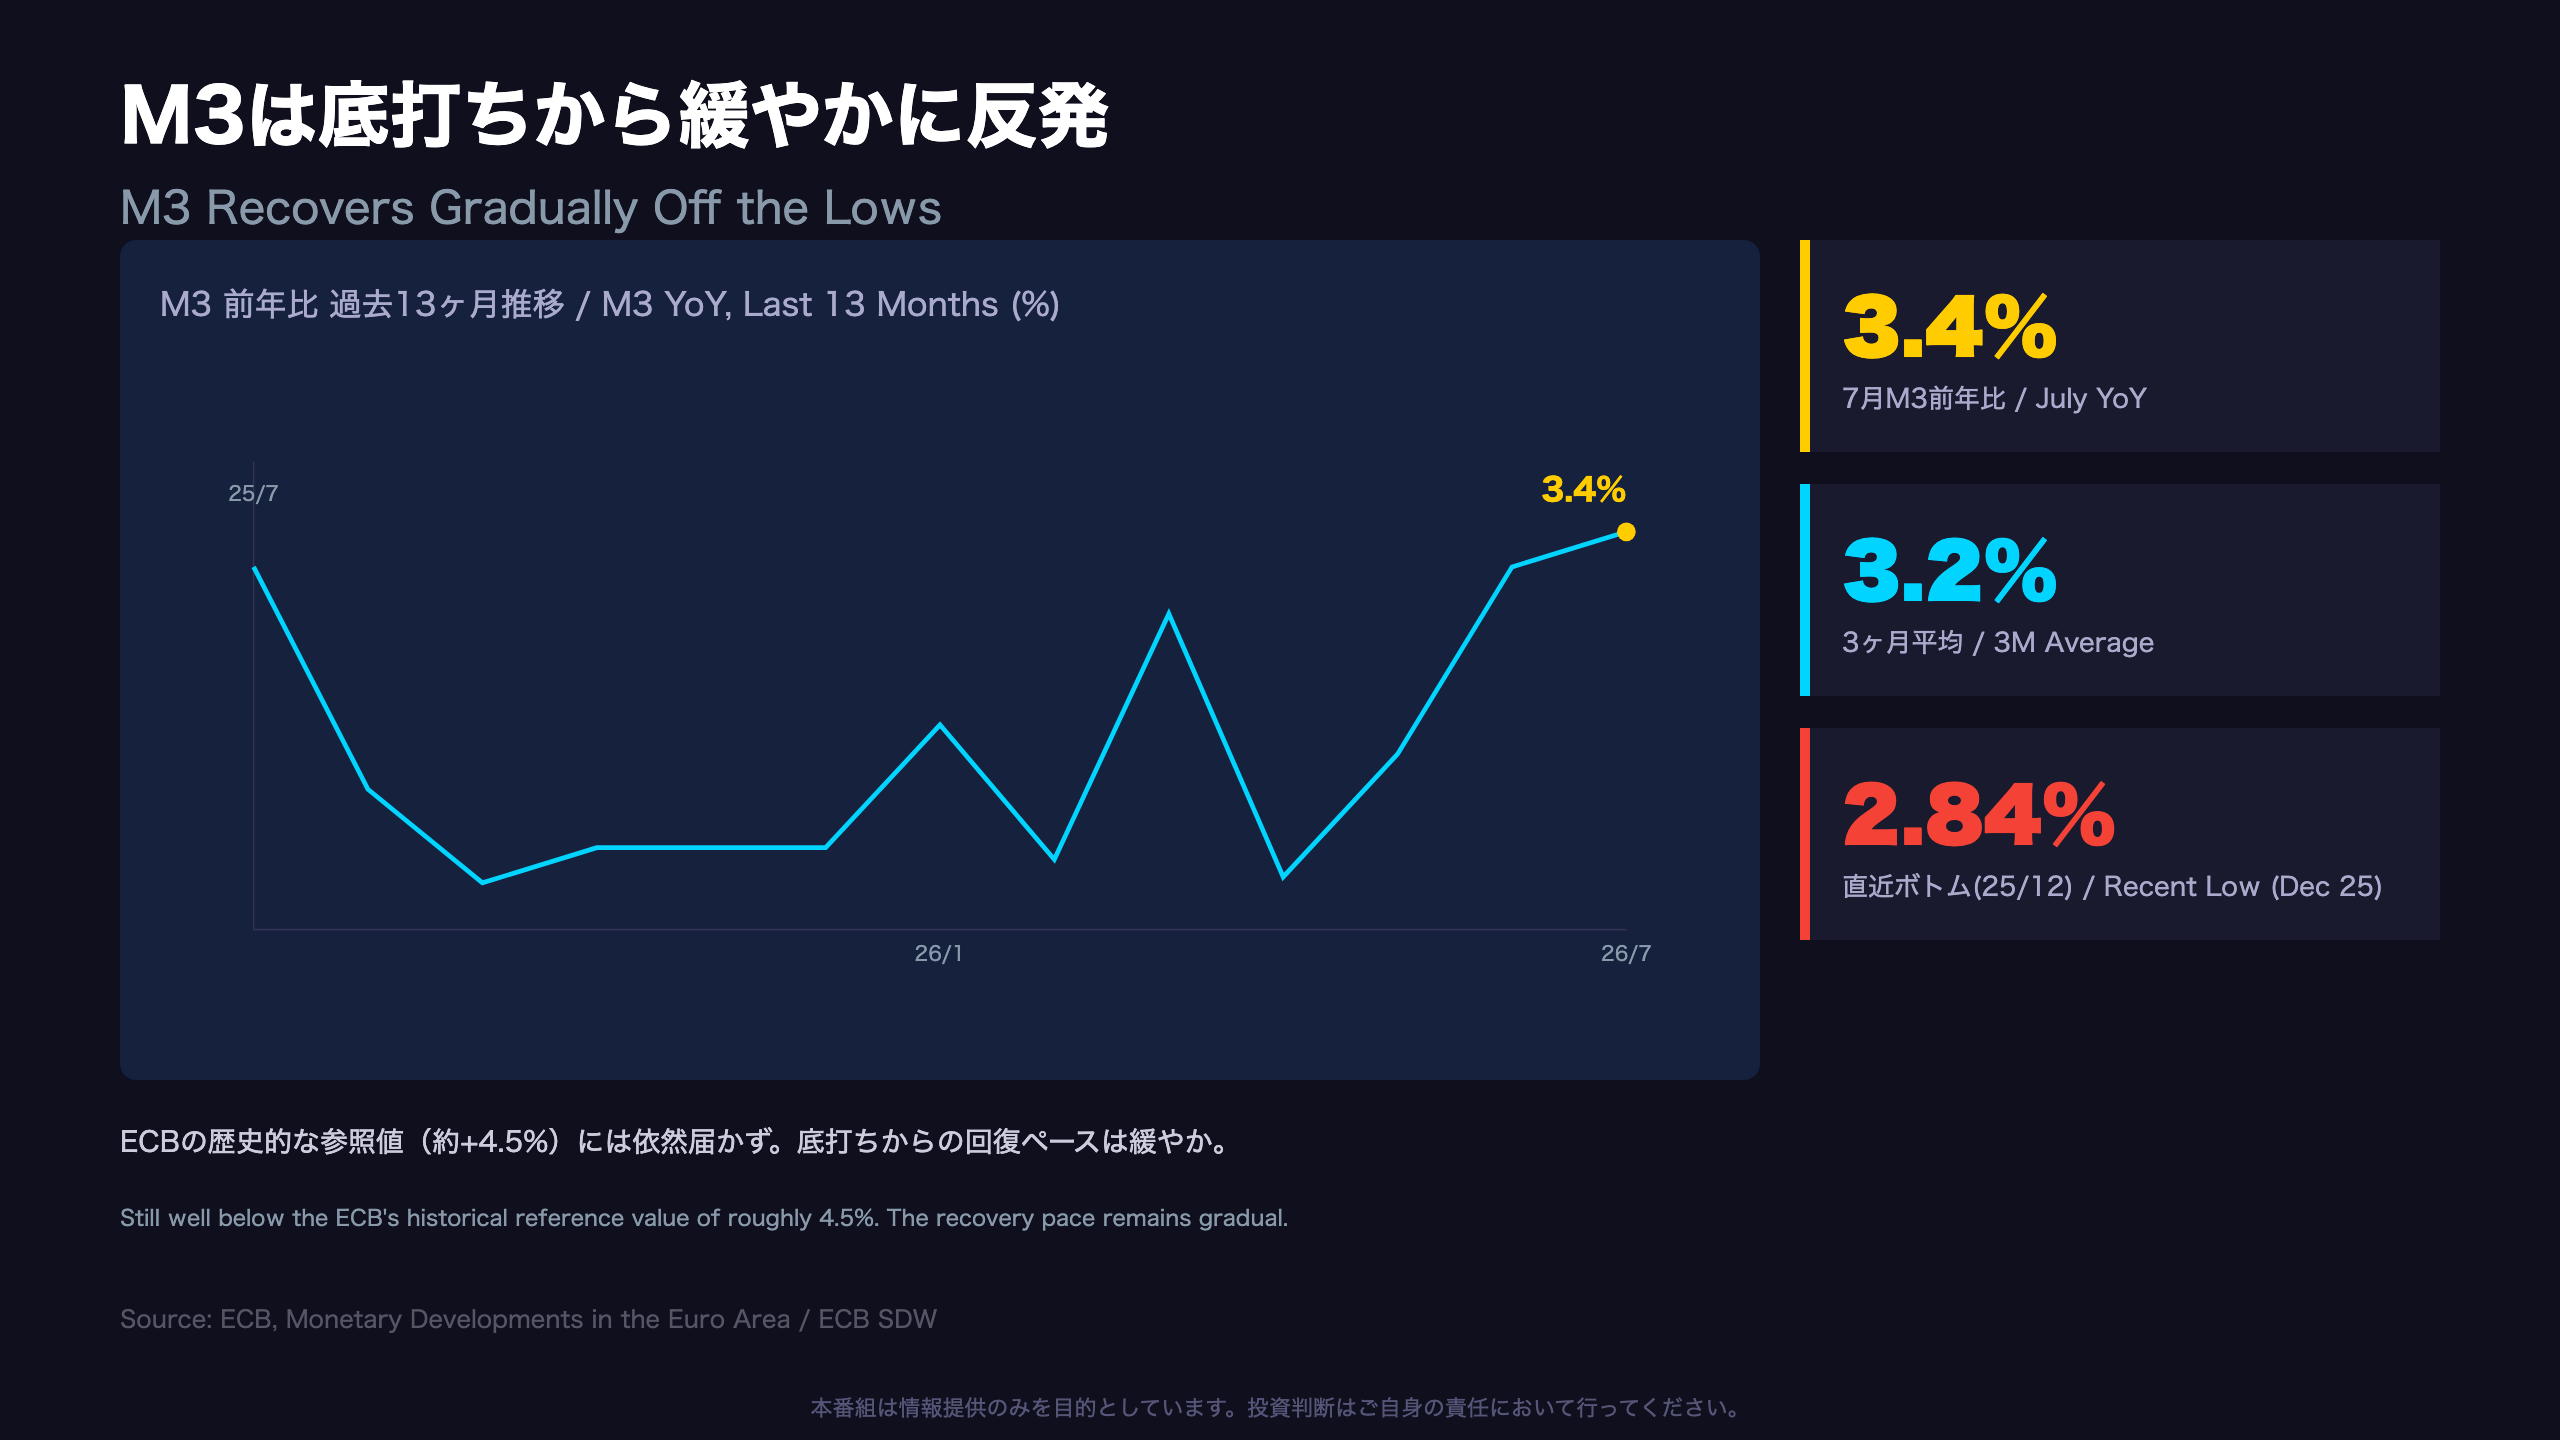
Meanwhile, adjusted loans to non-financial corporations accelerated to 4.4% from 4.0%, and M3 itself ticked up to 3.4% from 3.3%, with the 3-month average rising to 3.2% — still well below the ECB’s historical reference value of around 4.5%, but consistent with a gradual recovery from 2025’s slowdown.
Market implication
For EUR-denominated asset holders, resilient private credit growth is generally euro-supportive over time, as it signals underlying economic activity. However, the sharp drop in government credit warrants a cautious read — it may reflect one-off redemption patterns rather than a durable fiscal shift. This is not a signal for immediate ECB policy action, but a data point worth tracking into the next release.
M3は底打ちから緩やかに反発
M3’s One-Year Trajectory
M3 annual growth fell from 3.32% in July 2025 to a low of 2.84% in December 2025, before entering a gradual recovery through 2026 that brought it to 3.38% (3.4% per the press release) in July 2026.
Understanding M3’s Components
For readers new to eurozone monetary analysis: M3 is broken into three layers — M1 (currency plus overnight deposits, the most liquid form of money), M2-M1 (short-term deposits like time deposits under 2 years), and M3-M2 (marketable instruments such as repos and money market fund shares).
| Component | June Contribution | July Contribution |
|---|---|---|
| M1 (narrow money) | 2.2pp | 2.0pp |
| M2-M1 (short-term deposits) | 0.8pp | 1.1pp |
| M3-M2 (marketable instruments) | 0.3pp | 0.3pp |
The decline in M1’s contribution was more than offset by the rise in M2-M1, meaning households and firms are shifting cash from overnight accounts into interest-bearing short-term deposits — a rational response to the current rate environment — while overall system liquidity keeps expanding.
“The annual growth rate of the broad monetary aggregate M3 stood at 3.4% in July 2026, after 3.3% in June, averaging 3.2% in the three months up to July” (ECB press release)
Comparison to the Fed’s framework
Unlike the Federal Reserve, which de-emphasized M2 targeting decades ago, the ECB retains M3 as an explicit pillar of its strategy, making these releases more directly tied to policy deliberation than equivalent US data. A continuation of this recovery trend, still well below the ECB’s roughly 4.5% historical reference value, would be consistent with a “gradual normalization, no rush to cut” narrative — while a sudden acceleration back toward reference-value levels would warrant closer scrutiny for renewed inflationary pressure.
対価構成の急変:財政マネーの縮小
Understanding M3’s “Counterparts”
The ECB doesn’t just report that M3 grew — it breaks down why it grew by showing the balance-sheet items on the asset side of eurozone banks (the “counterparts”) that drove the change. This is a distinctive feature of ECB monetary analysis not commonly replicated in US Fed communications.
July’s Shift in Counterparts
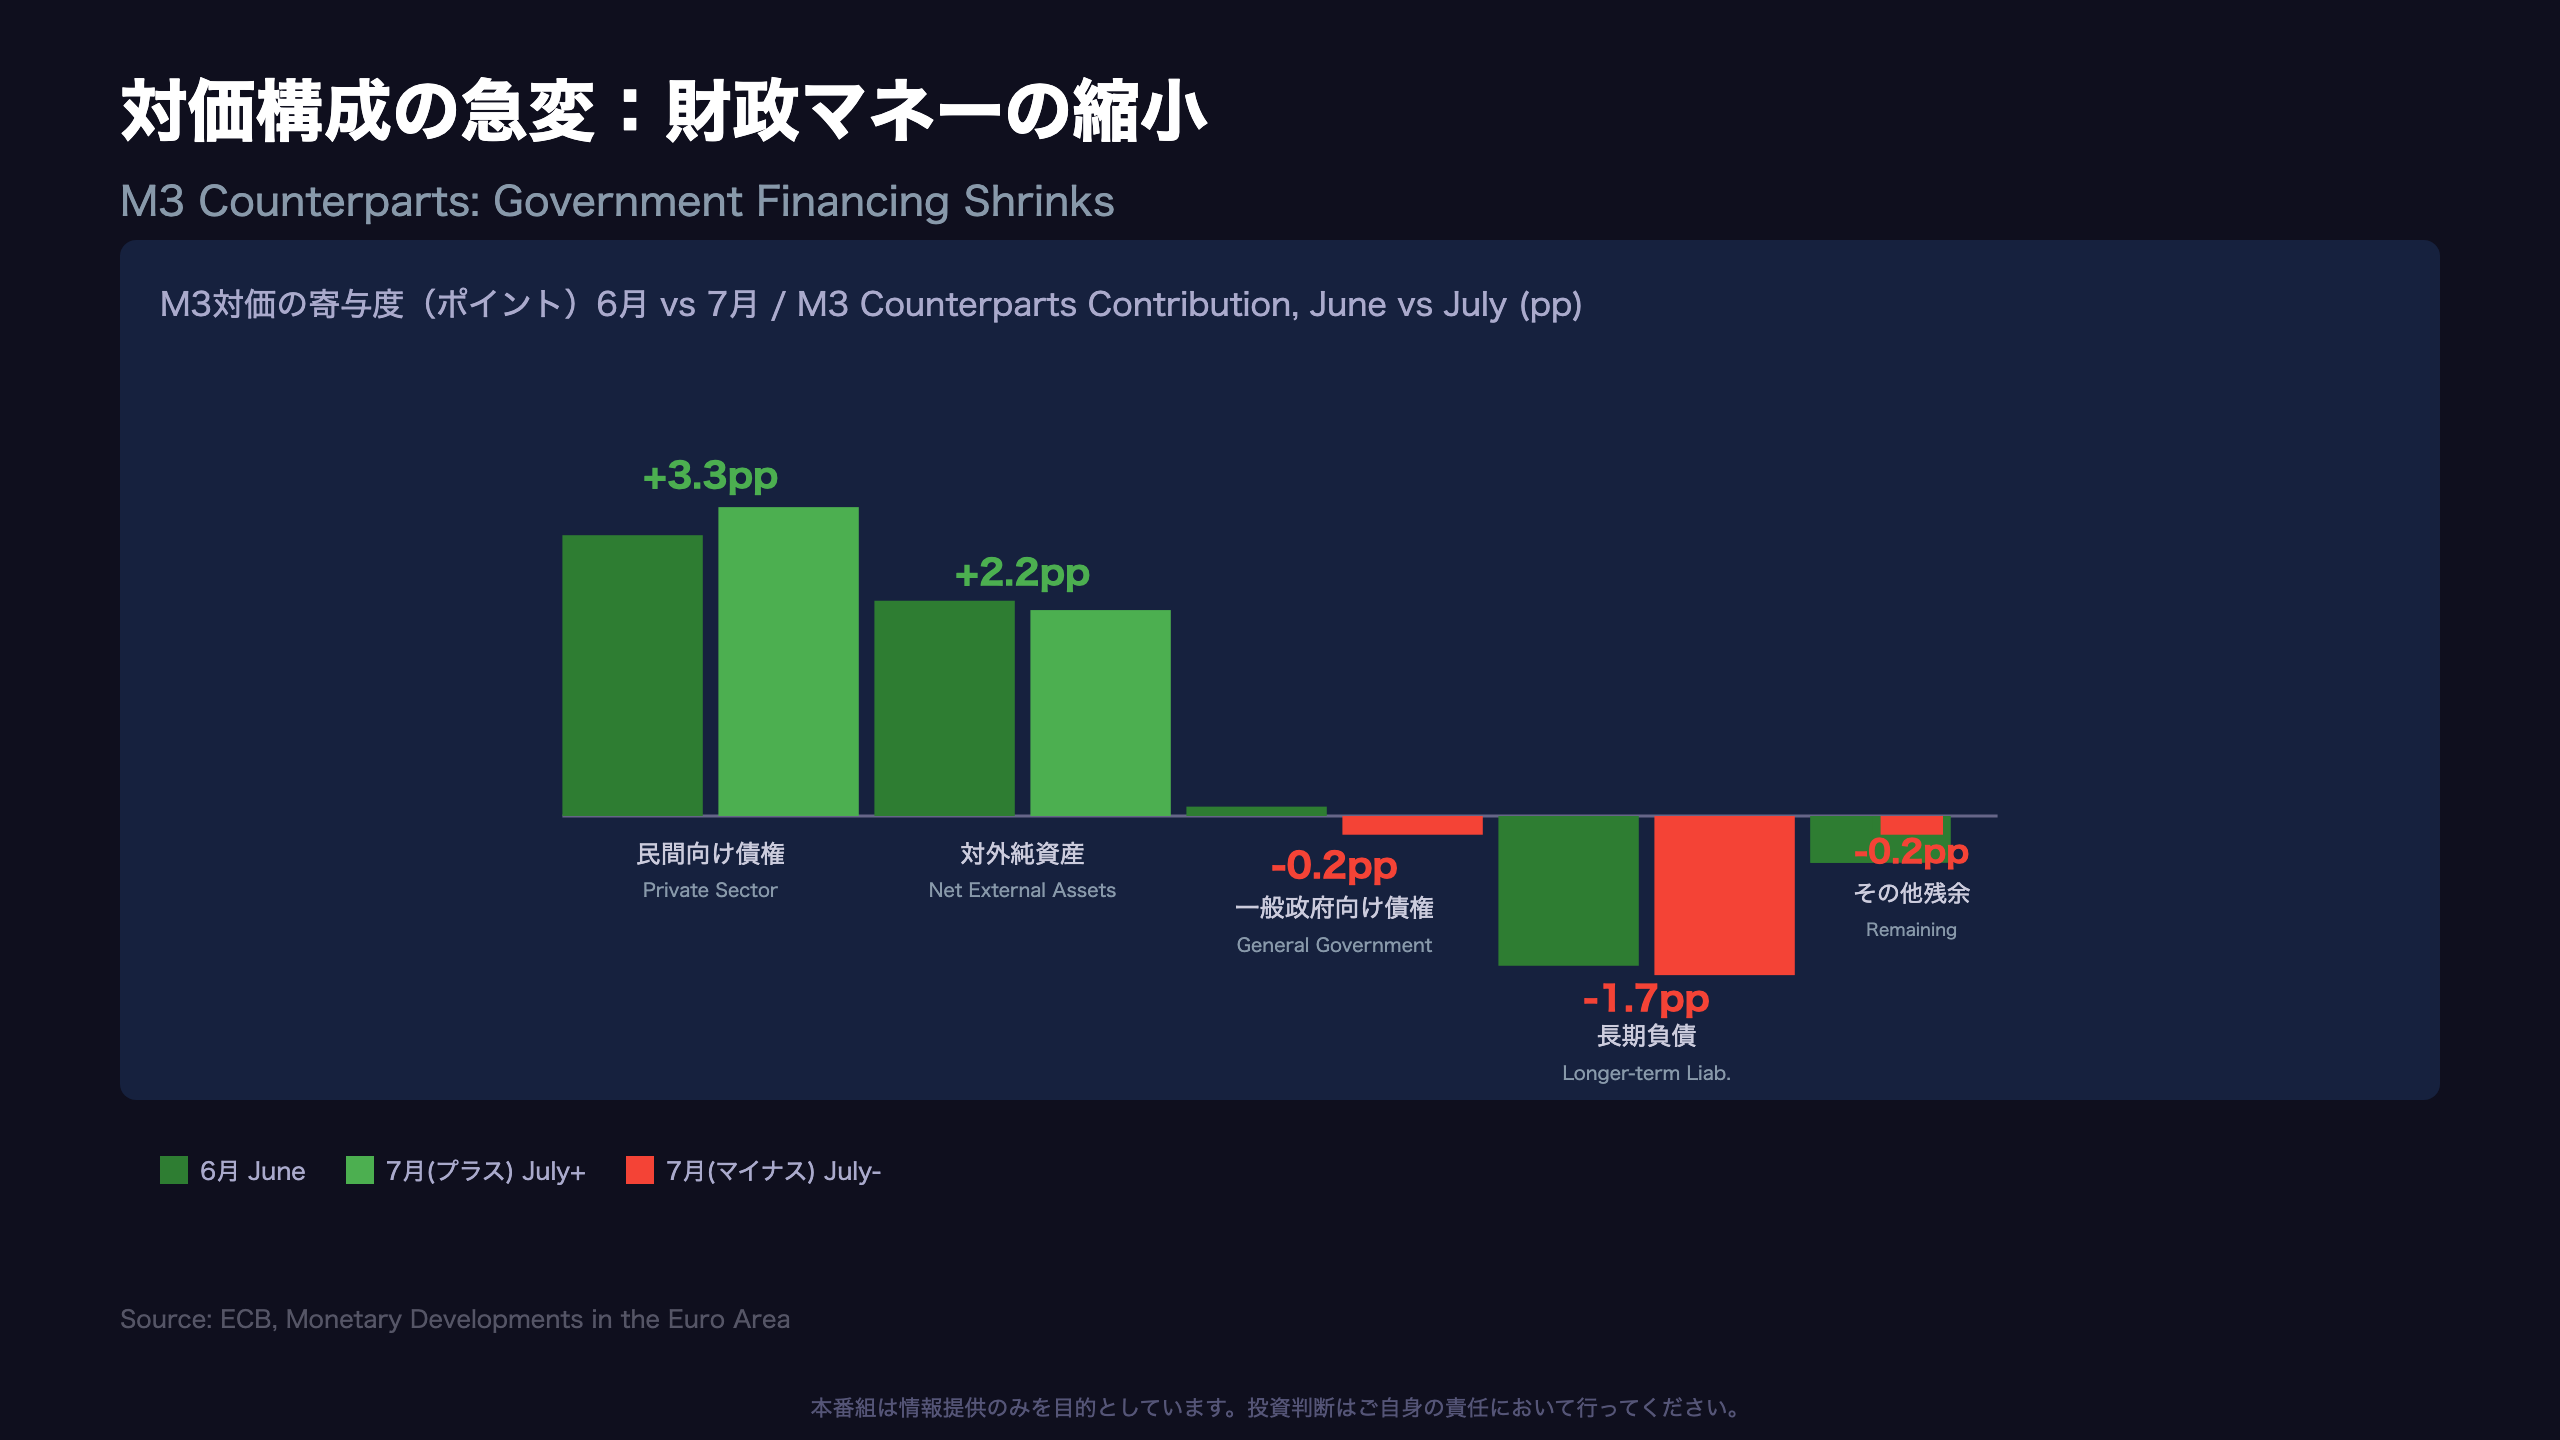
| Counterpart | June Contribution | July Contribution | Change |
|---|---|---|---|
| Private sector claims | +3.0pp | +3.3pp | +0.3pp |
| Net external assets | +2.3pp | +2.2pp | -0.1pp |
| General government claims | +0.1pp | -0.2pp | -0.3pp |
| Longer-term liabilities | -1.6pp | -1.7pp | -0.1pp |
| Remaining counterparts | -0.5pp | -0.2pp | +0.3pp |
The swing in government claims — from positive to negative contribution — is the single largest move in this month’s data. In plain terms: eurozone banks’ holdings of government-related assets (like sovereign bonds) shrank year-on-year for the first time in this data series’ recent history.
“claims on general government contributed -0.2 percentage points (down from 0.1 percentage points in June)” (ECB press release)
A cautious interpretation
Possible explanations include bond redemption schedules or shifts in bank sovereign-holding strategy, though the release itself doesn’t specify a cause — this should be read as one plausible factor, not a confirmed driver. Notably, the “remaining counterparts” contribution improved from -0.5pp to -0.2pp, partially offsetting the government credit decline.
For investors comparing this to US Treasury market dynamics, this is roughly analogous to watching bank holdings of Treasuries shift — a data point worth monitoring but not yet a confirmed structural trend. The next release (August data, expected late September) will be key to determining whether this is a one-off or the start of a pattern.
M1一貫減速:当座預金から定期預金へ
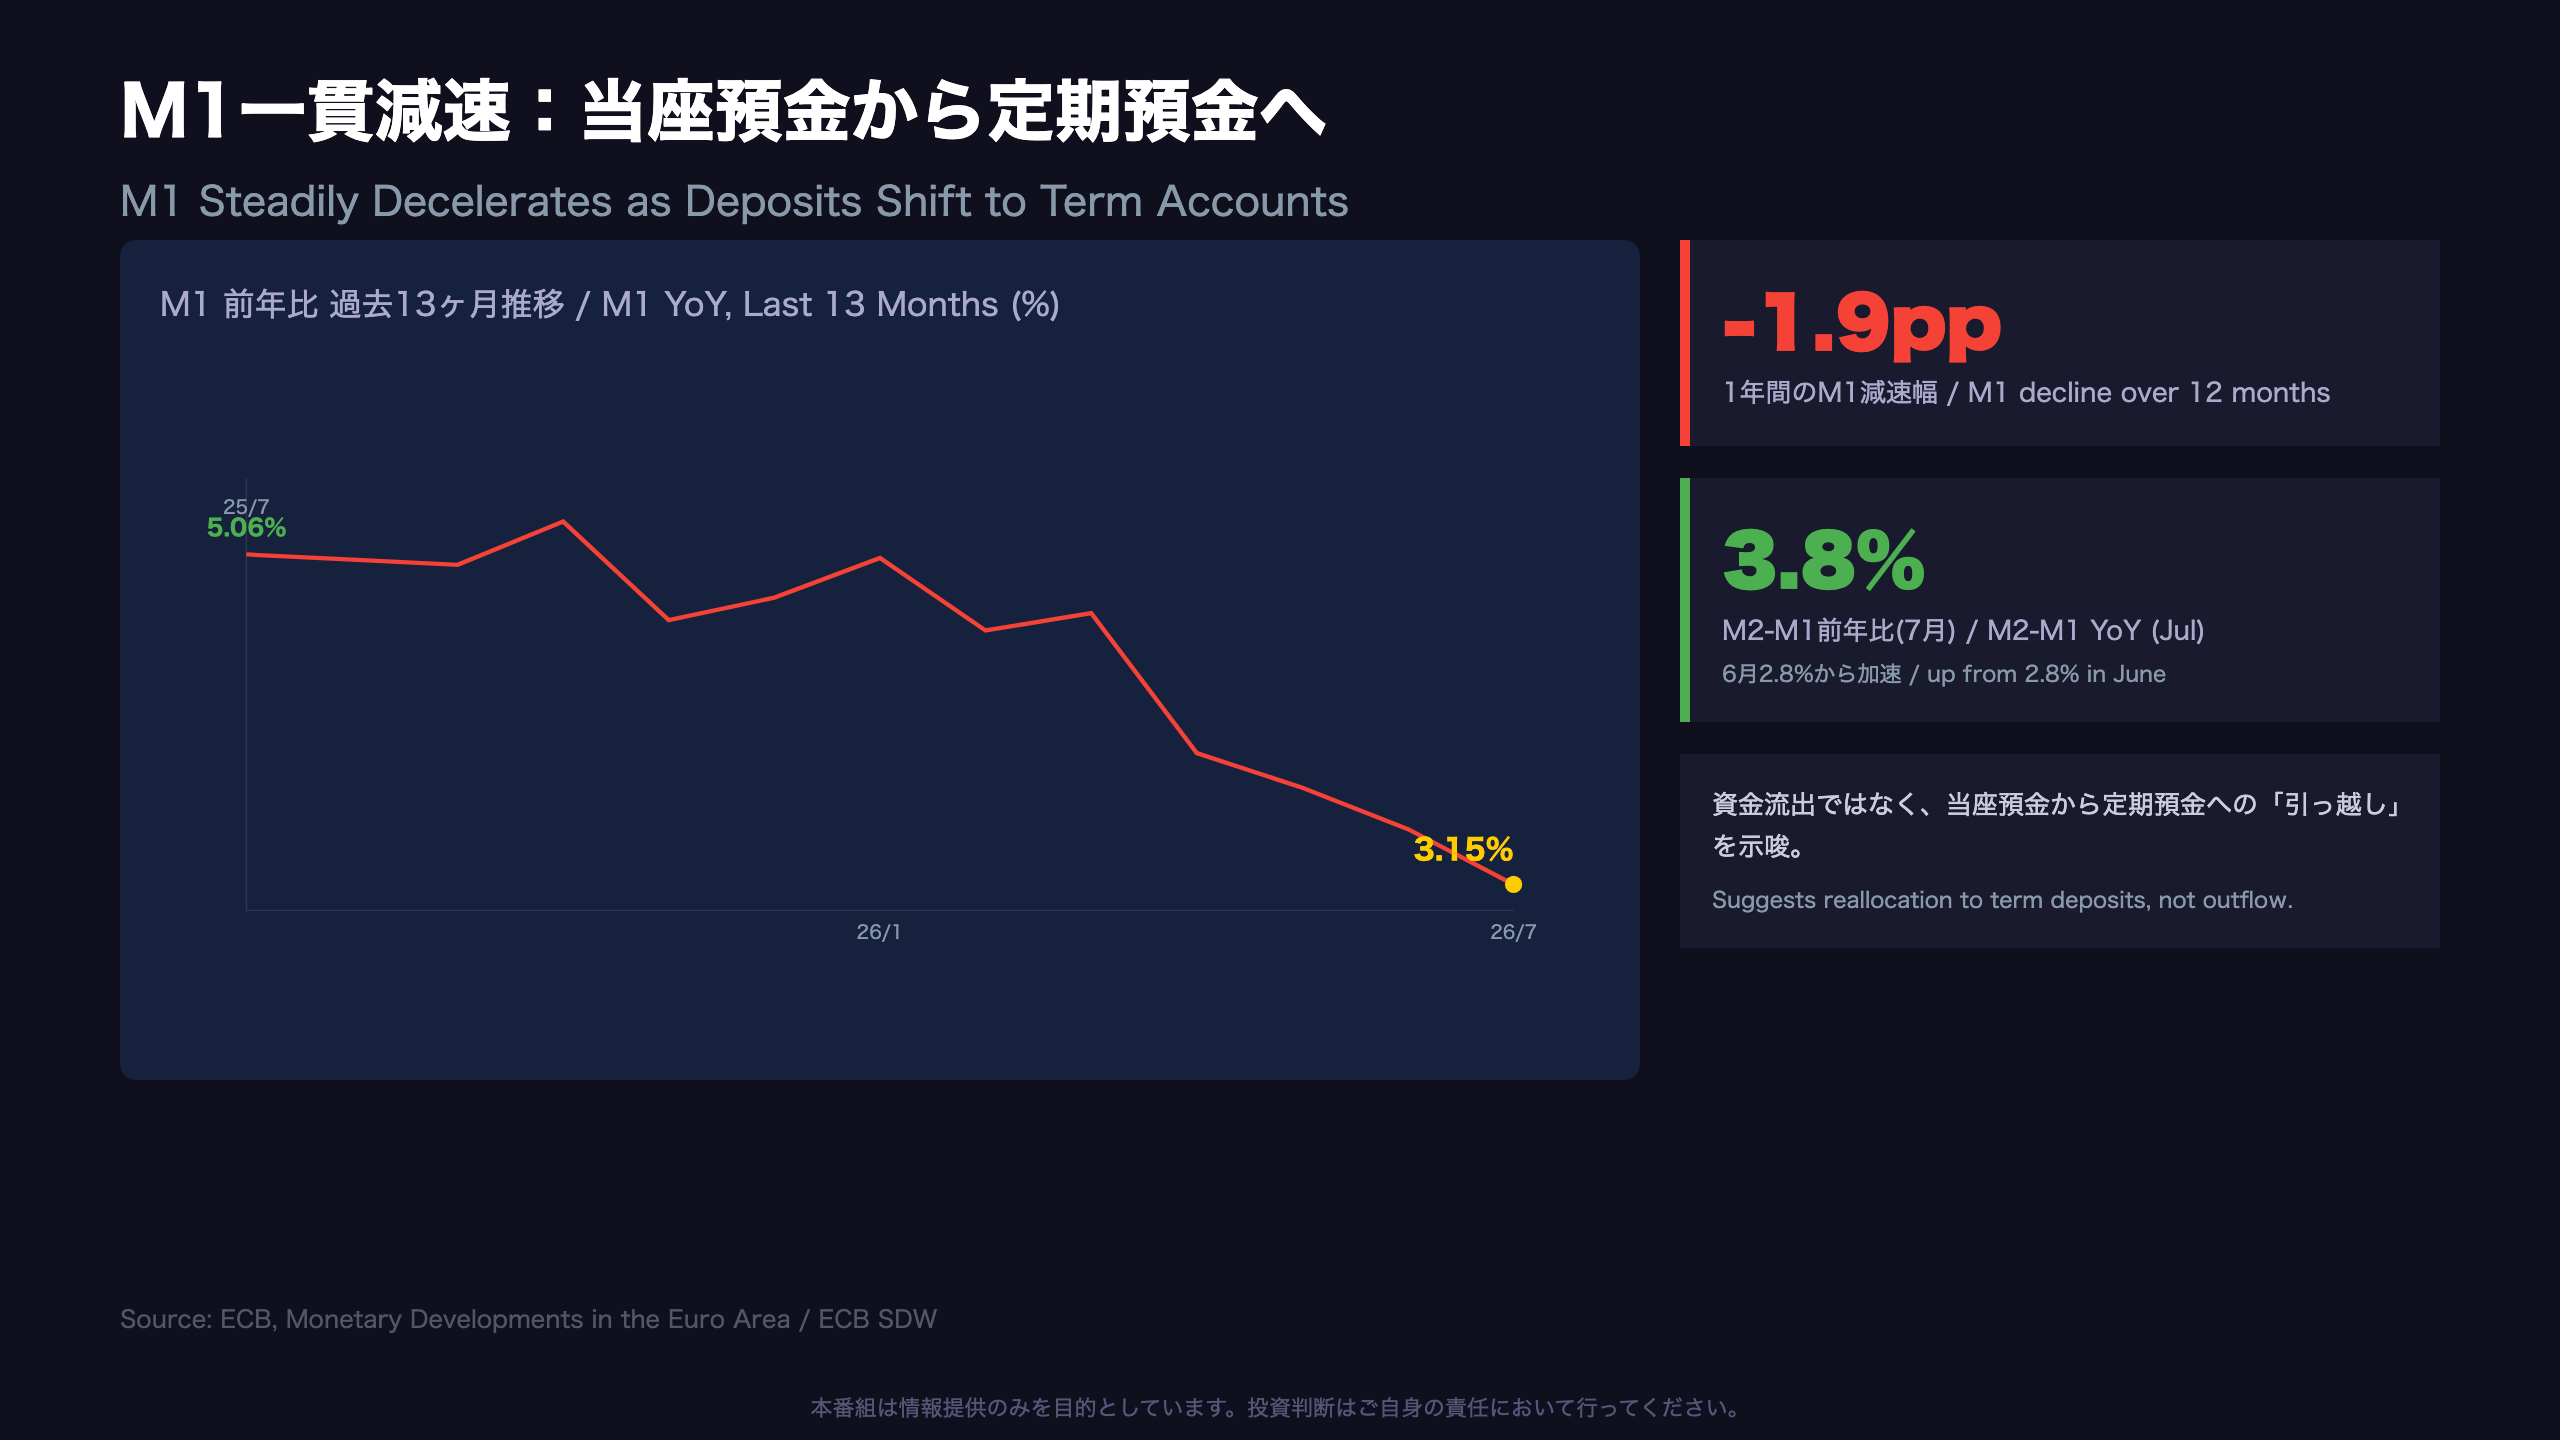
M1’s 12-Month Deceleration Trend
M1 (currency in circulation plus overnight deposits) growth has fallen almost continuously from 5.06% in July 2025 to 3.15% in July 2026 — an approximately 1.9 percentage-point decline over the past year, making it one of the clearest trends in this month’s monetary data.
Selected Monthly Path
| Month | M1 YoY |
|---|---|
| Jul 2025 | 5.06% |
| Oct 2025 | 5.25% (recent peak) |
| Jan 2026 | 5.04% |
| Apr 2026 | 3.91% |
| Jul 2026 | 3.15% (recent trough) |
M1 briefly rebounded to 5.25% in October 2025 before entering an accelerated decline through 2026.
Why This Matters: Comparison to US M1/M2
For investors used to US monetary aggregates: the Fed redefined M1 in 2020 (folding in savings deposits), making direct US-eurozone M1 comparisons tricky. But the underlying dynamic here — cash migrating from overnight/checking-equivalent accounts into interest-bearing term deposits — mirrors what US banks experienced during 2022-23 rate hikes, sometimes dubbed a mild “deposit reallocation” rather than deposit flight.
The ECB press release notes: “short-term deposits other than overnight deposits (M2-M1) increased to 3.8% in July from 2.8% in June.” M1’s contribution to M3 fell from 2.2pp to 2.0pp while M2-M1’s contribution rose from 0.8pp to 1.1pp — largely offsetting one another within the broader M3 figure.
What this suggests
This pattern suggests money isn’t leaving the banking system — it’s migrating toward higher-yielding term deposits as households and corporates respond rationally to the current rate environment (a Level B inference based on the offsetting component data). Whether this is a temporary rate-arbitrage behavior or a more structural shift in savings preferences cannot be determined from a single release and warrants continued monitoring.
民間与信は加速、実体経済の底堅さ
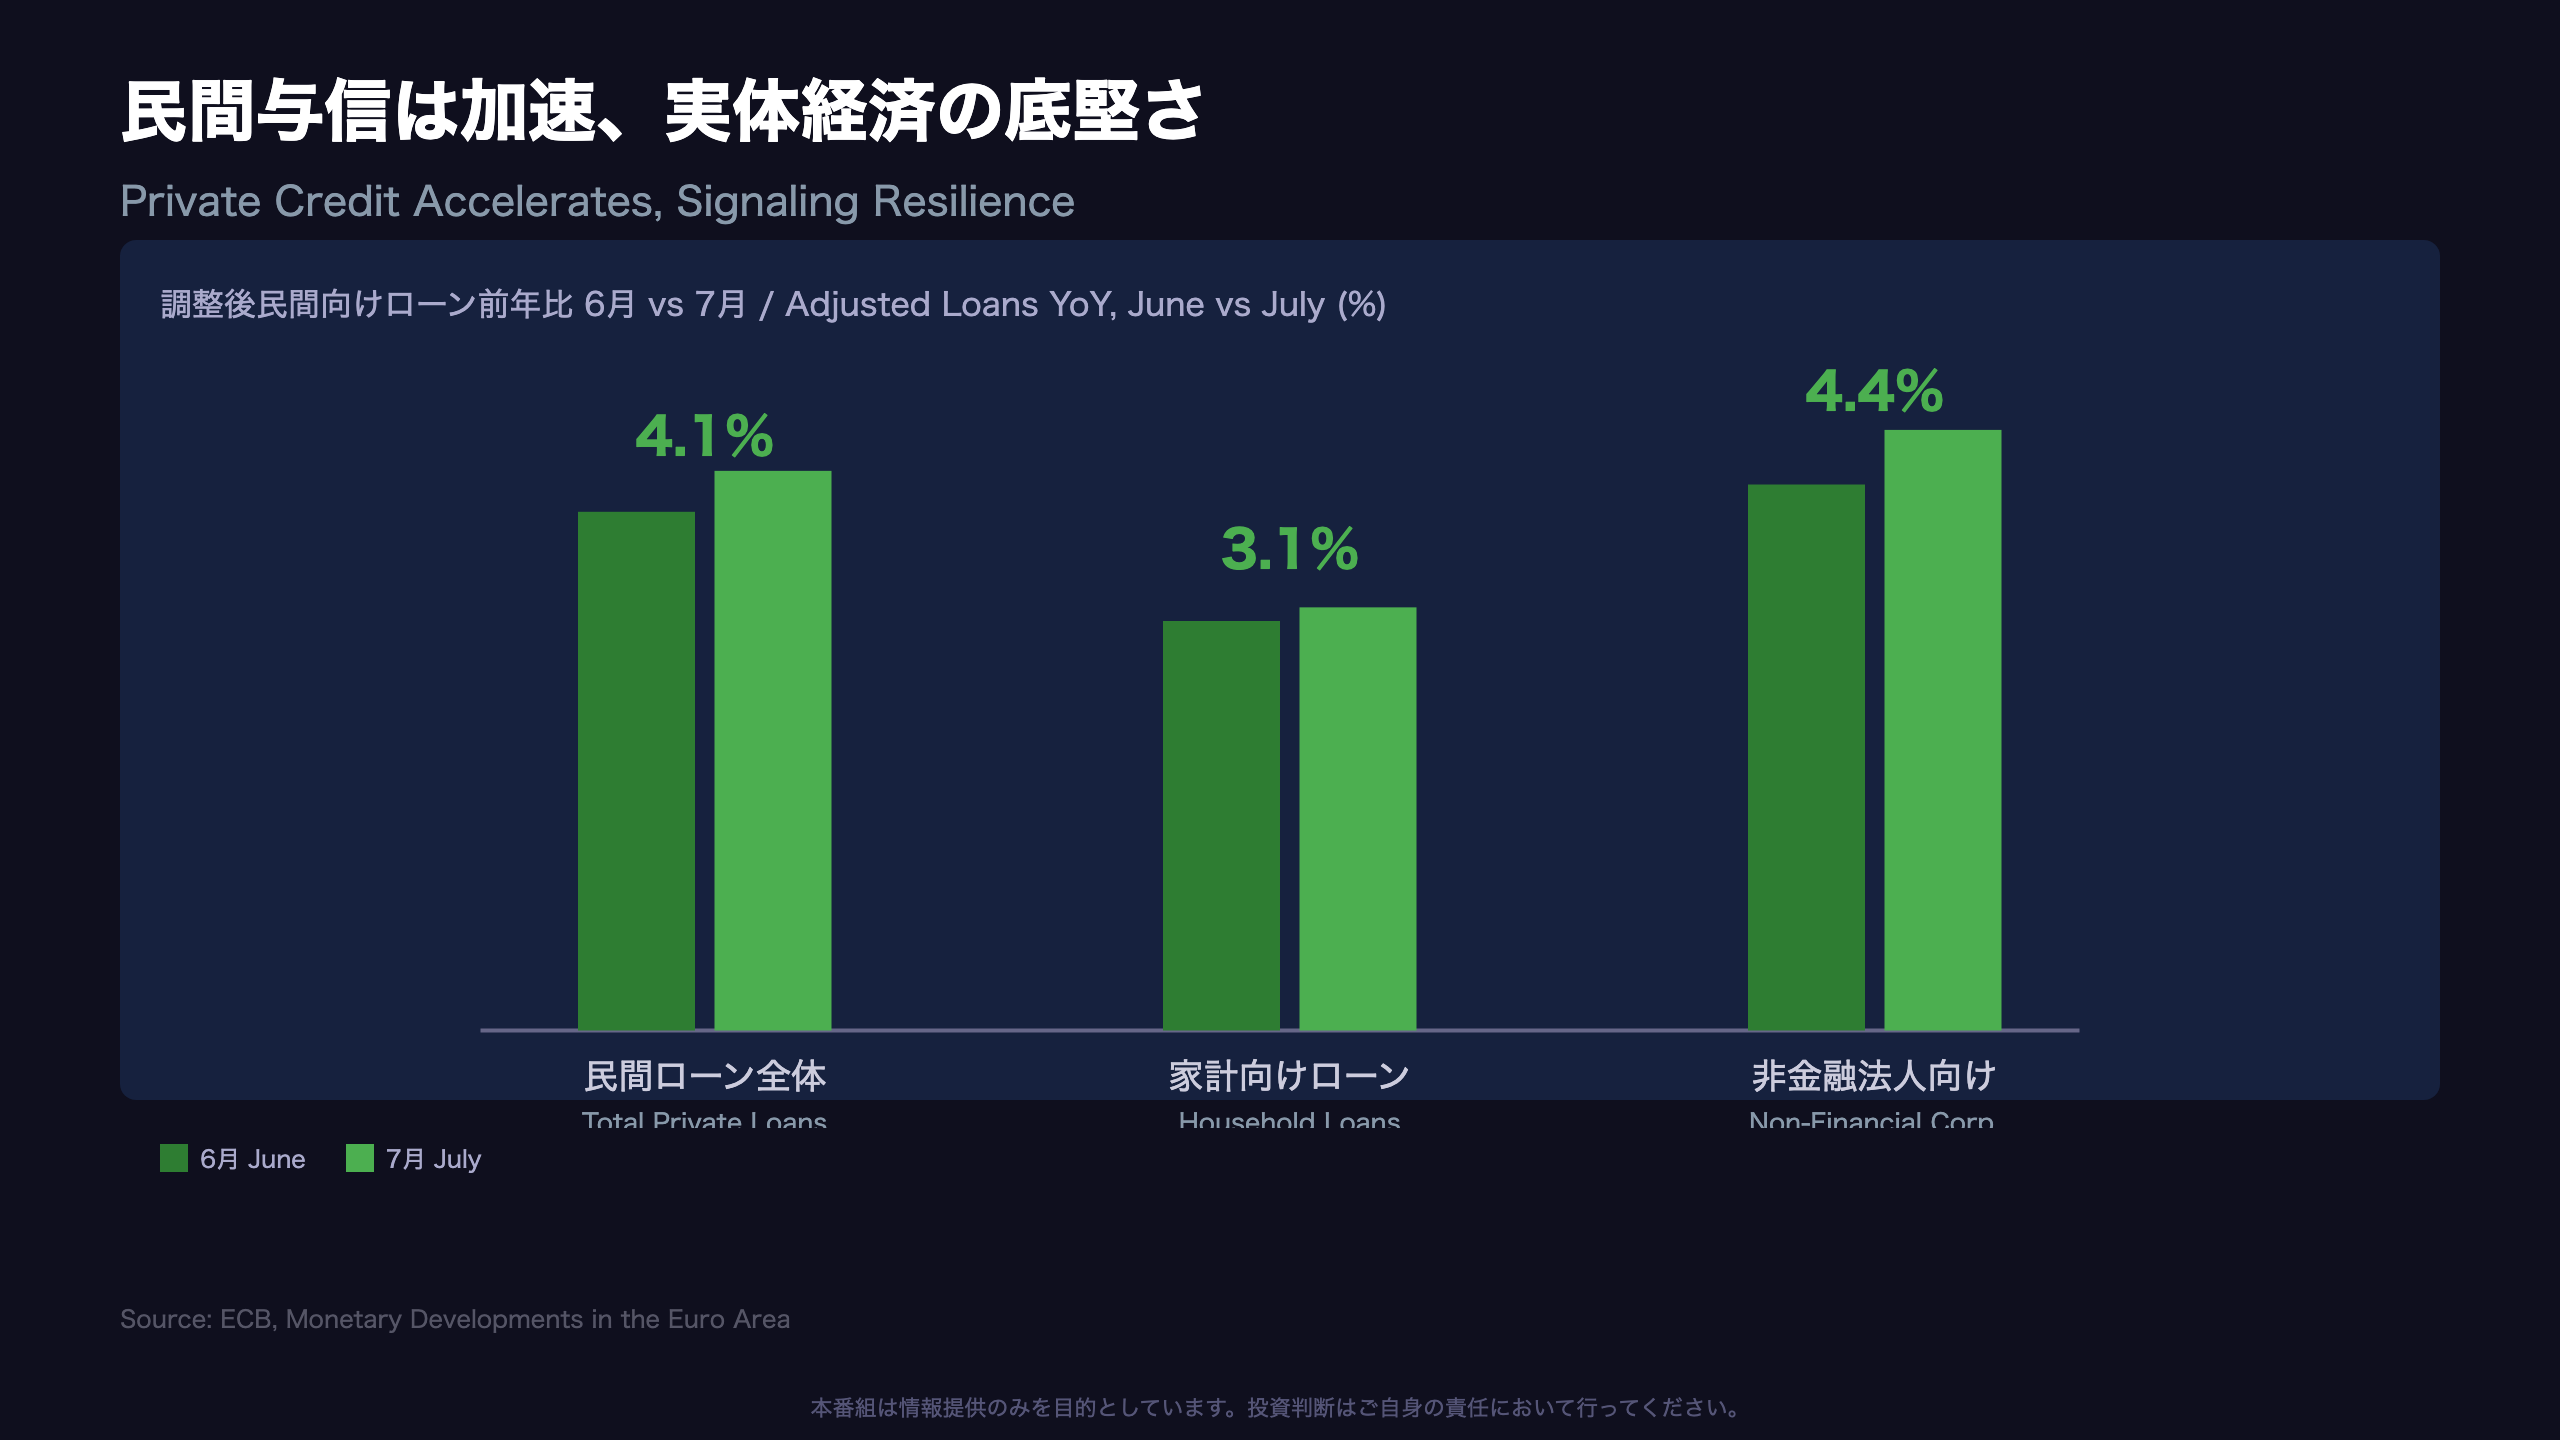
Private Credit Accelerates Across the Board
The most consistently strong signal in July’s ECB data comes from adjusted loans to the private sector — adjusted, meaning stripped of the effects of loan securitizations/transfers and notional cash pooling to give a cleaner read on real credit flow.
| Category | June | July | Change |
|---|---|---|---|
| Total private sector loans | 3.8% | 4.1% | +0.3pp |
| Household loans | 3.0% | 3.1% | +0.1pp |
| Non-financial corporation loans | 4.0% | 4.4% | +0.4pp |
Every category accelerated month-over-month — a notable contrast to June’s release, which described household and corporate loan growth as “both unchanged from the previous month.”
“The annual growth rate of adjusted loans to non-financial corporations increased to 4.4% in July from 4.0% in June” (ECB press release)
Why “adjusted” figures matter
The ECB publishes an adjusted series specifically to strip out balance-sheet engineering effects (like loan securitization) that can distort headline lending figures. This gives investors a cleaner read on actual credit flowing to the real economy — a methodological nuance not always present in equivalent US bank lending data.
Bull and bear readings
The bullish read: rising corporate borrowing appetite often precedes capex and business expansion — a sign the eurozone’s private sector is gaining momentum. The more cautious read: this is a single month’s acceleration, and should be cross-checked against the ECB’s quarterly Bank Lending Survey (BLS), which tracks credit standards and demand conditions more directly. Either way, the objective takeaway from this release is clear: private-sector credit access is improving even as government-sector financing contracts — a genuine divergence worth watching into the autumn.
EUR/JPY保有者が知るべき着地点
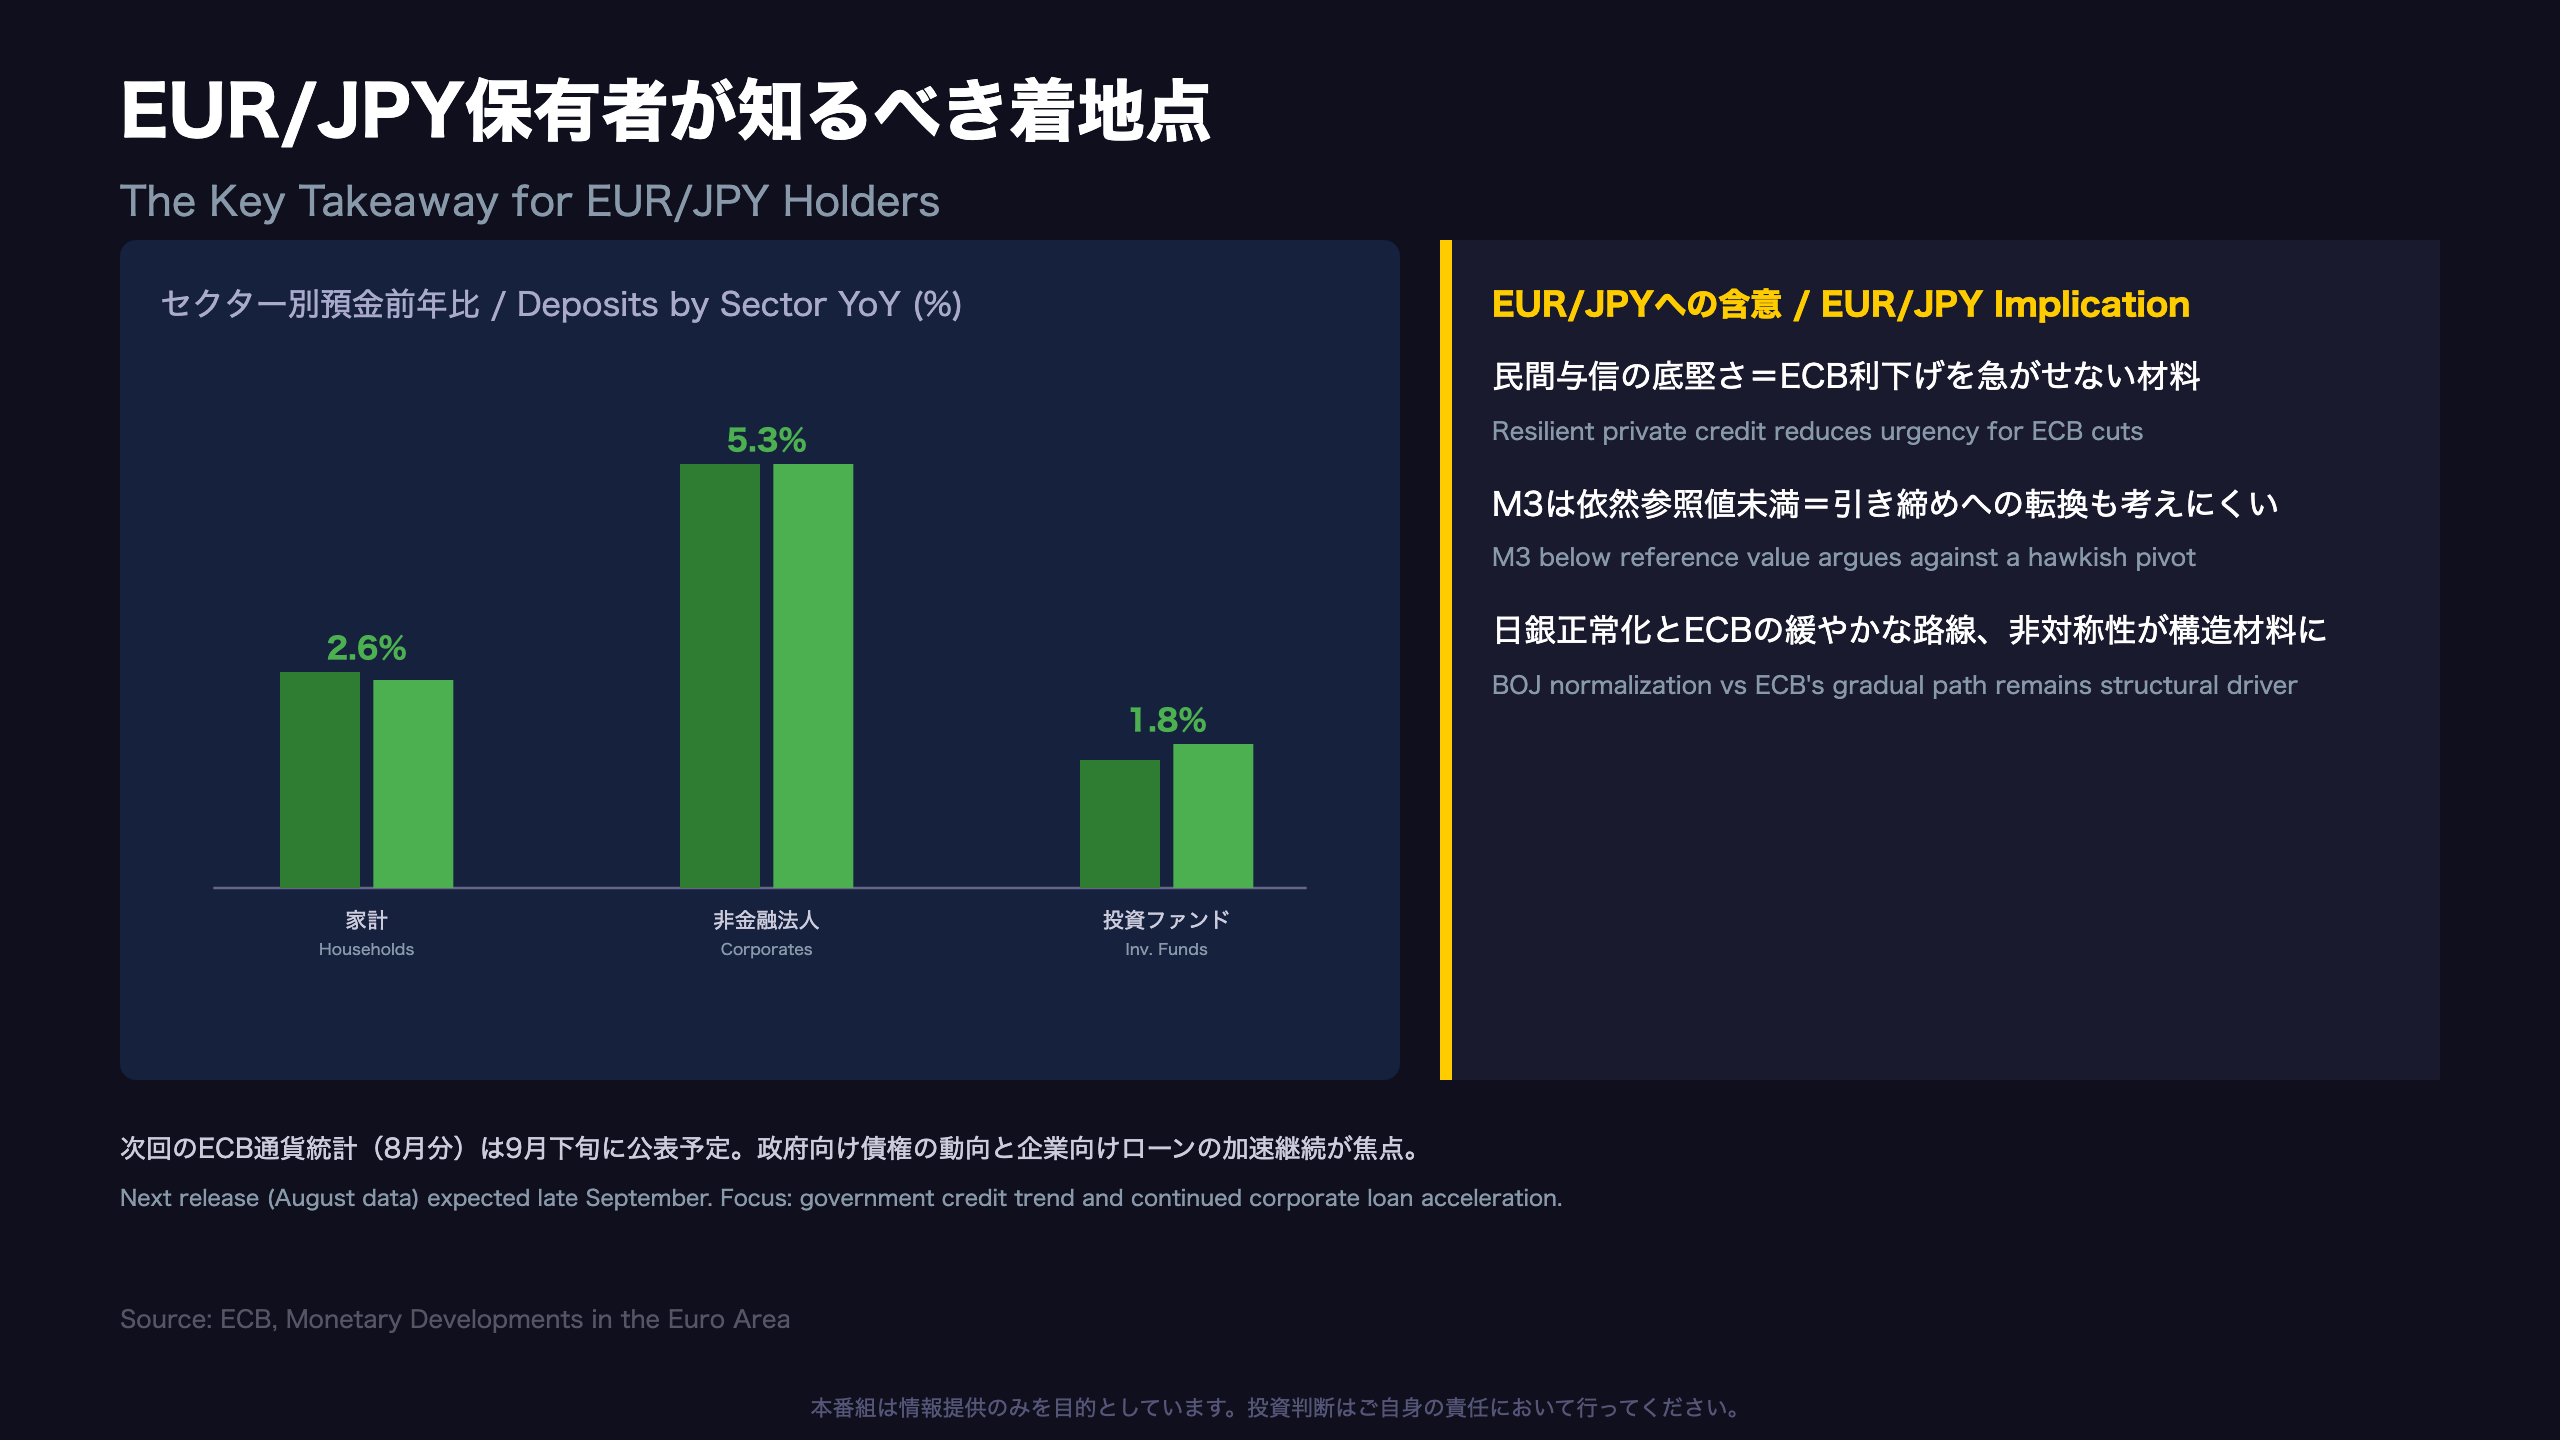
Sector-by-Sector Deposit Trends
Finally, a look at deposits broken down by holding sector.
| Sector | June | July | Change |
|---|---|---|---|
| Household deposits | 2.7% | 2.6% | -0.1pp |
| Non-financial corp. deposits | 5.3% | 5.3% | Flat |
| Investment fund deposits (ex-MMF) | 1.6% | 1.8% | +0.2pp |
Household deposit growth eased slightly, while corporate deposits held firm at a robust 5.3%. Investment fund deposits, which were negative (-0.6%) as recently as May, have now improved for two consecutive months.
“the annual growth rate of deposits placed by investment funds other than money market funds increased to 1.8% in July from 1.6% in June” (ECB press release)
What this means for EUR/JPY holders
This release contains no direct commentary on FX markets, but money and credit dynamics typically transmit to currencies via central bank policy. The resilience in private credit suggests the eurozone economy is recovering broadly in line with ECB expectations — a dynamic that could reduce the urgency for further ECB rate cuts. At the same time, M3 remaining below its historical reference value suggests limited near-term inflation re-acceleration risk, which argues against a hawkish pivot either.
This “neither extreme” data profile increases the probability that the ECB maintains its current gradual normalization stance. Meanwhile, the Bank of Japan continues its own policy normalization process — a structural asymmetry (ECB easing-biased vs. BOJ normalizing) that is likely to remain a key medium-term driver for EUR/JPY. For US-dollar-based readers, this dynamic is broadly analogous to how Fed-ECB policy divergence has historically driven EUR/USD trends, but applied here to the yen leg instead.
Looking Ahead
The next ECB Monetary Developments release, covering August data, is expected in late September. Two things to watch: (1) whether the negative reading in general government credit deepens further, and (2) whether non-financial corporate loan growth continues its climb toward the high-4% range.
Disclaimer: This article is for informational purposes only. All investment decisions are made solely at your own risk.