📺 Watch the Full Video Analysis
This article was automatically generated by the NFC Market Live AI analysis system. (Updated: 2026-10-29 05:21 JST)
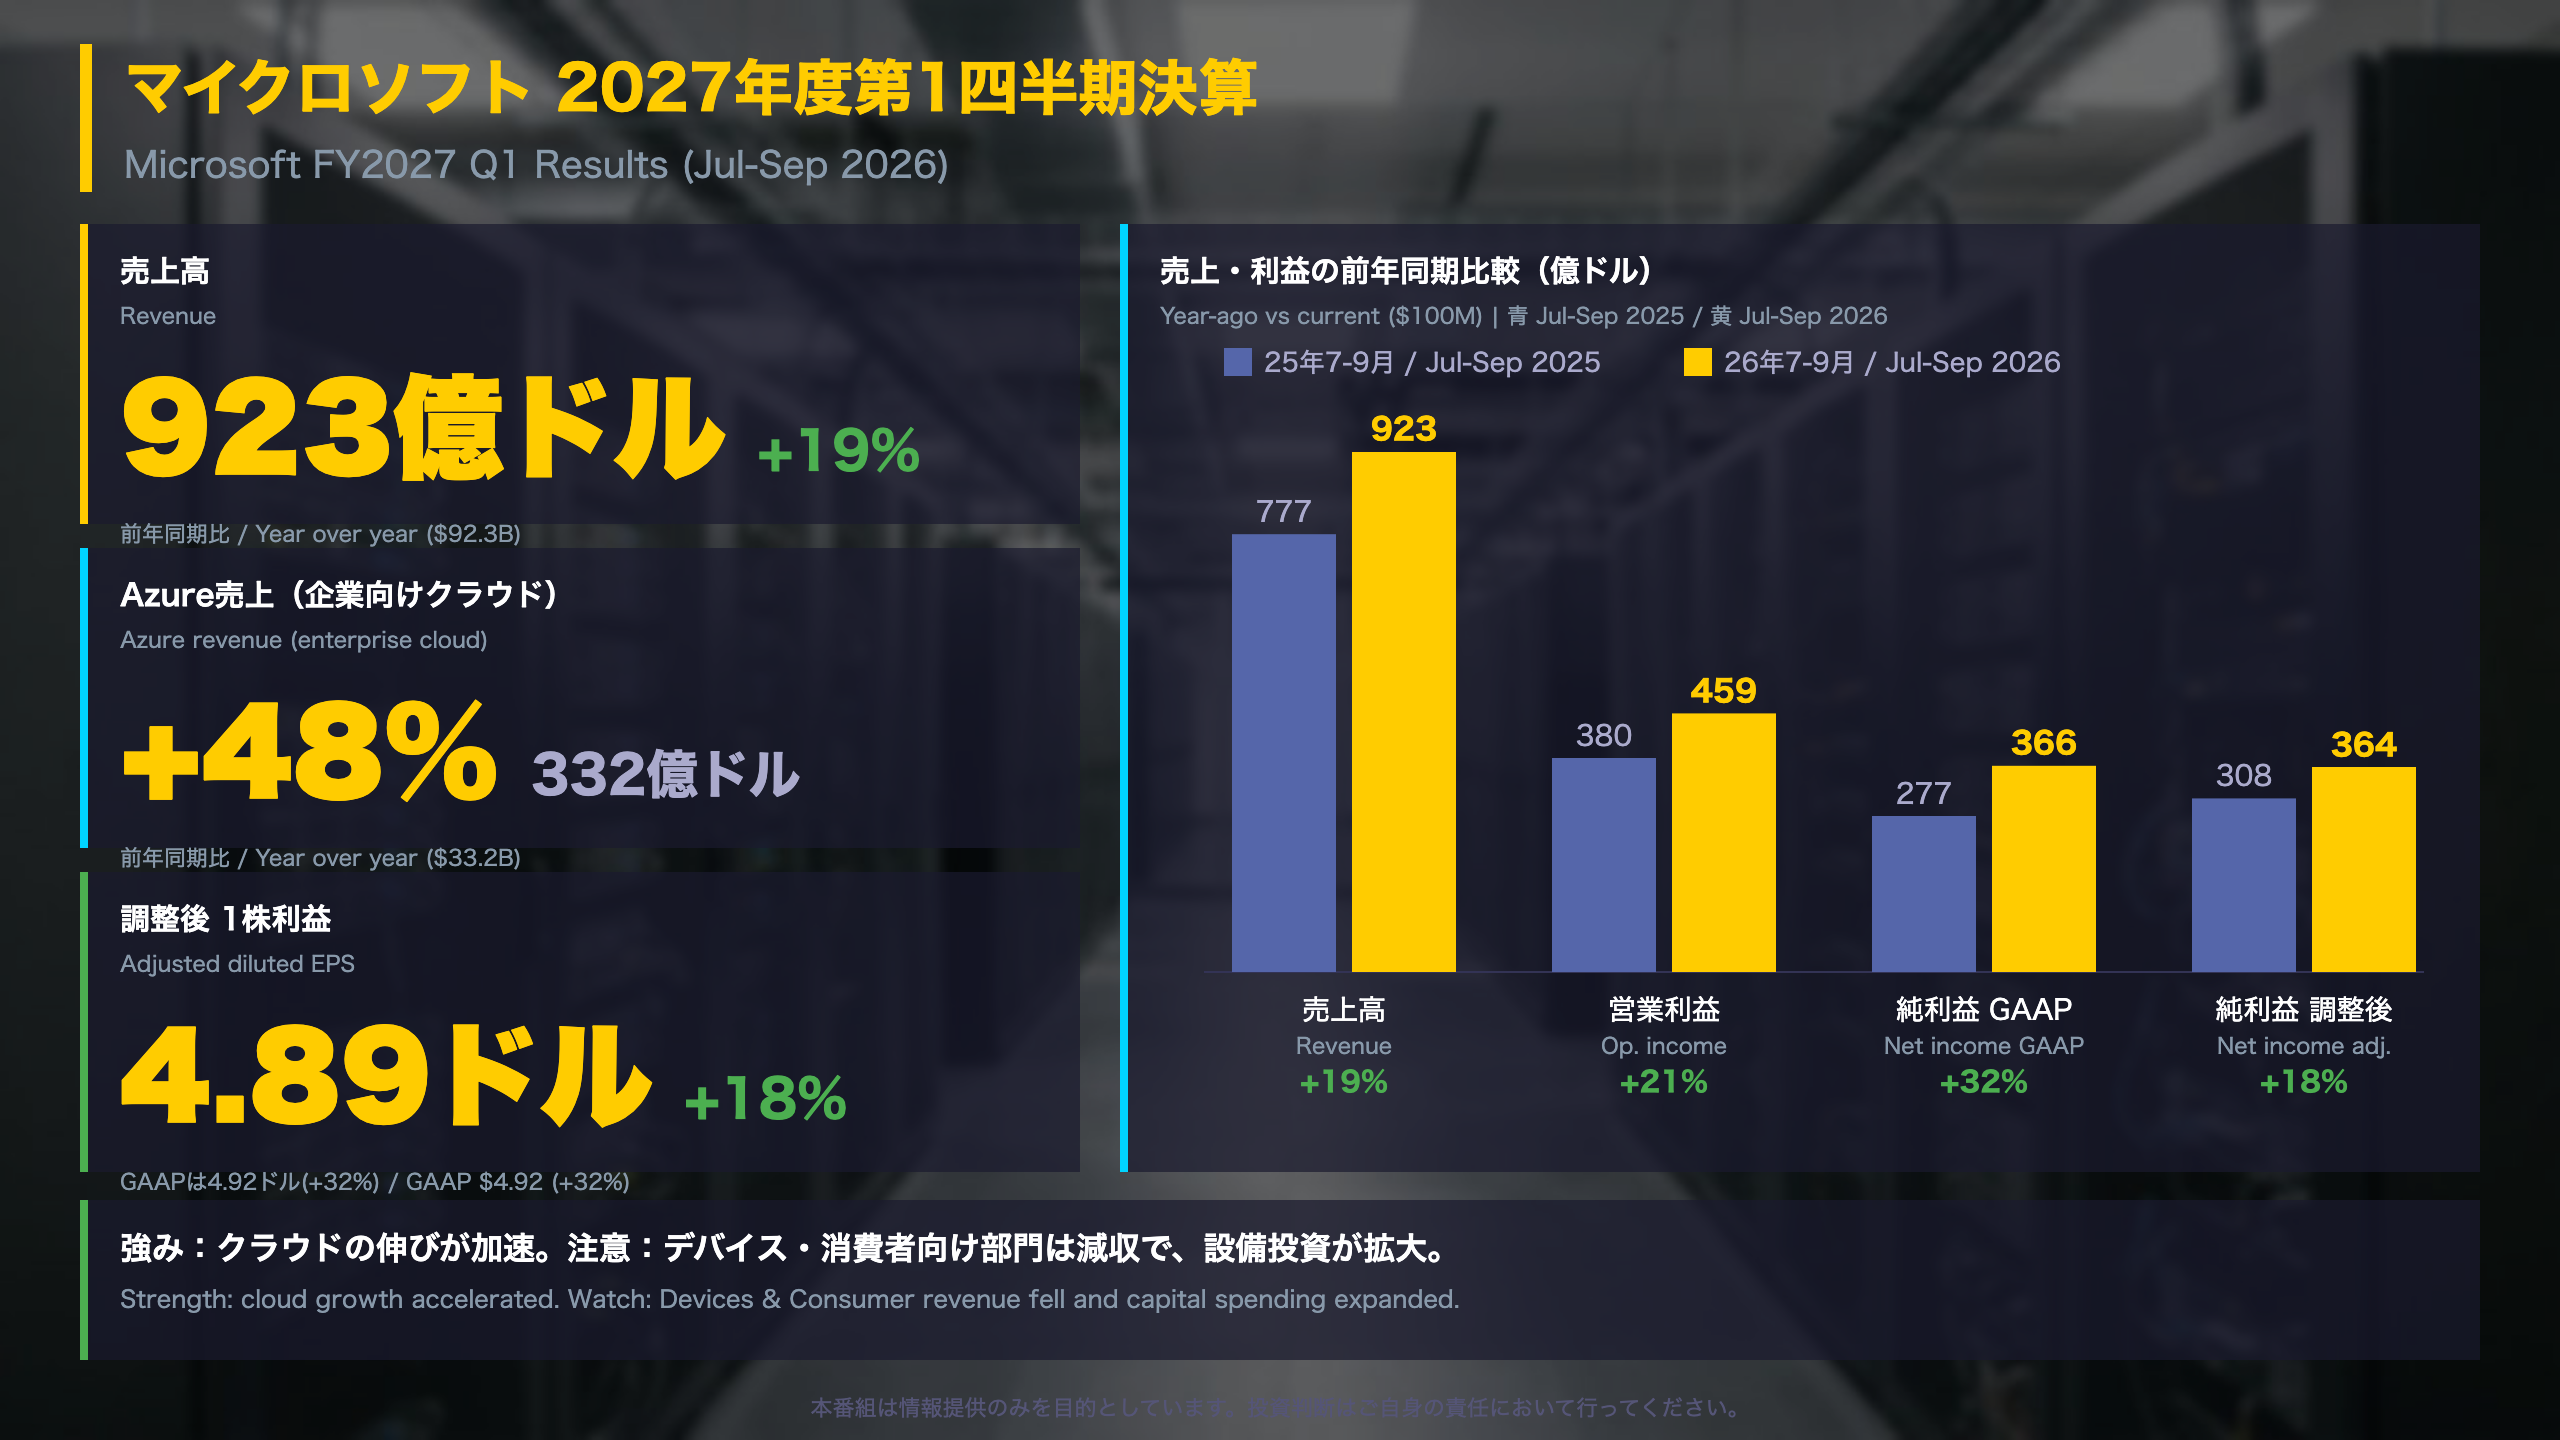
📊 Microsoft reported fiscal Q1 2027 (Jul-Sep 2026): revenue $92.3B (+19%), operating income $45.9B (+21%).
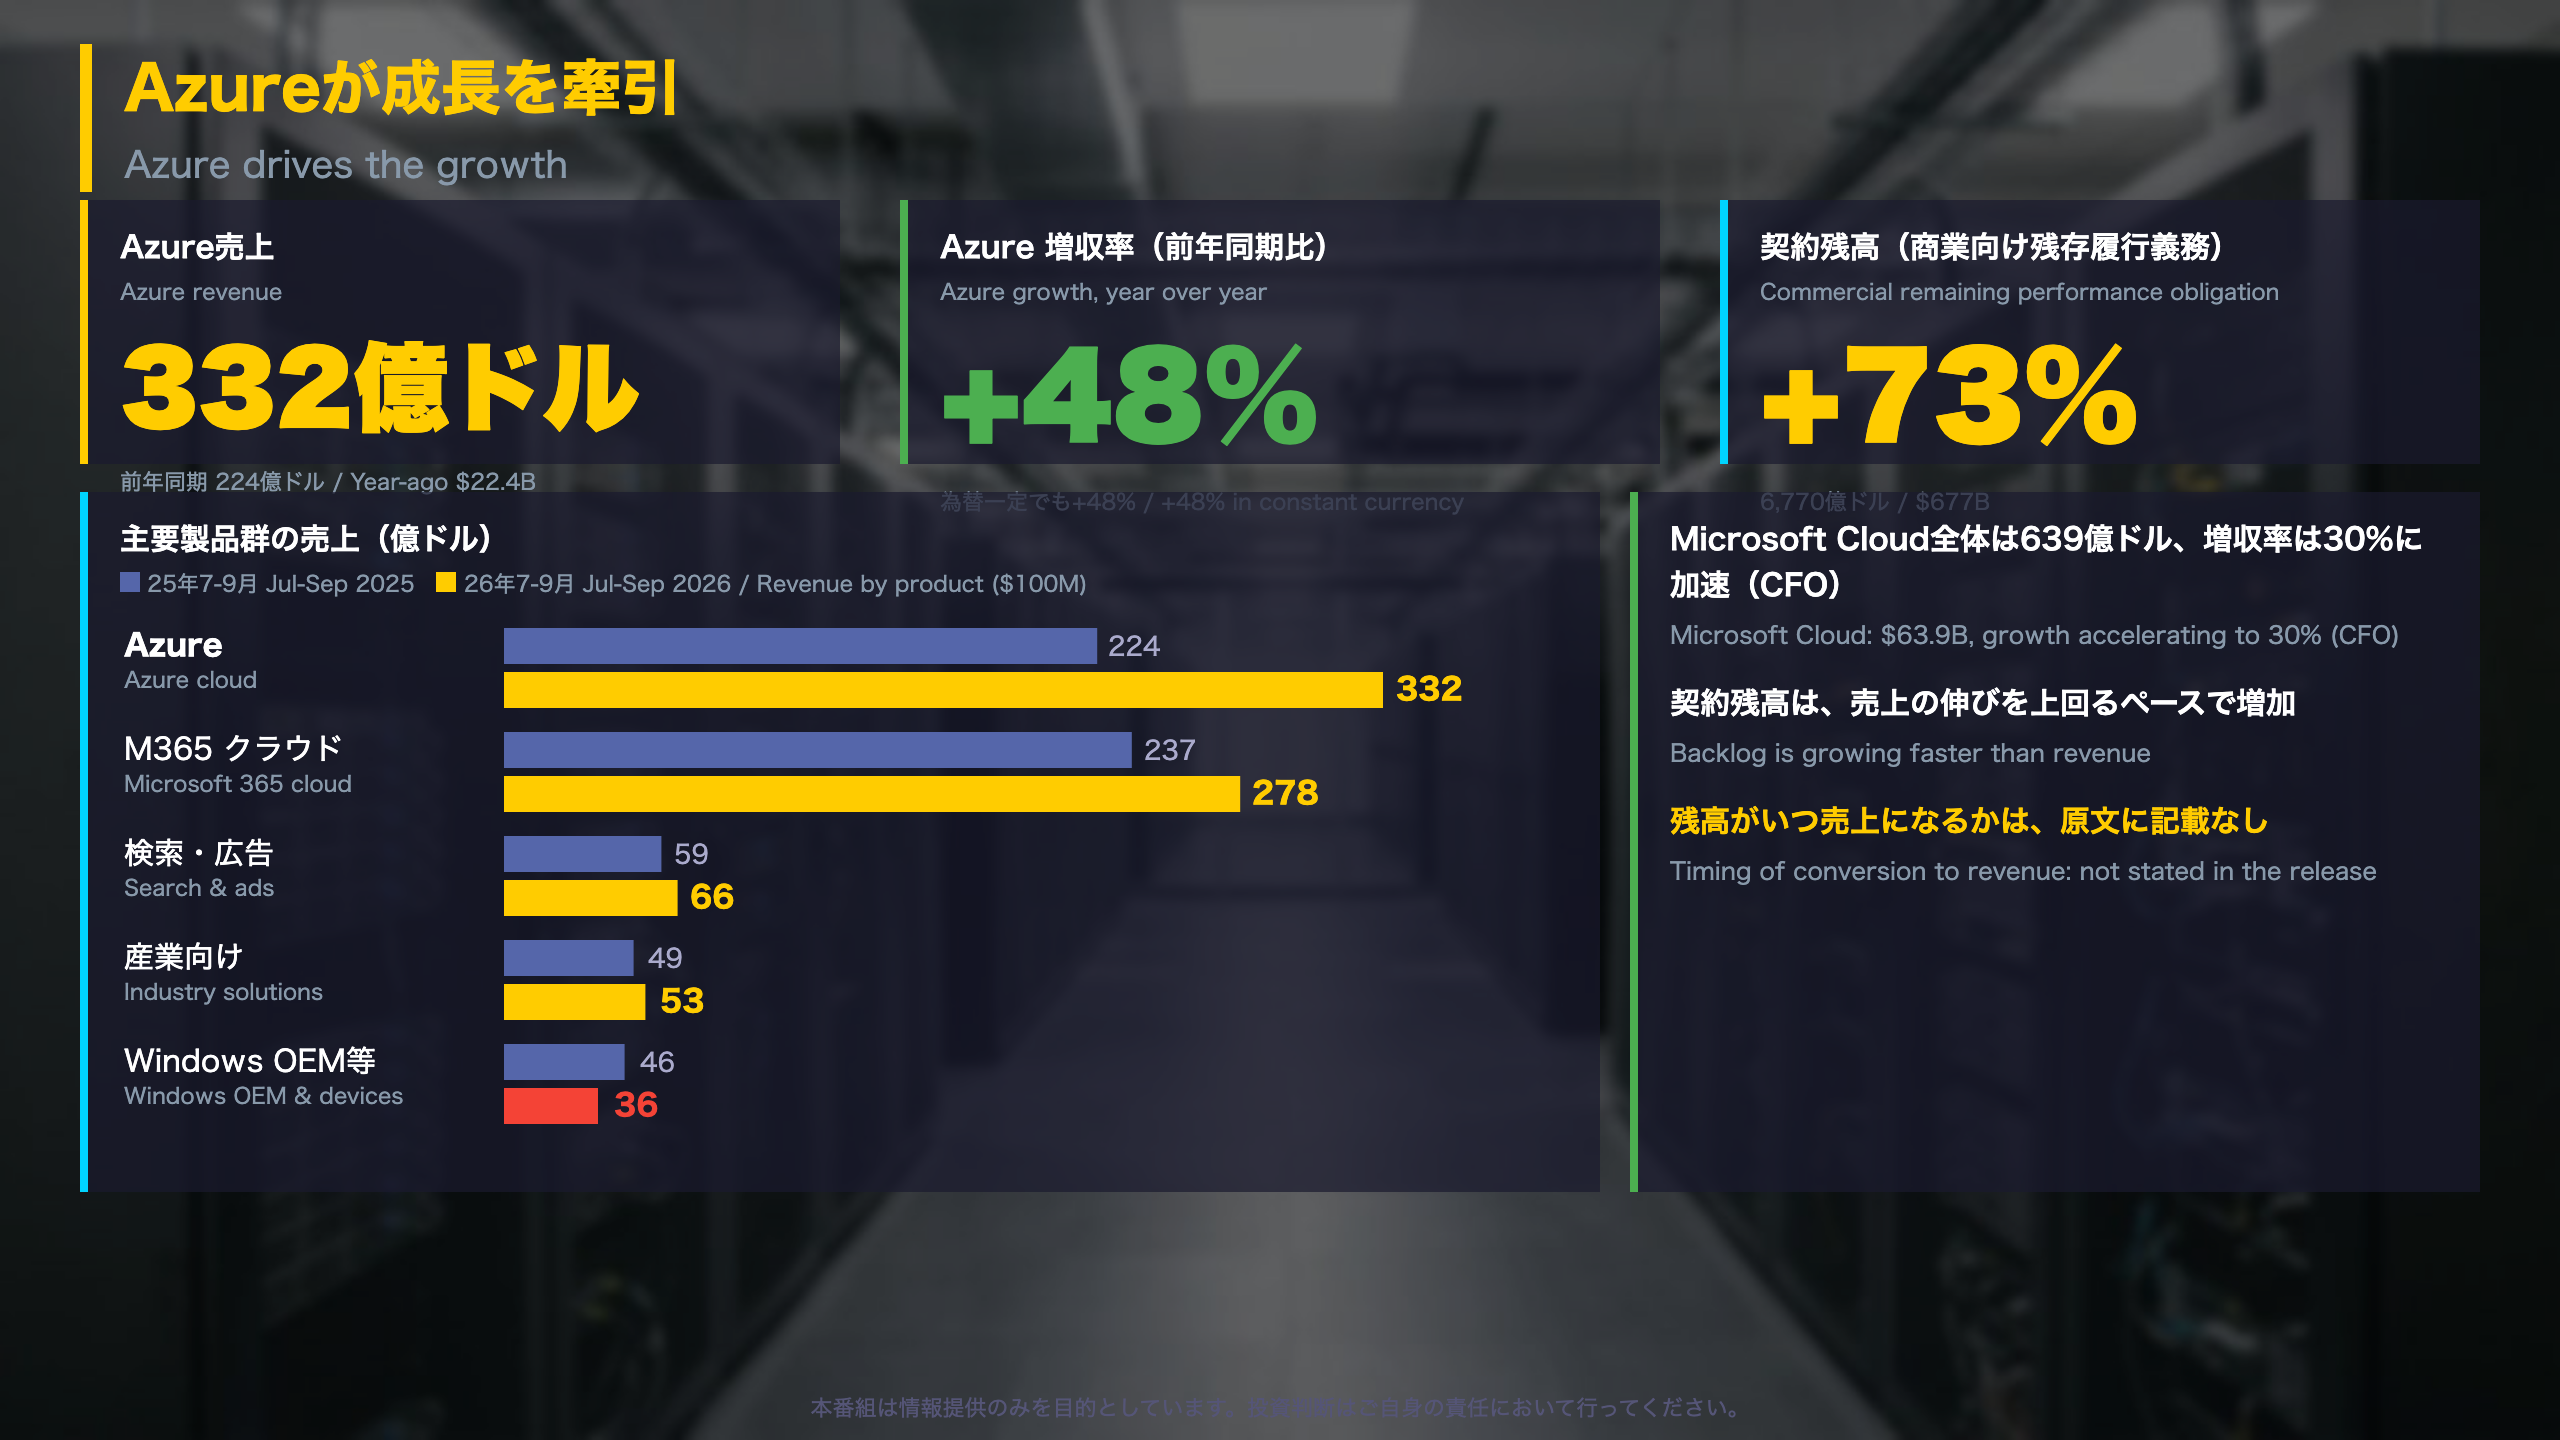
☁️ Azure grew 48%. Commercial backlog (RPO) rose 73% to $677B, and Microsoft Cloud growth accelerated to 30%.
💡 GAAP net income rose 32%, but that includes a rebound from last year’s OpenAI investment loss. Adjusted net income rose 18%, close to the pace of revenue growth.
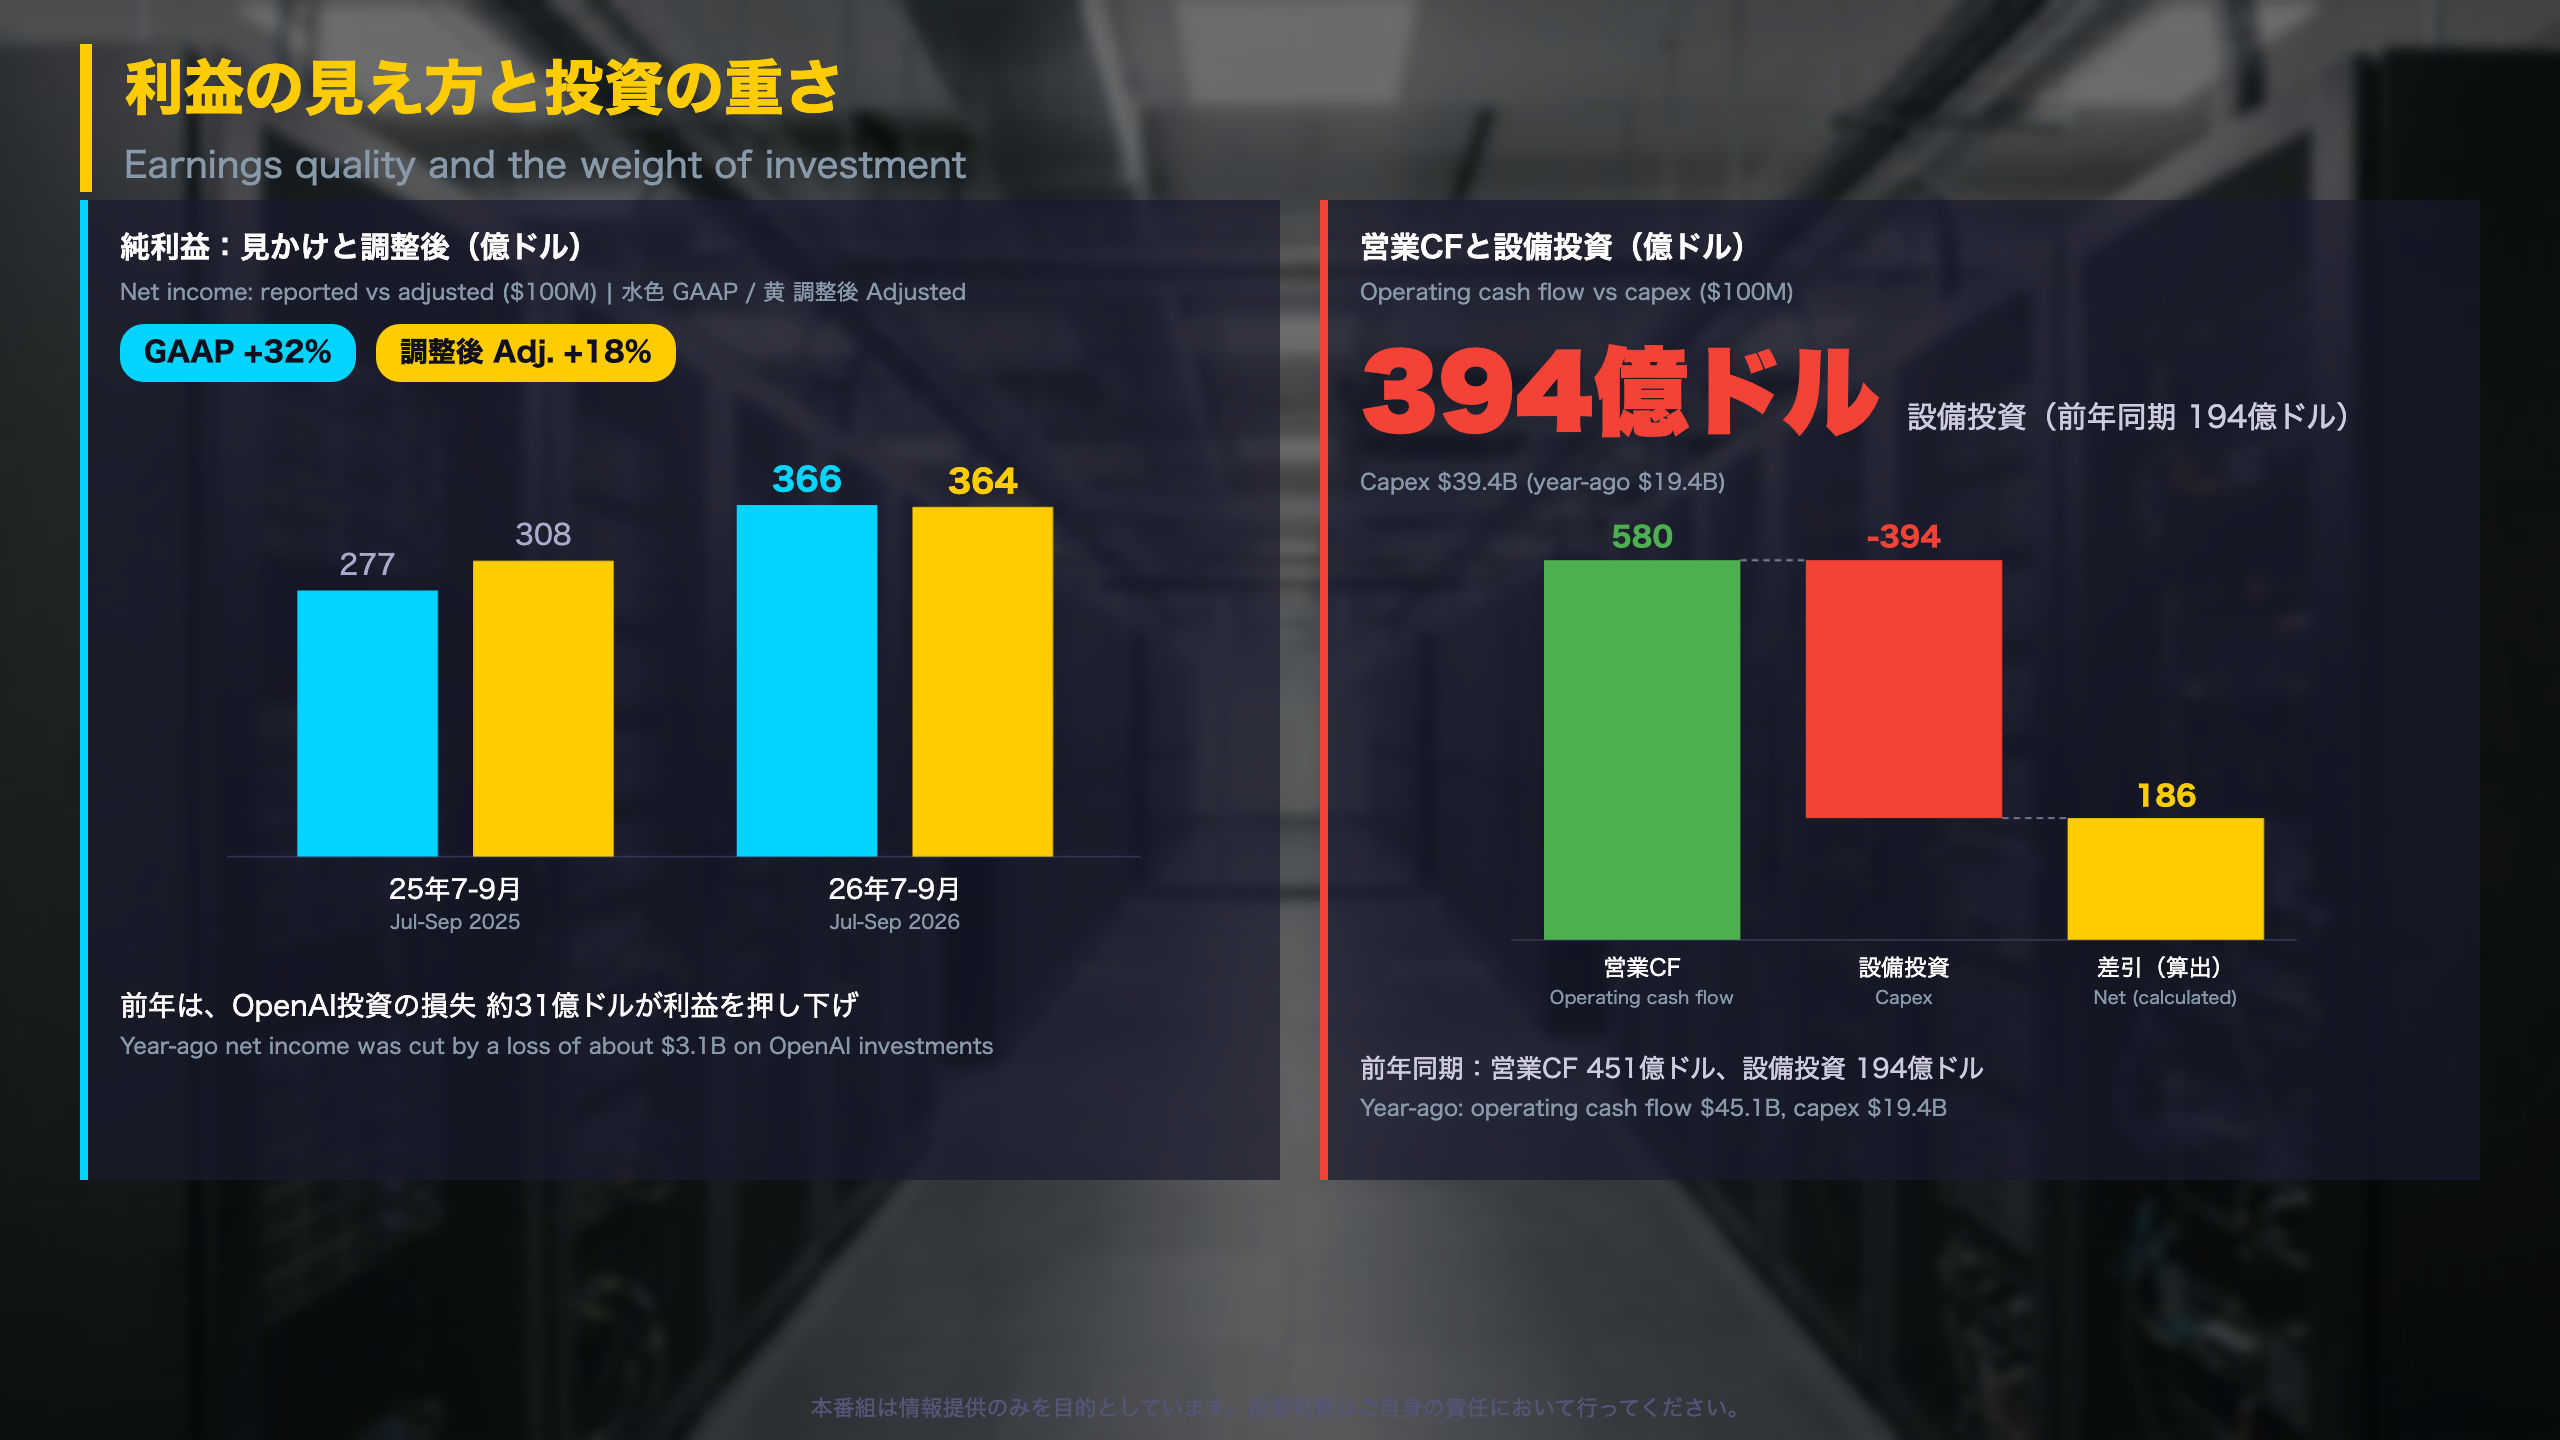
⚠️ Capex reached $39.4B, about double a year earlier, while Windows OEM & devices revenue fell 22%.
📅 Forward guidance is to be given on the earnings call; no figures appear in the release. We read both the strengths and the weights.
決算サマリー:売上19%増とAzure48%増
Microsoft FY2027 Q1: the headline picture
Microsoft’s fiscal year starts in July, so the quarter ended September 30, 2026 is the first quarter of fiscal 2027. The release is an SEC Form 8-K exhibit: a company-prepared, unaudited summary that does not compare results with analyst consensus. This note therefore reads the numbers against the year-ago quarter only.
Key figures
- Revenue: $92.3B, +19% year over year
- Operating income: $45.9B, +21% (+22% in constant currency)
- Net income: $36.6B GAAP (+32%); $36.4B non-GAAP (+18%)
- Diluted EPS: $4.92 GAAP; $4.89 non-GAAP
Why two profit measures?
Microsoft strips out the effect of its OpenAI investments. A year ago that item cut net income by about $3.1B; this quarter it added about $0.2B. GAAP growth is therefore flattered by an easy comparison, and the non-GAAP +18% is the cleaner like-for-like figure, roughly in line with 19% revenue growth.
Independent observation
Operating margin edged up to about 49.8% from 48.9% (our calculation), yet gross margin slipped to about 67.8% from 69.0%, because service cost of revenue rose about 29% against 19% revenue growth. Strong demand and rising delivery cost are visible in the same filing.
What the release does not say
Forward guidance was deferred to the earnings call; no figures appear in the text, and the next earnings date is not stated.
深掘り1:成長を引っ張るAzureと契約残高
Azure and the cloud engine
Azure revenue was $33.2B versus $22.4B a year earlier (+48%, the same in constant currency). Microsoft Cloud as a whole reached $63.9B (+30%, or +31% in constant currency), which CFO Amy Hood described as growth ‘accelerating to 30%’.
Reading the product table
| Product | Q1 FY27 | Q1 FY26 |
|---|---|---|
| Azure | $33.2B | $22.4B |
| Microsoft 365 cloud | $27.8B | $23.7B |
| Search & advertising | $6.6B | $5.9B |
| Windows OEM & devices | $3.6B | $4.6B |
Microsoft 365 commercial cloud grew 18% on an adjusted basis (17% reported); the adjustment removes a one-point benefit from revenue timing in the prior year.
The backlog figure
‘Commercial remaining performance obligation’ is contracted revenue not yet recognized, similar to the backlog metric investors track at software and industrial companies. It rose 73% to $677B, far faster than the 19% growth in total revenue, but the release gives no schedule for recognition.
Independent view
The Agents and Infra segment earned $40.6B of operating income on $76.8B revenue, a margin near 52.8% versus 53.1% a year ago (our calculation). Growth did not come at the cost of segment profitability this quarter. The release’s risk factors flag infrastructure capacity (‘inability to develop and expand adequate infrastructure’) as a dependency, which links this strength to the capex discussion that follows.
深掘り2:利益の見え方と設備投資の重さ
Earnings quality and the cost of building capacity
Reported vs adjusted
GAAP net income was $36.6B (+32%). Microsoft also reports a non-GAAP figure excluding the effect of its OpenAI investments: a net loss of roughly $3.1B hit the year-ago quarter, while this quarter carried a gain of about $0.2B. Other income was +$38M versus -$3,660M a year earlier. That swing explains why GAAP growth (+32%) outruns the adjusted +18%.
‘Microsoft believes these non-GAAP measures assist investors by providing additional insight into its operational performance.’
Cash and capex ($B)
| Item | Q1 FY27 | Q1 FY26 |
|---|---|---|
| Operating cash flow | 58.0 | 45.1 |
| Additions to property & equipment | 39.4 | 19.4 |
| Depreciation & amortization | 11.7 | 8.1 |
| Cash + short-term investments | 64.5 (Sep 30) | 76.8 (Jun 30) |
Independent analysis
Operating cash flow minus capex is about $18.6B this quarter versus $25.7B a year ago (our calculation): still strongly positive, but narrower. Net property and equipment rose to $346.8B from $313.1B at June 30, and depreciation is up about 44%, so higher investment is starting to appear in the cost base. Against that, R&D grew about 11% and operating margin still rose.
What is not stated
The release gives no capex plan. Debt repayments ($4.85B) and shareholder returns (company-reported $10.2B) also drew on cash. The earnings-call guidance is the next place to look.
質疑で深める:強さと重さの両面
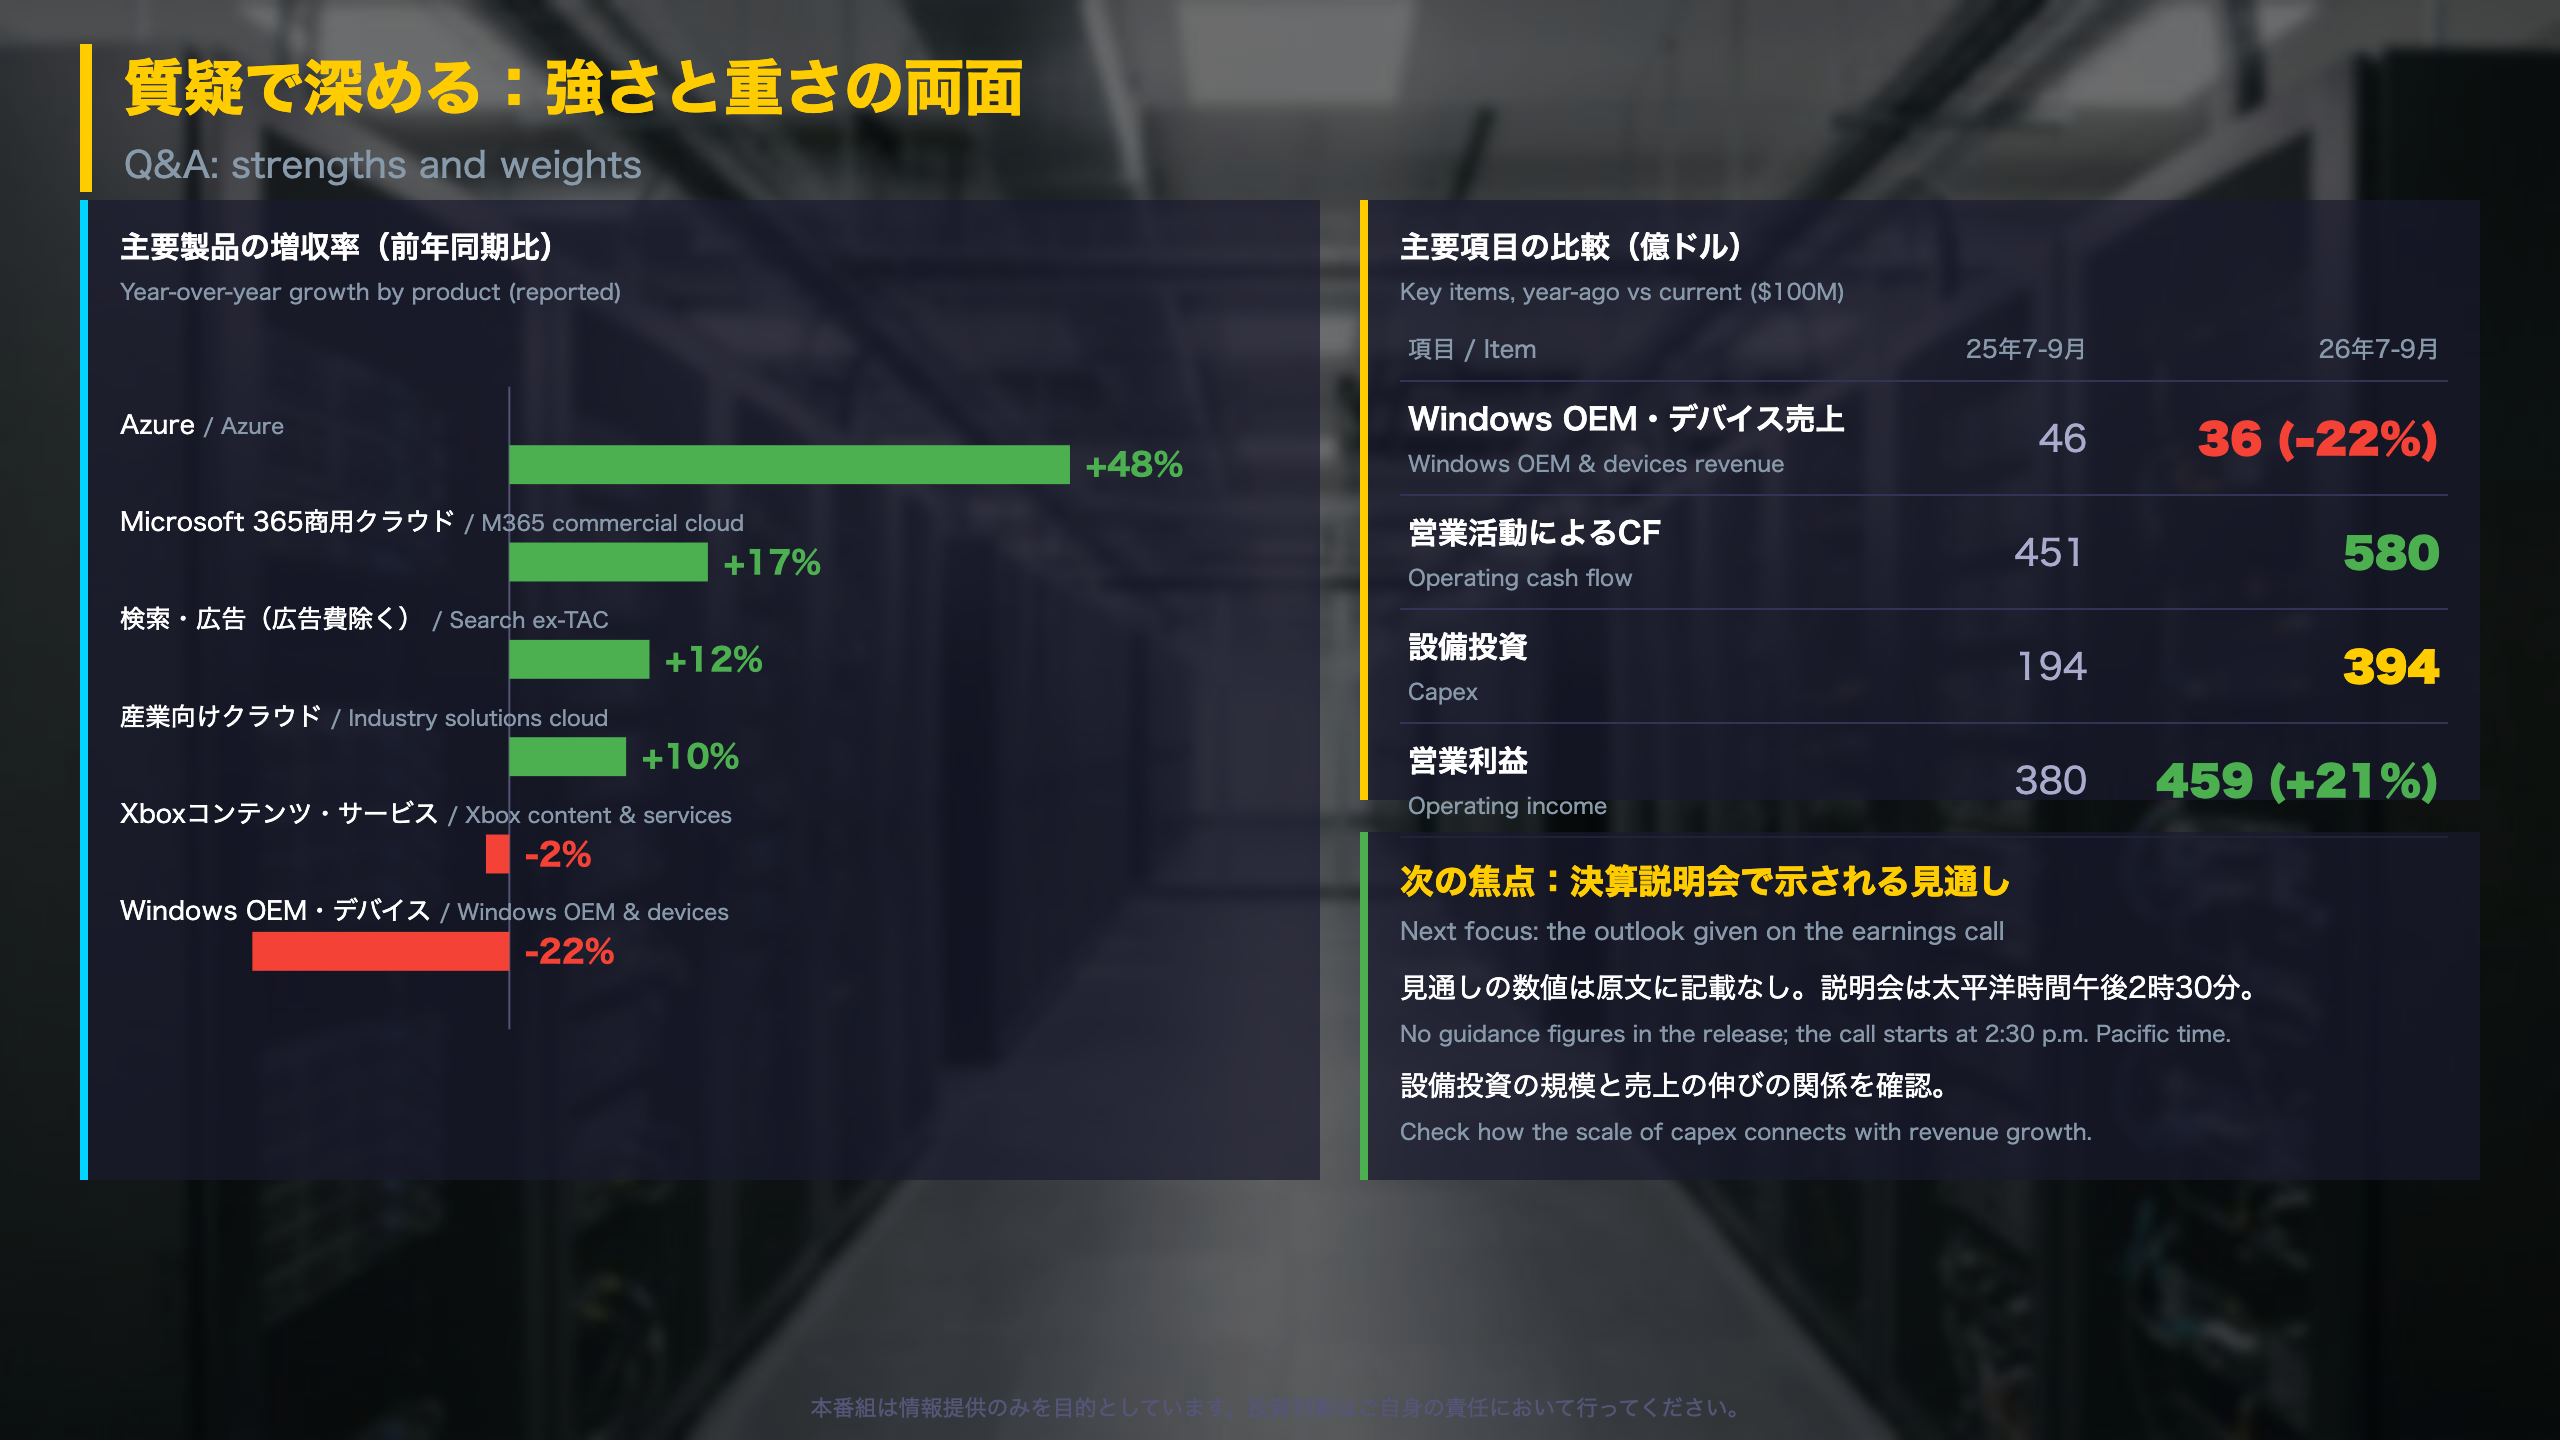
Weak spots, balance, and what the release leaves open
The Devices and Consumer segment
| Item | Q1 FY27 | Q1 FY26 |
|---|---|---|
| Segment revenue | $15.5B (-3%) | $16.0B |
| Segment operating income | $5.36B | $5.24B |
| Windows OEM & devices | $3.55B (-22%) | $4.55B |
| Xbox | $5.38B (content & services -2%) | $5.51B |
| Search & advertising | $6.55B (+12% ex-TAC) | $5.94B |
Segment profit still edged up (about +2%, our calculation) because both cost of revenue ($5.83B vs $6.34B) and operating expenses ($4.29B vs $4.42B) fell. Prior-year figures are recast for the segment changes Microsoft announced in September 2026, so comparisons are on the new basis.
A historical anchor
The long-run XBRL series supplied with this filing stops in 2010, when quarterly revenue was about $16.2B. This quarter’s $92.3B is roughly 5.7 times that (our calculation), a reminder of scale rather than a like-for-like trend.
What to check next
Management said it would give guidance on the 2:30 p.m. Pacific call; the release contains no numbers and no date for the next report. The forward-looking risk list cites ‘substantial investments in cloud and AI strategy that depend on customer demand, technological developments, competitive dynamics, and regulatory condition.’
Balanced reading
The bull case: cash flow covers capex and margins rose. The cautious case: the PC-related decline and the payoff timing of heavy investment cannot be judged from this document alone.
Disclaimer: This article is for informational purposes only. All investment decisions are made solely at your own risk.