📺 Watch the Full Video Analysis
This article was automatically generated by the NFC Market Live AI analysis system. (Updated: 2026-07-31 05:17 JST)
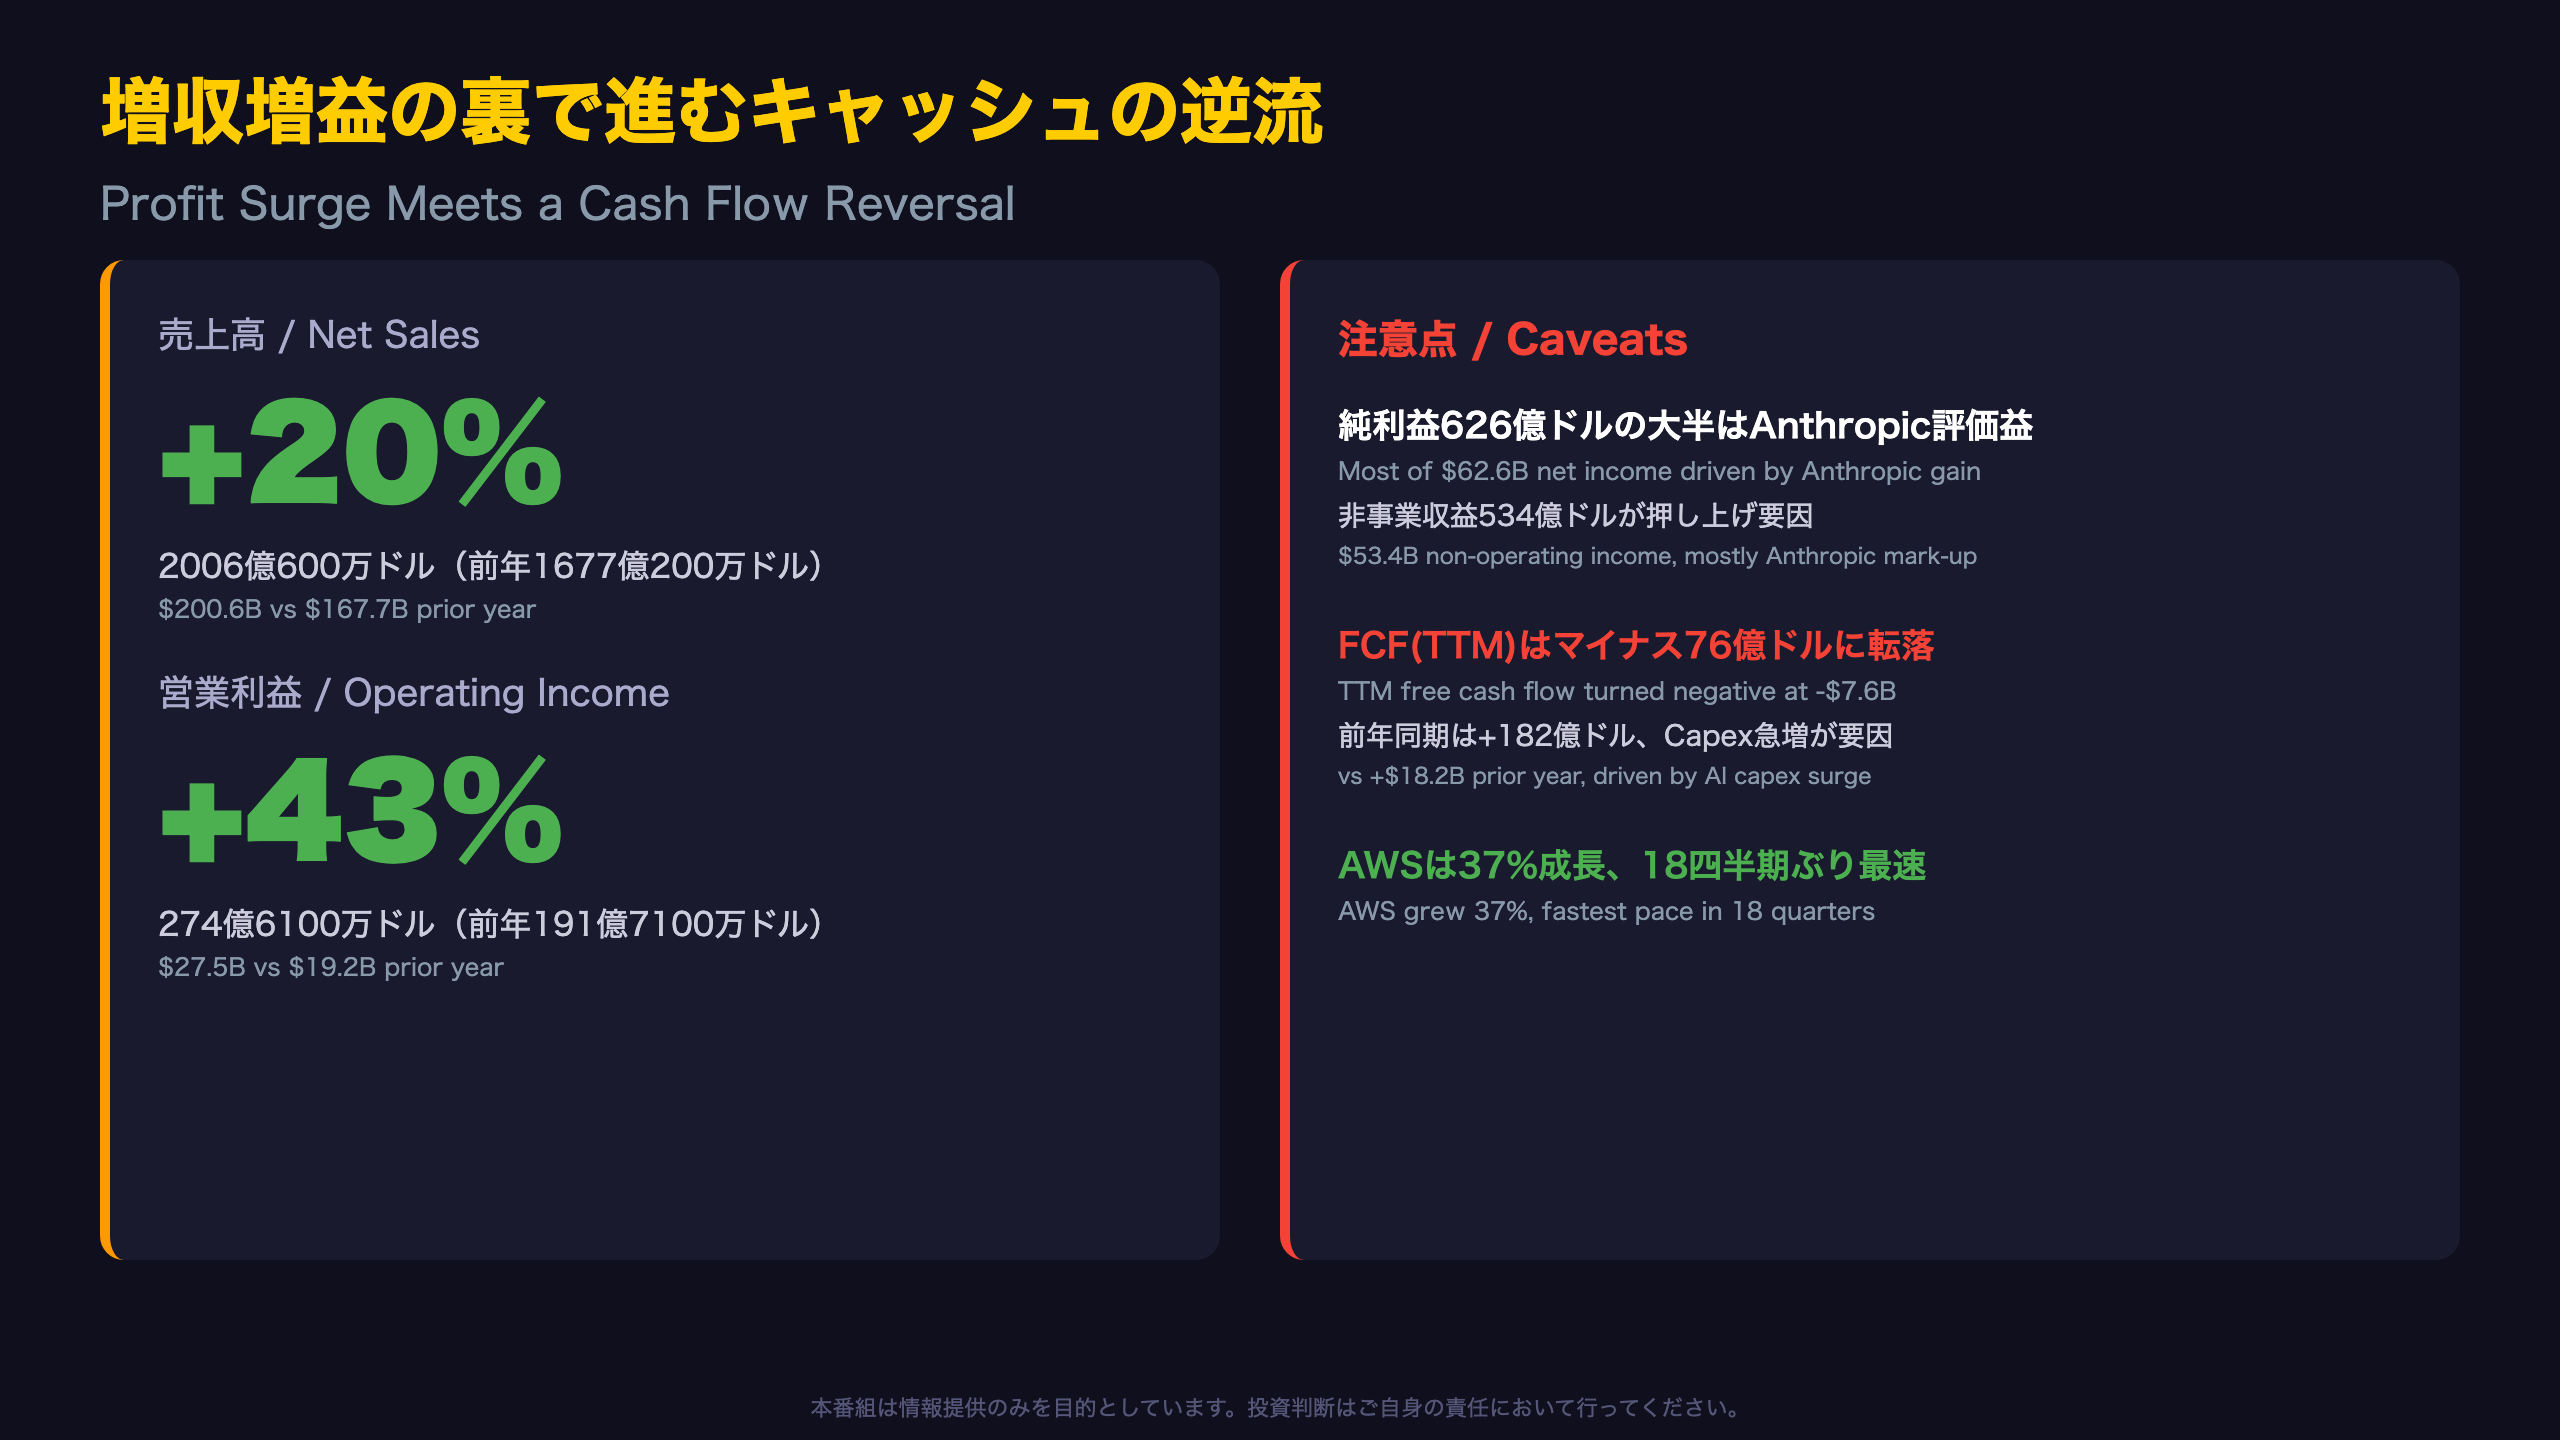
📊 Amazon reported Q2 2026 results: net sales of $200.6B (+20% YoY) and operating income of $27.5B (+43% YoY).
AWS accelerated to 37% growth — its fastest pace in 18 quarters — hitting a $169B annualized run rate.
💡 But net income of $62.6B was largely driven by a $53.4B non-operating gain tied to Amazon’s Anthropic investment.
⚠️ Trailing-12-month free cash flow flipped negative to -$7.6B as AI-driven capex surged to $169.0B.
We break down the strength and the hidden strain behind this quarter’s numbers.
増収増益の裏で進むキャッシュの逆流
Beyond the Headline: Reading Amazon’s Q2 2026 Print
Amazon’s fiscal Q2 2026 headline numbers were unambiguously strong: net sales of $200.6 billion (+20% YoY) and operating income of $27.5 billion (+43% YoY). But the eye-popping $62.6 billion net income figure — a 245% jump — deserves closer scrutiny.
The Anthropic Effect
Per the earnings release: “Second quarter 2026 net income includes non-operating pre-tax other income of $53.4 billion, primarily from our investments in Anthropic.” More than $53 billion of the net income swing came from a mark-to-market gain on Amazon’s Anthropic stake — not from selling more cloud capacity or ads. Analysts building forward EPS models should strip this out.
Free Cash Flow Inflection
Trailing-twelve-month FCF flipped to a negative $7.6 billion, versus a positive $18.2 billion a year earlier — a swing of roughly $25.8 billion. The company attributes this to a $66.1 billion YoY capex increase, stating: “This increase primarily reflects investments in artificial intelligence.” TTM operating cash flow grew 33% to $161.4 billion, but capex (TTM $169.0 billion, +64%) outpaced it.
Sector Context
This mirrors capex supercycles flagged by Microsoft and Meta in recent quarters — a broader hyperscaler theme, not an Amazon-specific anomaly.
What to Watch Next
Q3 guidance calls for revenue of $197.0-$202.0 billion and operating income of $22.5-$26.5 billion. Watch whether AWS sustains 37% growth and whether capex growth decelerates.
EPS5.75ドルの内側——Anthropic評価益が純利益を押し上げ
GAAP Net Income vs. Operating Reality
Unlike companies that exclude equity-investment mark-to-market gains from non-GAAP EPS, Amazon does not strip these from GAAP net income — and this matters enormously this quarter.
The Numbers That Matter
- Operating income: $27.5B (+43% YoY) — the cleanest read on core performance
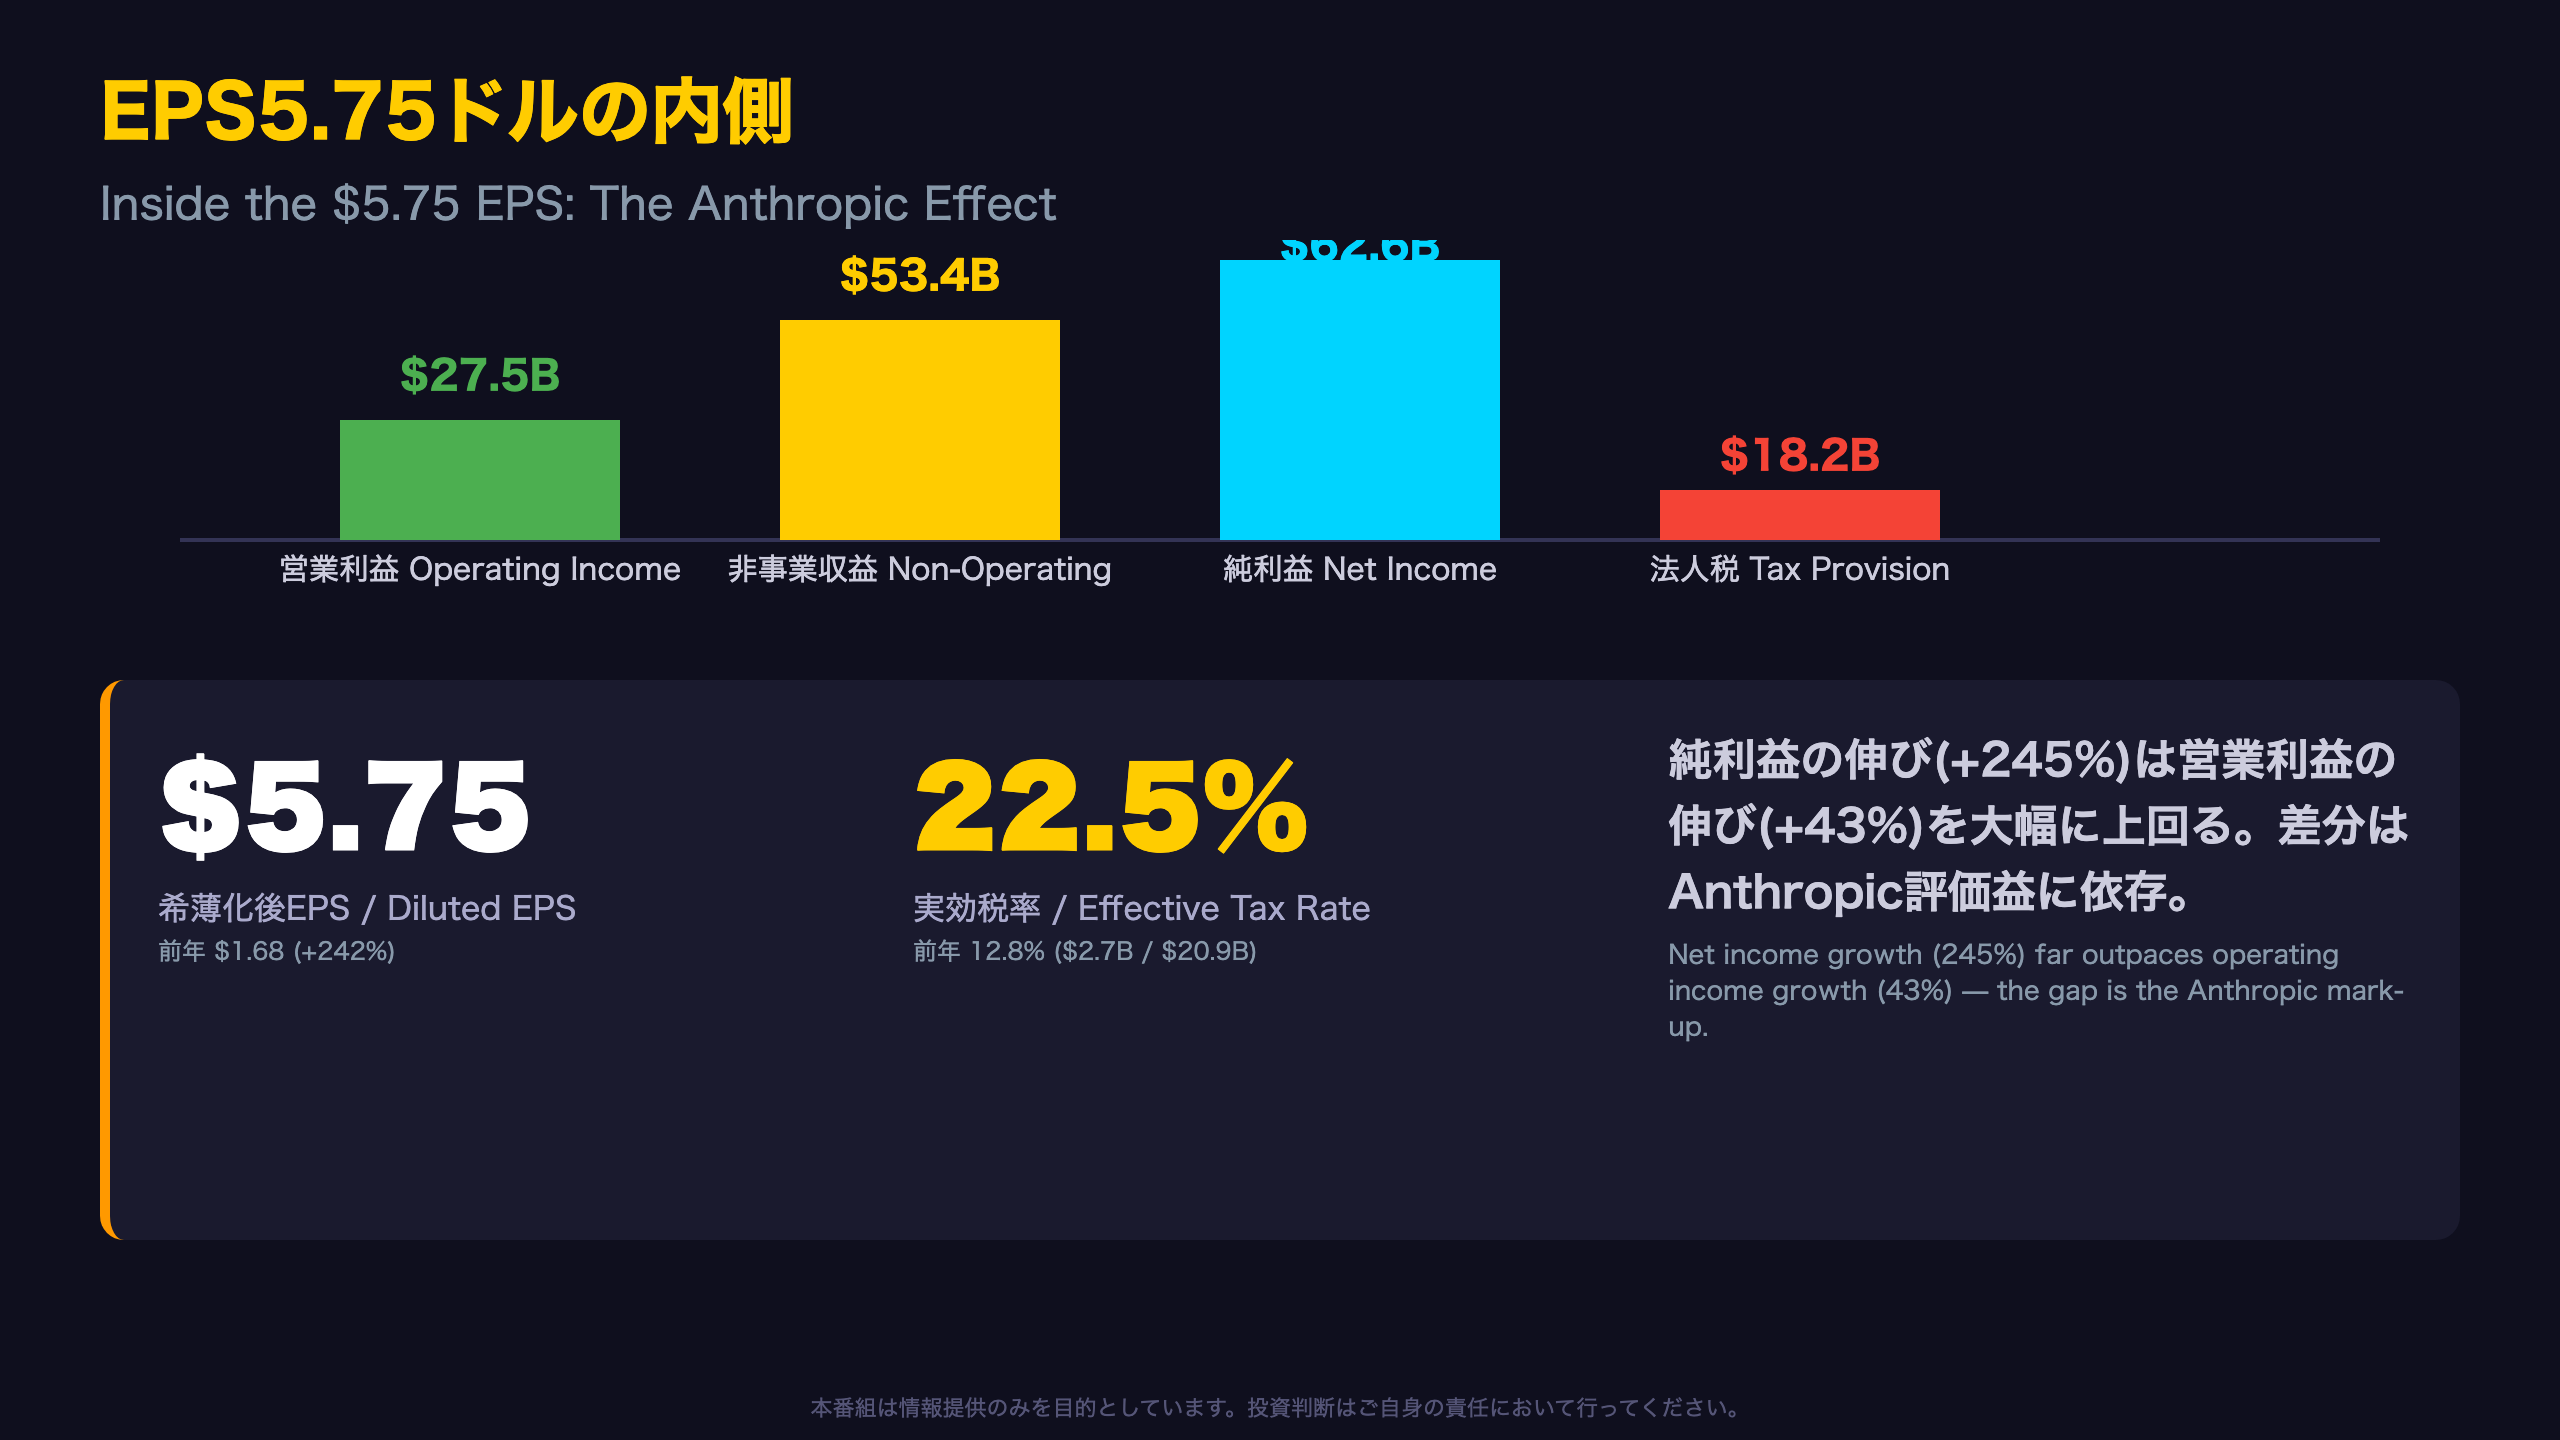
- Non-operating income: $53.4B (vs. $1.7B a year ago), primarily an Anthropic gain
- Pre-tax income: $80.9B (vs. $20.9B)
- Tax provision: $18.2B (vs. $2.7B), effective rate ~22.5%
- Net income: $62.6B (+245%)
The gap between operating income growth (43%) and net income growth (245%) is the single most important quality-of-earnings signal here, similar to periodic mark-to-market swings seen at other tech firms holding large strategic equity stakes.
Six-Month Confirmation
Over six months, non-operating income rose to $69.4 billion from $5.0 billion a year earlier — confirming this isn’t a one-off anomaly.
Investor Takeaway
When modeling forward EPS, analysts should anchor on operating income (+43%) rather than headline EPS ($5.75, +242%), since the latter is materially inflated by a non-cash valuation gain that could reverse in a future quarter.
AWSが37%成長、18四半期ぶりの最速——AI・チップ事業も本格離陸
Six Straight Quarters of Acceleration
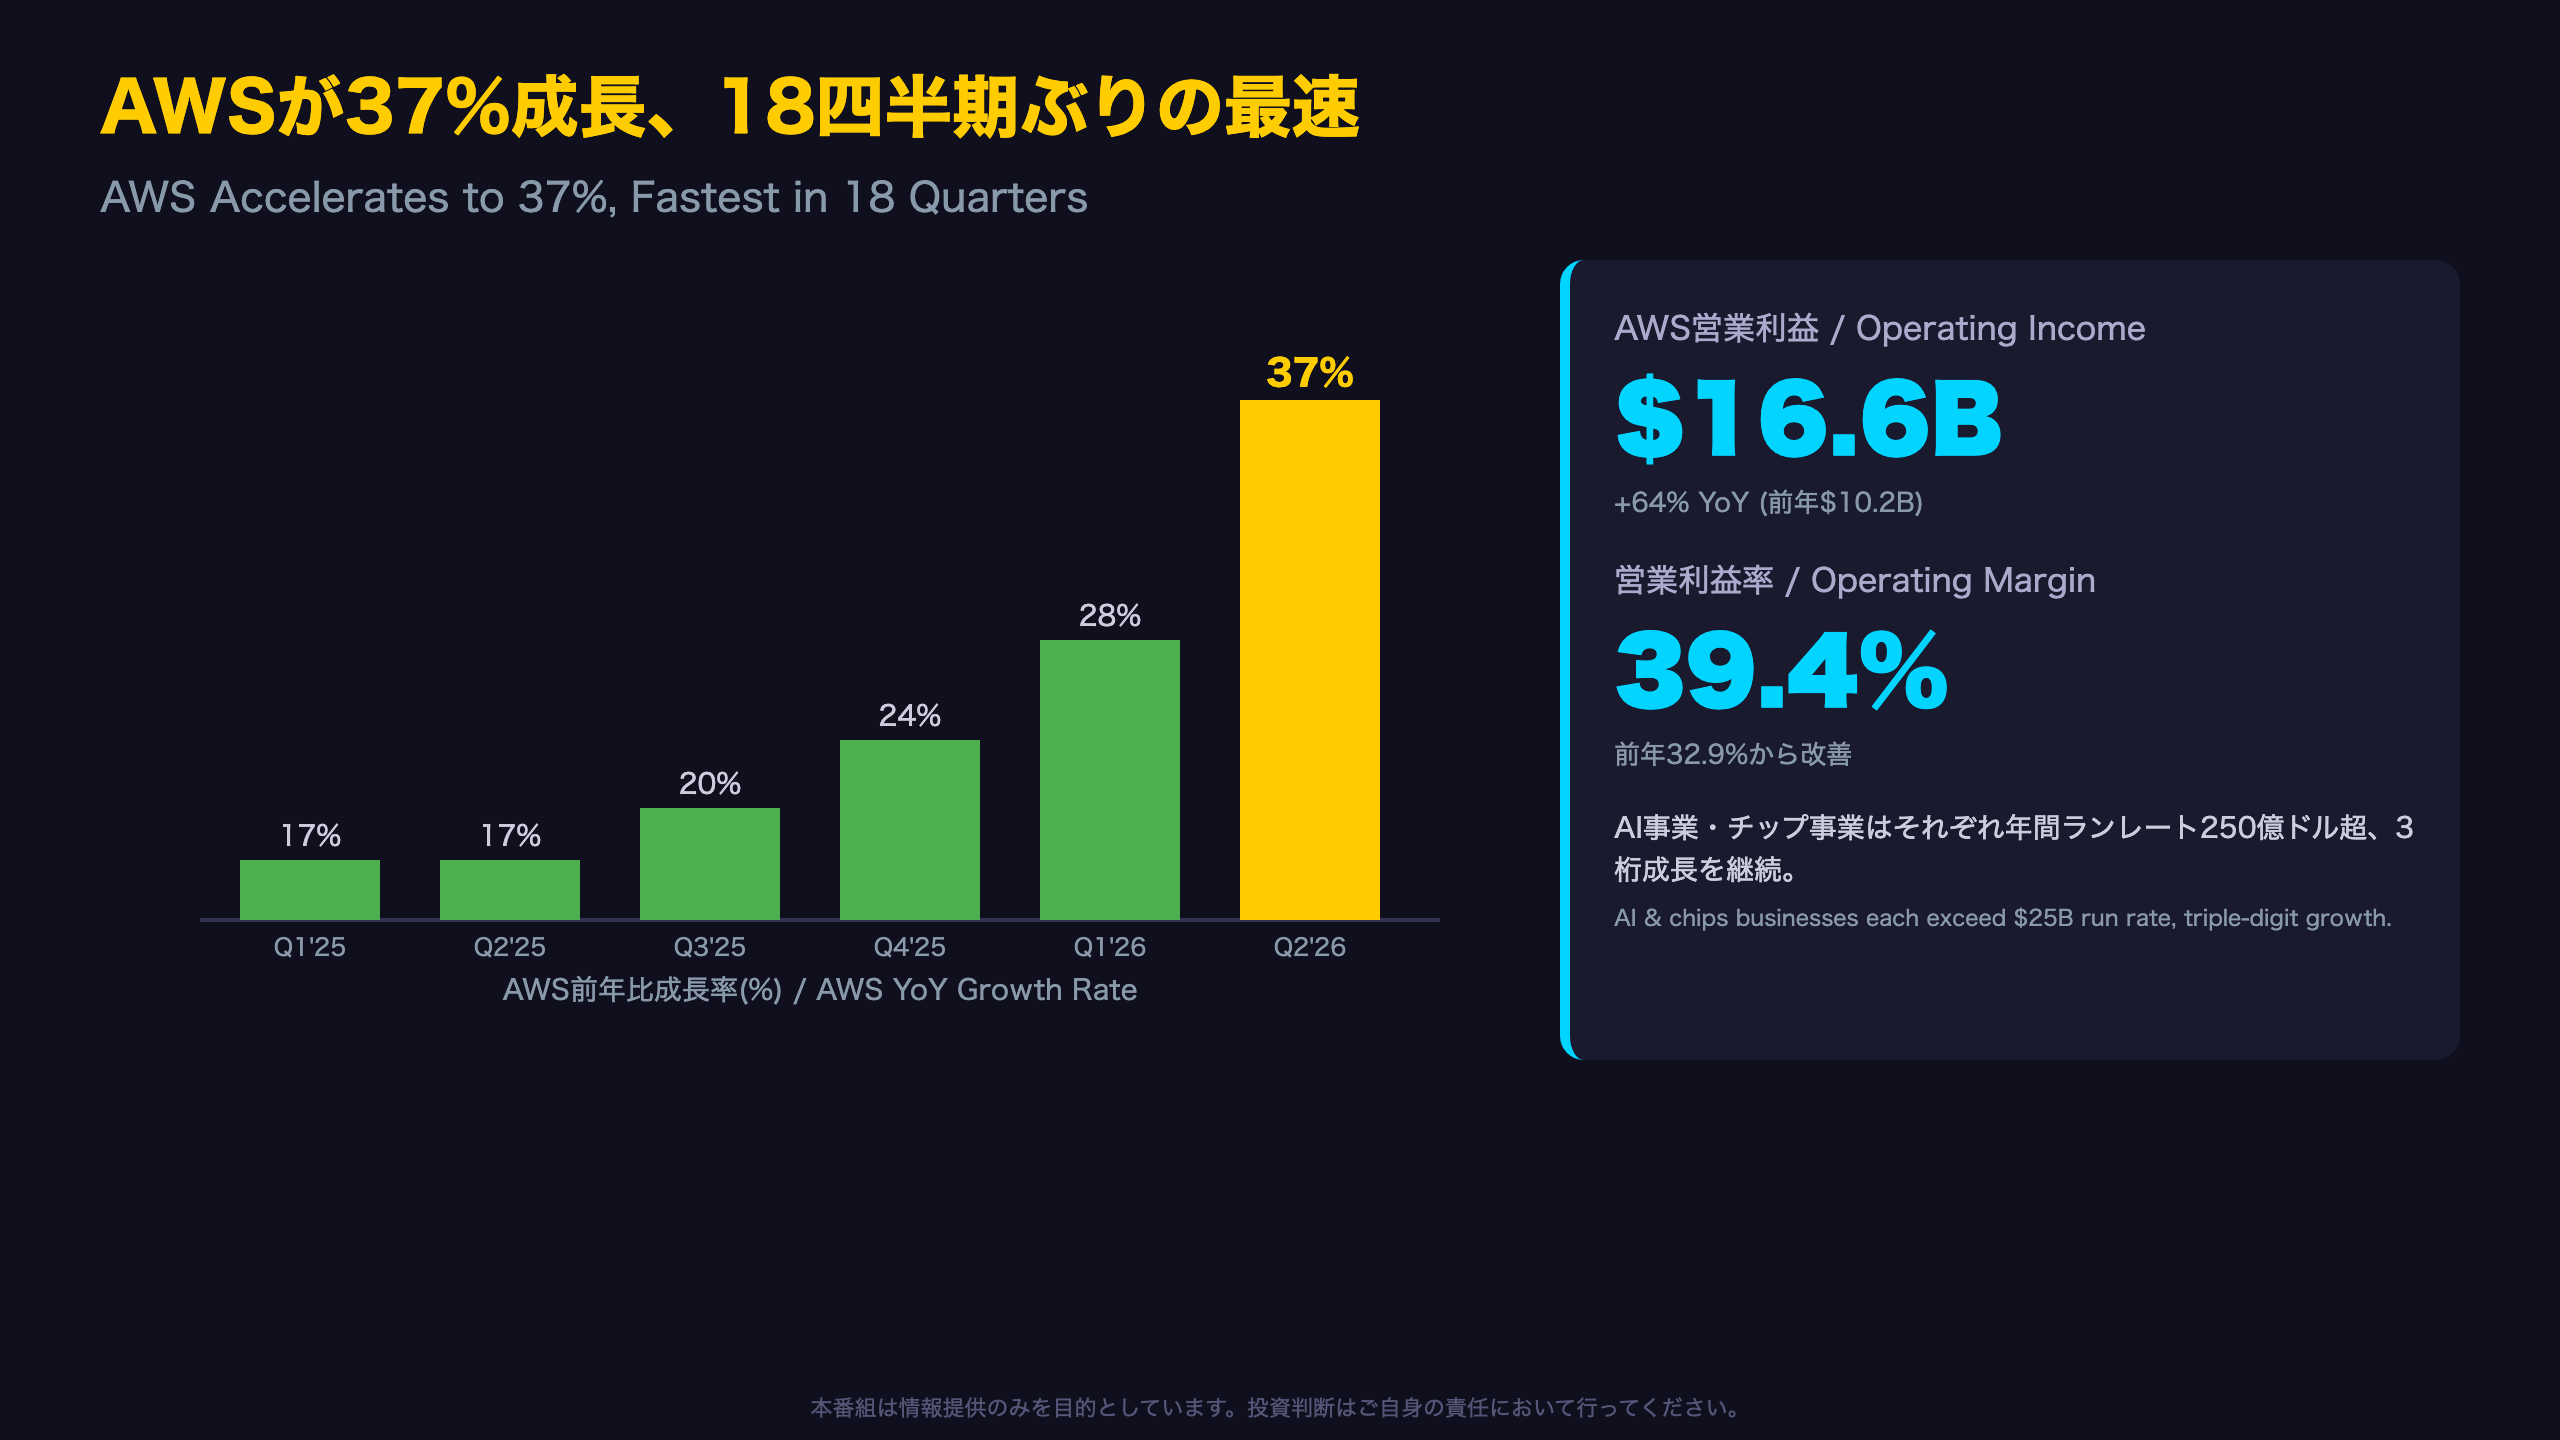
AWS’s year-over-year growth has accelerated for six consecutive quarters: 17% (Q1 2025) → 17% → 20% → 24% → 28% → 37% (Q2 2026). For readers benchmarking against other hyperscalers, this trajectory is notably steeper than growth patterns seen at other cloud providers over the same period.
Margin Expansion Signals Operating Leverage
AWS operating margin improved to 39.4% from 32.9% a year earlier, and from 37.7% just one quarter prior — suggesting revenue growth is currently outpacing the cost of scaling AI compute capacity.
Graviton and Trainium: The Silicon Strategy
Amazon’s custom silicon is a key differentiator versus cloud rivals more reliant on third-party chips. The release notes Graviton is used by “98% of the top 1,000 EC2 customers.” On the AI training side, Trainium has locked in multi-year, multi-gigawatt commitments from both Anthropic and OpenAI — two labs that also compete with each other, both choosing AWS infrastructure.
The Caveat: Small Base, High Growth
Both the AI business and chips business have “each eclipsed run rates of more than $25 billion” — impressive, but still a fraction of AWS’s $148.4 billion TTM revenue.
What’s Next
The key swing factor is whether 30%+ growth and 39%+ margins can both persist into Q3 and Q4, or whether elevated depreciation from new data centers compresses margins even as revenue climbs.
北米も加速、広告事業は26%成長で収益源が多様化
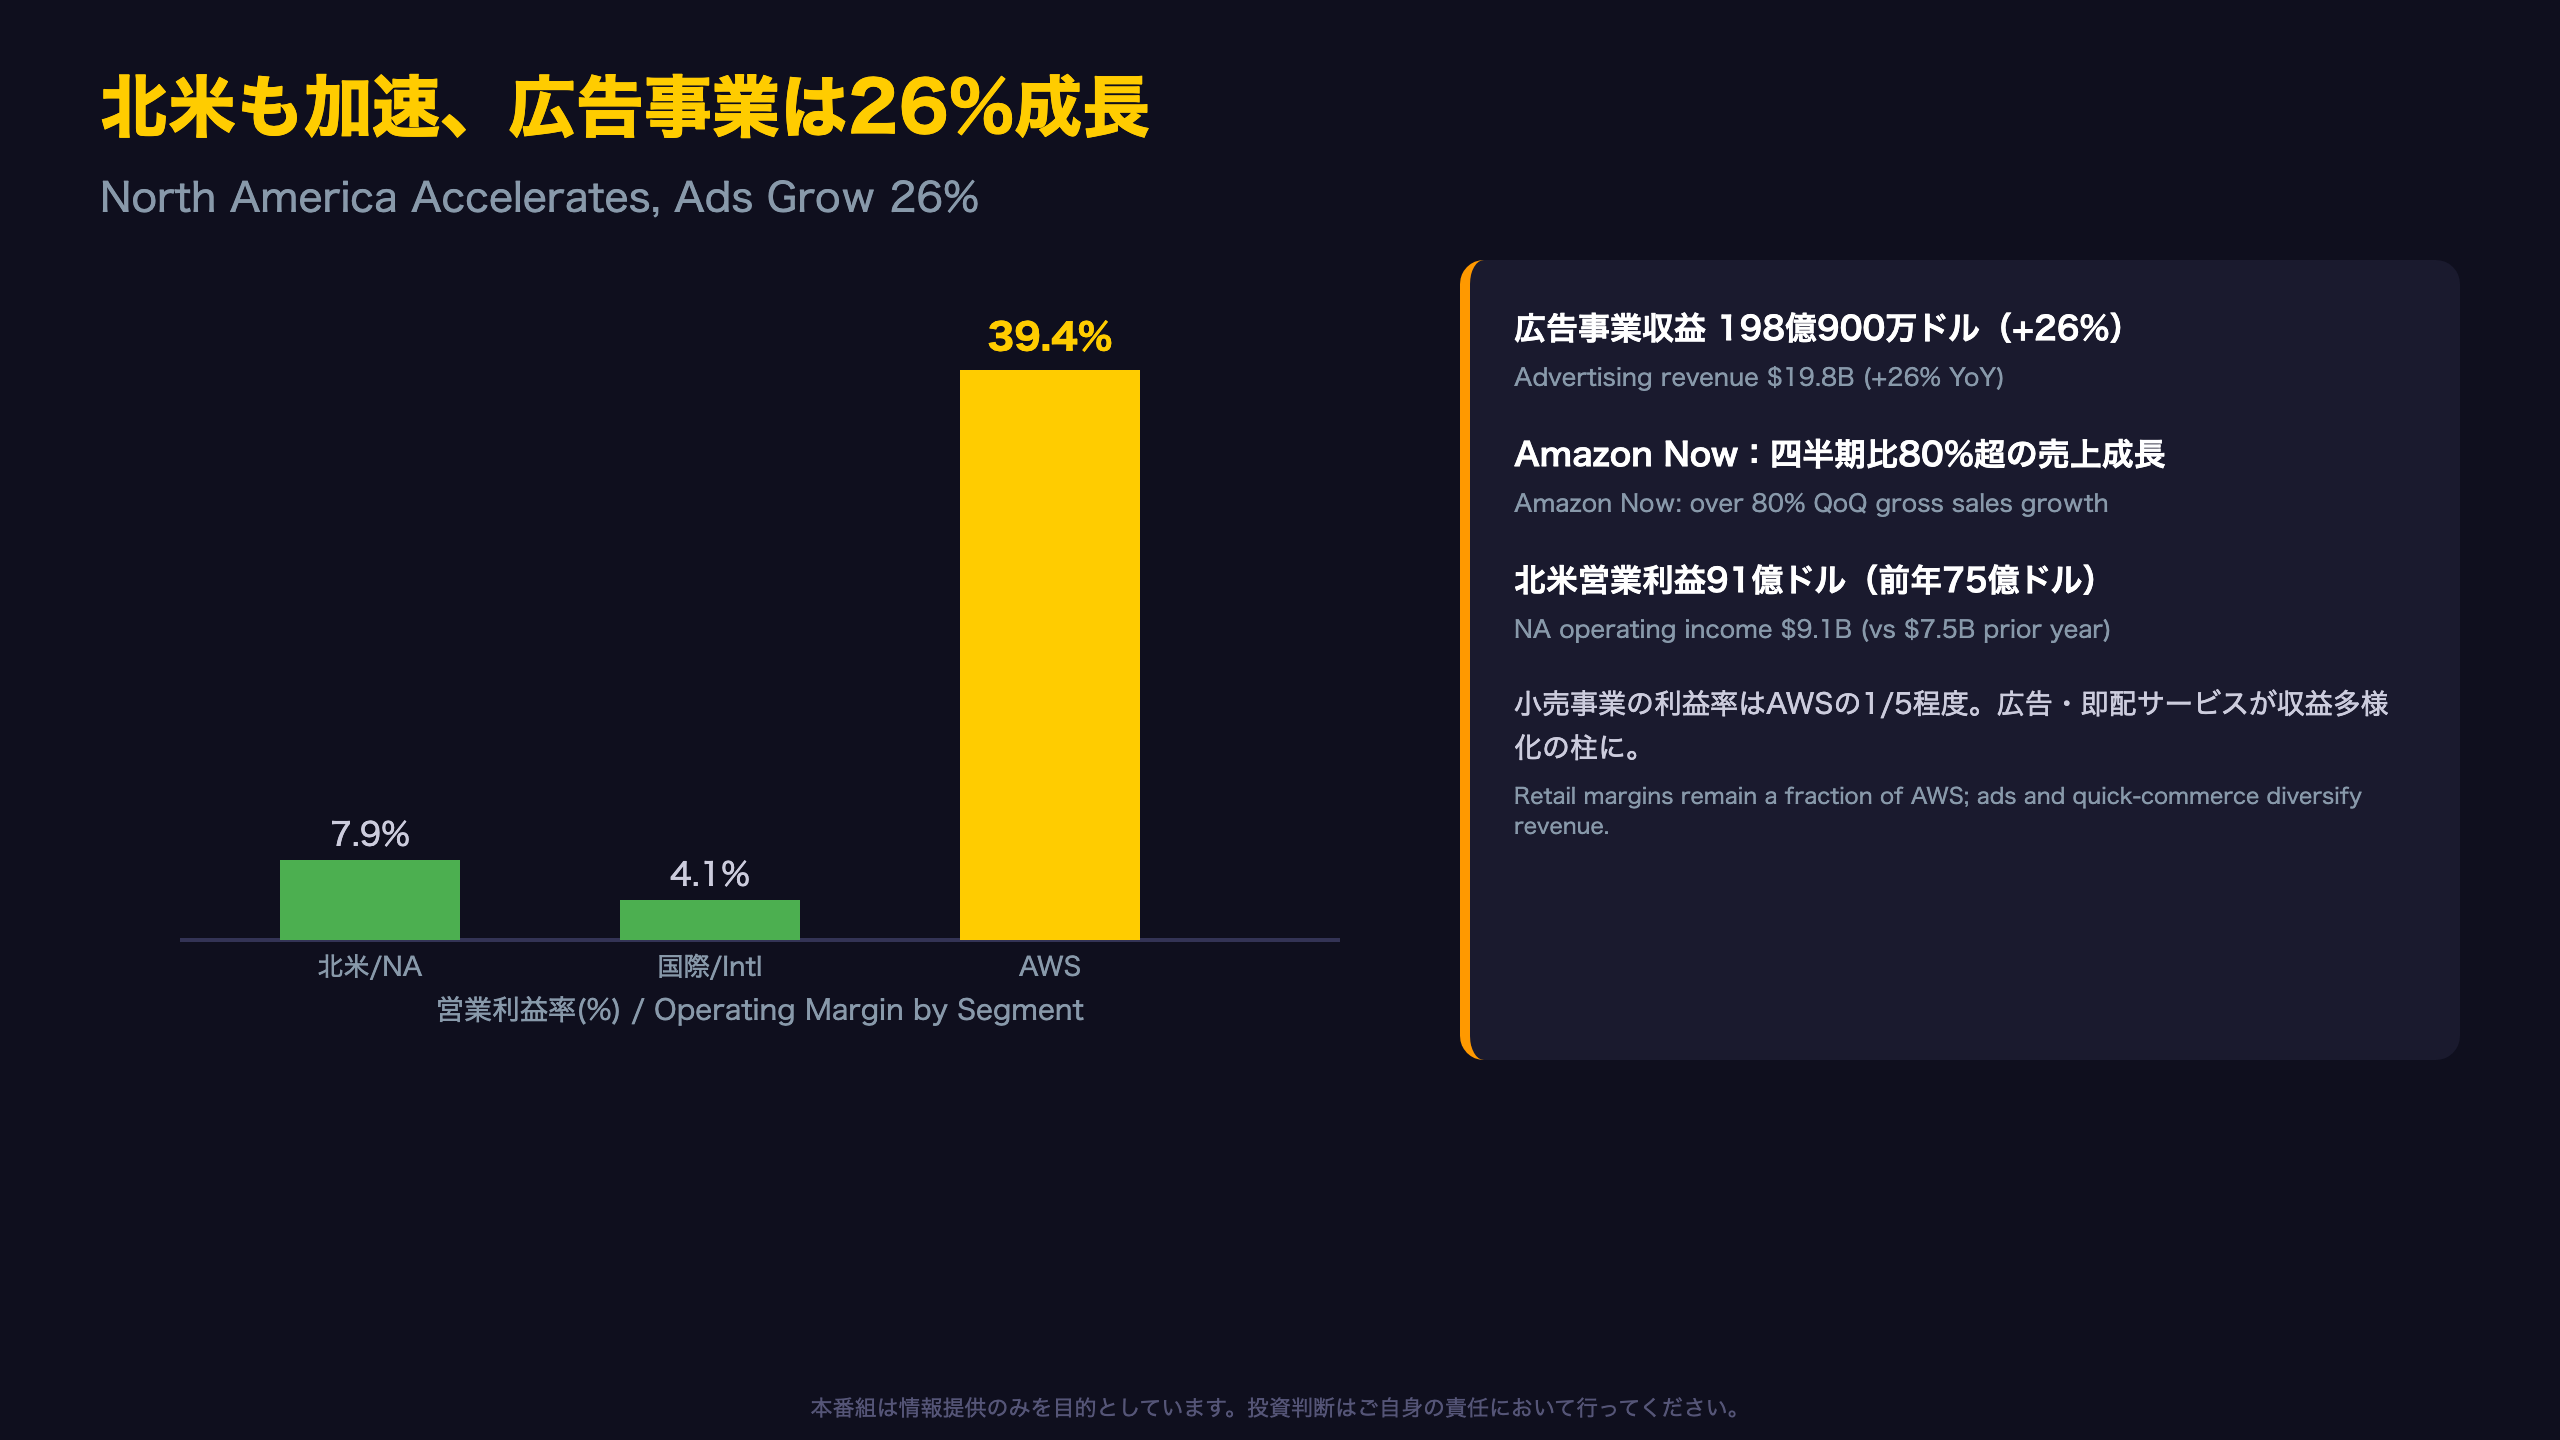
Margin Disparity Across Segments
Comparing operating margins across Amazon’s three segments reveals a persistent structural gap:
| Segment | Net Sales | Operating Margin |
|---|---|---|
| North America | $116.2B | 7.9% |
| International | $42.2B | 4.1% |
| AWS | $42.2B | 39.4% |
Despite North America and AWS posting nearly identical revenue, AWS generated roughly 1.8x more operating income in dollars ($16.6B vs $9.1B) — a dynamic familiar to anyone tracking cloud-versus-retail mix at other tech conglomerates.
Amazon Now: A Quick-Commerce Bright Spot
The ultra-fast delivery service posted “over 80% growth in gross sales and units sold quarter-over-quarter,” expanding into 80 new U.S. cities plus several in Egypt, now live in nine countries and over 250 cities/towns — competing directly with instant-delivery players like Instacart and DoorDash.
Advertising: The Quiet Margin Booster
Advertising revenue grew 26% to $19.8 billion, outpacing subscription growth (12%). This high-margin business line, similar in model to search advertising, is a structural positive for consolidated margins.
International Still Thin, But Stable
International margin held flat at 4.1% year-over-year — not improving, but not deteriorating.
Looking Ahead
The key question for Q3 is whether underlying demand growth, excluding Prime Day timing effects (roughly 400bps), holds up across both segments.
フリーキャッシュフローが赤字転落——AI投資の代償
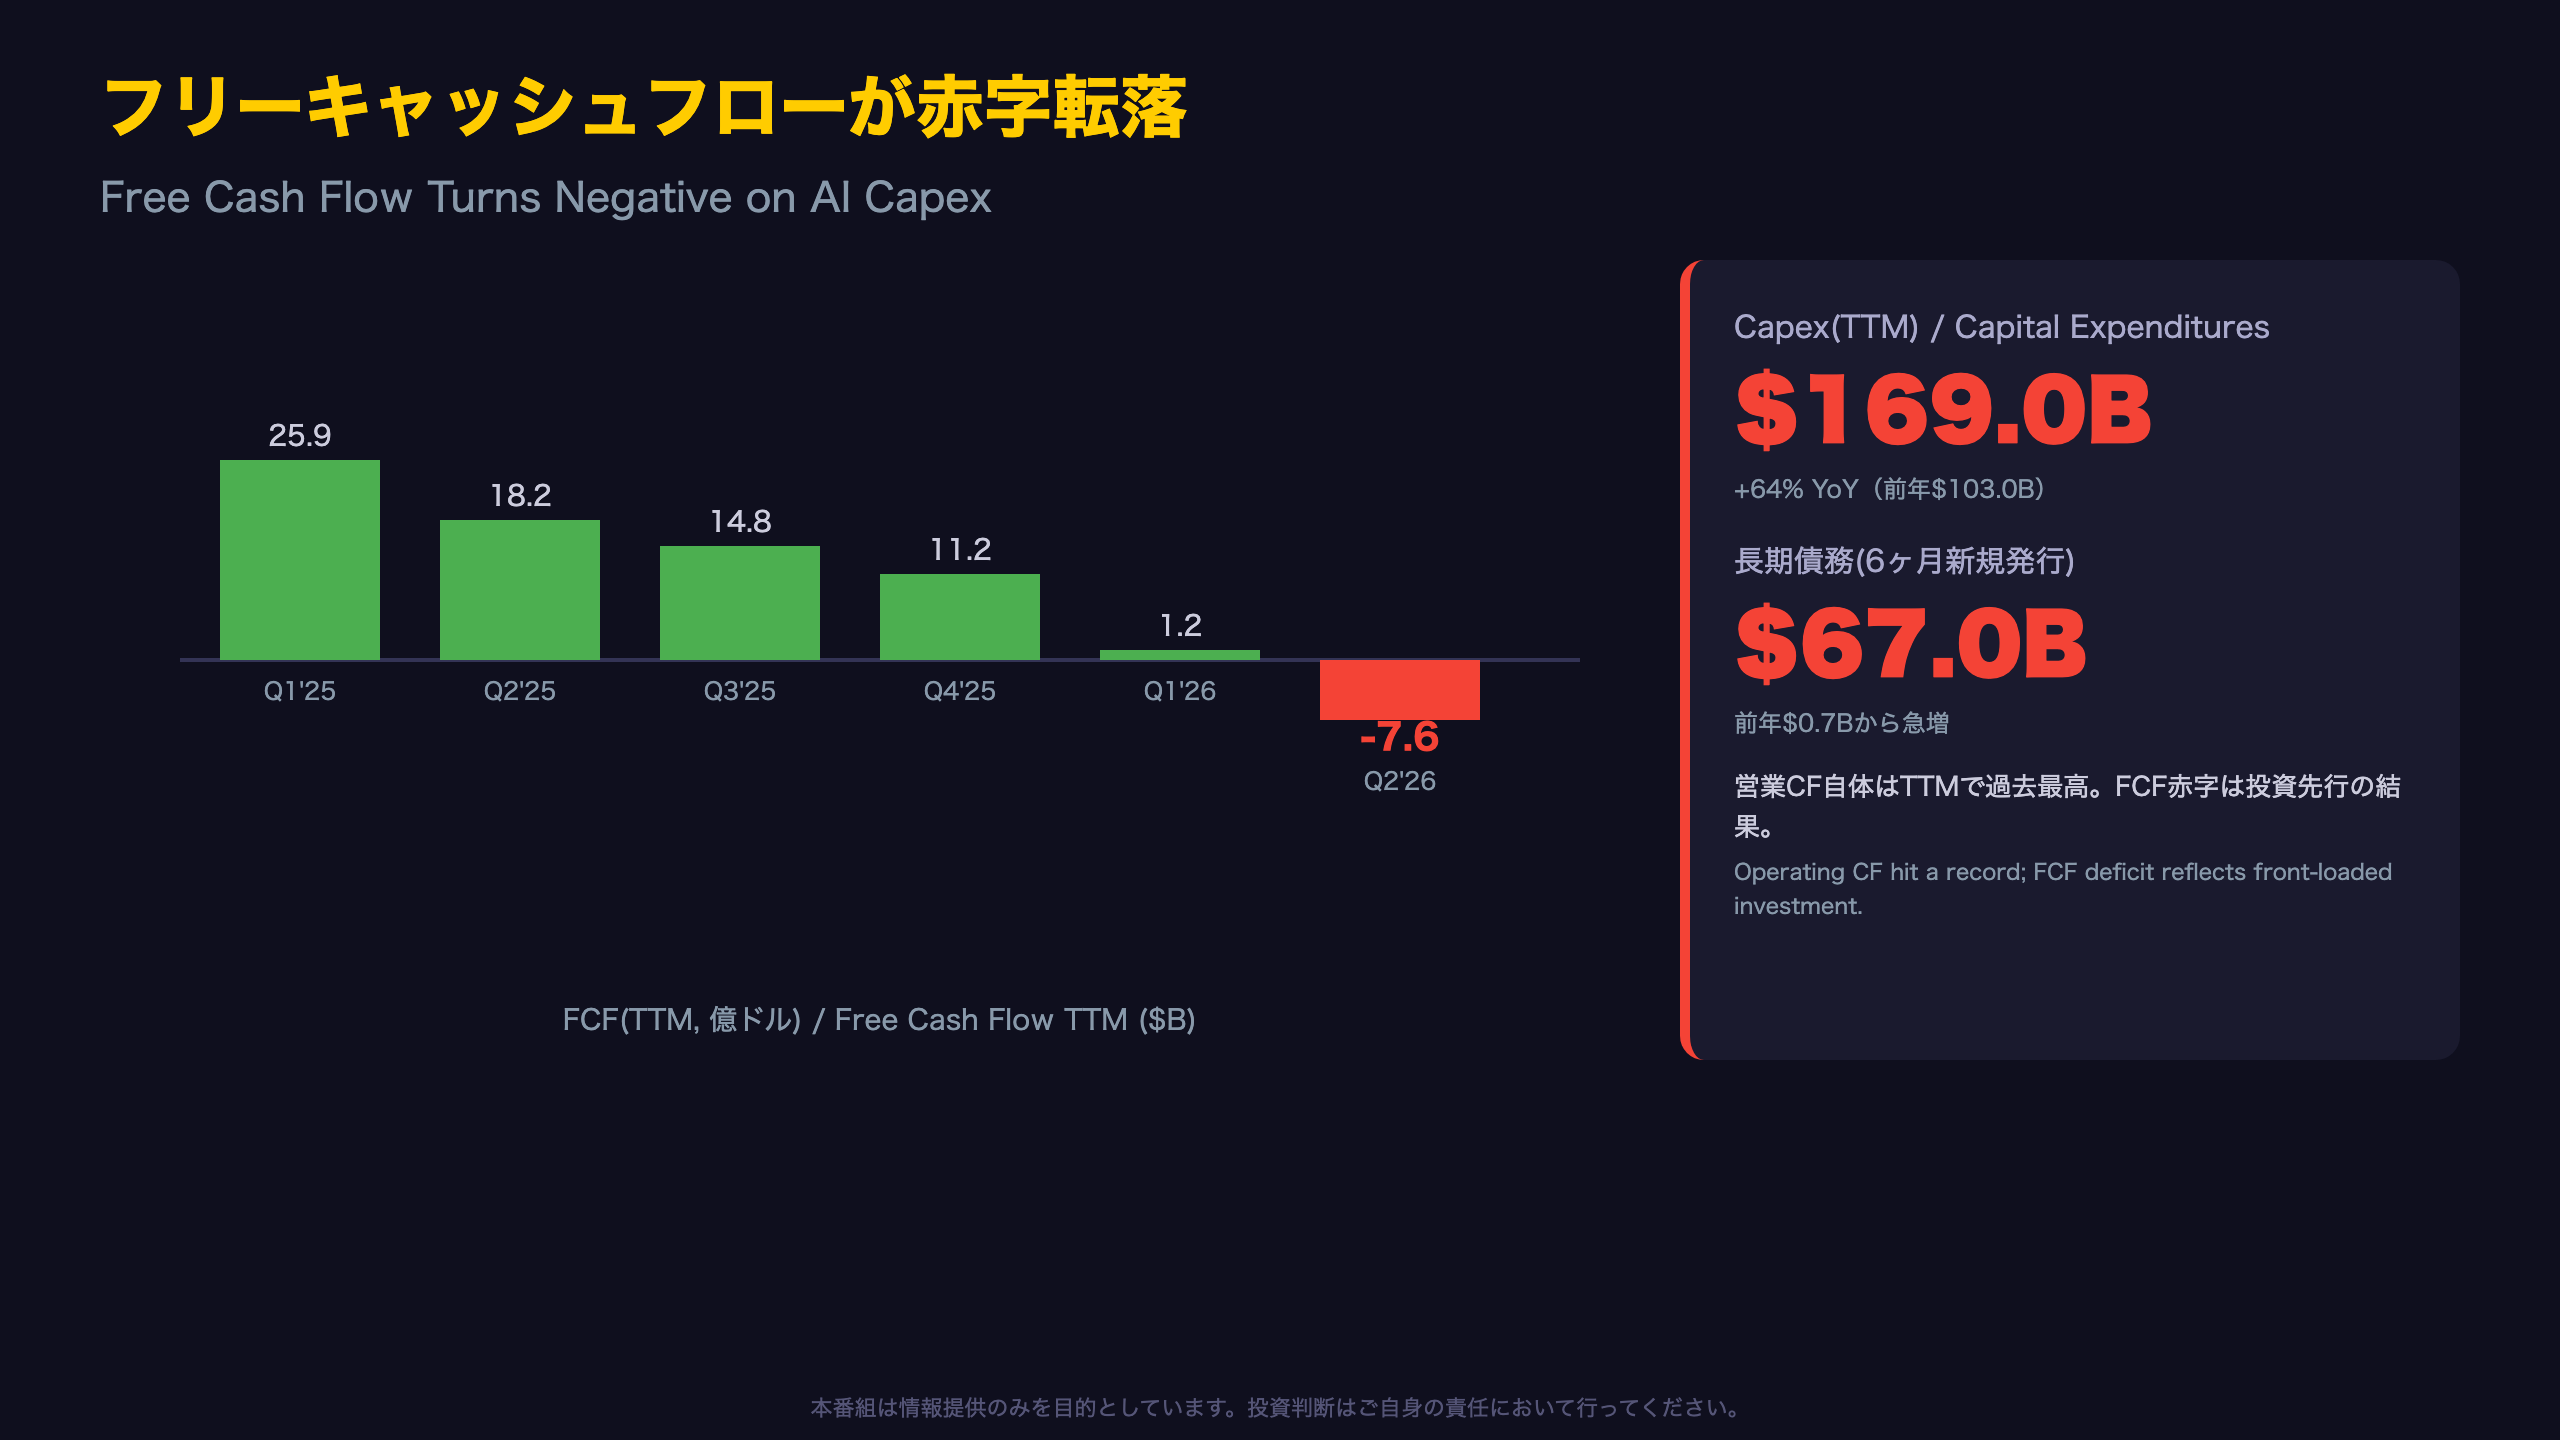
Tracking the FCF Decline Across Six Quarters
TTM free cash flow has deteriorated for five consecutive quarters: from $25.9 billion (Q1 2025) to $18.2B, $14.8B, $11.2B, $1.2B, and finally negative $7.6 billion in Q2 2026 — a sustained trend, not a single-quarter anomaly.
The Capex Acceleration
TTM capex has nearly doubled, from $88.0 billion (Q1 2025) to $169.0 billion (Q2 2026). Sequential YoY capex growth rates have themselves accelerated: 24% → 33% → 41% → 50% → 64%, mirroring capex supercycles separately disclosed by Microsoft and Meta.
Financing Shift: More Debt-Funded Growth
Six-month proceeds from long-term debt issuance reached $67.0 billion, up nearly 90-fold from $0.7 billion a year earlier. Long-term debt rose from $65.6 billion to $128.9 billion. This signals Amazon is increasingly financing AI infrastructure with debt — though with $1.10 trillion in total assets, balance sheet capacity remains ample.
The Balanced View
Operating cash flow itself hit a record $161.4 billion TTM (+33%), meaning core cash generation remains robust. The FCF deficit reflects front-loaded investment, not eroding profitability.
What to Watch
Whether capex growth (now 64% YoY) decelerates, or whether AI demand backlog justifies further acceleration.
Q3ガイダンスは9〜12%成長想定——AI投資回収サイクルが次の焦点
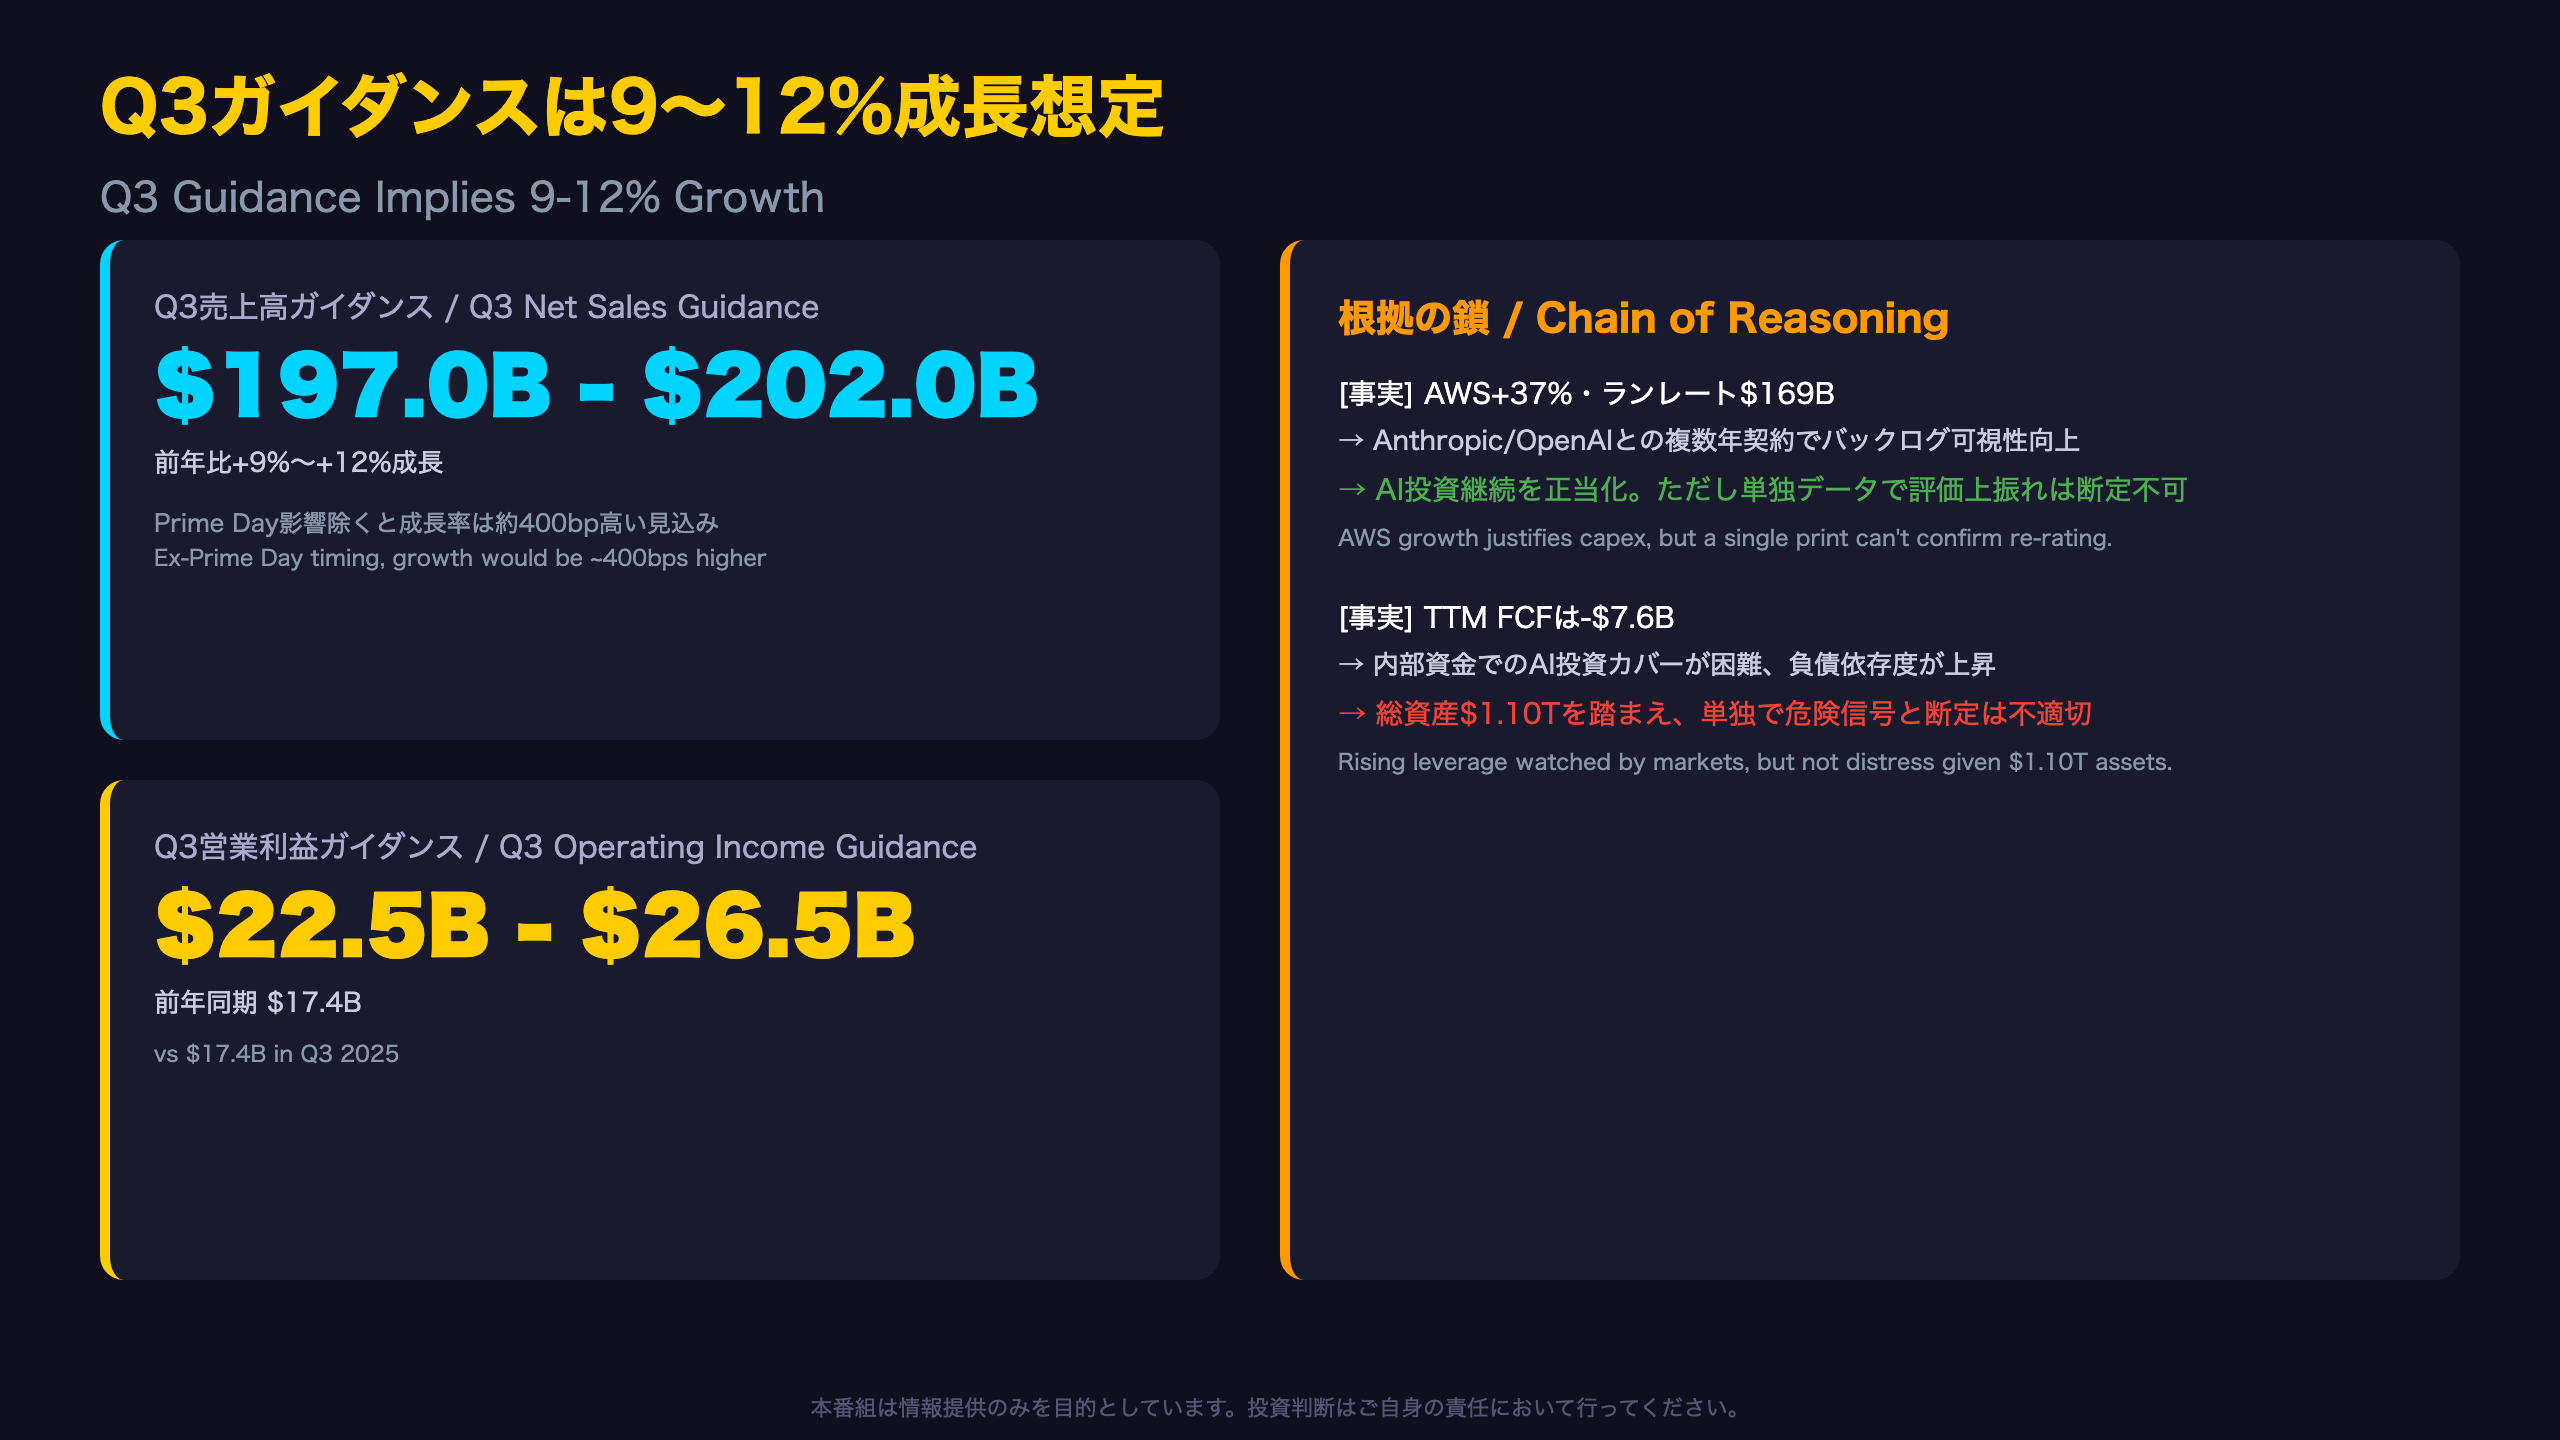
Reading Between the Lines of Guidance
The midpoint of Q3 revenue guidance ($197.0-$202.0 billion) is approximately $199.5 billion, implying roughly 10.5% YoY growth. But management flagged that excluding Prime Day timing effects, growth would be nearly 400 basis points higher, suggesting underlying demand growth may be closer to the mid-teens.
Operating Income Guidance: A Wider Range
The $22.5-$26.5 billion guidance spans a $4 billion range, wider than typical, likely reflecting uncertainty around AI infrastructure cost timing and Q4-prep seasonal costs.
Market Implications, Chain-of-Reasoning Style
Fact: AWS grew 37% to a $169B annualized run rate. Mechanism: Multi-year, multi-gigawatt commitments from Anthropic and OpenAI provide unusual backlog visibility. Market implication: This demand visibility helps justify continued heavy capex, though confirming a sustained re-rating typically requires multiple quarters of evidence, not a single print.
Fact: TTM free cash flow is negative $7.6 billion. Mechanism: Internal cash no longer fully covers AI capex, pushing Amazon toward debt financing ($67.0B raised in six months). Market implication: Rising leverage is generally watched by credit markets, but with $1.10 trillion in total assets, this data point alone does not signal distress.
Bridge to the Next Print
The next earnings report will test whether AWS sustains 30%+ growth and whether the FCF deficit begins narrowing — a debate playing out similarly across Microsoft, Meta, and Alphabet’s own capex disclosures this earnings season.
Disclaimer: This article is for informational purposes only. All investment decisions are made solely at your own risk.