📺 Watch the Full Video Analysis
This article was automatically generated by the NFC Market Live AI analysis system. (Updated: 2026-07-15 21:24 JST)
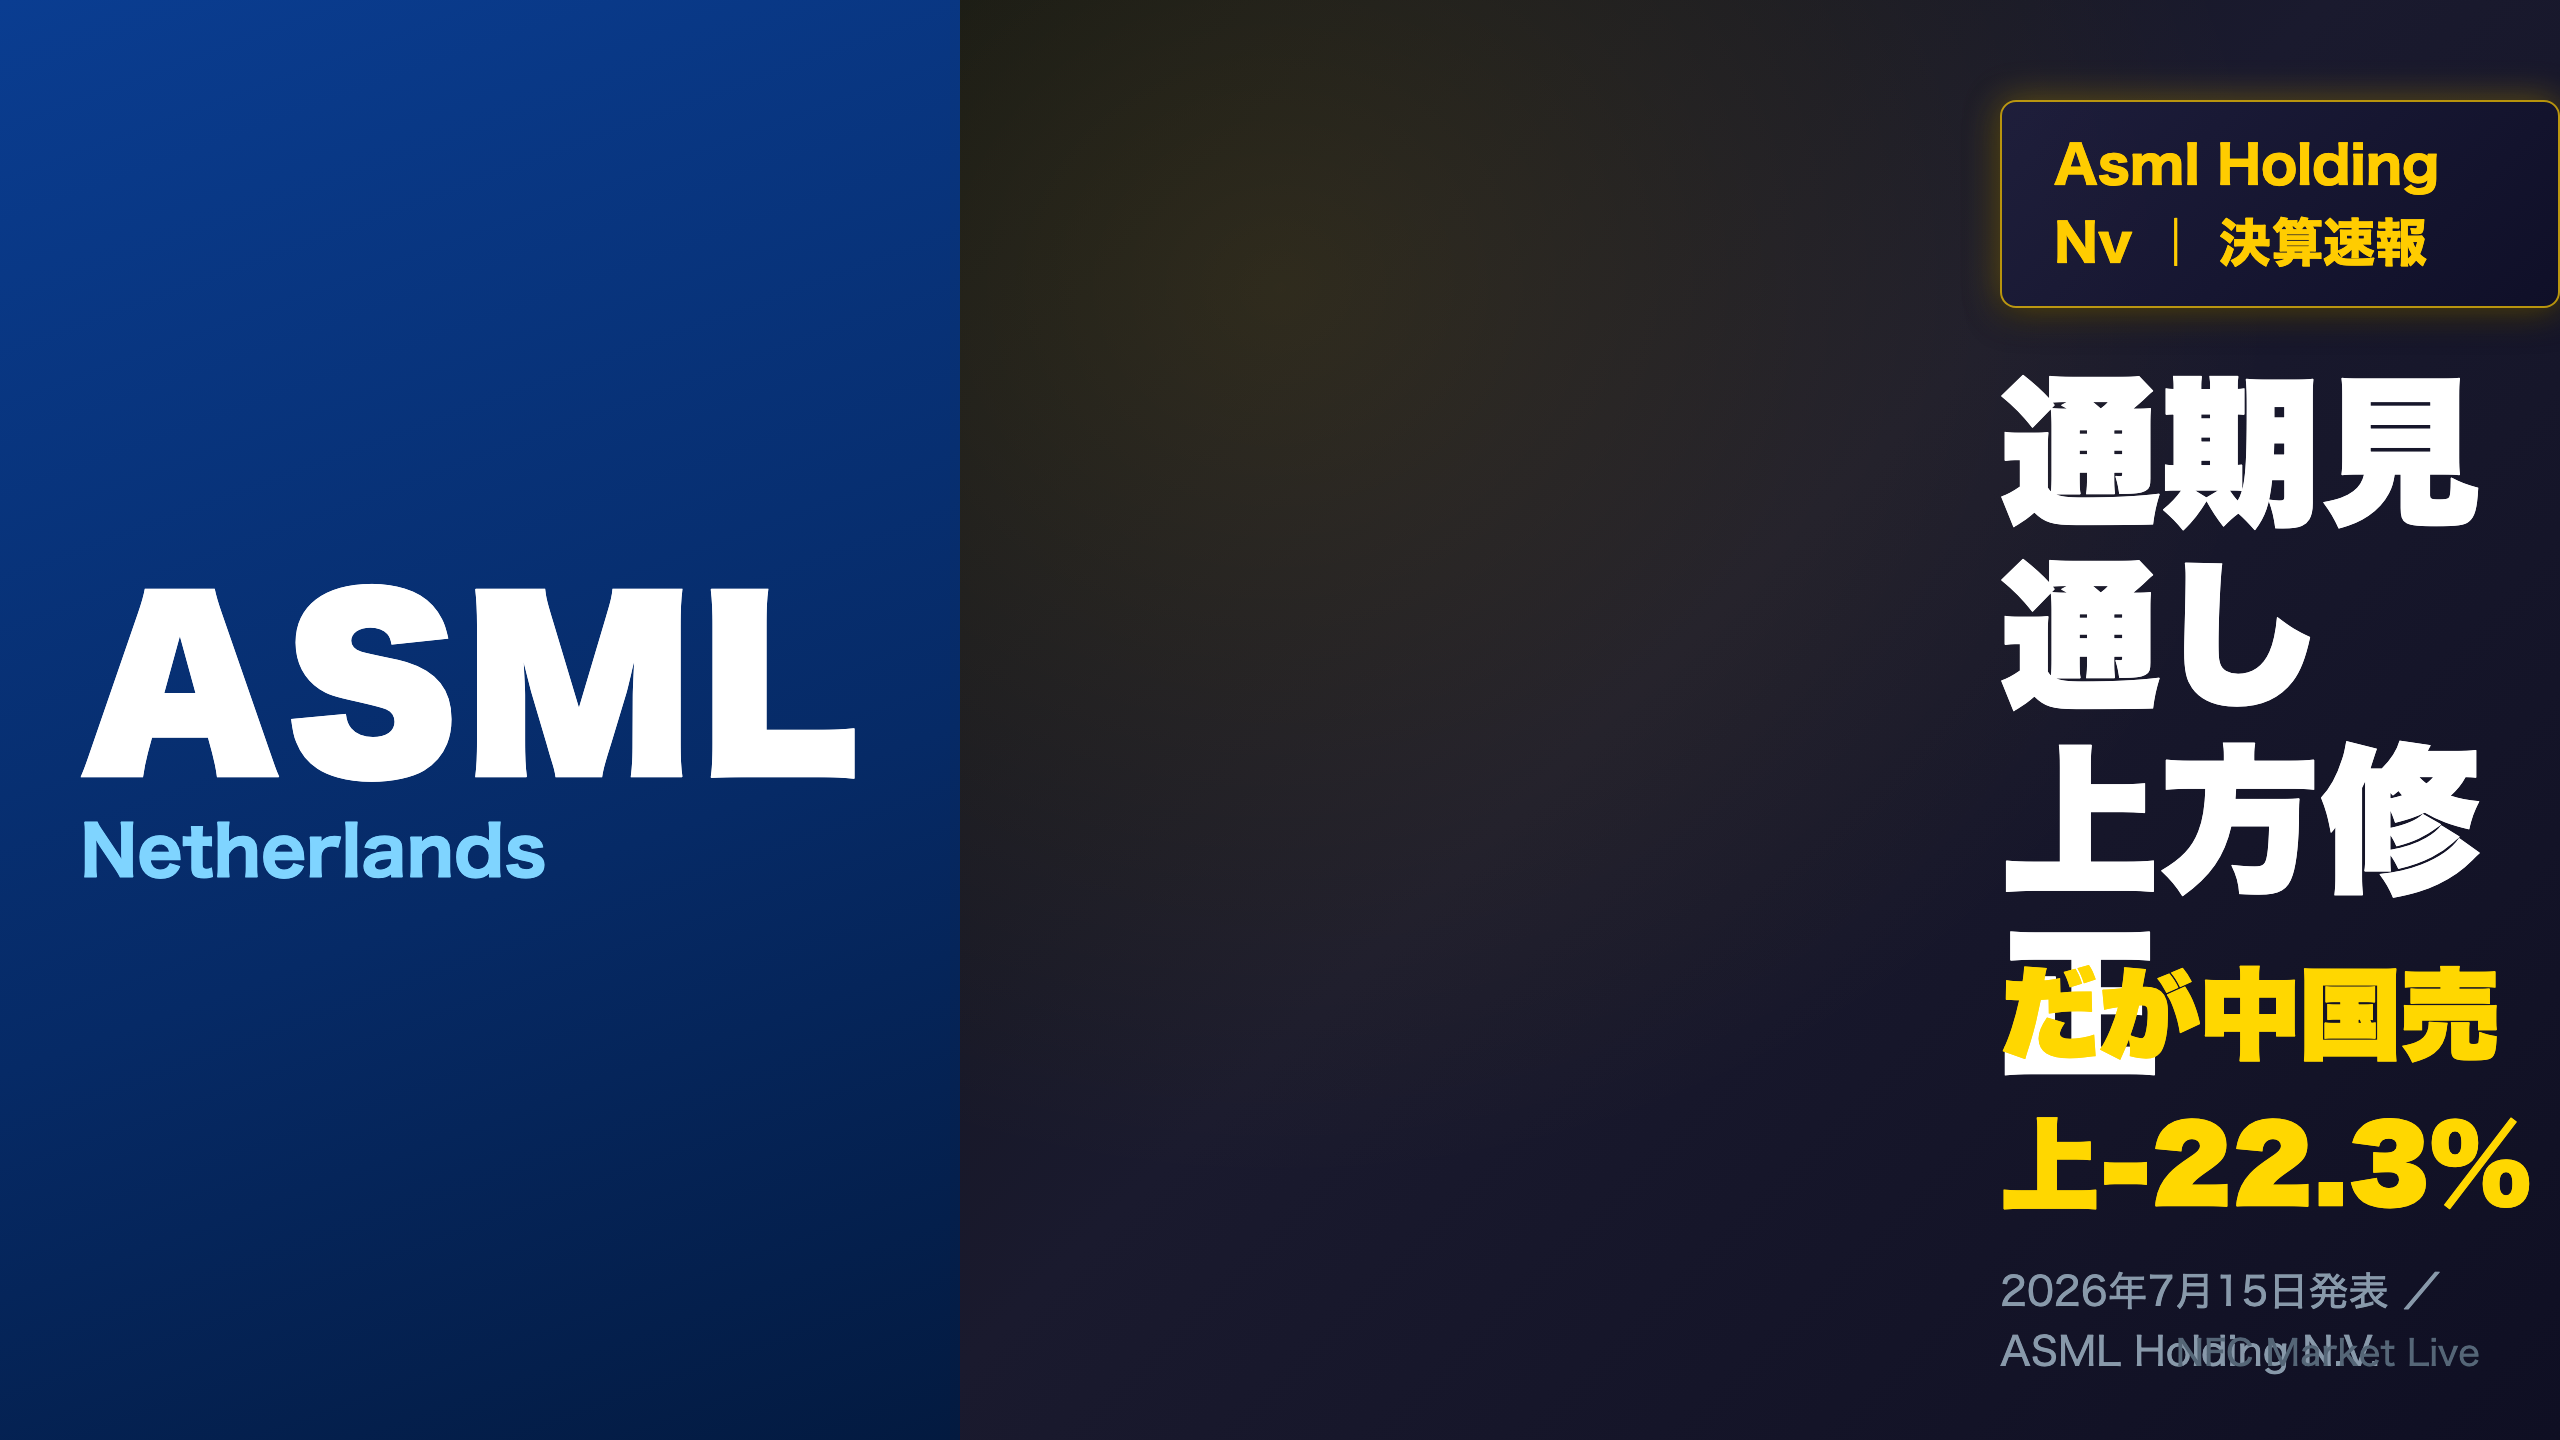
ASML Holding N.V. released its Q2 2026 earnings.
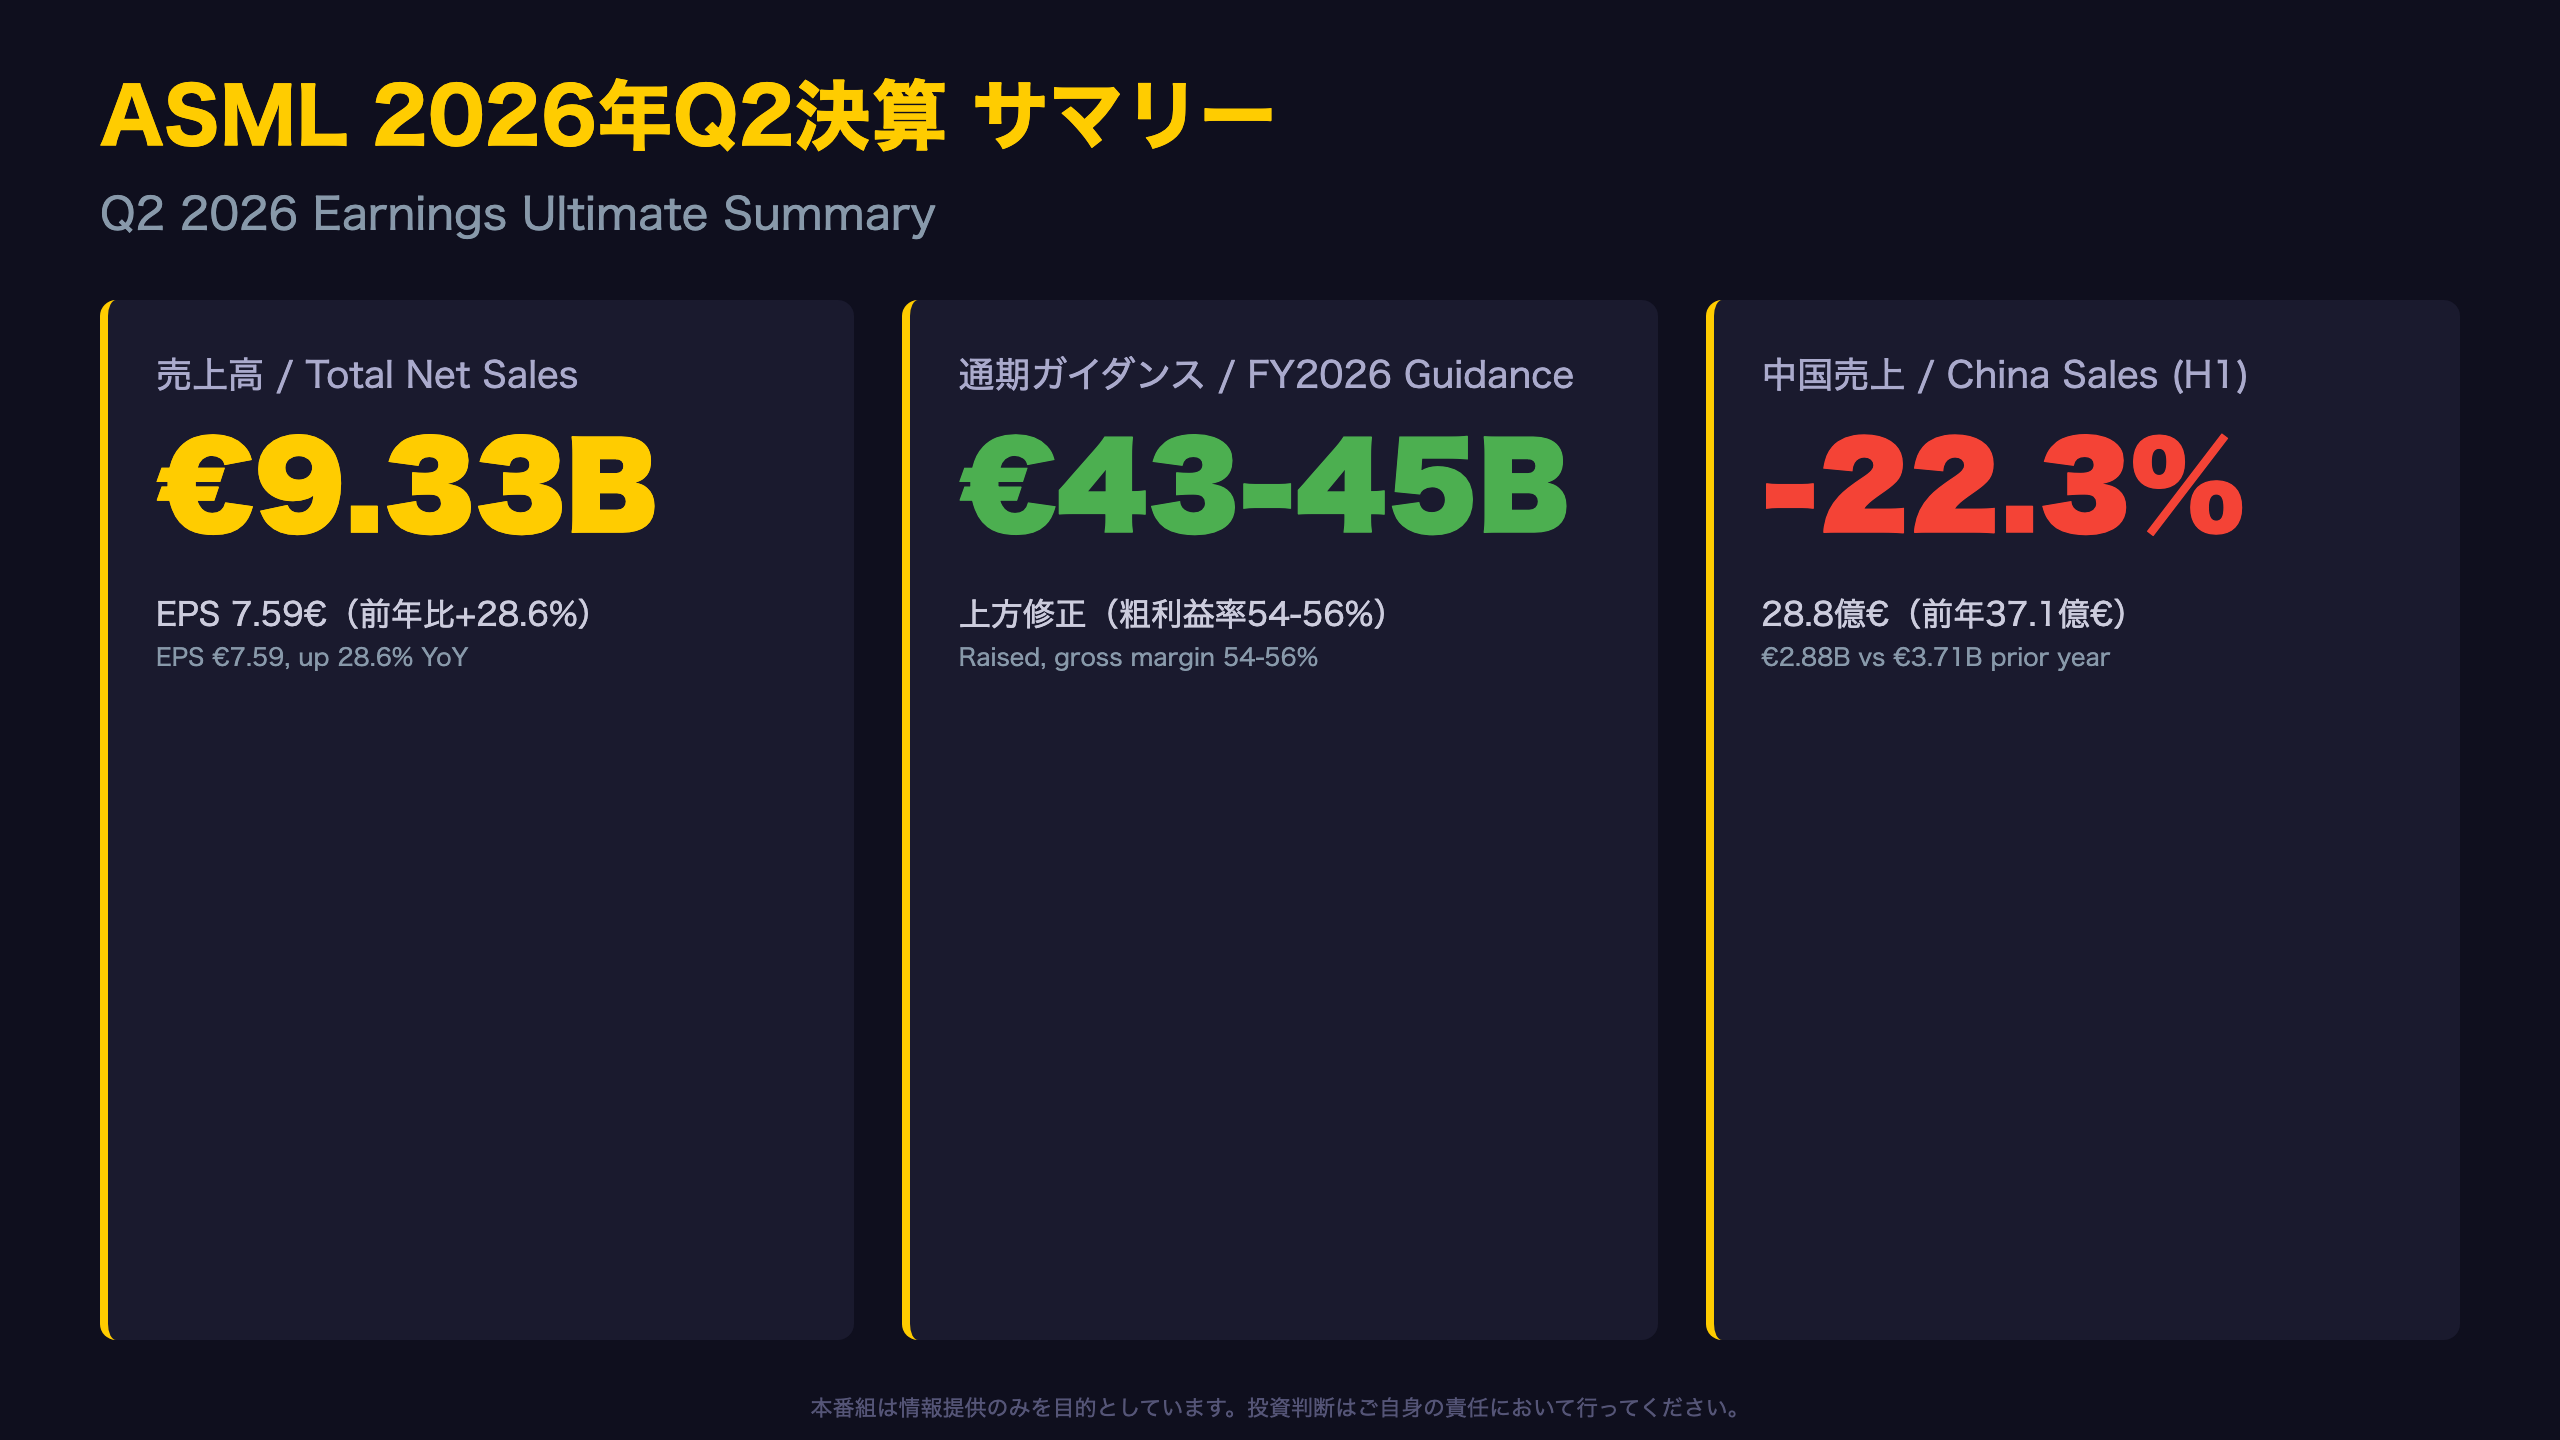
📊 Total net sales €9.33B, EPS €7.59, up 28.6% YoY
📈 FY2026 revenue guidance raised to €43-45B
⚠️ China sales down 22.3% YoY, H1 operating cash flow turned negative
Memory segment sales surged 53.2% YoY reflecting AI-driven capex, while geopolitical risk and working capital pressure emerged as structural concerns.
A balanced deep dive into strengths and weaknesses.
サマリー:ガイダンス上方修正の裏にある二面性
Overview
ASML Holding N.V. released its Q2 2026 results on July 15, 2026, reporting total net sales of €9.3 billion and net income of €2.9 billion, both explicitly stated in the headline of the press release.
Context for US investors
ASML is the world’s sole supplier of extreme ultraviolet (EUV) lithography systems, making it a critical bottleneck supplier for the entire global chip industry, from Taiwan’s TSMC to South Korea’s Samsung and SK Hynix. Unlike a typical US tech earnings report measured against Wall Street consensus, ASML explicitly states in its own press release whether results beat its own prior guidance — a distinctive disclosure practice compared to US GAAP reporters who rarely confirm beats this directly.
Five-quarter EPS trend
Basic EPS moved from €5.90 (Q2 2025) → €5.49 (Q3) → €7.35 (Q4) → €7.15 (Q1 2026) → €7.59 (Q2 2026), showing a generally upward trajectory aside from the Q4 seasonal spike tied to year-end system shipments.
A tale of two regions
Not covered in the video: South Korea sales surged 60.5% YoY in H1 (€4.41B → €7.09B), while China sales fell 22.3% (€3.71B → €2.88B) over the same period — a stark divergence in regional demand that likely reflects both AI-driven capacity buildout in Korea and export-related headwinds in China.
Market implications
For USD-based investors, ASML’s guidance raise typically supports bullish sentiment across the semiconductor equipment supply chain (Applied Materials, Lam Research, KLA). However, the China revenue decline is a data point worth monitoring against any escalation in export control policy.
What’s next
Q3 2026 results are due October 14, 2026, testing whether the €11.0-12.0 billion sales guidance and 55-57% gross margin target hold.
Q2実績:ガイダンス超えの中身
Service revenue (IBM) powered the margin beat
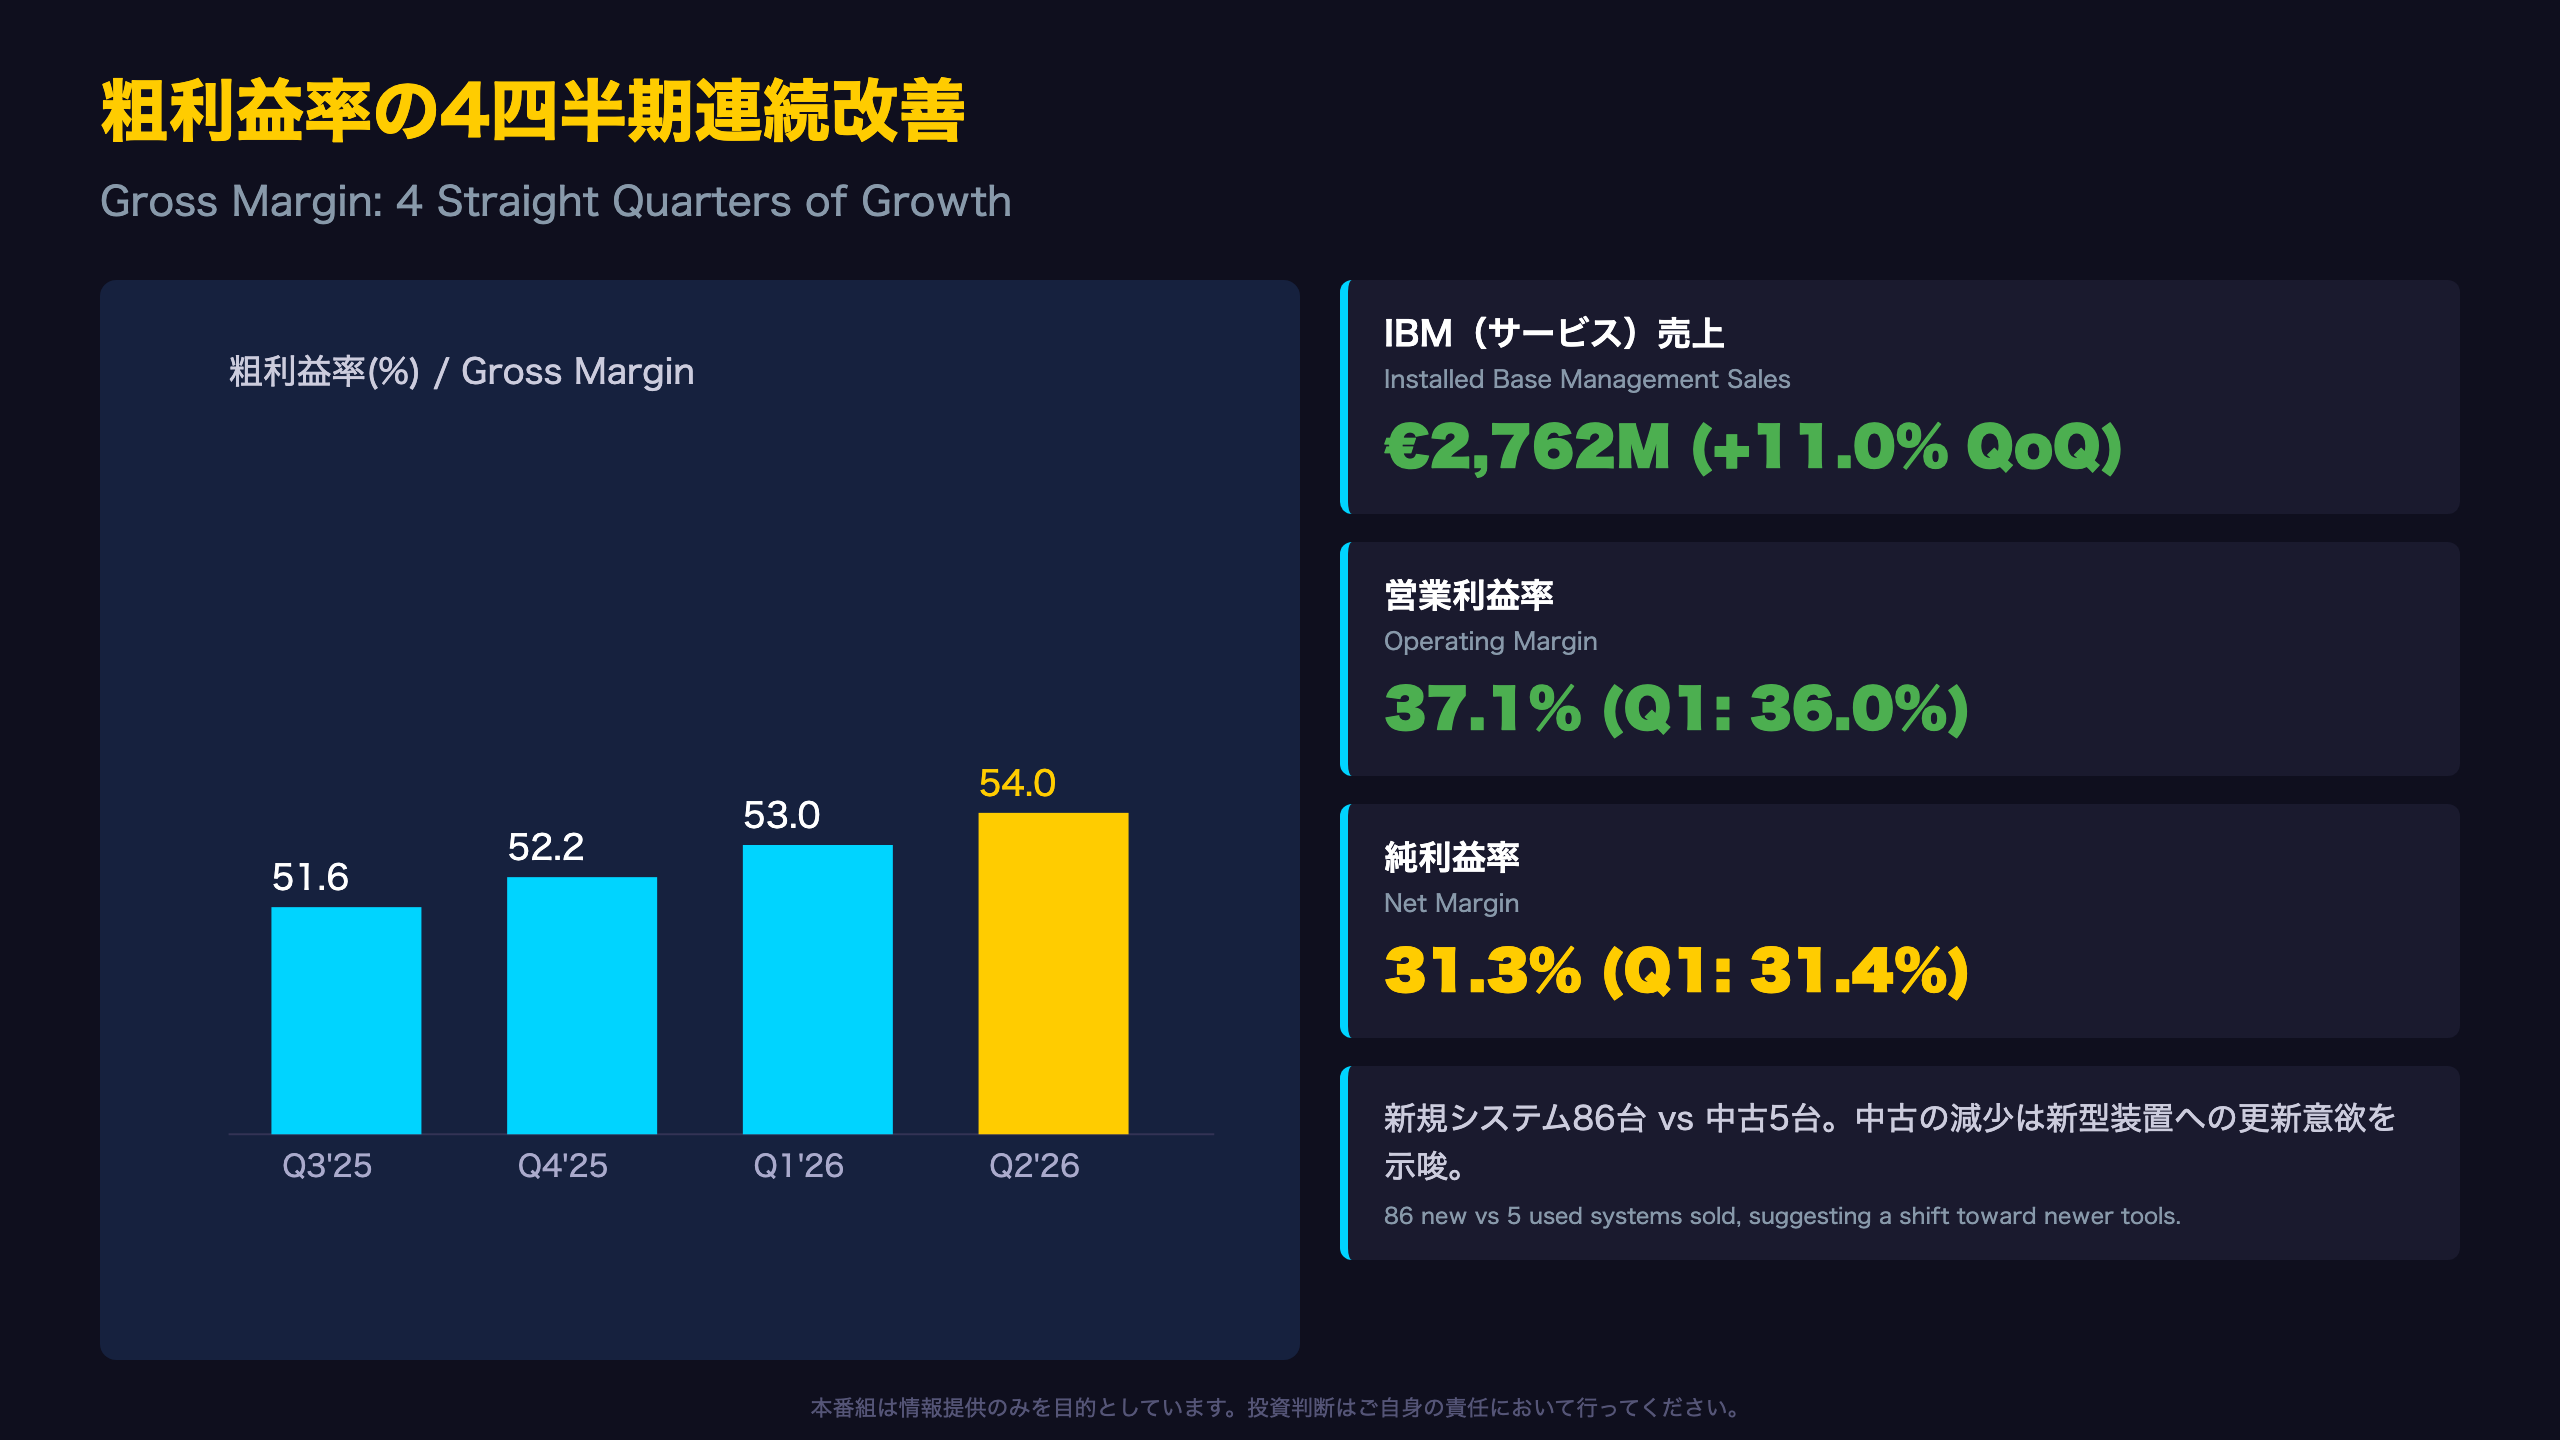
According to the press release table, Installed Base Management (IBM) sales — ASML’s term for net service and field option sales — rose from €2,488 million in Q1 2026 to €2,762 million in Q2, an 11.0% sequential increase. CEO Fouquet’s statement explicitly attributes the gross margin beat to “higher than expected Installed Base Management sales,” indicating service revenue outperformance, not system shipments, was the primary margin driver.
Context: what is IBM revenue?
For investors unfamiliar with ASML’s disclosure conventions, IBM sales represent recurring, higher-margin revenue from servicing ASML’s large installed base of lithography tools — conceptually similar to a “services/maintenance” revenue line reported by industrial equipment makers, and structurally comparable to how companies like IBM or Oracle break out recurring services revenue from product sales.
Four straight quarters of margin expansion
Gross margin has now improved for four consecutive quarters: 51.6% (Q3 2025) → 52.2% (Q4) → 53.0% (Q1 2026) → 54.0% (Q2 2026), reflecting both a richer EUV mix and growing service revenue contribution.
A subtle deceleration signal
Net margin actually ticked down slightly from 31.4% in Q1 to 31.3% in Q2, as R&D spending rose to €1,276.6 million from €1,184.9 million. This suggests that while top-line and gross margin trends are strong, cost growth is running in parallel — a nuance easily missed when focusing only on headline beats.
Looking ahead
Management’s Q3 guidance calls for gross margin of 55-57%, an even higher bar. Whether ASML can extend its four-quarter margin expansion streak will be the key data point in the next earnings release on October 14, 2026.
ガイダンス上方修正とQ3見通し
Unpacking the guidance raise
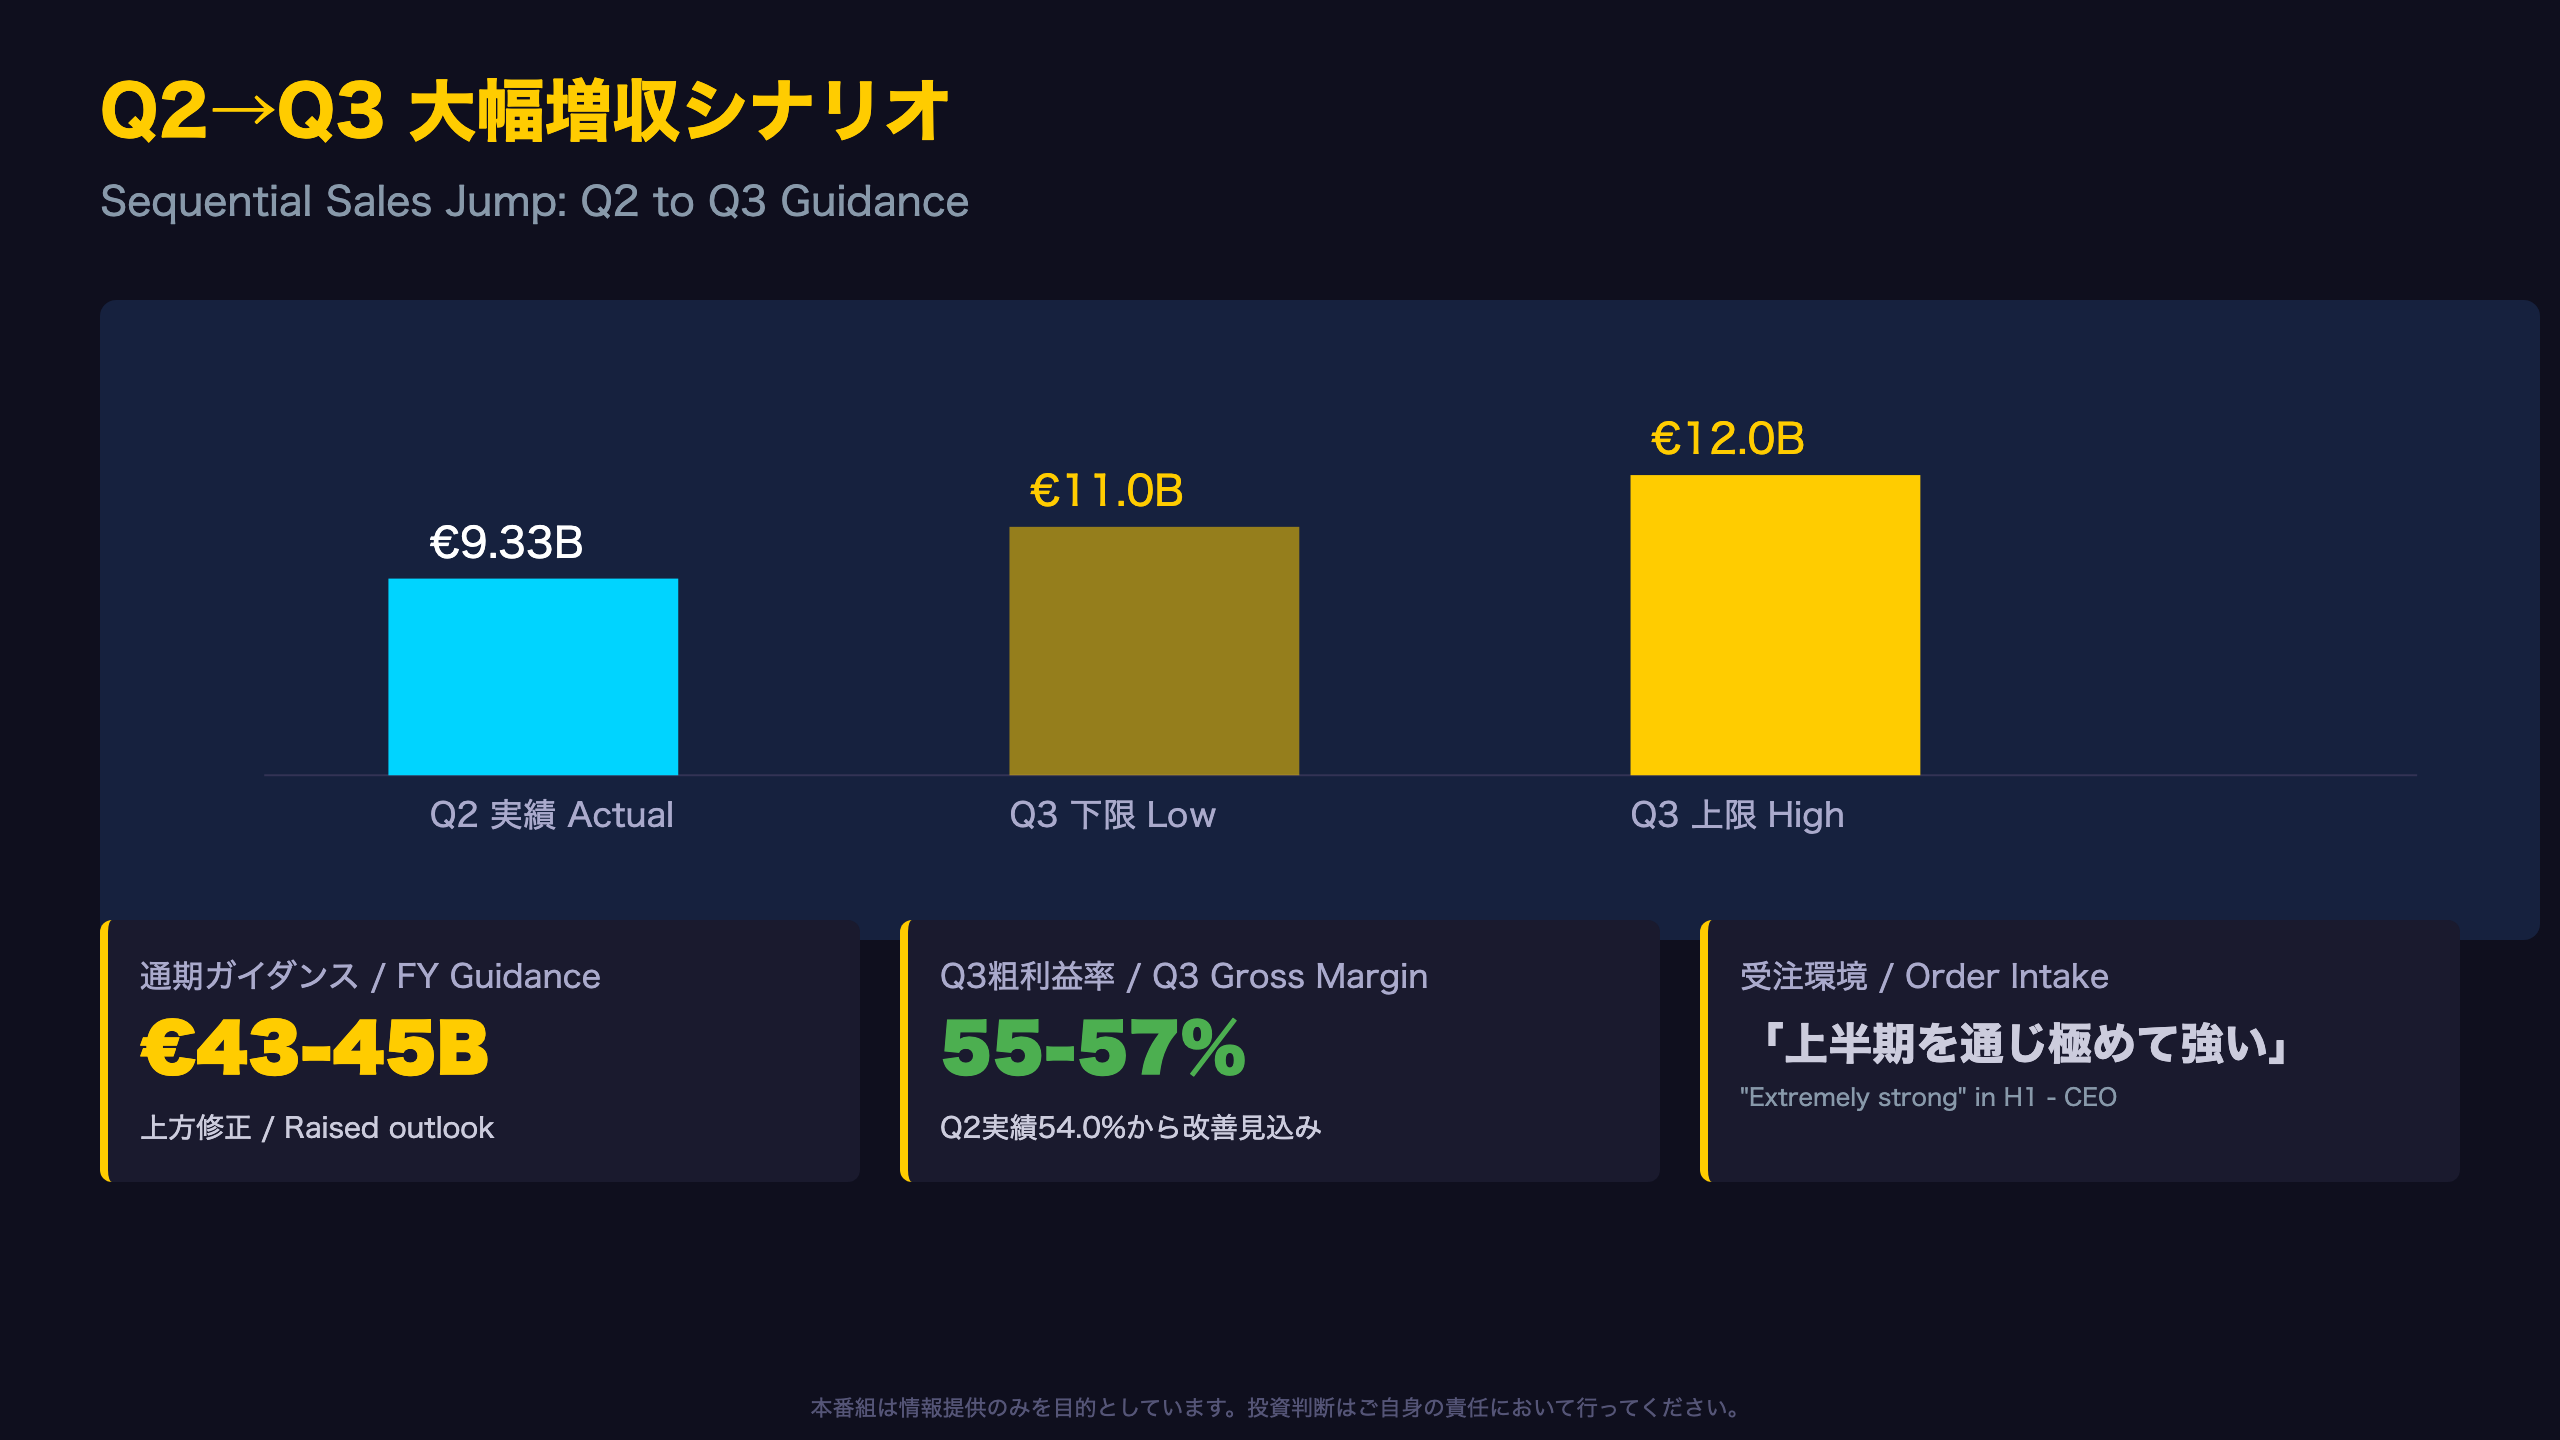
The press release headline explicitly states: “ASML increases outlook, expects 2026 total net sales to be between €43 billion and €45 billion.” This reflects the company’s newly issued full-year guidance, reiterated by CEO Fouquet: “we now expect total net sales for 2026 to be between €43 billion and €45 billion.”
Context: how ASML guidance works
Unlike many US semiconductor companies that report guidance against Wall Street consensus estimates, ASML’s own press release directly states whether prior guidance was beaten and by how the outlook has shifted — a transparency practice worth noting for US investors more accustomed to indirect consensus-beat framing.
A steep sequential jump implied for Q3
Q3 guidance of €11.0-12.0 billion implies sequential growth of 17.9% to 28.7% over Q2’s €9.33 billion — an unusually large jump for a single quarter, though broadly consistent with ASML’s historical H2 seasonality (Q4 2025 sales jumped to €9.72 billion from Q3’s €7.52 billion).
Reading the order commentary carefully
CEO Fouquet noted: “Our order intake remained extremely strong in the first half of the year.” This is a qualitative statement without an accompanying booking figure in the source document, so it should be read cautiously — as suggestive of favorable demand conditions rather than a quantified backlog metric.
The other side of the coin
The €2 billion width of the FY guidance range (€43-45B) also signals that management retains some uncertainty about second-half demand, even amid an overall upward revision.
What to watch next
The Q3 2026 results, due October 14, 2026, will be the first real test of whether the €11.0-12.0 billion guidance range holds.
セグメント深掘り:メモリ急増とロジック減速
Memory surges while Logic pulls back
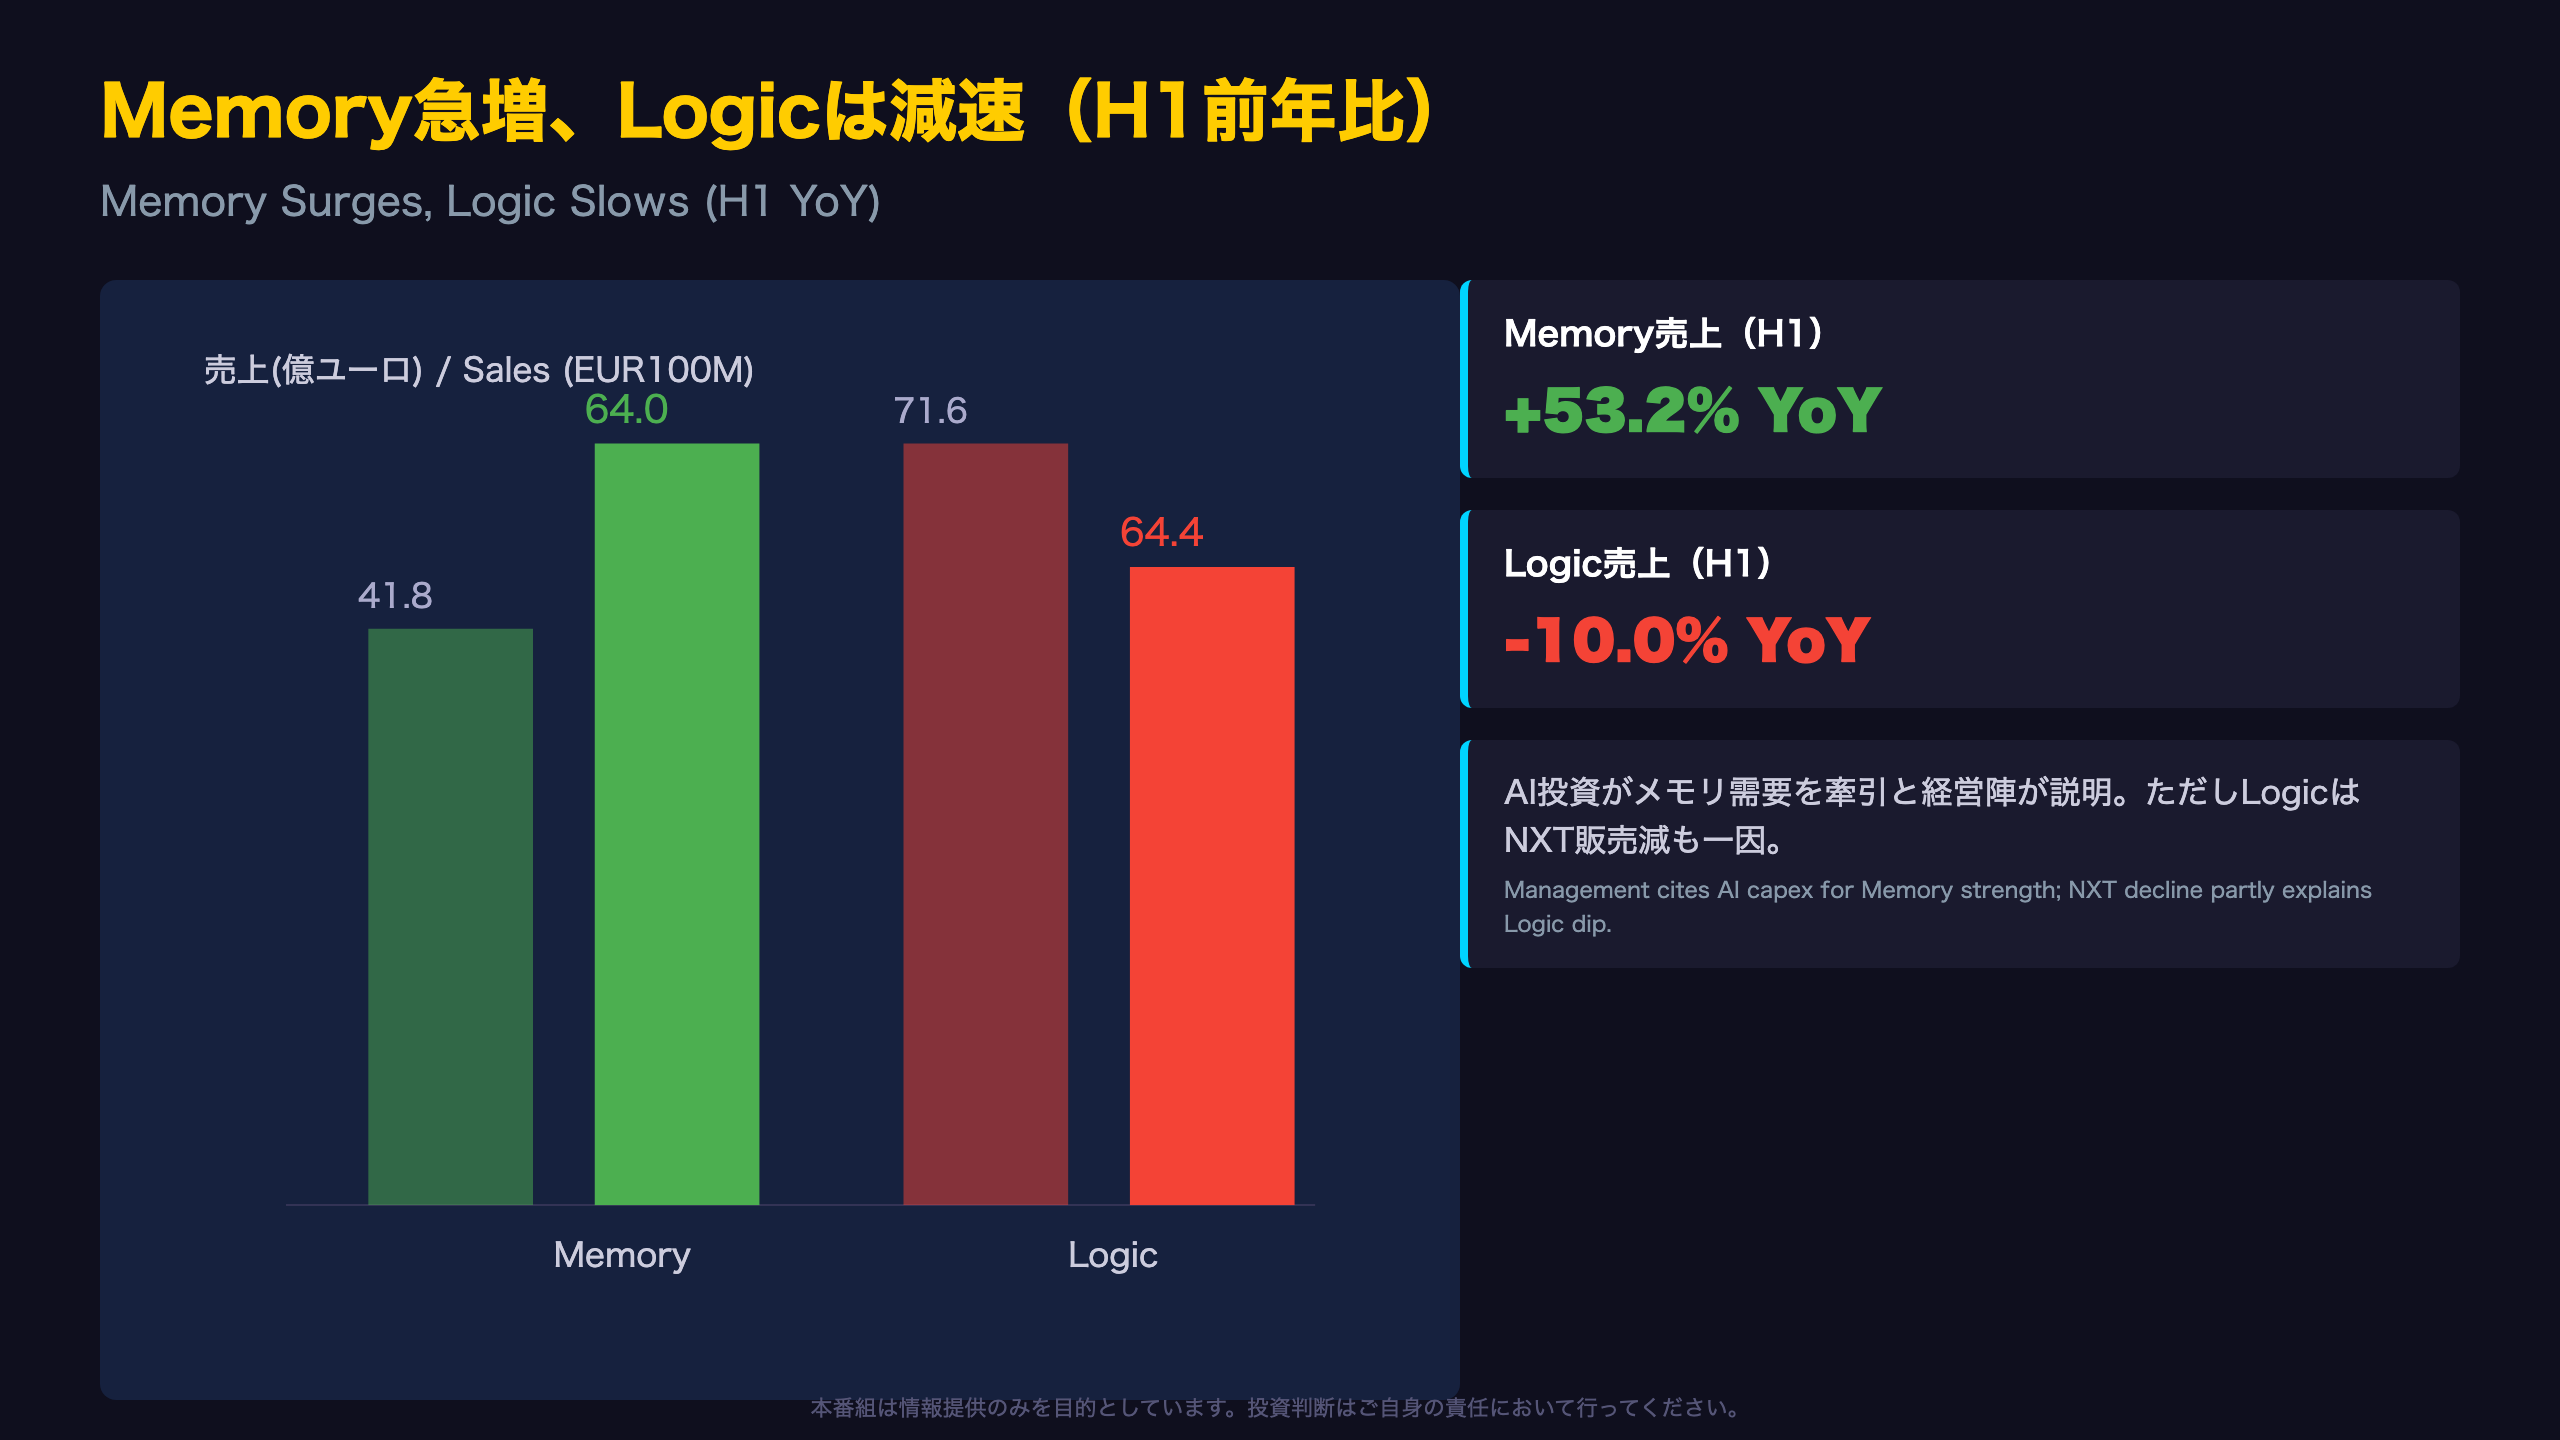
According to ASML’s Notes to the Condensed Consolidated Interim Financial Statements, end-use sales were:
| Segment | H1 2025 | H1 2026 | YoY |
|---|---|---|---|
| Logic | €7.16B | €6.44B | -10.0% |
| Memory | €4.18B | €6.40B | +53.2% |
Context for international readers
For investors more familiar with US semiconductor names, ASML’s “Logic” and “Memory” end-use categories map roughly to its customer base: Logic customers include foundries like TSMC and Intel producing microprocessors and GPUs, while Memory customers are DRAM/NAND makers like Samsung and SK Hynix — companies at the center of the AI infrastructure buildout (HBM for GPUs).
Mix shift in real numbers
In H1 2025, Logic represented 63.1% of end-use sales; by H1 2026 the split had narrowed to roughly 50/50 between Logic and Memory — a meaningful compositional shift that likely reflects accelerating memory maker capex tied to AI demand, though the filing itself does not specify HBM by name.
Technology-level detail
By technology node, NXE (EUV) system sales rose from €5.59B to €6.71B (+20.0%), while EXE (High NA EUV) sales jumped from €0.27B to €1.19B, a 334% increase — though off a small base, this signals early but rapid adoption of next-generation lithography.
The other side of the coin
ASML’s own filing attributes part of the Logic decline to “the decrease in the sales volumes of NXT immersion systems” — a technology transition dynamic rather than necessarily weaker underlying Logic demand.
What to watch next
Whether the Memory-led mix shift persists will be a key data point in ASML’s next disclosure of end-use and technology-level sales.
地域別分析:韓国急増と中国急減
Regional sales snapshot (H1 2025 vs H1 2026)
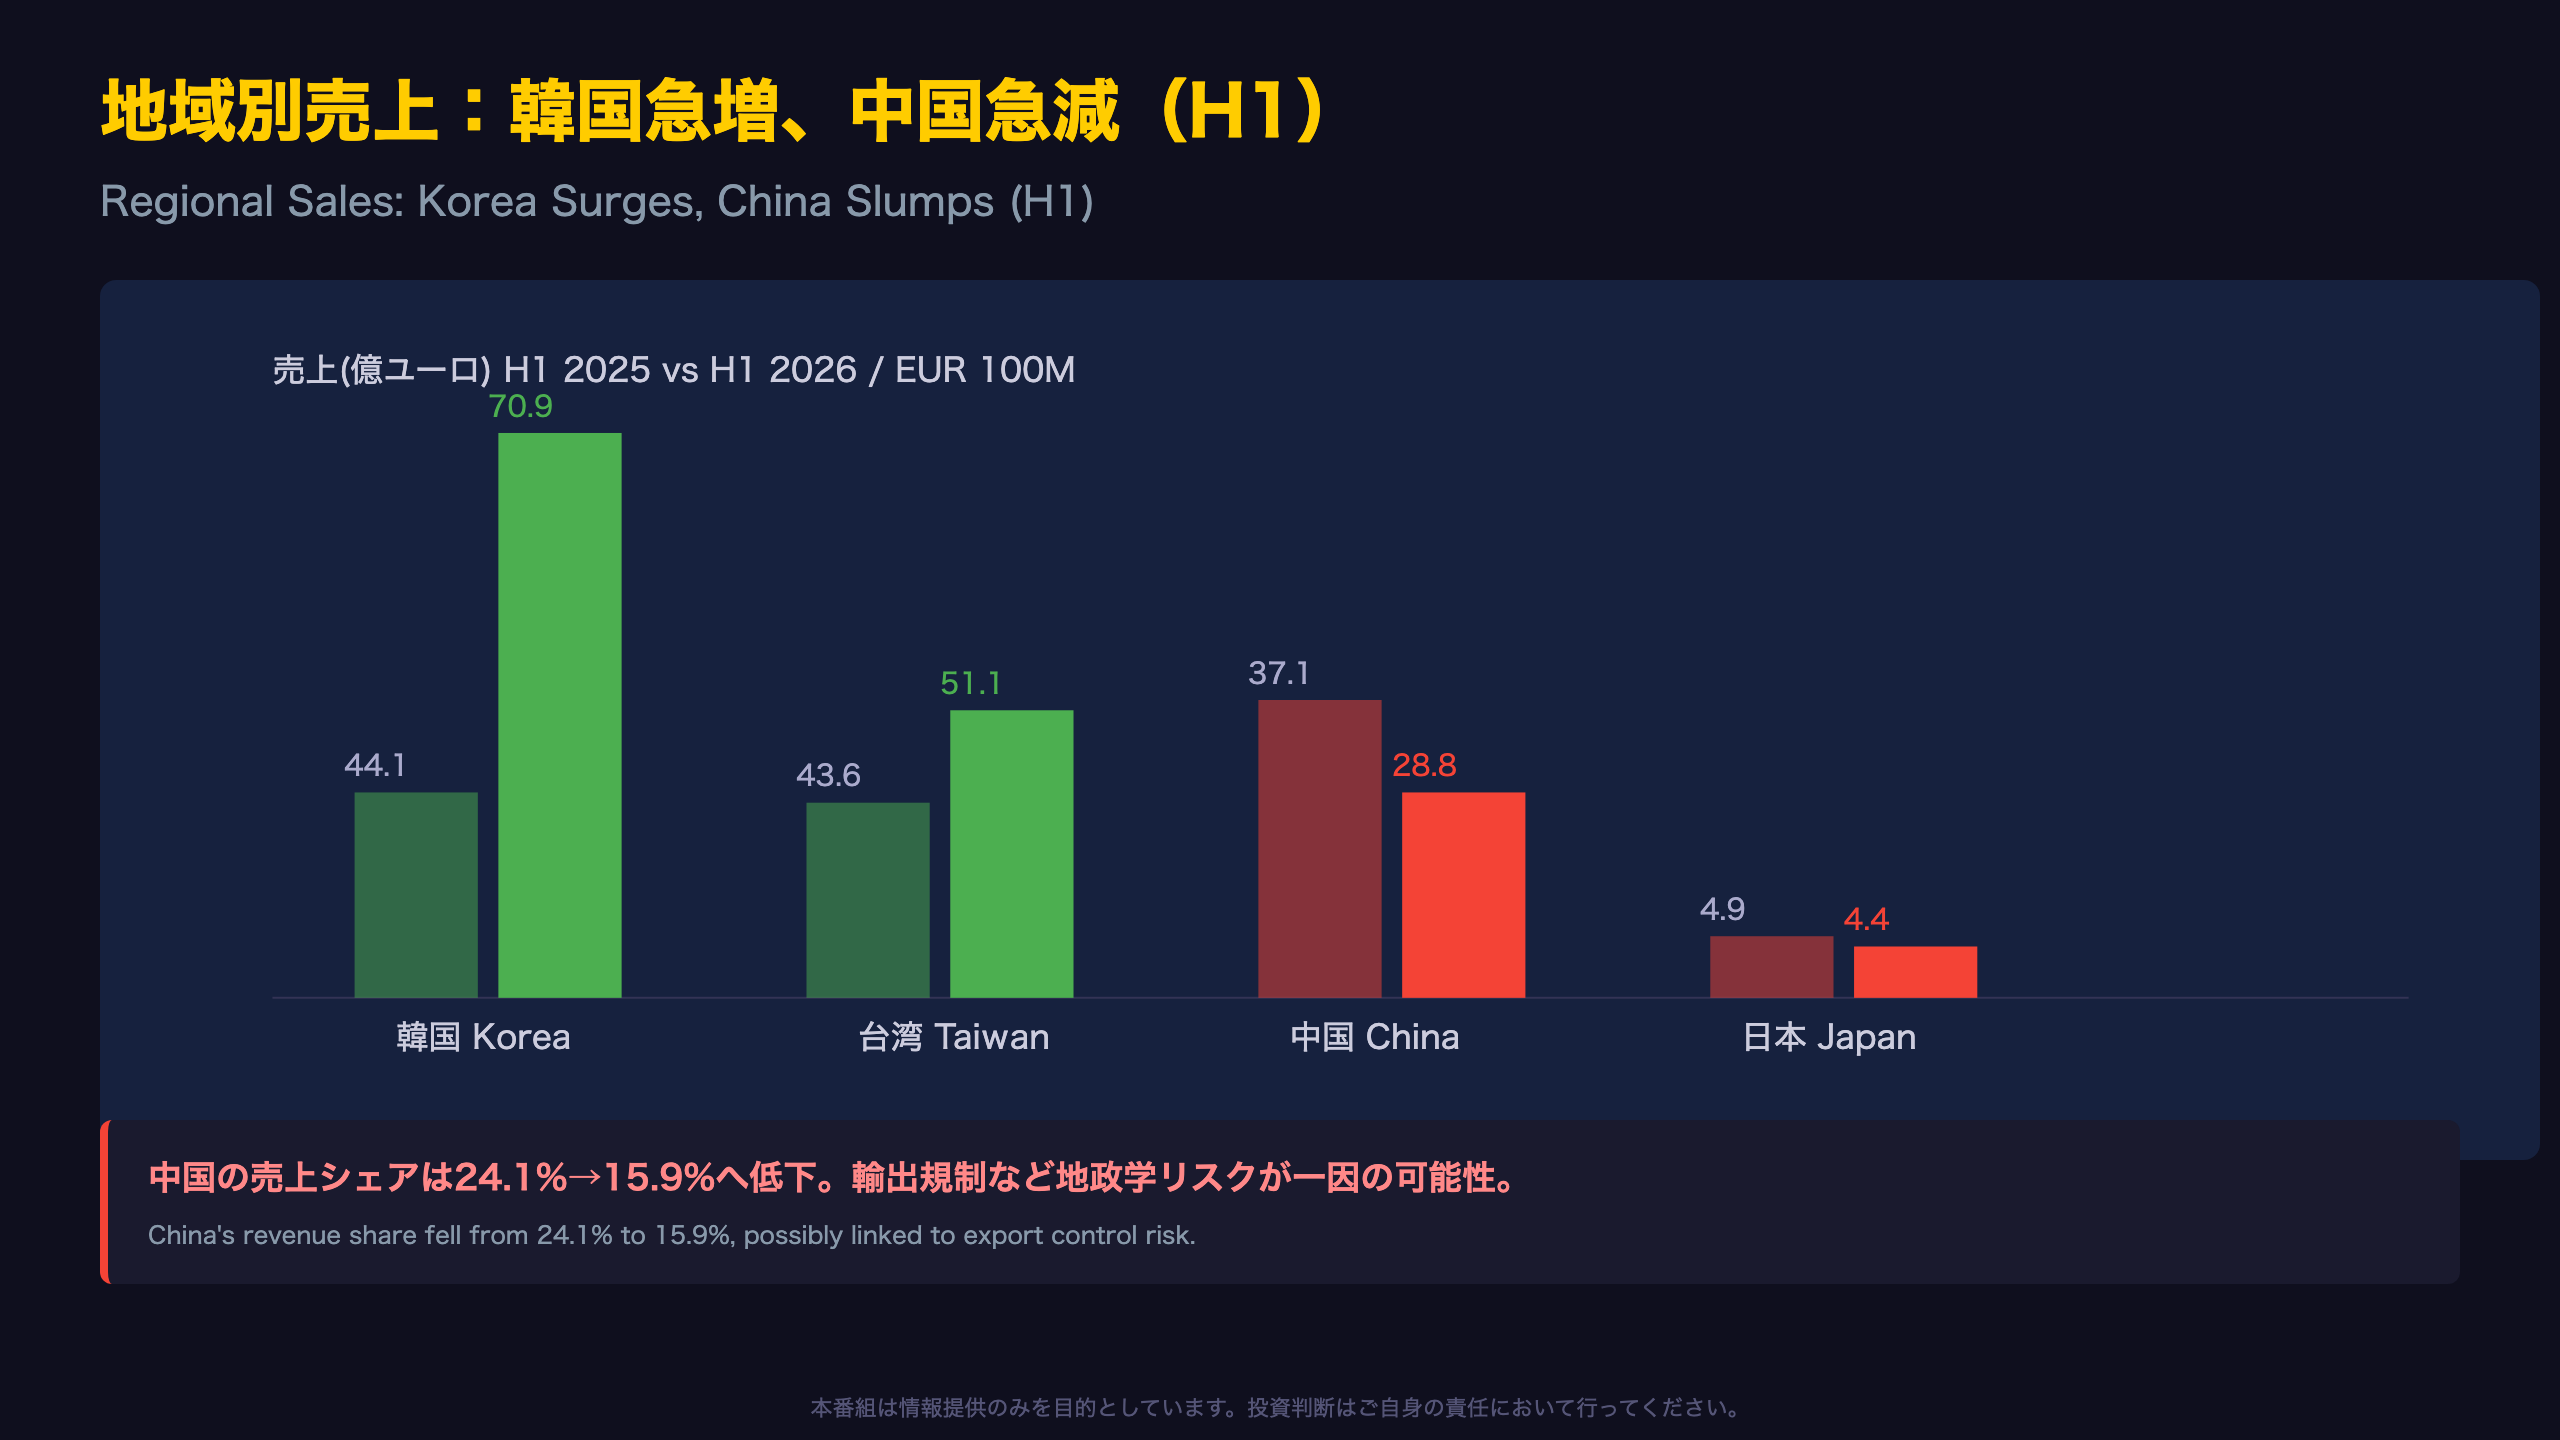
| Region | H1 2025 | H1 2026 | YoY |
|---|---|---|---|
| South Korea | €4.41B | €7.09B | +60.5% |
| Taiwan | €4.36B | €5.11B | +17.2% |
| China | €3.71B | €2.88B | -22.3% |
| United States | €1.94B | €1.94B | -0.2% |
| Japan | €0.49B | €0.44B | -10.7% |
| EMEA | €0.31B | €0.41B | +29.6% |
A dramatic mix shift
In H1 2025, China accounted for 24.1% of total sales, the second-largest market after South Korea (28.6%). By H1 2026, China’s share had fallen to just 15.9%, while South Korea’s share surged to 39.2% — a striking geographic reallocation of ASML’s customer base.
Geopolitical context for global investors
China has been a recurring focal point in US-led export control policy toward advanced semiconductor equipment. ASML’s own Risk Factors section explicitly lists “risks relating to the trade environment, import/export and national security regulations” among its disclosed risks — though the filing does not directly attribute the China sales decline to specific policy actions, so any causal link should be treated as a plausible hypothesis rather than a confirmed fact.
The other side of the coin
The China decline does not necessarily signal disappearing end-demand; it may instead reflect capital reallocation toward Korean and Taiwanese customers who are aggressively expanding capacity for AI-related chip production — a share shift rather than a pure demand collapse.
What to watch next
Whether China’s share of ASML’s revenue mix stabilizes or continues to shrink in coming quarters will be an important signal for assessing the real-world impact of export restrictions on the semiconductor equipment supply chain.
キャッシュフローの裏側:運転資本の圧迫
The cash flow story behind the earnings beat
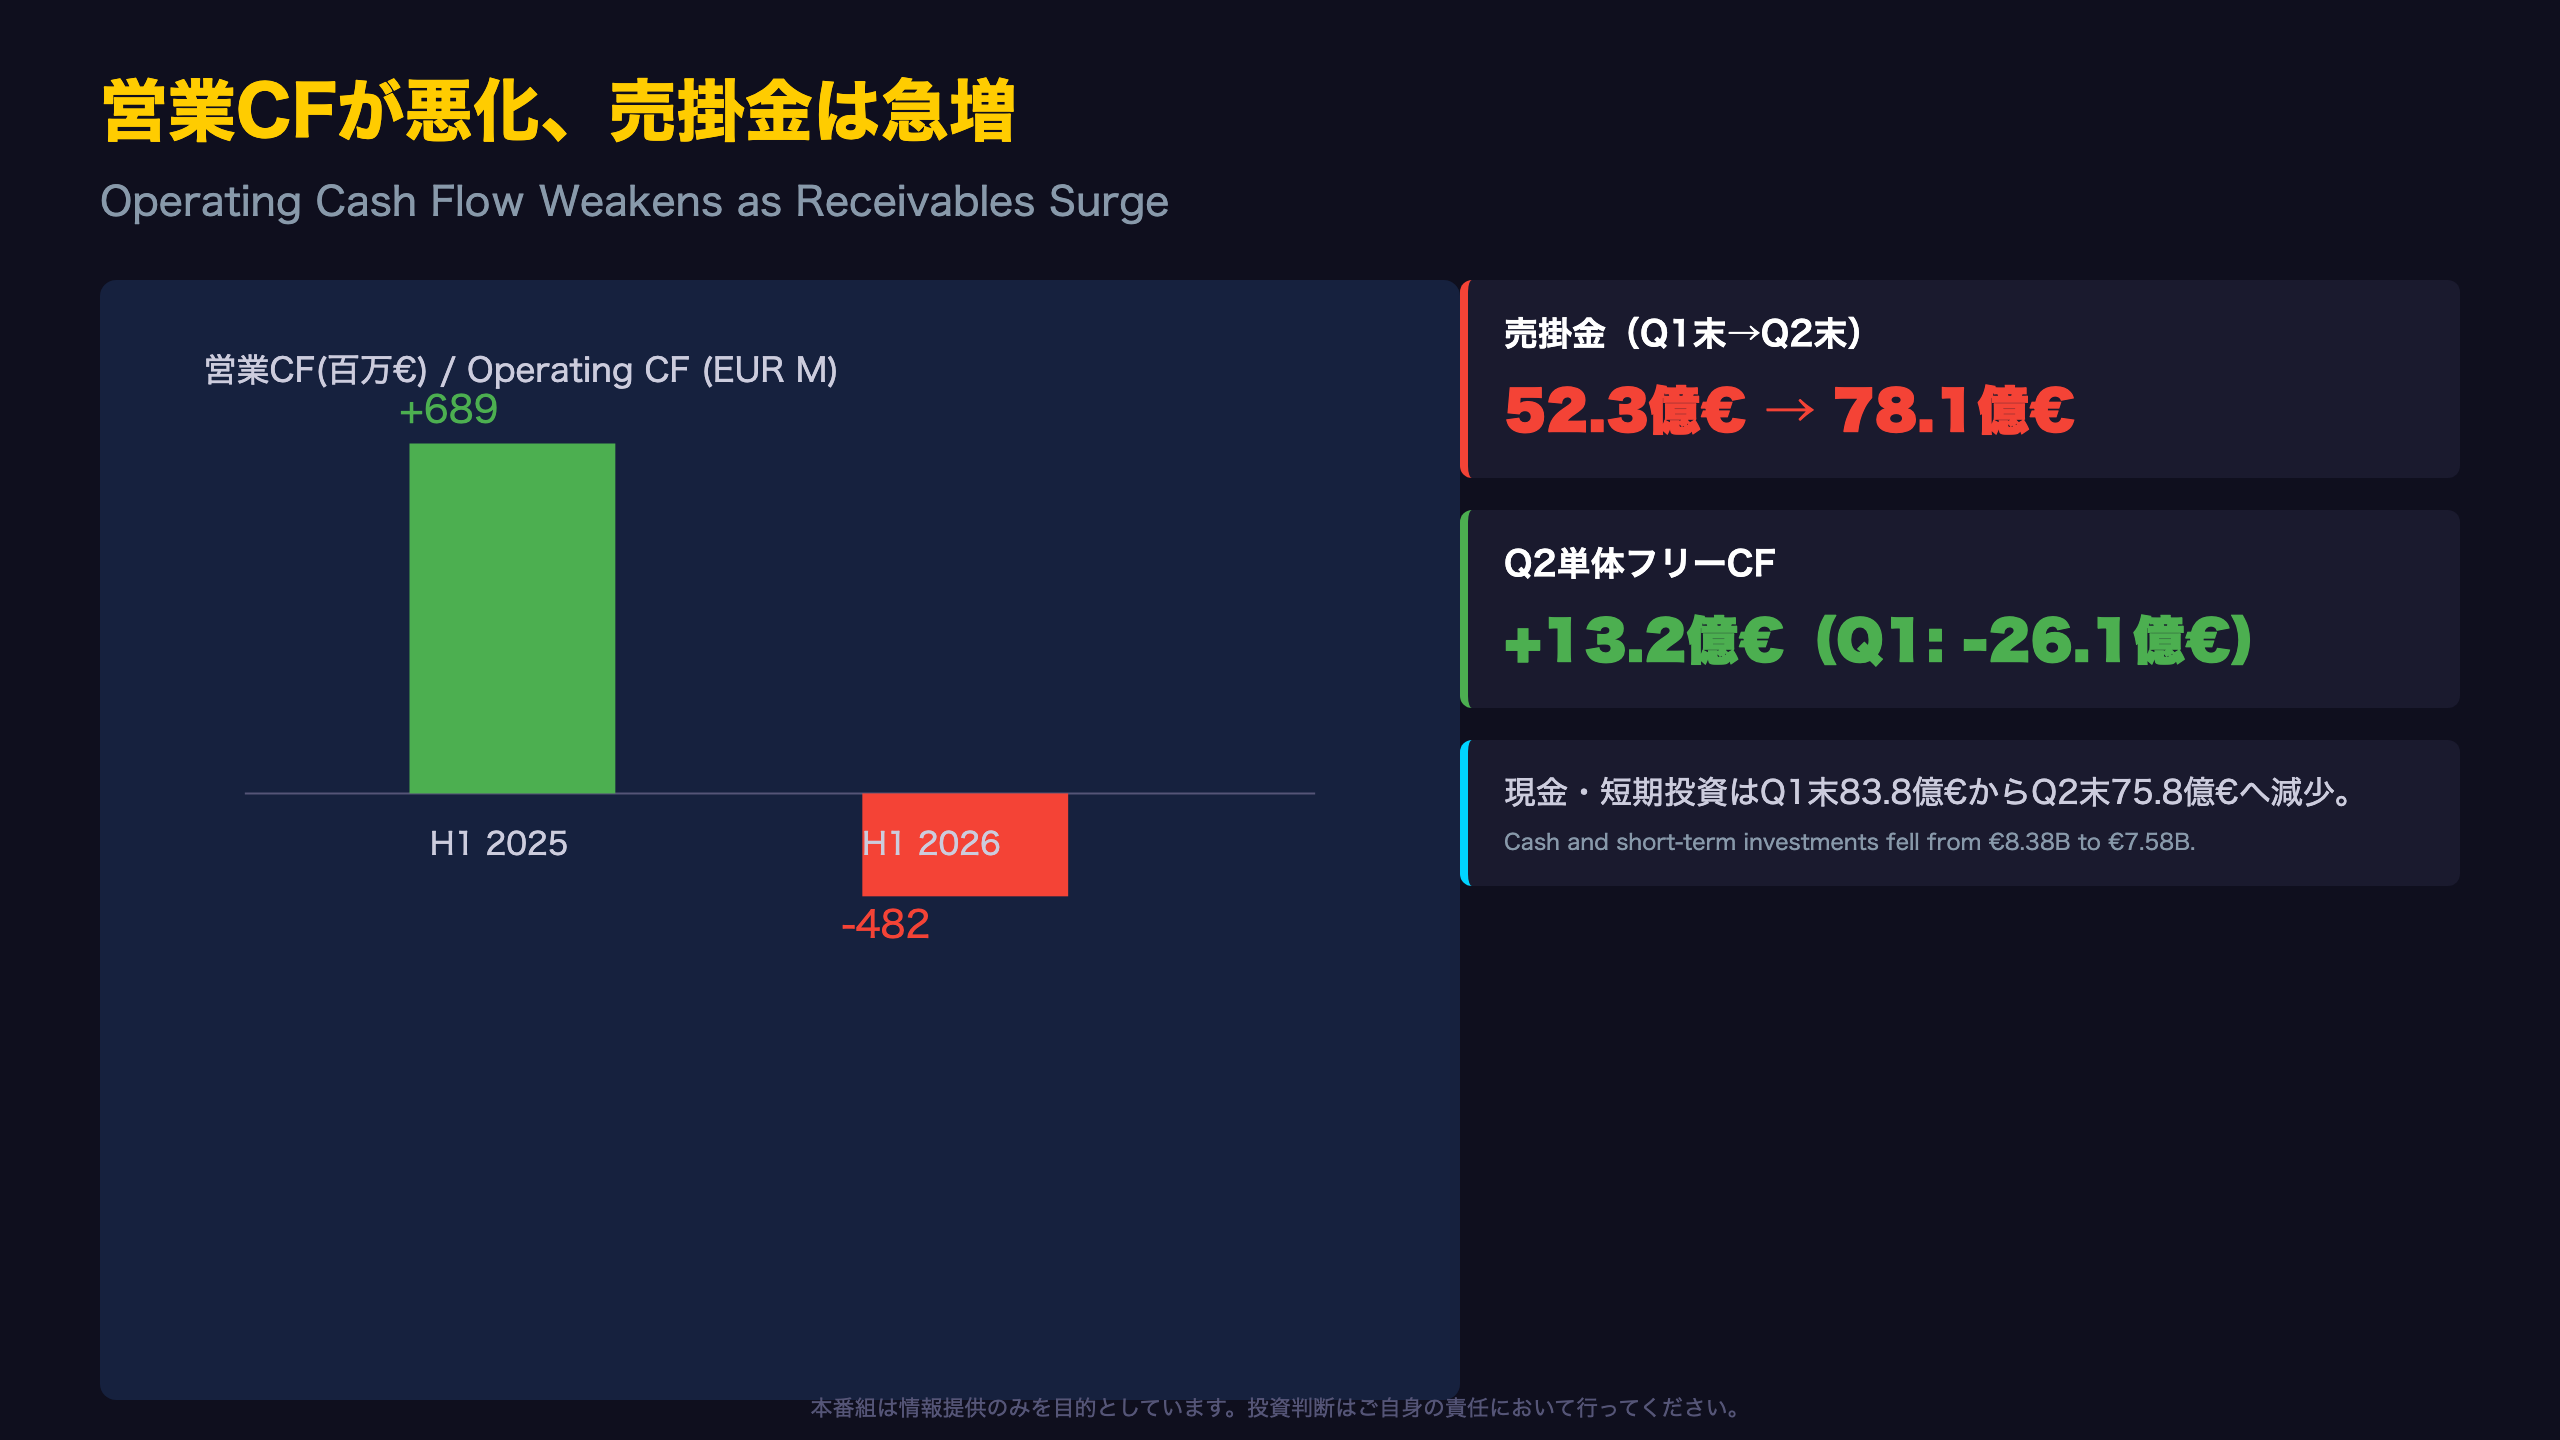
According to the US GAAP cash flow statement, H1 2026 operating cash flow was negative €482.5 million (reported as “(482.5)” in the filing), reversing from positive €689.1 million a year earlier. Note that the IFRS-based statutory report shows a slightly different figure of negative €481.5 million versus positive €1,287.4 million prior year — both are disclosed in the source documents and reflect different accounting standards (US GAAP vs. EU-IFRS).
What drove the swing?
The balance sheet shows accounts receivable, net rising sharply — from €5,232.9 million (or €4,402.9 million per the investor presentation) at Q1-end to €7,252.6 million (or €7,813 million per the presentation) at Q2-end. This could reflect a lag in customer payment collection, or simply a timing effect from concentrated shipments near quarter-end — a common pattern for capital equipment makers.
Context for investors unfamiliar with equipment-maker cash dynamics
Unlike software companies with near-instant cash collection, capital equipment makers like ASML often see working capital swing significantly quarter to quarter due to the size and timing of individual system shipments (each EUV system can cost well over $150 million), making single-quarter cash flow volatility less alarming than it might appear for a software peer.
A sequential improvement worth noting
Free cash flow turned positive at €1.317 billion in Q2, a sharp rebound from negative €2.608 billion in Q1 — indicating quarter-to-quarter cash generation capability has recovered even as the half-year total remains negative.
The other side of the coin
Rising receivables amid rapid revenue growth is not inherently alarming; it can simply reflect natural timing lags in a growing business. The key question for investors is whether these receivables are collected in Q3.
What to watch next
The pace of receivables collection in the second half of 2026 will be an important signal of underlying cash flow health, to be confirmed in the Q3 report on October 14, 2026.
株主還元:自社株買いと配当の継続
Shareholder returns in detail
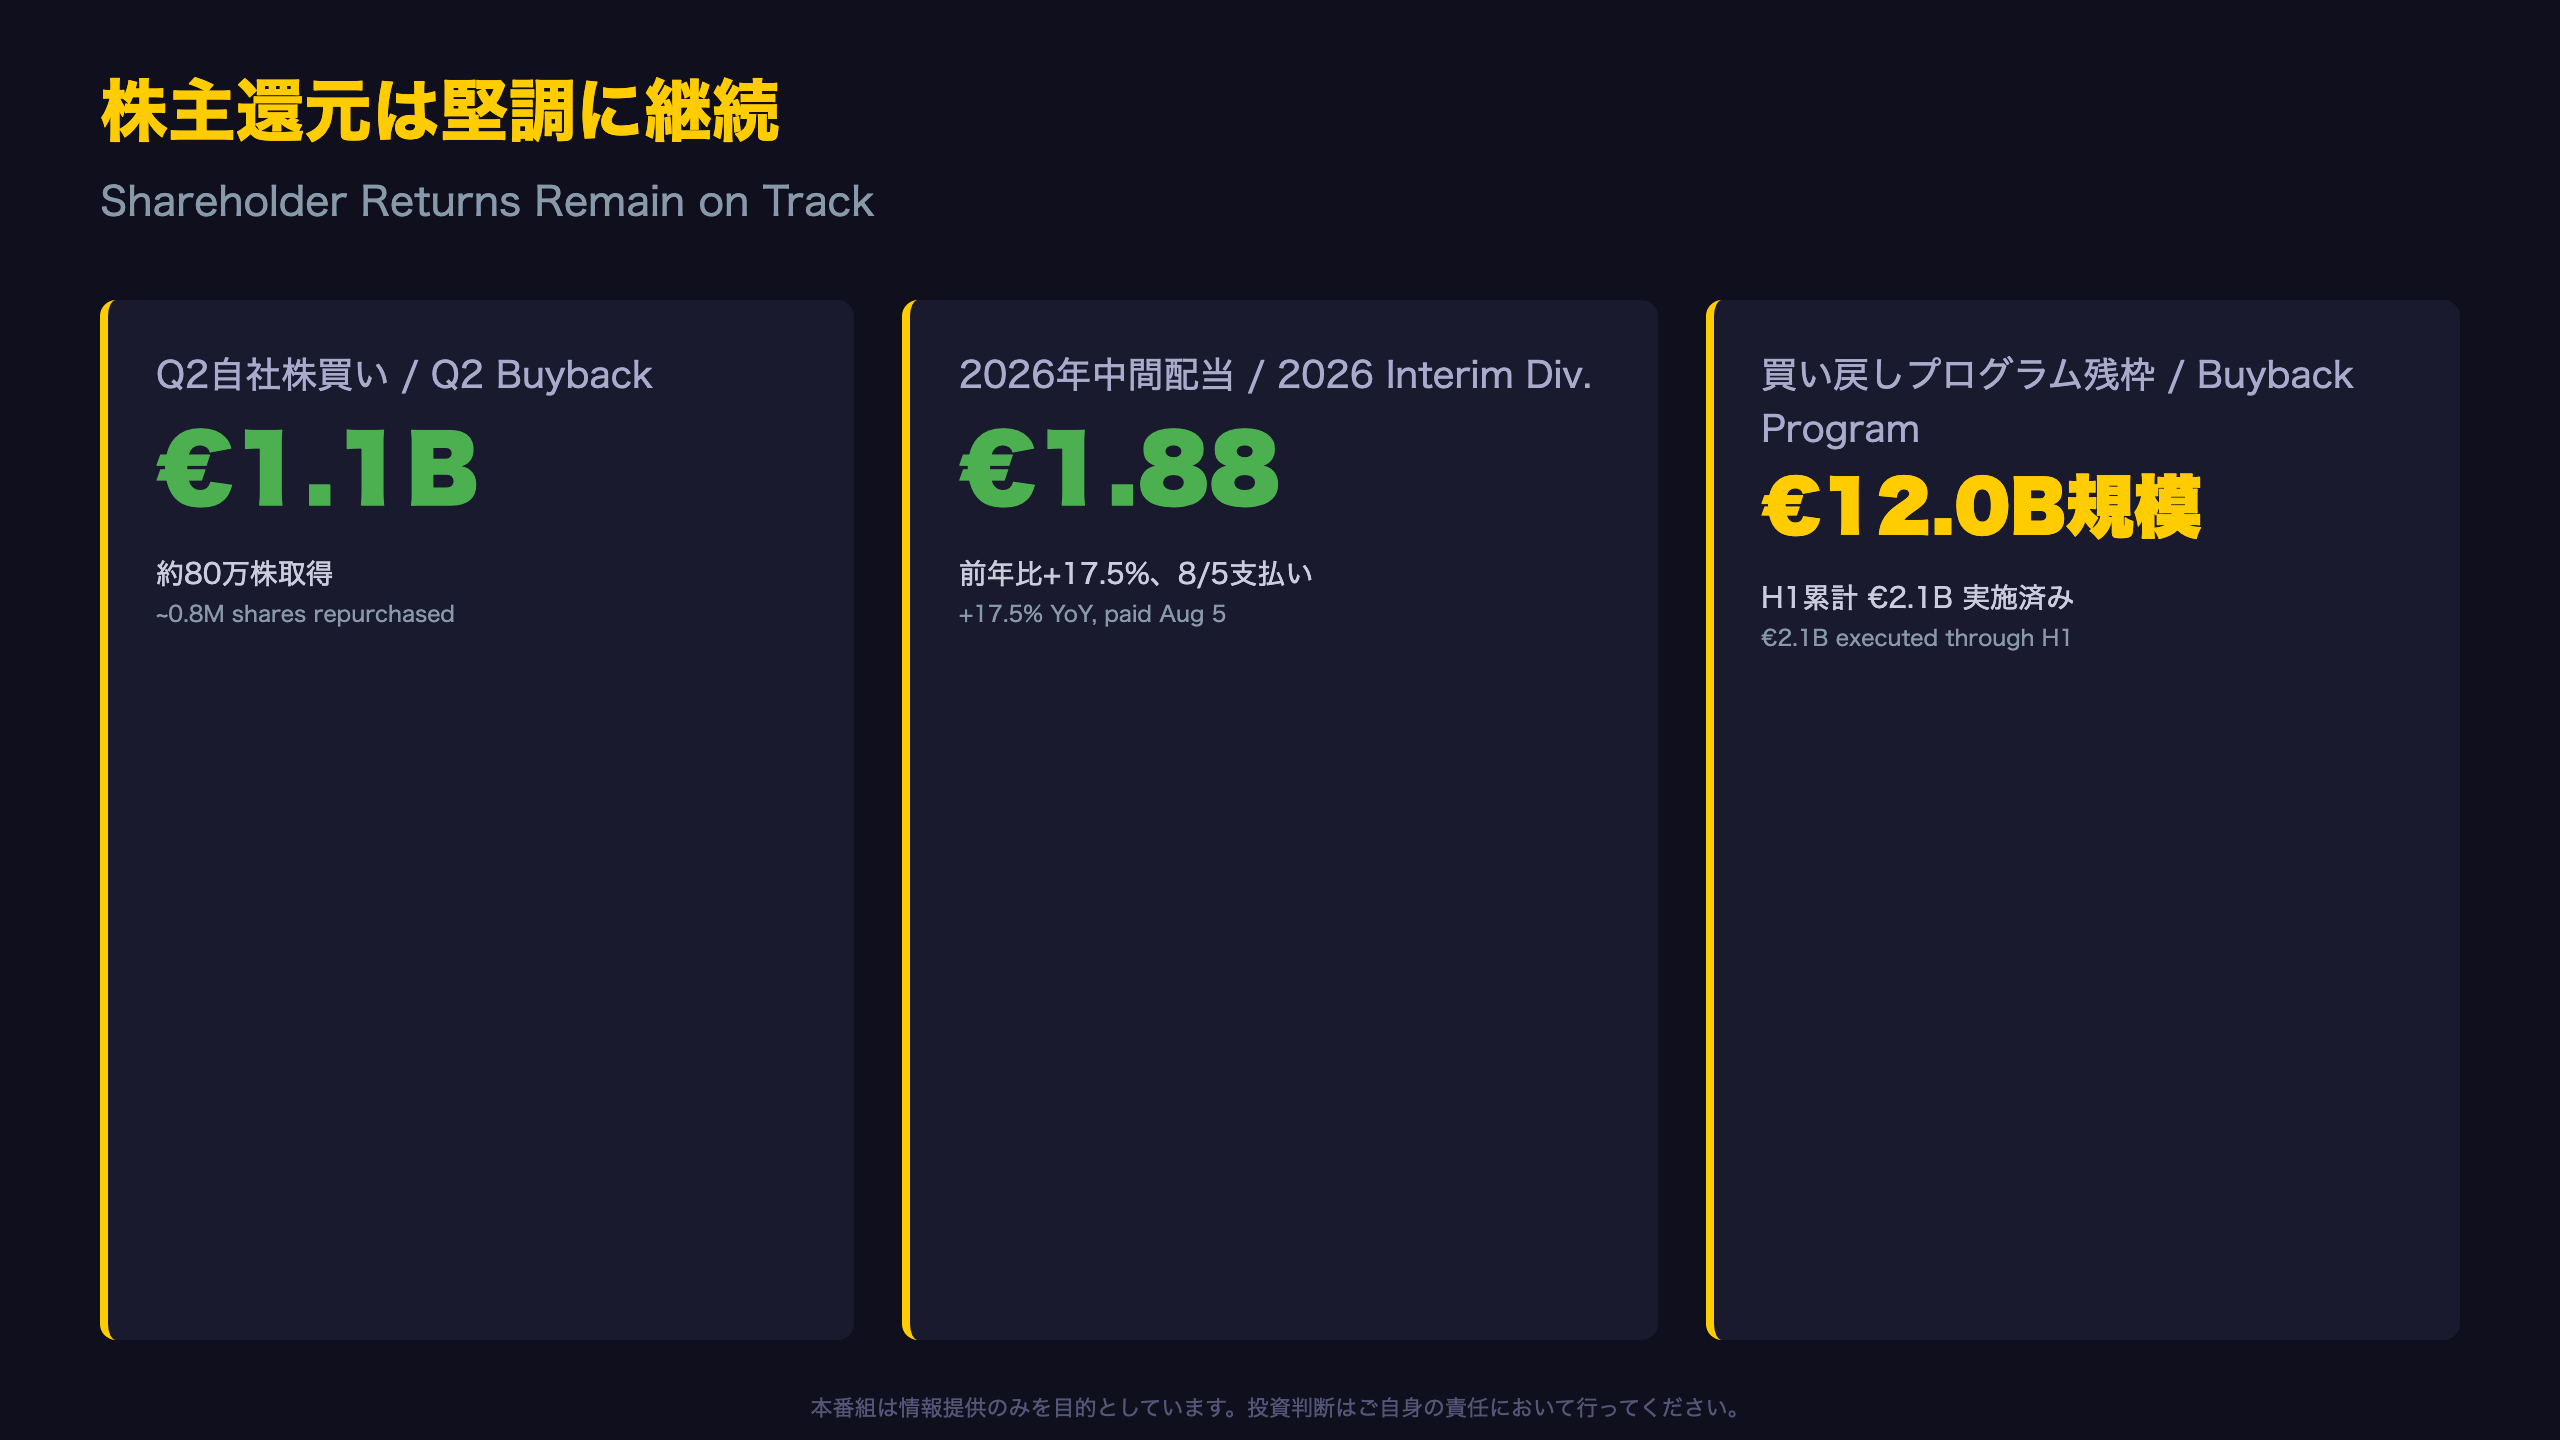
According to Note 7 of the Statutory Interim Report, the new share buyback program announced January 28, 2026, authorizes up to €12.0 billion in repurchases through December 31, 2028. As of June 28, 2026, ASML had already repurchased “approximately 1.7 million shares for an approximate amount of €2.1 billion” under this program.
Dividend trajectory
Total 2025 dividends comprised three interim payments of €1.60 each plus a final dividend of €2.70, totaling €7.50 per share and distributing approximately €2.9 billion to shareholders. The first 2026 interim dividend rises to €1.88 per share, up 17.5% from the prior year’s €1.60 interim rate.
Context: how this compares to US tech capital returns
ASML’s combined buyback-and-dividend approach is broadly comparable to how large-cap US semiconductor equipment makers (e.g., Applied Materials, Lam Research) return capital, though ASML’s dividend yield and buyback pace are also closely watched by European income-focused investors given its Euronext Amsterdam listing alongside Nasdaq.
Reconciling with the cash flow picture
As discussed elsewhere in this report, H1 operating cash flow turned negative. Despite this, ASML still executed €1.1 billion in Q2 buybacks and €1,038.5 million in dividend payments — effectively drawing down its cash position (which fell from €8.38B to €7.58B) to fund these returns.
The other side of the coin
Maintaining capital returns despite softer near-term cash generation can signal management confidence in future order execution and cash conversion. Conversely, if working capital pressure persists, a moderation in the pace of buybacks cannot be ruled out.
What to watch next
The pace of Q3 buyback execution and the trajectory of cash and short-term investment balances will be key indicators of ASML’s financial flexibility going forward.
インプリケーション:市場が注目すべき論点
Market implications through the chain of evidence
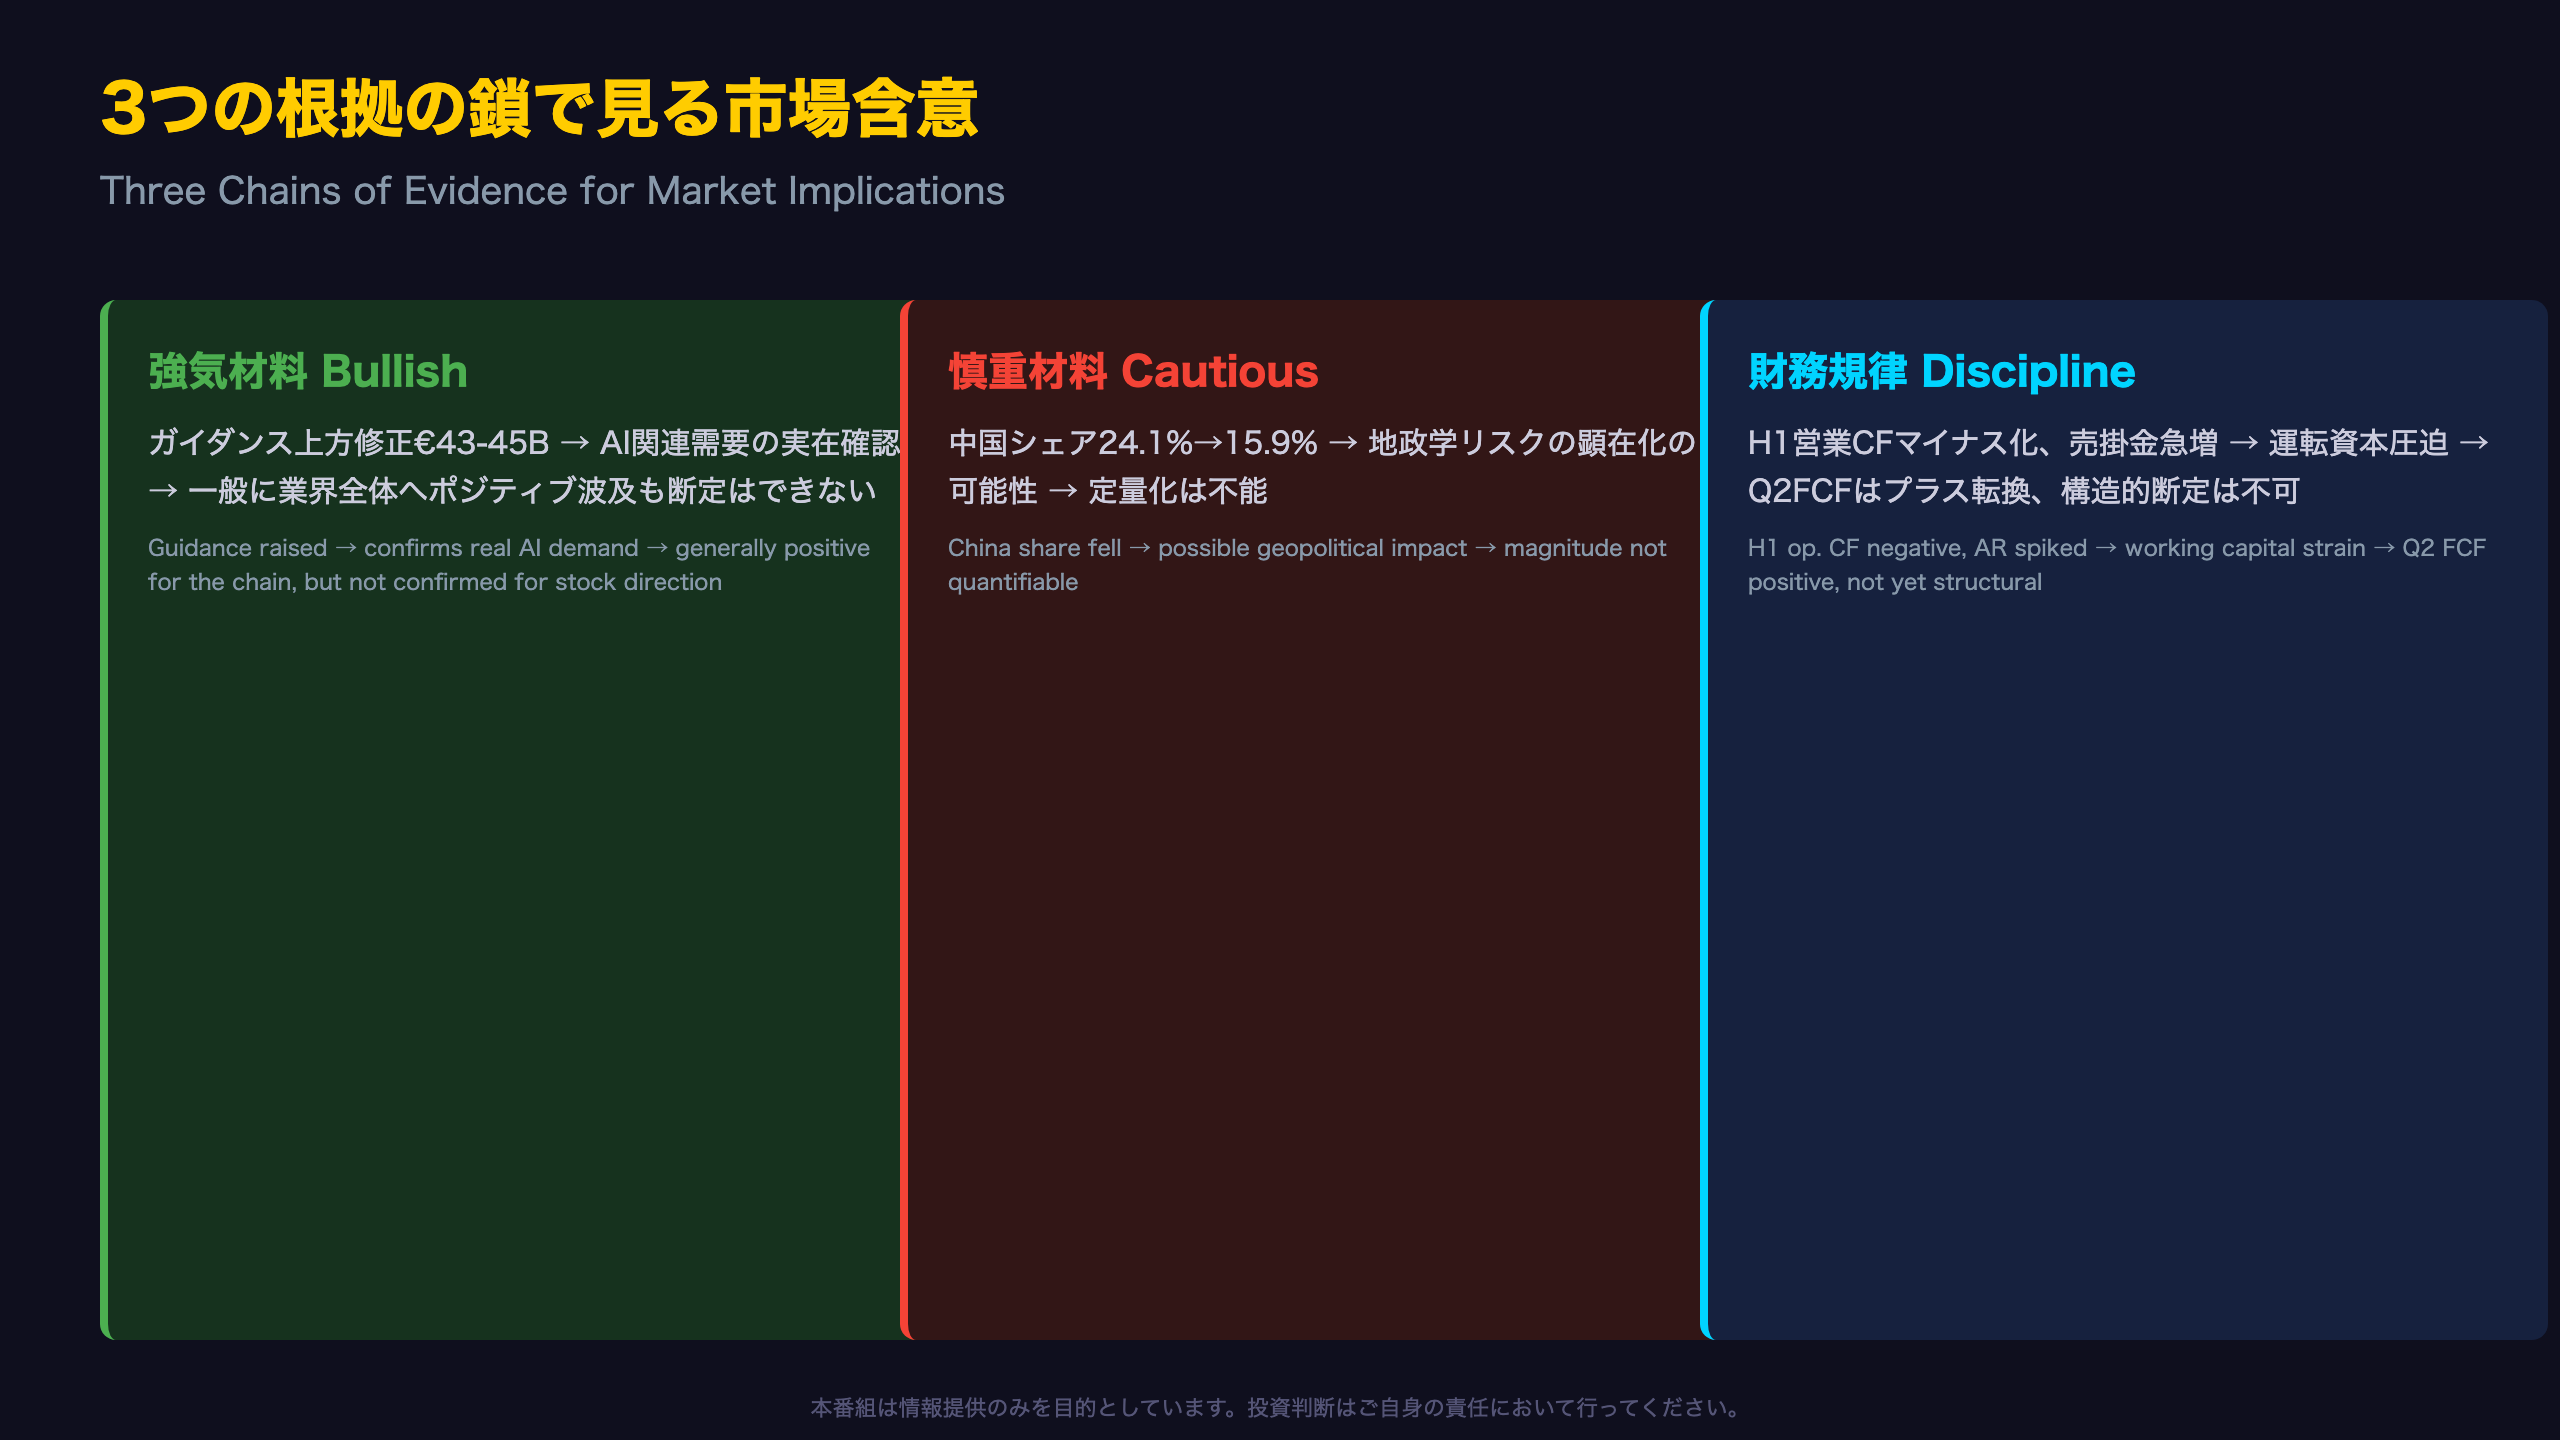
Here is the logical chain connecting today’s data to broader market implications.
Bullish chain: “Sales of €9.33B and EPS of €7.59 beat guidance, with FY guidance raised to €43-45B” → “This confirms real, ongoing demand for AI-related semiconductor capital equipment” → “Generally, positive spillover effects tend to be priced into the broader equipment supply chain (foundries and memory makers), though this data alone cannot determine the direction of ASML’s own stock price.”
Cautious chain: “China H1 sales fell 22.3% YoY, with China’s revenue share dropping from 24.1% to 15.9%” → “This may reflect structural pressure on part of ASML’s customer base from geopolitical export control dynamics” → “Generally, heightened geopolitical risk tends to be priced in as a volatility factor for region-specific revenue, though the risk factors section does not quantify any specific regulatory impact, so the magnitude cannot be measured precisely.”
Financial discipline chain: “H1 operating cash flow turned negative at €481.5M, while accounts receivable jumped from €5.23B to €7.81B” → “This signals near-term working capital pressure” → “Generally, persistent working capital deterioration could raise concerns about capital-return capacity, though Q2 standalone free cash flow already turned positive, so a structural cash flow breakdown cannot be confirmed from a single data point.”
What US and global investors should track next
Three metrics to monitor ahead of the next earnings release (October 14, 2026): (1) whether Q3 guidance of €11.0-12.0B in sales and 55-57% gross margin is achieved, (2) the trajectory of China’s revenue share, and (3) whether the Q2 spike in accounts receivable is collected in Q3.
Disclaimer: This article is for informational purposes only. All investment decisions are made solely at your own risk.