This article was automatically generated by the NFC Market Live AI analysis system. (Updated: 2026-08-04 21:10 JST)
Caterpillar (CAT) delivered a record $20.5B quarter in Q2 2026 📊
Revenue rose 24% YoY, adjusted EPS jumped 73% to $8.17 — the first time in company history sales topped $20B in a single quarter 💰
But operating profit included $392M in one-time IEEPA tariff recoveries, and manufacturing costs squeezed margins in Resource Industries and Power & Energy ⚠️
We break down the structural strength (North America construction +50%, data center power demand +72%) against the hidden one-off factors.
Watch for tariff recovery continuity in the next quarter 📈
史上初、四半期売上200億ドル突破
Headline Numbers
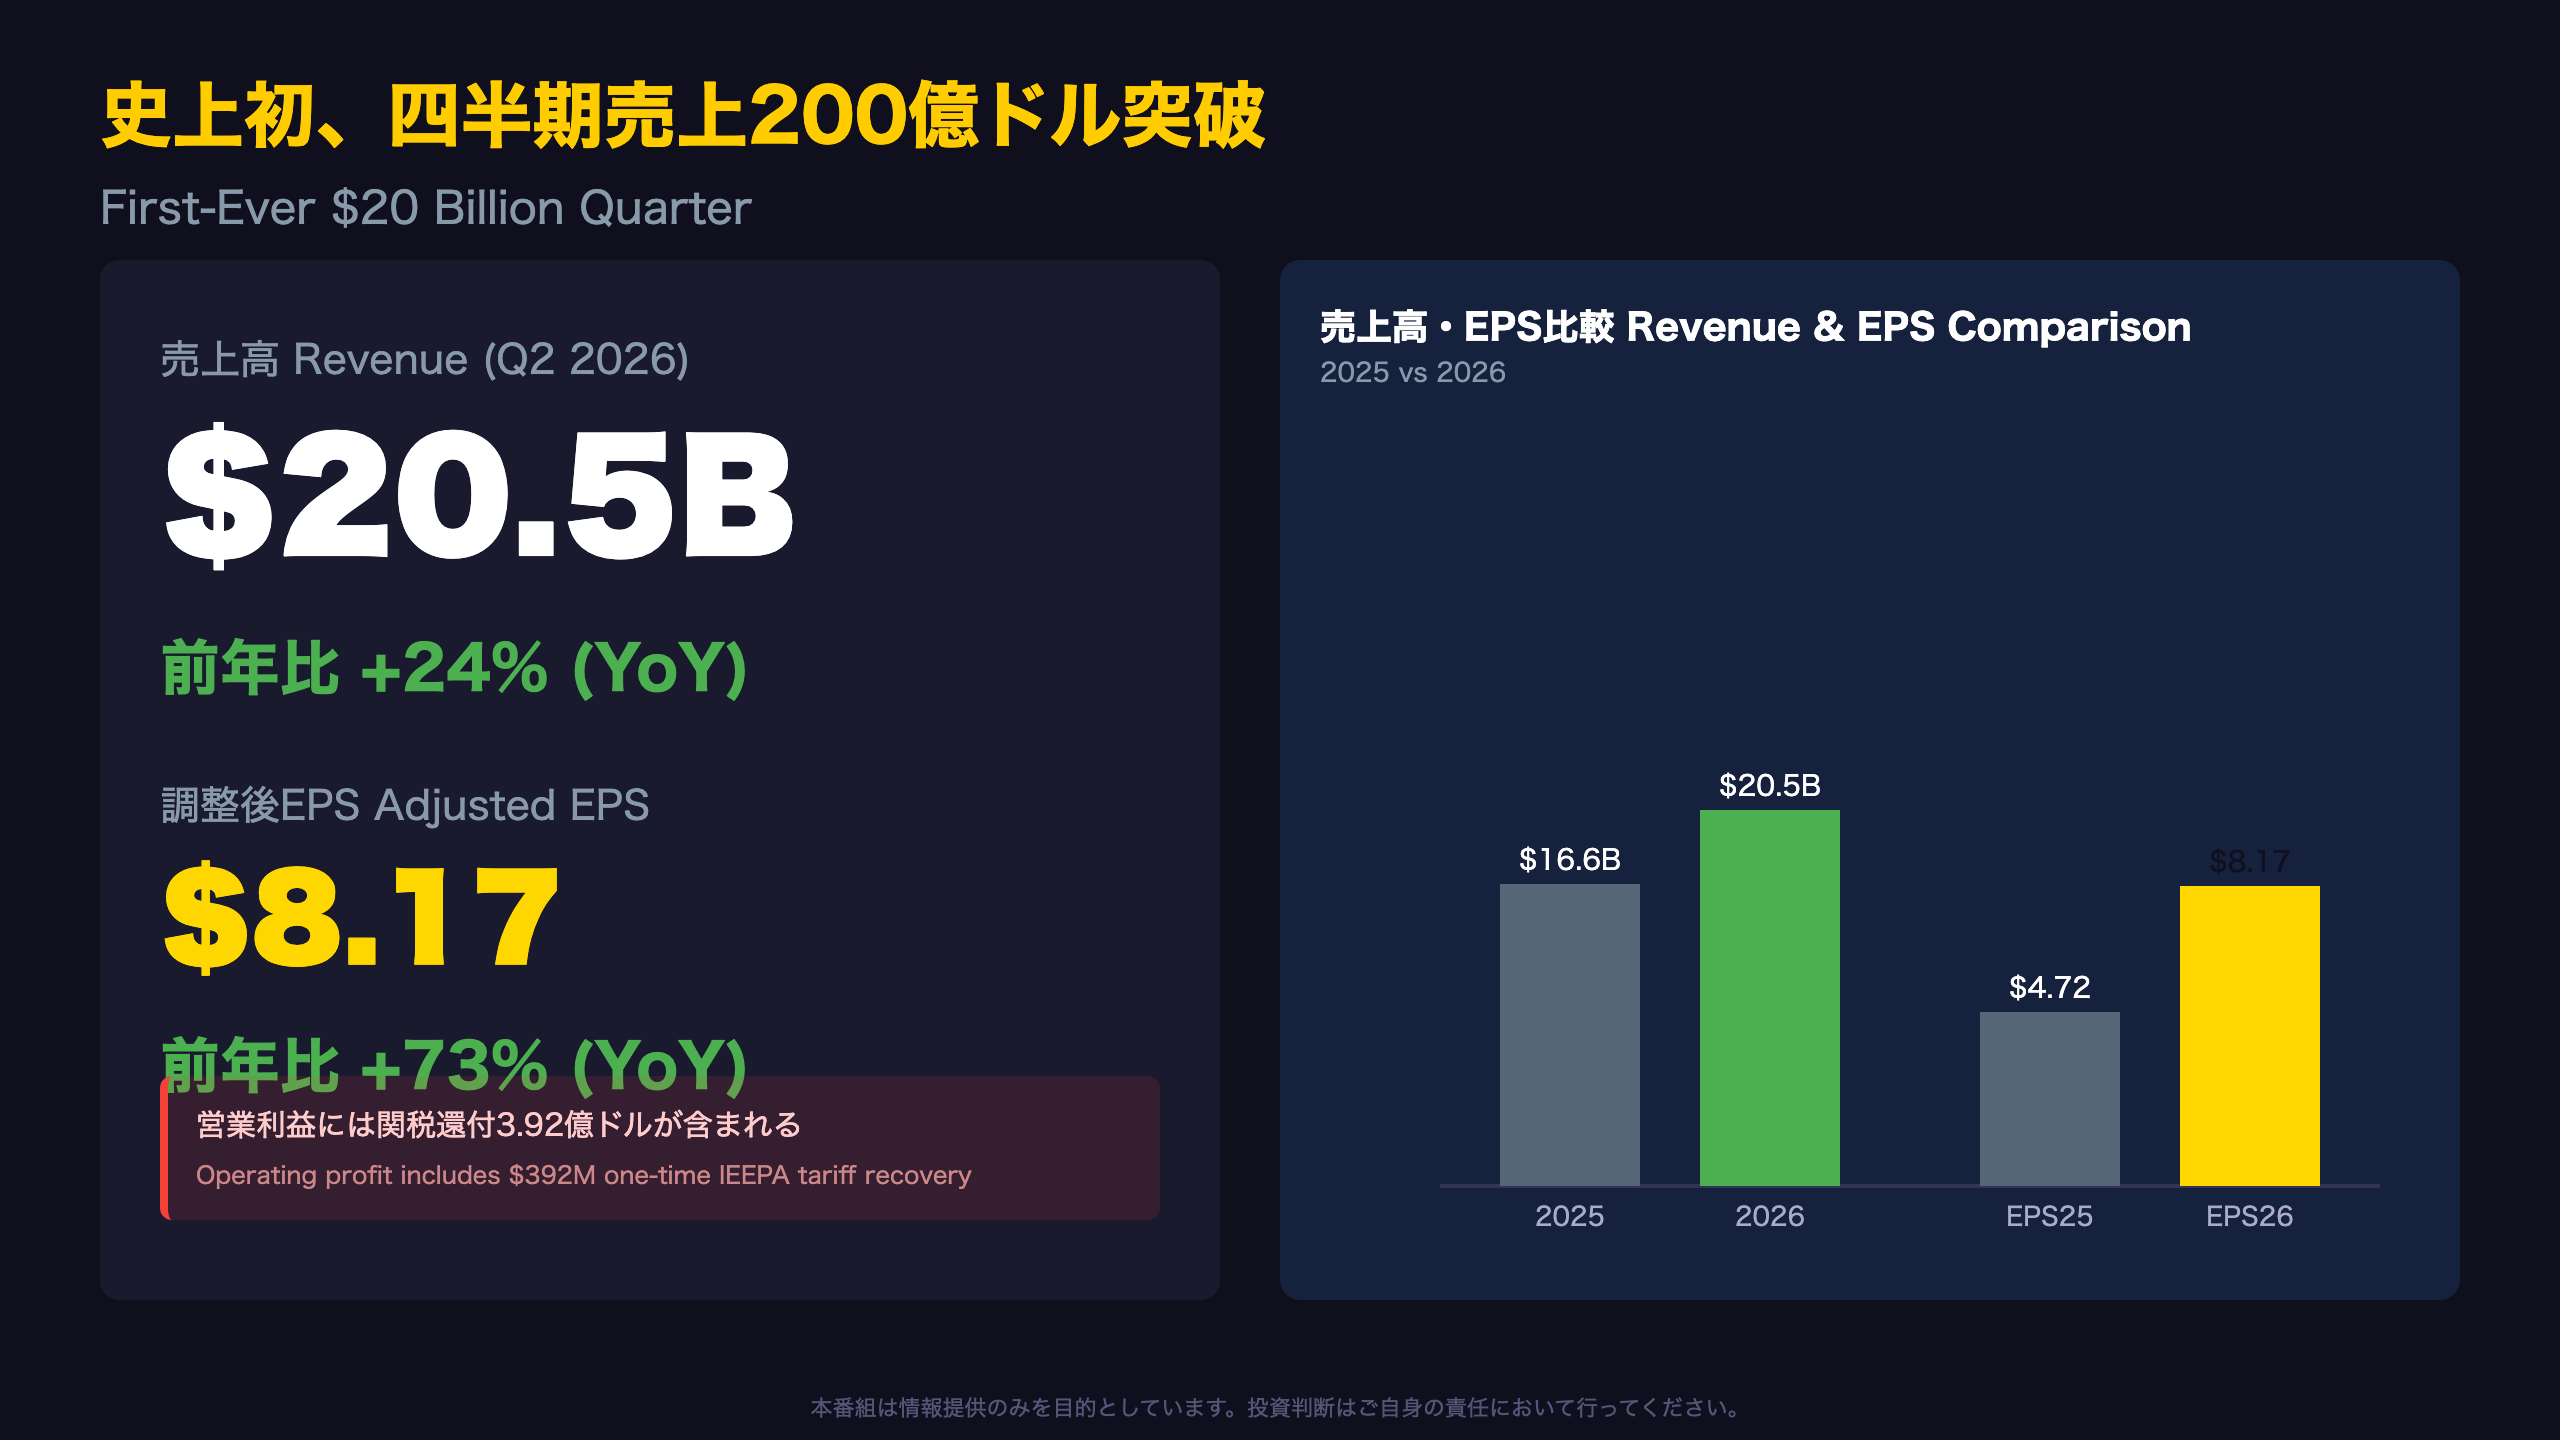
Caterpillar (NYSE: CAT) reported Q2 2026 revenue of $20.543 billion, up 24% year-over-year, with adjusted EPS of $8.17, up 73% from $4.72. The company stated plainly: “This is the first time in company history that we have generated over $20 billion in sales and revenues in a single quarter.”
Context for International Readers
Caterpillar files quarterly results with the U.S. Securities and Exchange Commission (SEC) via Form 8-K, distinct from the UK’s RNS or Japan’s Kessan Tanshin disclosure systems. The company reports both GAAP (Generally Accepted Accounting Principles) and non-GAAP adjusted figures — a common U.S. practice that strips out one-time items like restructuring charges to show “underlying” performance.
The Overlooked Catch
Buried in the release is this disclosure: “Operating profit in the second quarter of 2026 included $392 million of expected International Emergency Economic Power Act (IEEPA) tariff recoveries.” That’s roughly 9% of the $4.295 billion in total operating profit — a meaningful one-time boost tied to U.S. trade policy, not organic demand.
Bull vs. Bear Read
Bulls will note that volume alone contributed $3.1 billion of the $3.97 billion revenue increase — real demand, not just pricing or FX. Bears will point out that without visibility into consensus estimates (none are disclosed in this filing), it’s impossible to say whether the stock has already priced in this strength, especially given the tariff-related boost inflates the headline beat.
What to Watch Next
No forward guidance was provided in this release. Investors should watch the Q2 earnings call (7:30 a.m. Central Time, Aug. 4) for management commentary on whether the tariff recovery is a recurring or one-off item, and whether elevated manufacturing costs persist into Q3.
増収の内訳:数量が牽引
Decomposing the Revenue Increase
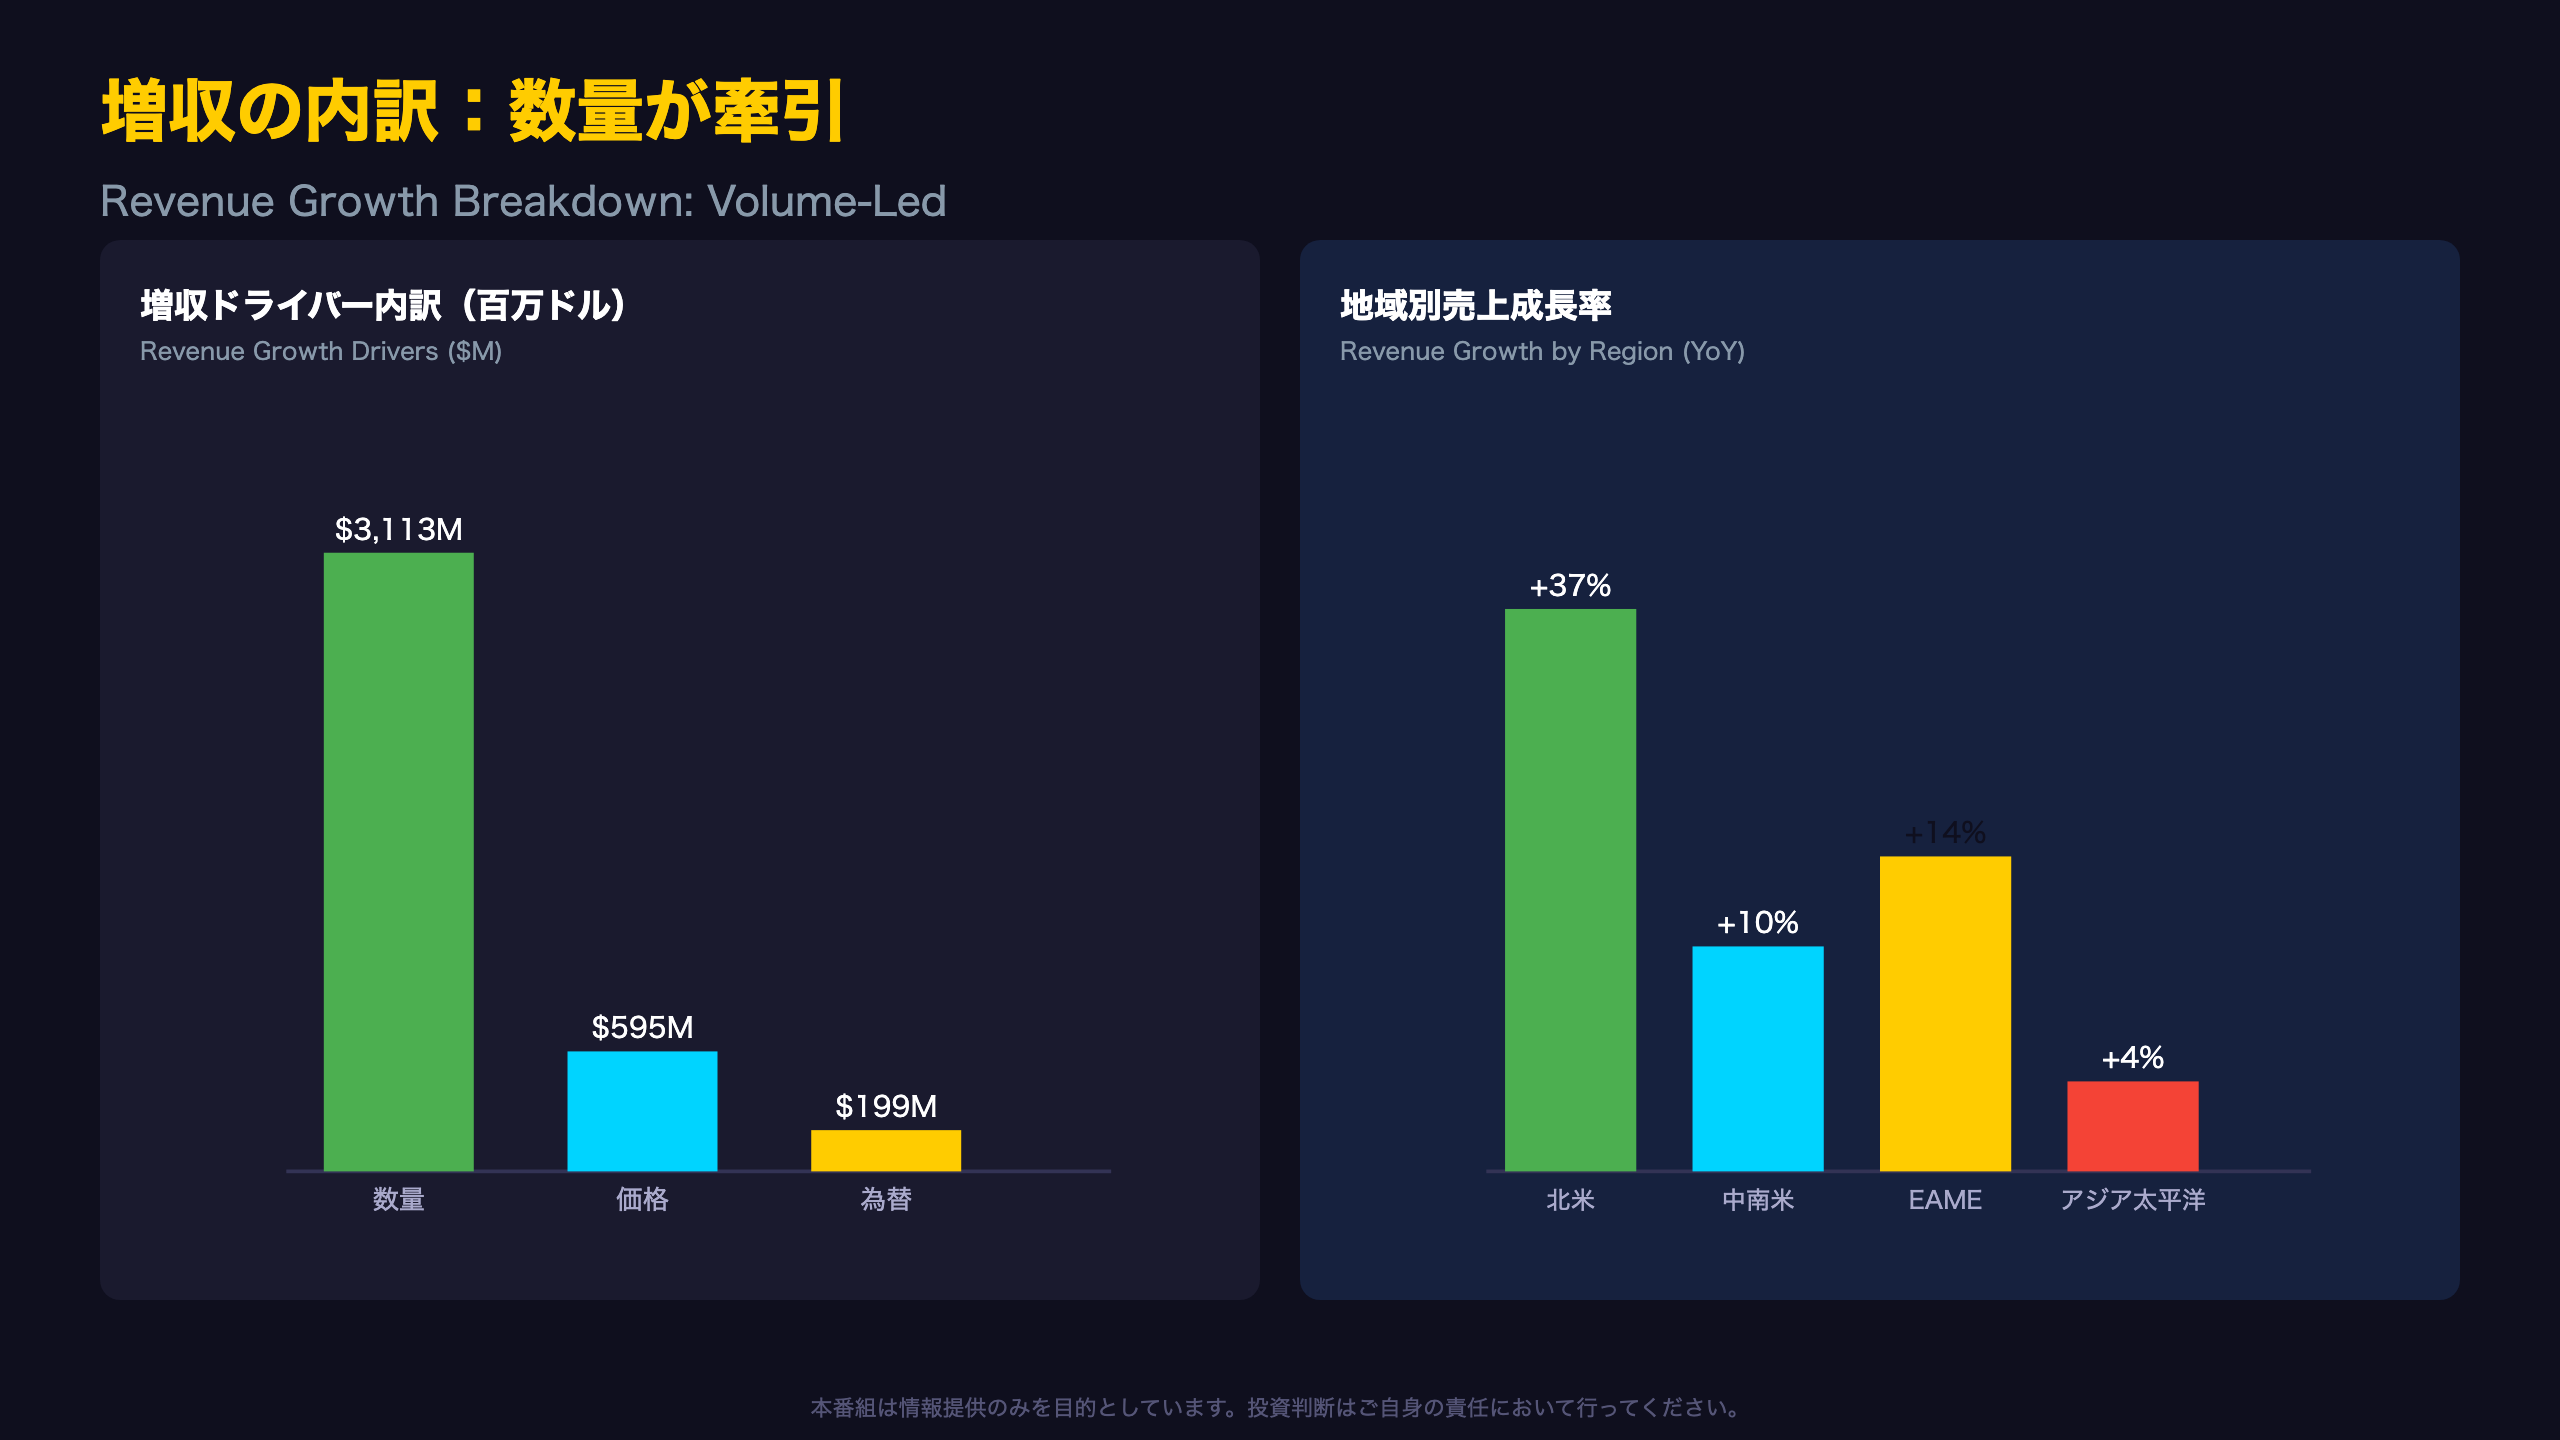
Caterpillar’s earnings release breaks down the $3.974 billion revenue increase into four components:
| Driver | Amount ($M) | Share |
|---|---|---|
| Volume | 3,113 | 78.3% |
| Price | 595 | 15.0% |
| Currency | 199 | 5.0% |
| Other | 67 | 1.7% |
The fact that volume drove nearly 80% of the increase matters. A revenue beat driven primarily by price hikes would raise sustainability questions, but here the filing explicitly attributes the gain to “higher sales of equipment to end users” — a sign of genuine demand rather than pricing power alone.
Regional Divergence
By region, North America revenue hit $12.094 billion (+37% YoY) — by far the strongest performer. Latin America grew 10% to $1.821 billion, EAME (Europe, Africa, Middle East, Eurasia) rose 14% to $3.625 billion, while Asia/Pacific lagged with just 4% growth to $3.003 billion.
Bull vs. Bear
Bulls will note that strength in North America — Caterpillar’s largest and most profitable market — is arguably more valuable than broad-based but shallow global growth. Bears will point to the tepid Asia/Pacific figure as a potential early signal of softer demand in construction and mining-heavy markets like China, though a single quarter’s data cannot confirm this as a structural trend.
Looking Ahead
Watch whether the regional growth gap widens or narrows next quarter. Asia/Pacific trends are particularly linked to mining demand within the Resource Industries segment, making it a key indicator to monitor going forward.
営業利益率改善と関税還付の影響
Unpacking the Margin Improvement
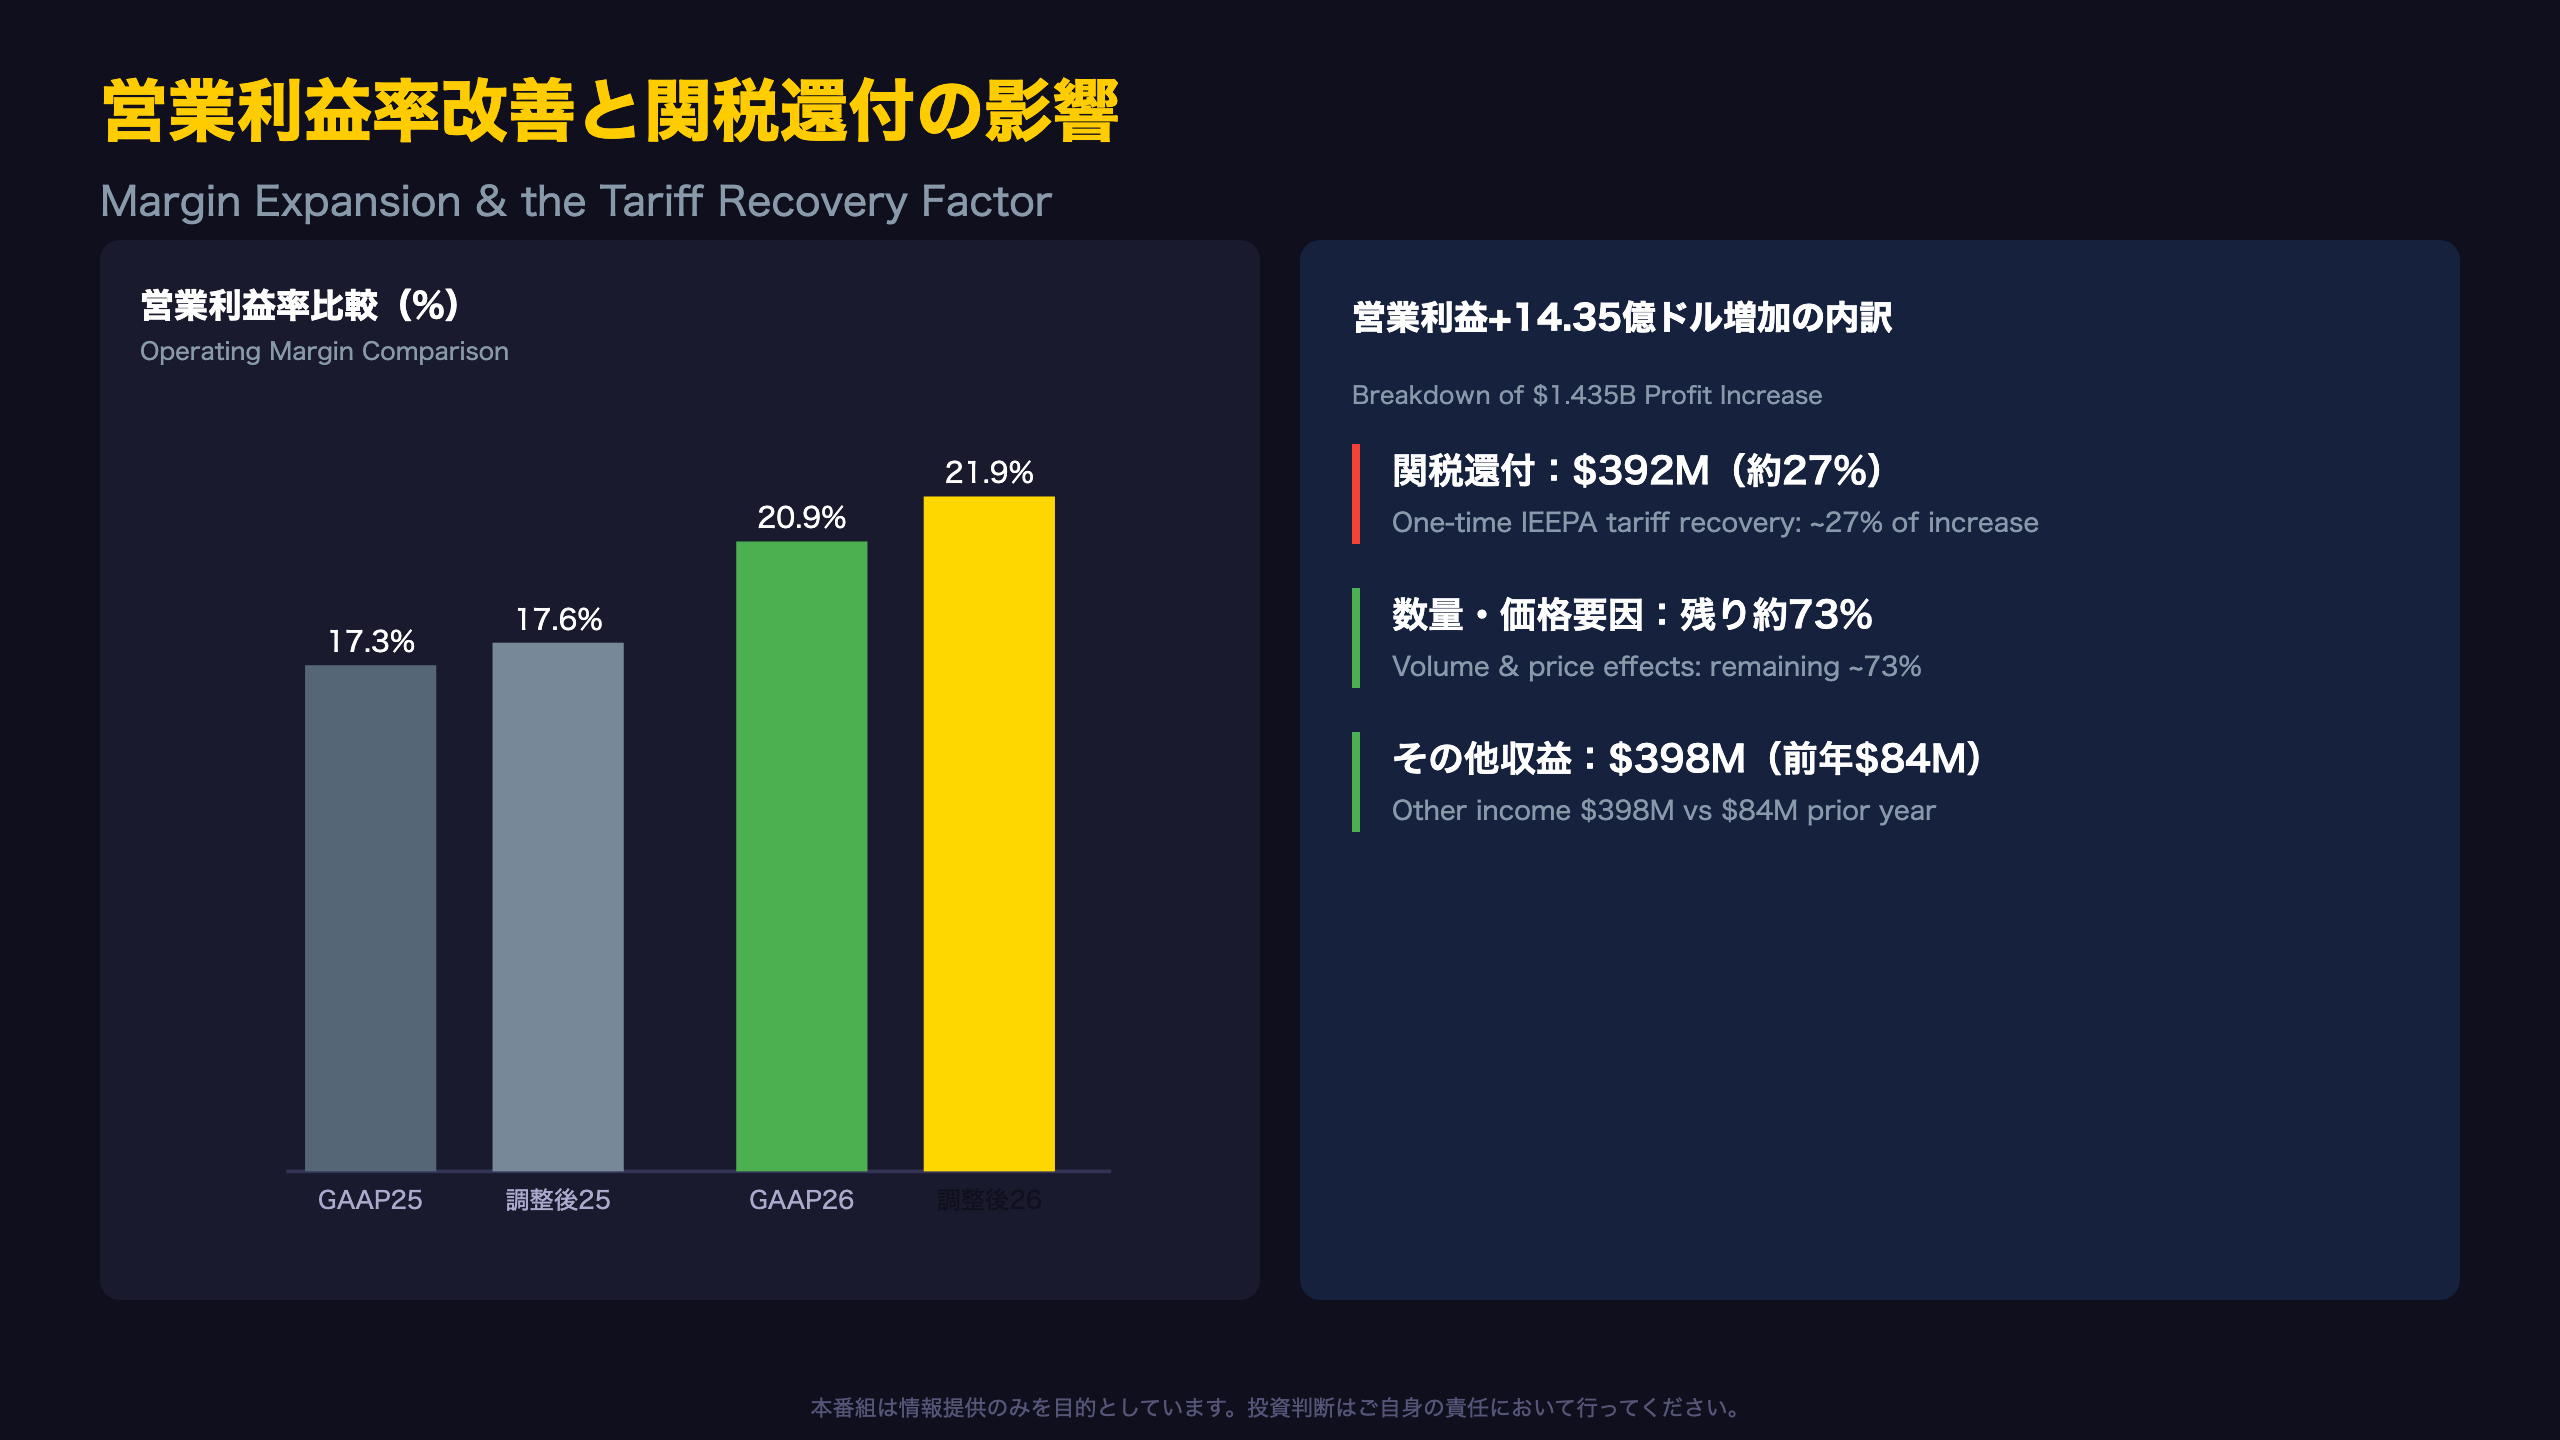
A 50% jump in operating profit to $4.295 billion sounds unambiguously strong — but the composition matters for assessing earnings quality.
The filing states: “Operating profit in the second quarter of 2026 included $392 million of expected International Emergency Economic Power Act (IEEPA) tariff recoveries.” IEEPA refers to a U.S. federal law used to justify certain tariff actions; “recoveries” here means Caterpillar recouped costs previously absorbed from tariffs.
That $392 million represents roughly 27% of the $1.435 billion increase in operating profit. In other words, about a quarter of this quarter’s profit growth came from a one-time trade-policy-related item, not core operations.
Why This Matters for Non-GAAP Investors
Notably, this tariff recovery is not excluded from Caterpillar’s non-GAAP adjusted figures (which strip out only restructuring costs). That means the widely-quoted adjusted EPS of $8.17 still fully includes this one-time benefit — something U.S. equity analysts typically flag when assessing “clean” earnings power.
Tax Rate Stability
The effective tax rate was essentially flat at 23.1% versus 23.0% a year ago, though the quarter included a $26 million discrete tax benefit from stock compensation settlements and a $139 million loss on the divestiture of non-U.S. entities with no offsetting tax benefit — several moving pieces worth noting.
Bull vs. Bear
Bulls argue that even stripping out the tariff item, volume-driven margin expansion is real and structural. Bears counter that the “clean” earnings growth rate is likely lower than the headline 50% figure, and flag the risk of a negative comparison base if this tariff benefit doesn’t repeat in Q3.
What to Watch
Whether this tariff recovery persists depends on U.S. trade policy decisions. How Caterpillar treats this line item in the next earnings release will be a key signal for earnings quality assessment.
セグメント①建設機械が最大の伸び
Construction Industries Deep Dive
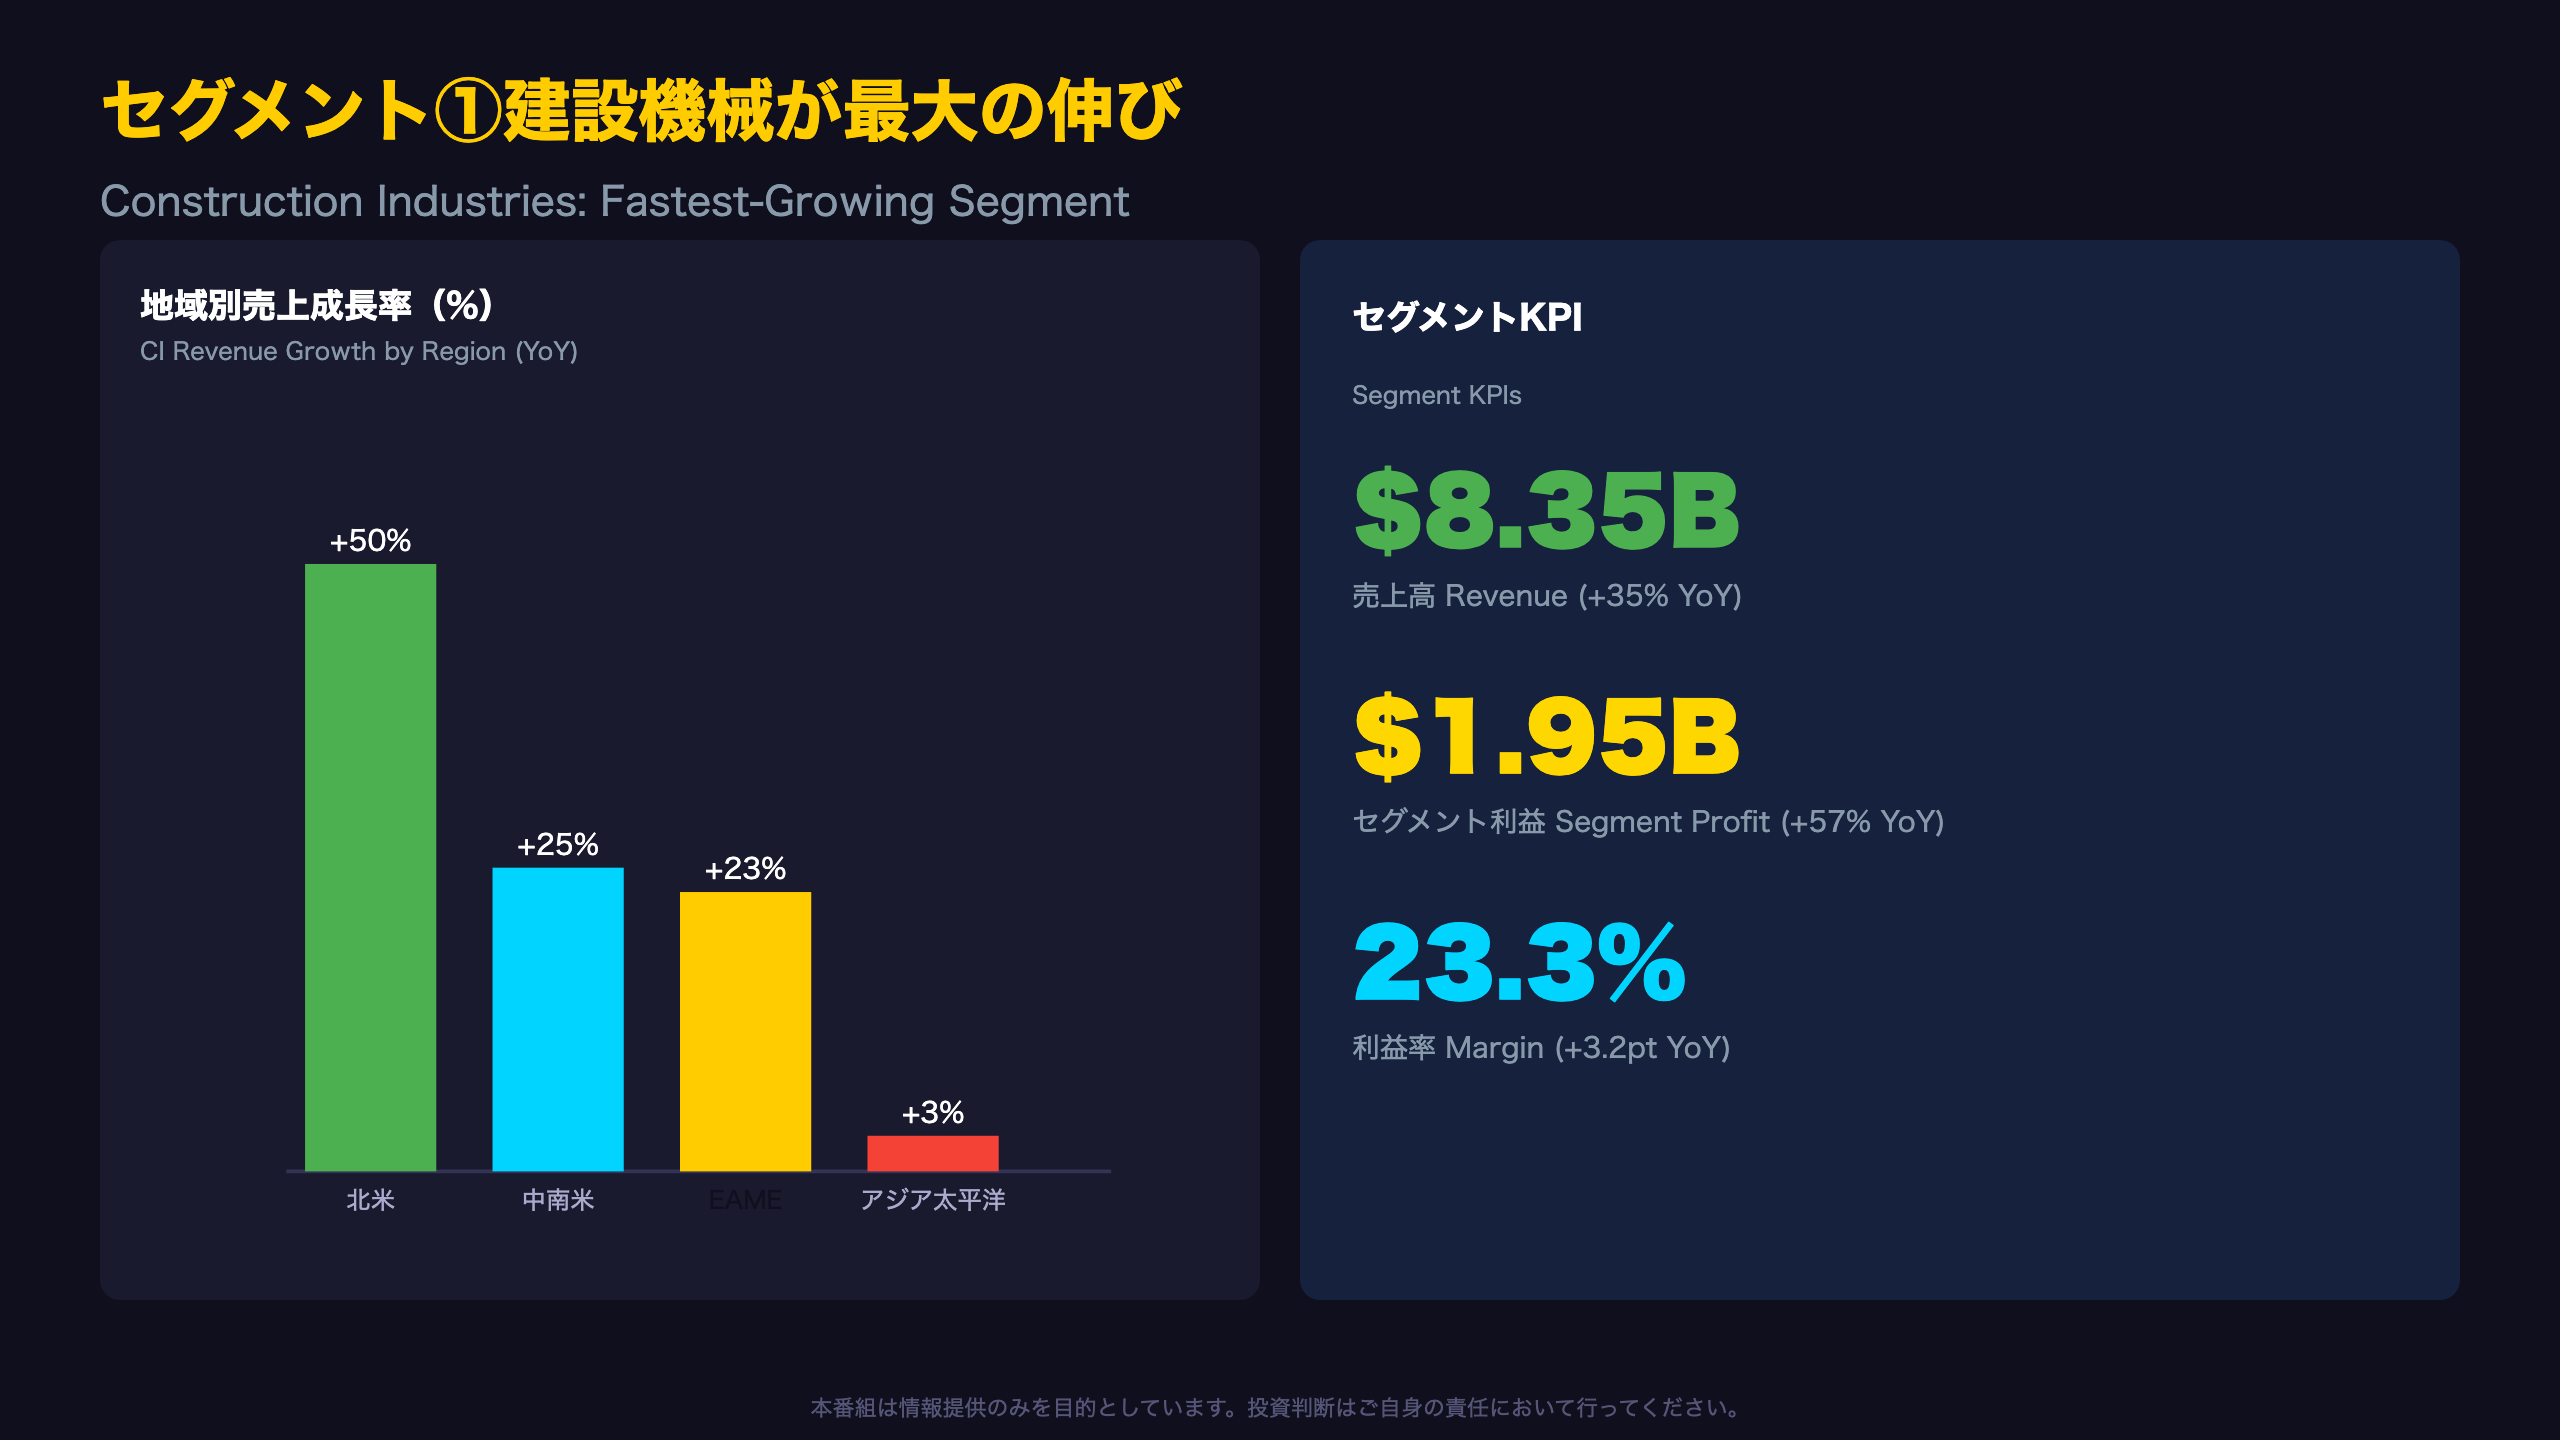
Construction Industries, Caterpillar’s largest reportable segment, delivered $8.346 billion in sales (+35% YoY) and $1.947 billion in segment profit (+57% YoY) — the fastest growth of any of the three primary segments. Margin expanded to 23.3% from 20.1%, a 3.2 point gain.
What Drove the Increase
The filing attributes the gain to “higher sales volume of $1.8 billion and favorable price realization of $309 million.” The roughly 6-to-1 ratio of volume to price mirrors the pattern seen at the consolidated level, reinforcing that demand — not pricing power — is the primary growth engine.
Regional Breakdown
| Region | Sales ($M) | YoY |
|---|---|---|
| North America | 5,065 | +50% |
| Latin America | 676 | +25% |
| EAME | 1,456 | +23% |
| Asia/Pacific | 1,064 | +3% |
The 50% surge in North America stands out. Management notes higher volume was “mainly driven by higher sales of equipment to end users and by the impact from changes in dealer inventories” — meaning part of the growth reflects dealers restocking, not just end-user purchases.
A Note of Caution on Dealer Inventories
Dealer inventory changes contributing to reported growth deserve scrutiny. If dealers are stocking up in anticipation of future demand, some of this growth could represent a pull-forward effect, raising the possibility of a payback in coming quarters. This is a single-quarter observation, however, and shouldn’t be treated as a confirmed structural trend.
Cross-Checking Against Retail Data
Caterpillar’s separate retail sales statistics (Exhibit 99.2) show Construction Industries retail sales up 22% globally and 27% in North America — figures that differ slightly from the segment’s reported dealer-shipment-based growth, reflecting the difference between wholesale (to dealers) and retail (to end users) measurement.
What to Watch
Investors should monitor whether dealer inventory levels remain within a healthy range, a topic likely to be addressed on the earnings call.
セグメント②電力・エネルギー、AI需要の波及
Power & Energy: Riding the Data Center Wave
Power & Energy posted $8.238 billion in revenue (+17% YoY) and $2.027 billion in segment profit (+30% YoY), with margin at 24.6% (+2.5 points) — the highest of the three primary segments.
Power Generation Leads
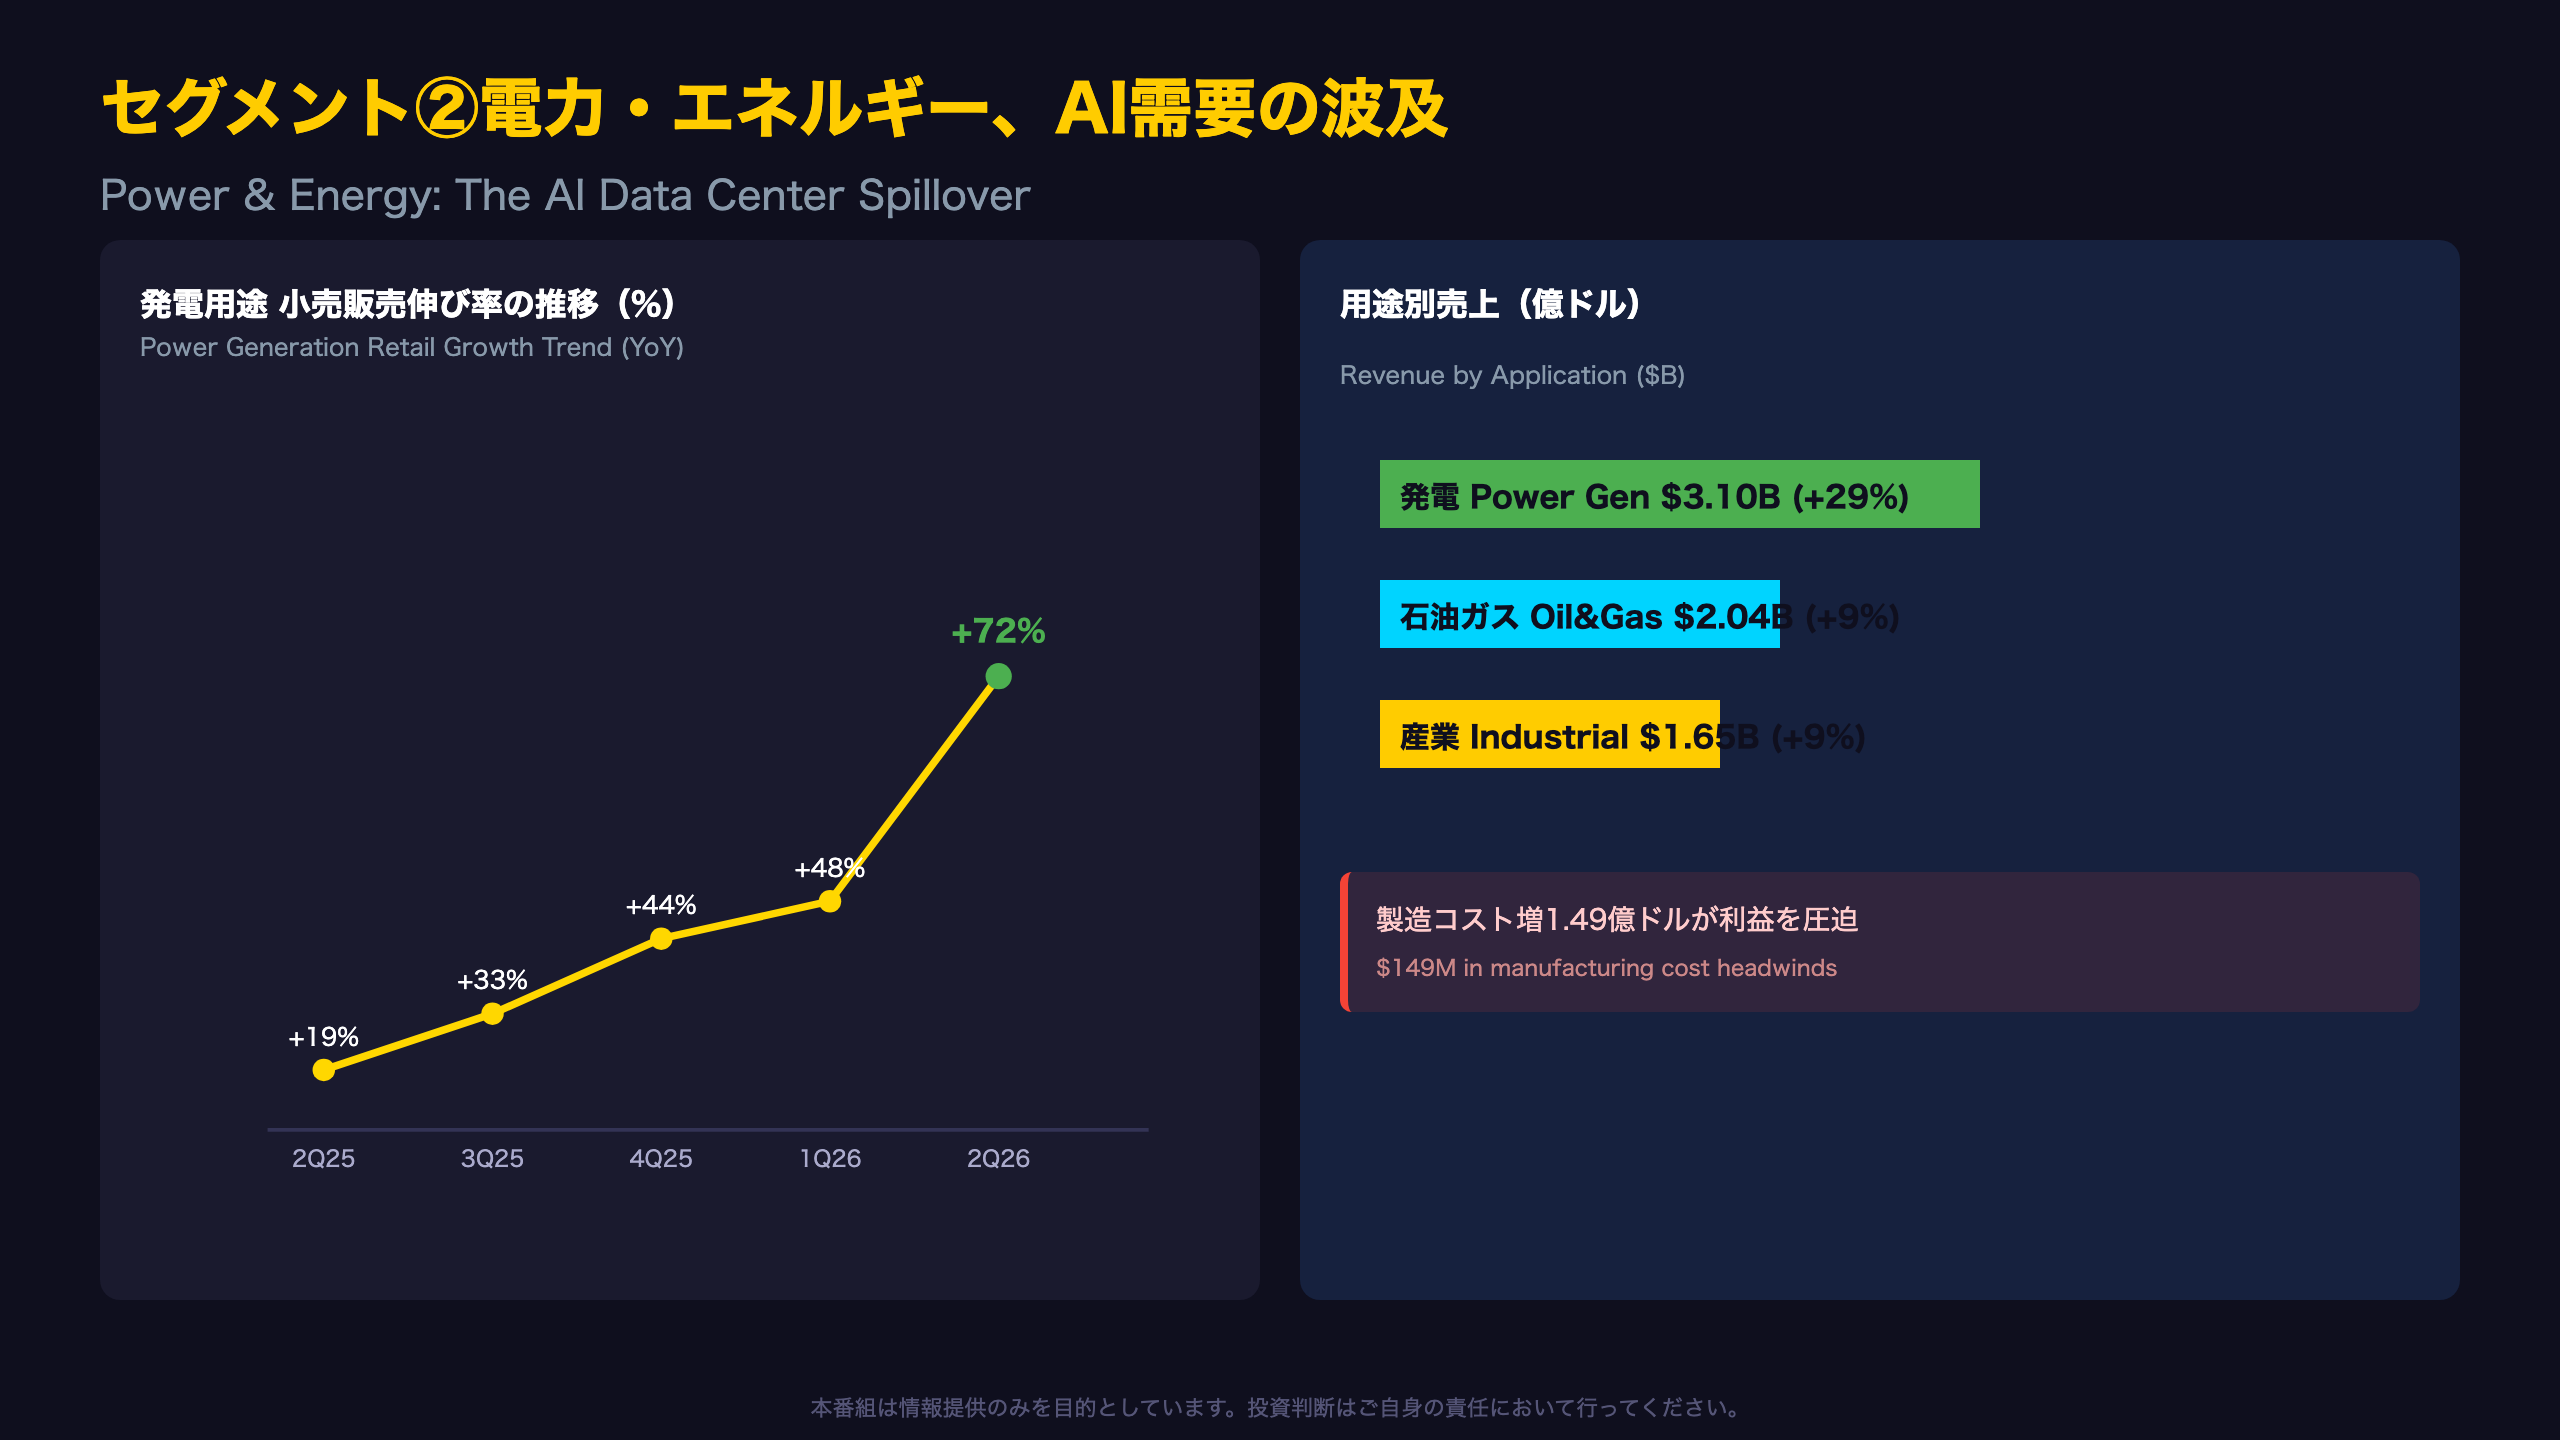
Within the segment, Power Generation revenue reached $3.098 billion, up 29% — the strongest application. The filing explains: “Sales increased in large reciprocating engines and in turbines and turbine-related services, primarily in data center applications” — a direct link to the AI-driven data center buildout sweeping the U.S. tech sector.
The Retail Data Tells an Even Bigger Story
The more striking signal comes from Caterpillar’s separate quarterly retail sales statistics (Exhibit 99.2), which track end-user demand rather than dealer shipments:
| Quarter | YoY Growth |
|---|---|
| Q2 2025 | +19% |
| Q3 2025 | +33% |
| Q4 2025 | +44% |
| Q1 2026 | +48% |
| Q2 2026 | +72% |
This is five consecutive quarters of accelerating growth, with the latest 72% figure far outpacing the segment’s reported 29% consolidated revenue growth — suggesting end-user demand (likely data center operators and hyperscalers) is outrunning dealer-level shipment data.
But Manufacturing Costs Are a Drag
Segment profit benefited from “higher sales volume of $457 million and favorable price realization of $212 million,” but this was “partially offset by unfavorable manufacturing costs of $149 million,” which “largely reflected increased period manufacturing costs” — likely tied to capacity expansion costs that haven’t yet been fully absorbed.
Bull vs. Bear
Bulls see the five-quarter acceleration in Power Generation retail demand as early evidence of a structural AI infrastructure investment cycle. Bears note the concentration risk of relying heavily on one application within one segment, and flag Oil & Gas (+9%) and Industrial (+9%) as comparatively modest by contrast.
What to Watch
Watch whether Power Generation retail growth accelerates further next quarter or shows signs of peaking — a key signal for the durability of the AI infrastructure capex cycle.
セグメント③資源産業、鉄道の急伸と反動増
Resource Industries: The Lowest-Margin Segment
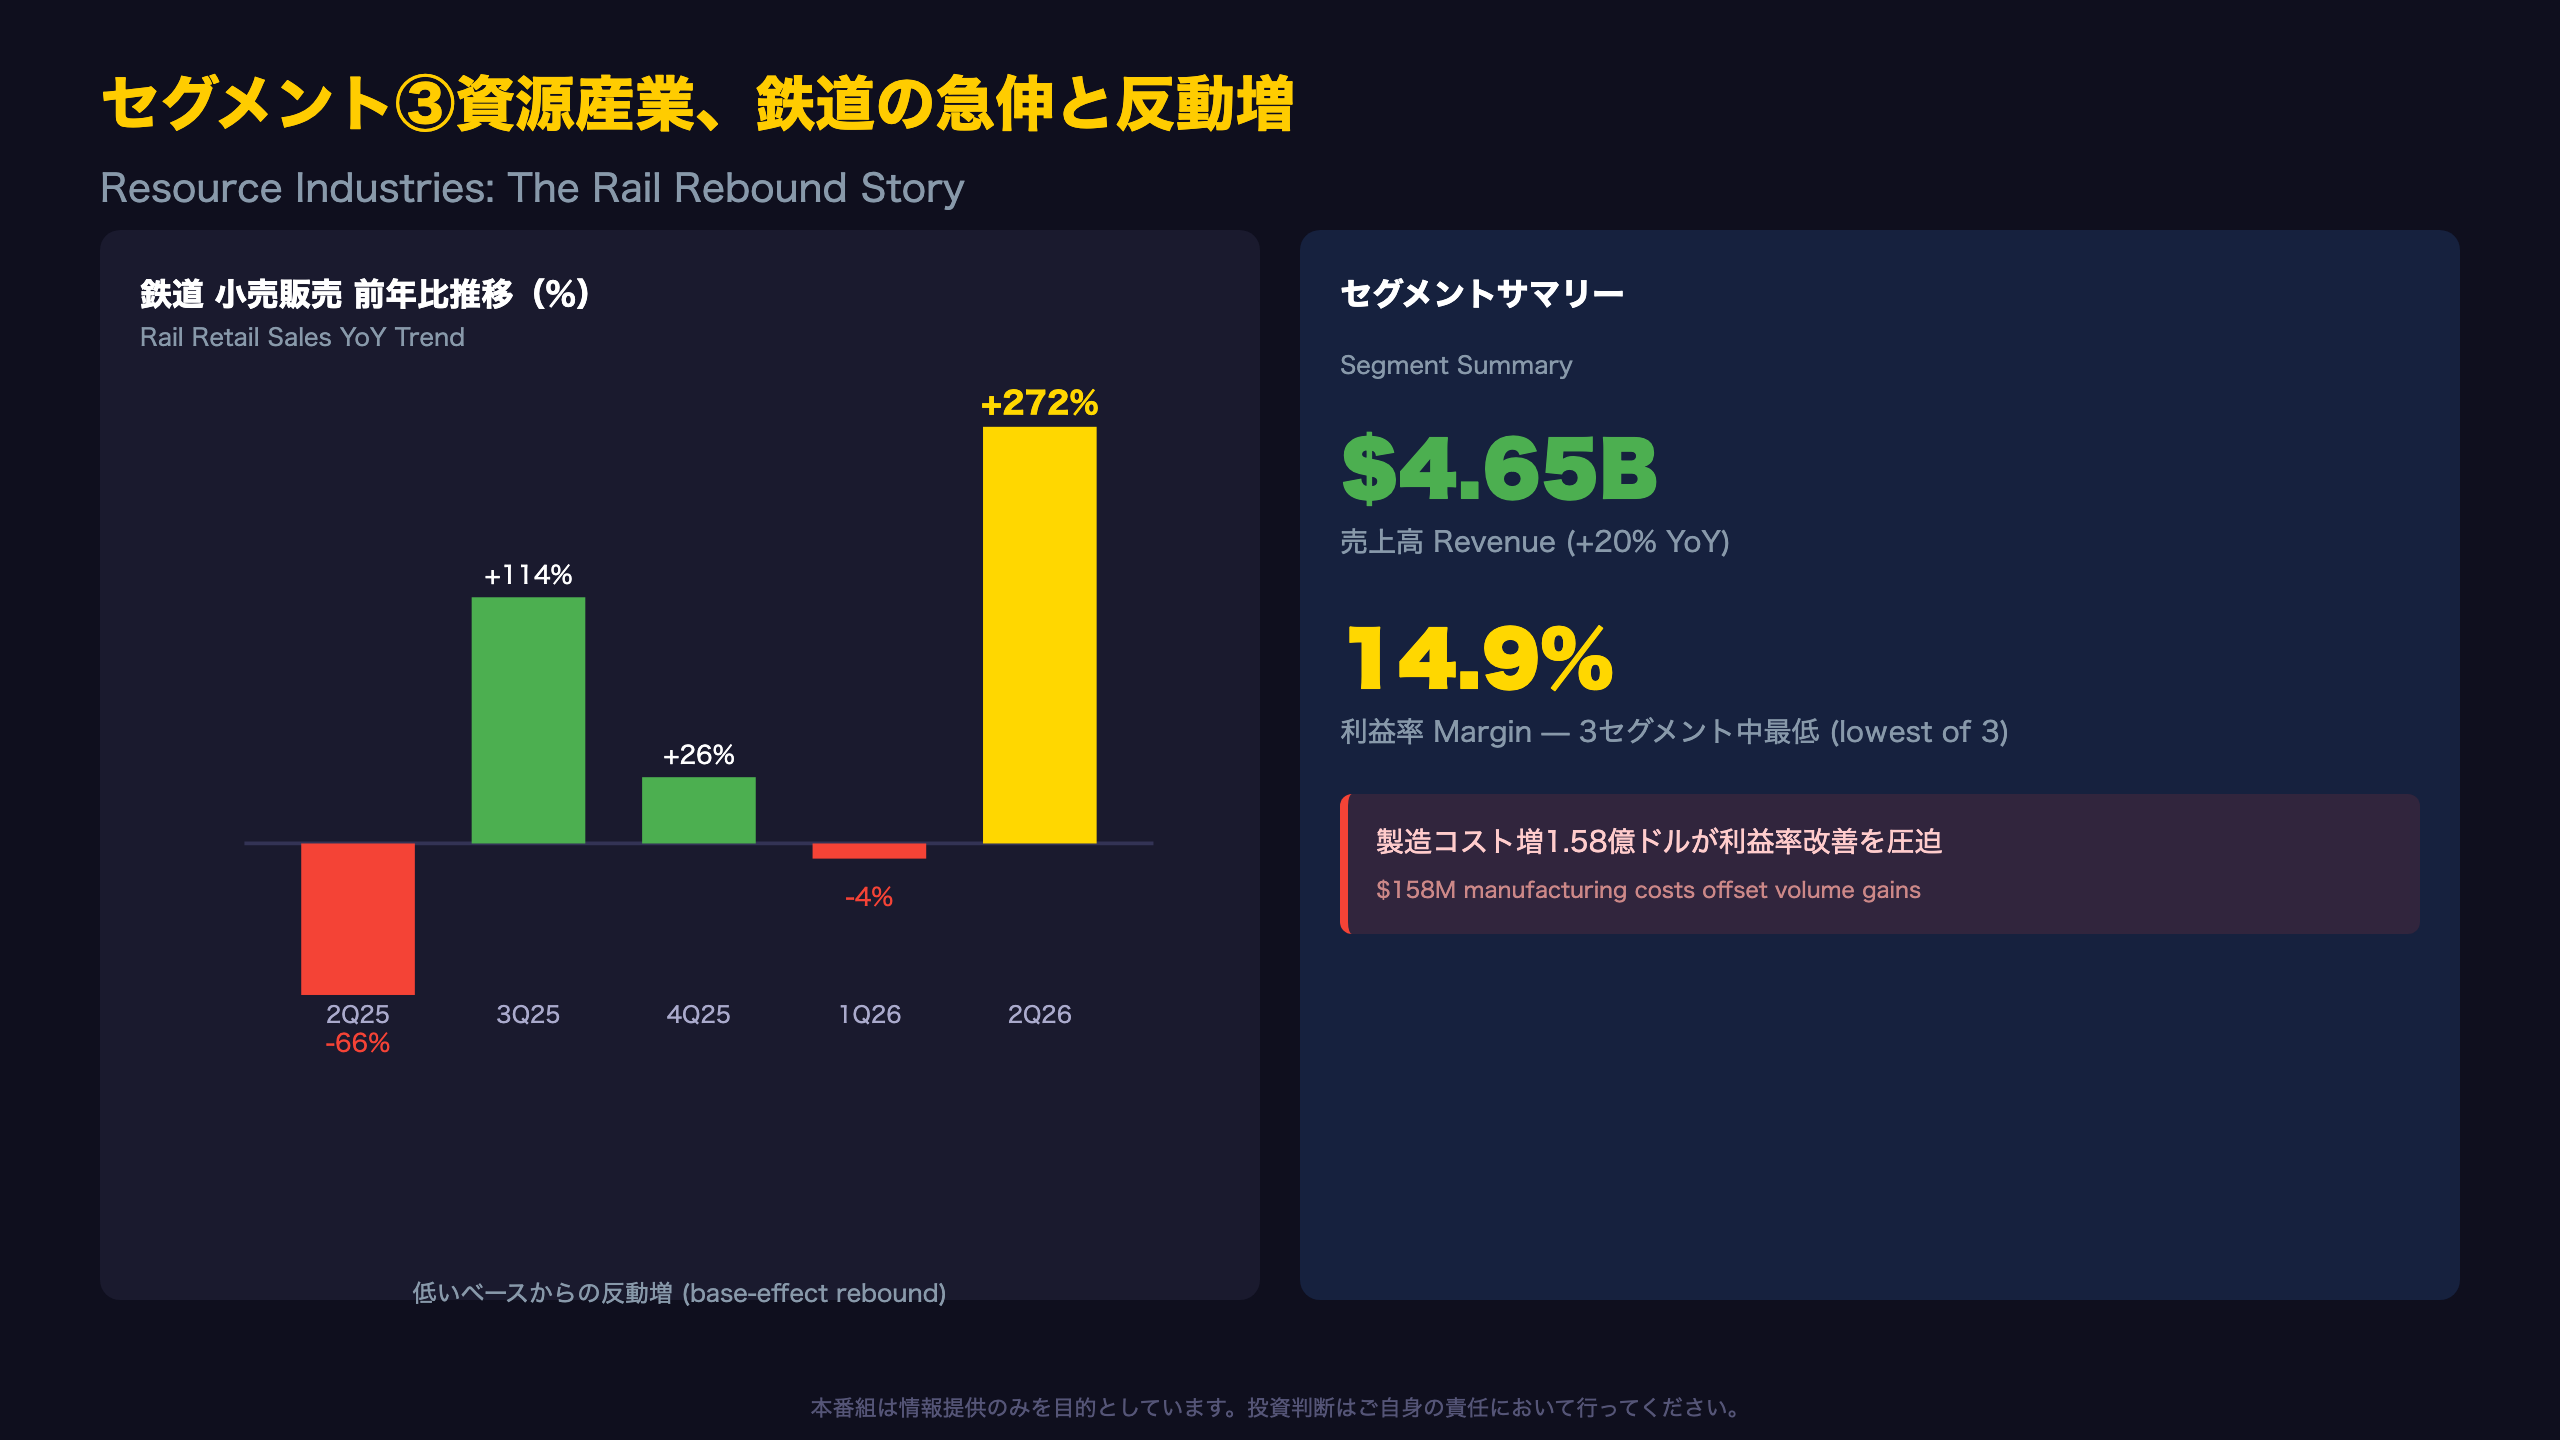
Resource Industries posted $4.648 billion in revenue (+20% YoY) and $693 million in segment profit (+23% YoY), with margin at just 14.9% (+0.4 points) — notably lower than Construction Industries’ 23.3% and Power & Energy’s 24.6%.
Manufacturing Costs Blunt the Margin Gain
The filing states profit benefited from “the profit impact of higher sales volume of $269 million, partially offset by unfavorable manufacturing costs of $158 million” — meaning over half of the volume-driven profit boost was eroded by rising production costs, likely reflecting the capital-intensive nature of large mining equipment manufacturing.
Making Sense of the “272%” Rail Surge
The most eye-catching figure in this release is the 272% year-over-year jump in Rail retail sales, reported separately in Exhibit 99.2. Context is essential here:
| Quarter | Rail Retail YoY |
|---|---|
| Q2 2025 | -66% |
| Q3 2025 | +114% |
| Q4 2025 | +26% |
| Q1 2026 | -4% |
| Q2 2026 | +272% |
Because Q2 2025 was an unusually weak base (down 66%), the Q2 2026 figure largely reflects a rebound rather than a durable acceleration. Notably, the segment’s own reported Rail sales (a different, direct-sales-based measure) grew a more modest 15% to $883 million — the gap reflects differing methodologies between wholesale segment reporting and end-user retail statistics that include international locomotive deliveries.
Mining Remains Steady
By contrast, Mining, Heavy Construction and Quarry & Aggregates grew 22% in the segment data ($3.685 billion) and 15% in retail statistics — a more consistent growth pattern attributed to “higher sales of equipment to end users.”
Bull vs. Bear
Bulls will note 20% overall segment growth reflects genuine, broadening mining demand. Bears will caution that the segment’s structurally lower margin and rising manufacturing costs remain a real headwind, and that the Rail division’s 272% figure is a base-effect rebound, not a sustainable growth signal.
What to Watch
Watch whether Rail growth normalizes next quarter and whether manufacturing cost pressures ease across the segment.
在庫積み増しとキャッシュ配分
Balancing Strong Demand Against Inventory Build
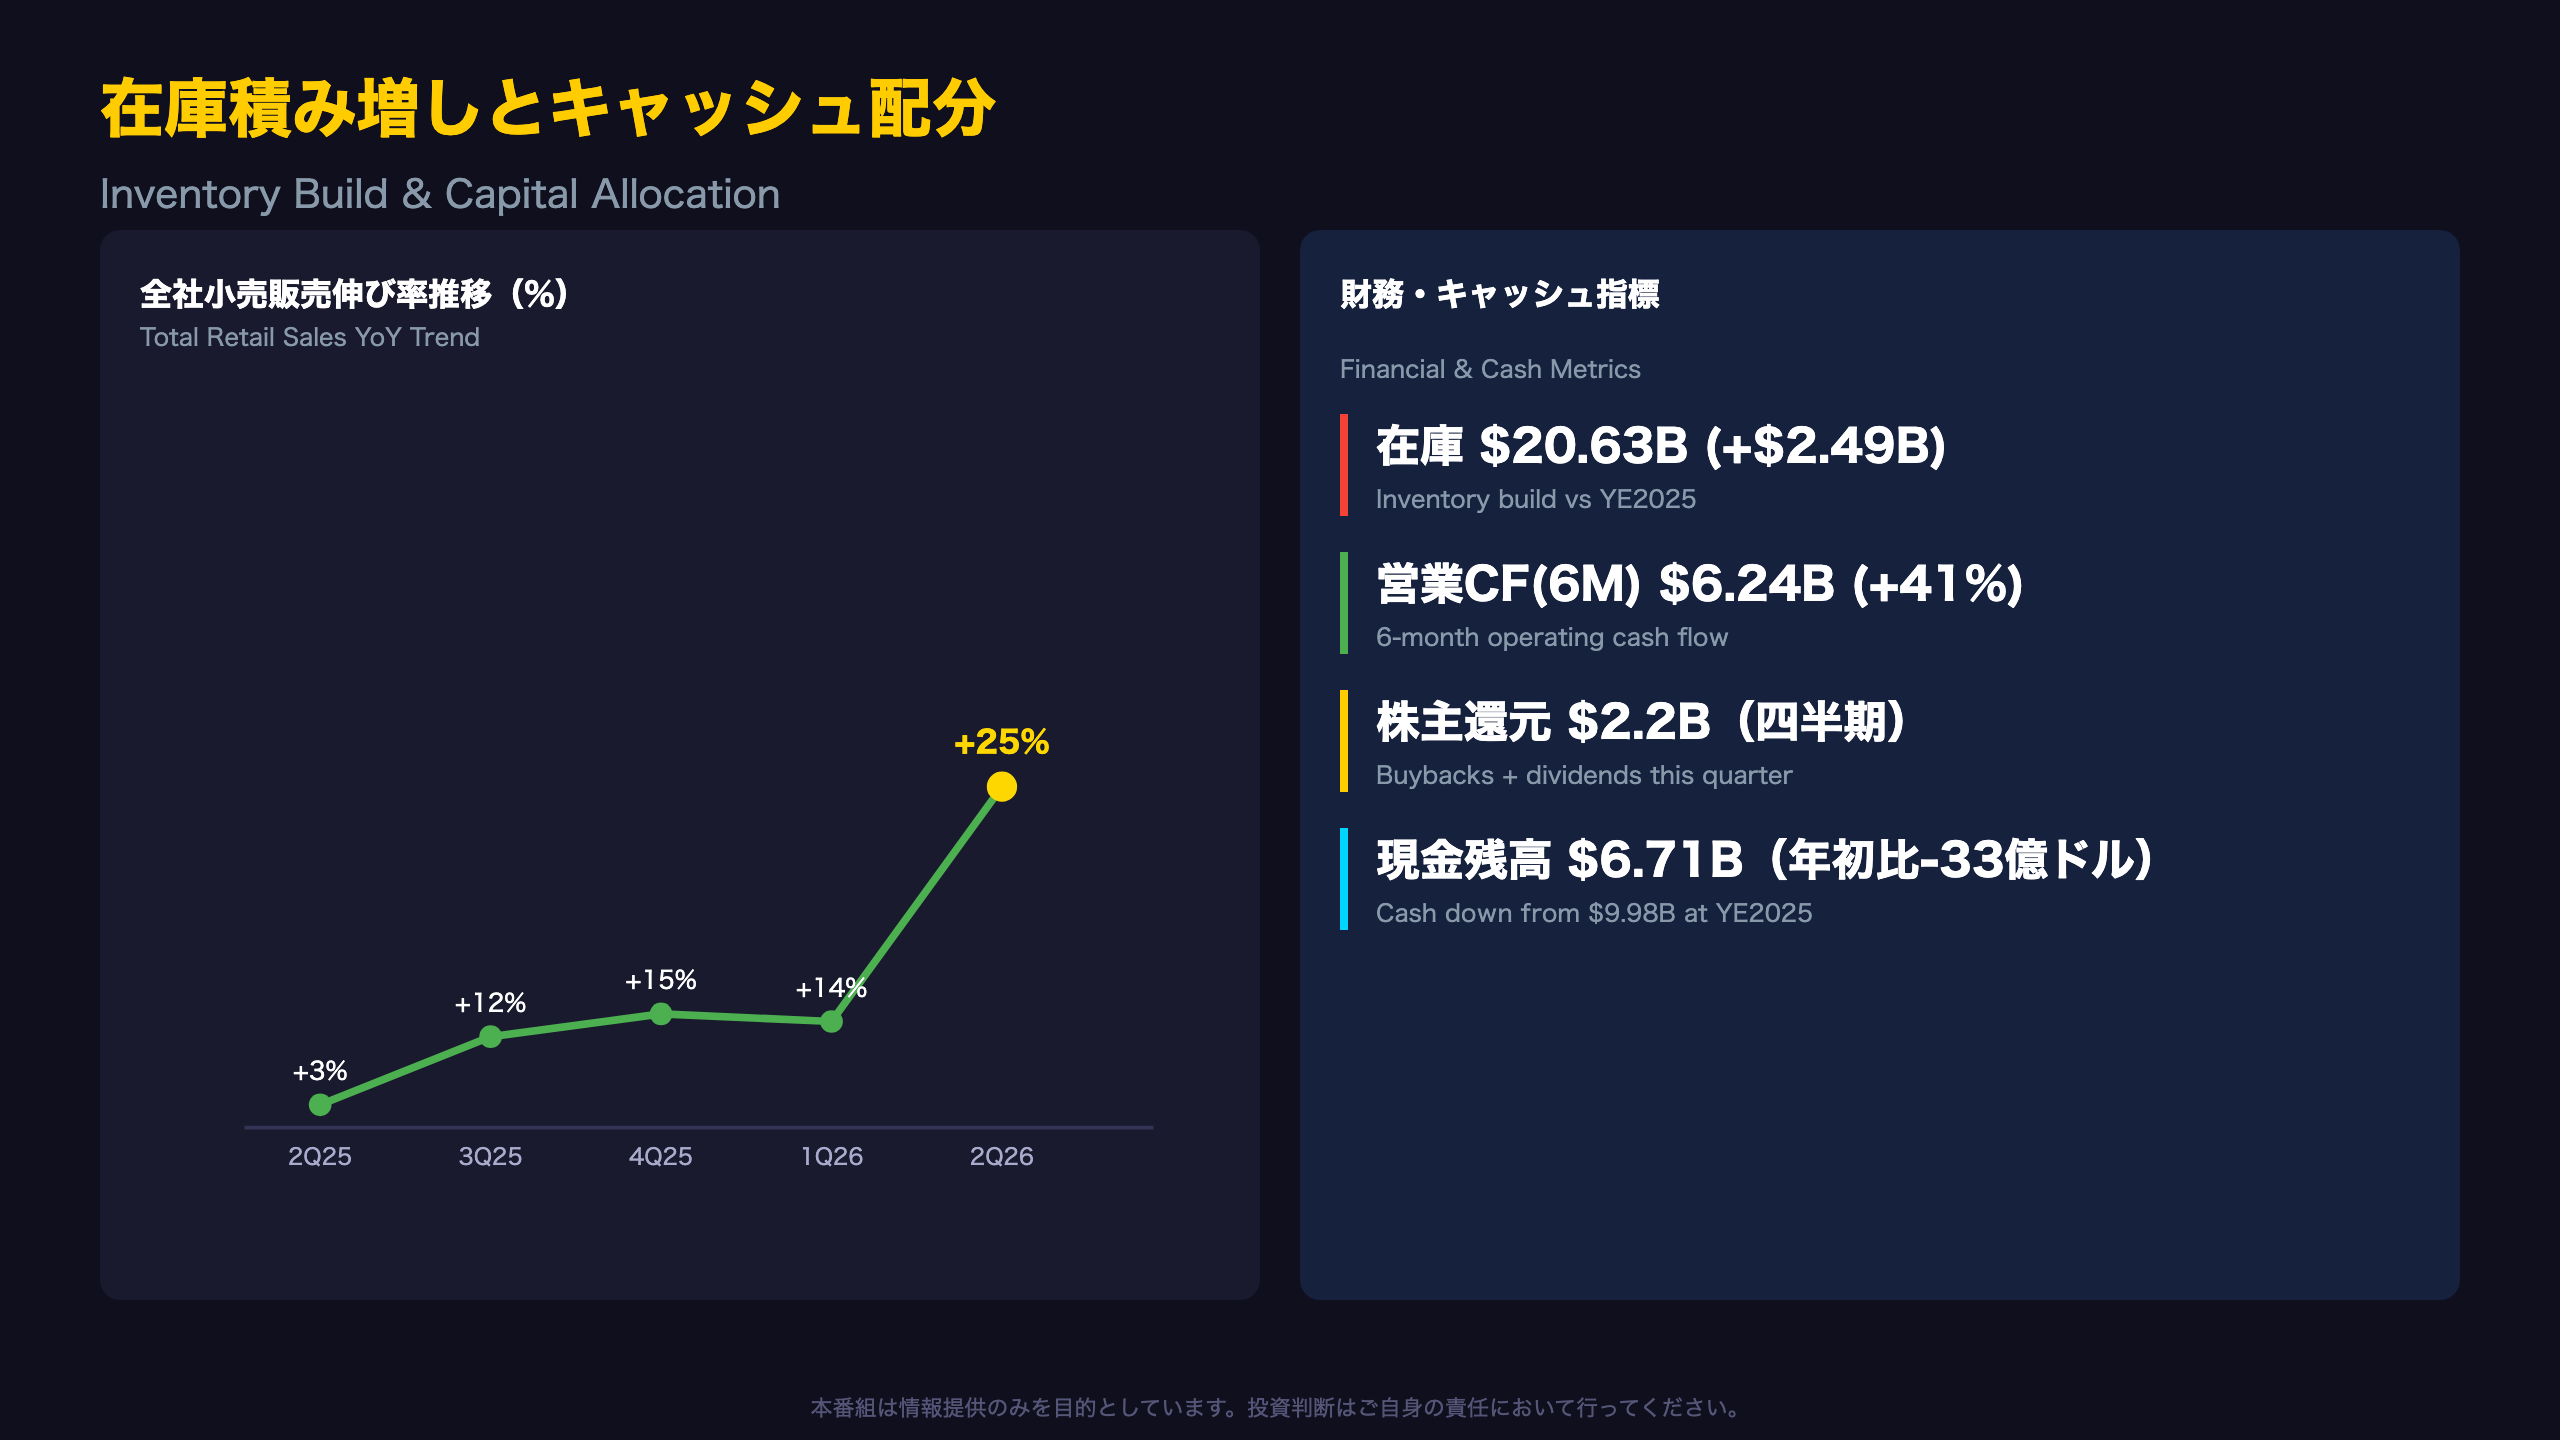
Caterpillar’s separate quarterly retail sales statistics (Exhibit 99.2) show a clear acceleration in total combined retail sales:
| Quarter | YoY Growth |
|---|---|
| Q2 2025 | +3% |
| Q3 2025 | +12% |
| Q4 2025 | +15% |
| Q1 2026 | +14% |
| Q2 2026 | +25% |
This five-quarter acceleration, capped by a striking 25% jump in Q2 2026, provides solid evidence of underlying demand strength — a genuinely positive signal.
The Two Sides of Inventory Growth
However, the balance sheet shows inventories climbing to $20.627 billion from $18.135 billion at year-end 2025 — a $2.492 billion, or 13.7%, increase. The cash flow statement reflects this as a $2.553 billion drag on operating cash flow.
This inventory build could represent prudent preparation for continued strong demand. Alternatively, it could signal that production and supply chains are struggling to keep pace with orders, or that the company has over-anticipated future demand. The filing does not provide enough information to determine which interpretation is correct — investors should track inventory turnover trends in coming quarters.
Capital Returns and Cash Position
Caterpillar returned $2.2 billion to shareholders in the quarter — $1.5 billion in buybacks and $0.7 billion in dividends. Six-month share repurchases totaled $6.522 billion, up roughly 45% from $4.488 billion a year earlier. As a result, cash on hand fell to $6.713 billion from $9.980 billion at year-end 2025, a decline of roughly $3.3 billion.
Bull vs. Bear
Aggressive capital returns can be viewed favorably from a capital-efficiency standpoint, but the sharp cash decline warrants some caution regarding financial flexibility. That said, six-month operating cash flow of $6.241 billion — up 41% year-over-year — suggests shareholder returns remain well-supported by core business cash generation, not by drawing down the balance sheet unsustainably.
What to Watch
Monitor whether inventory levels normalize next quarter and whether the drag on operating cash flow from inventory growth diminishes.
CEO発言とインプリケーション
Reading the CEO’s Comments and Market Implications
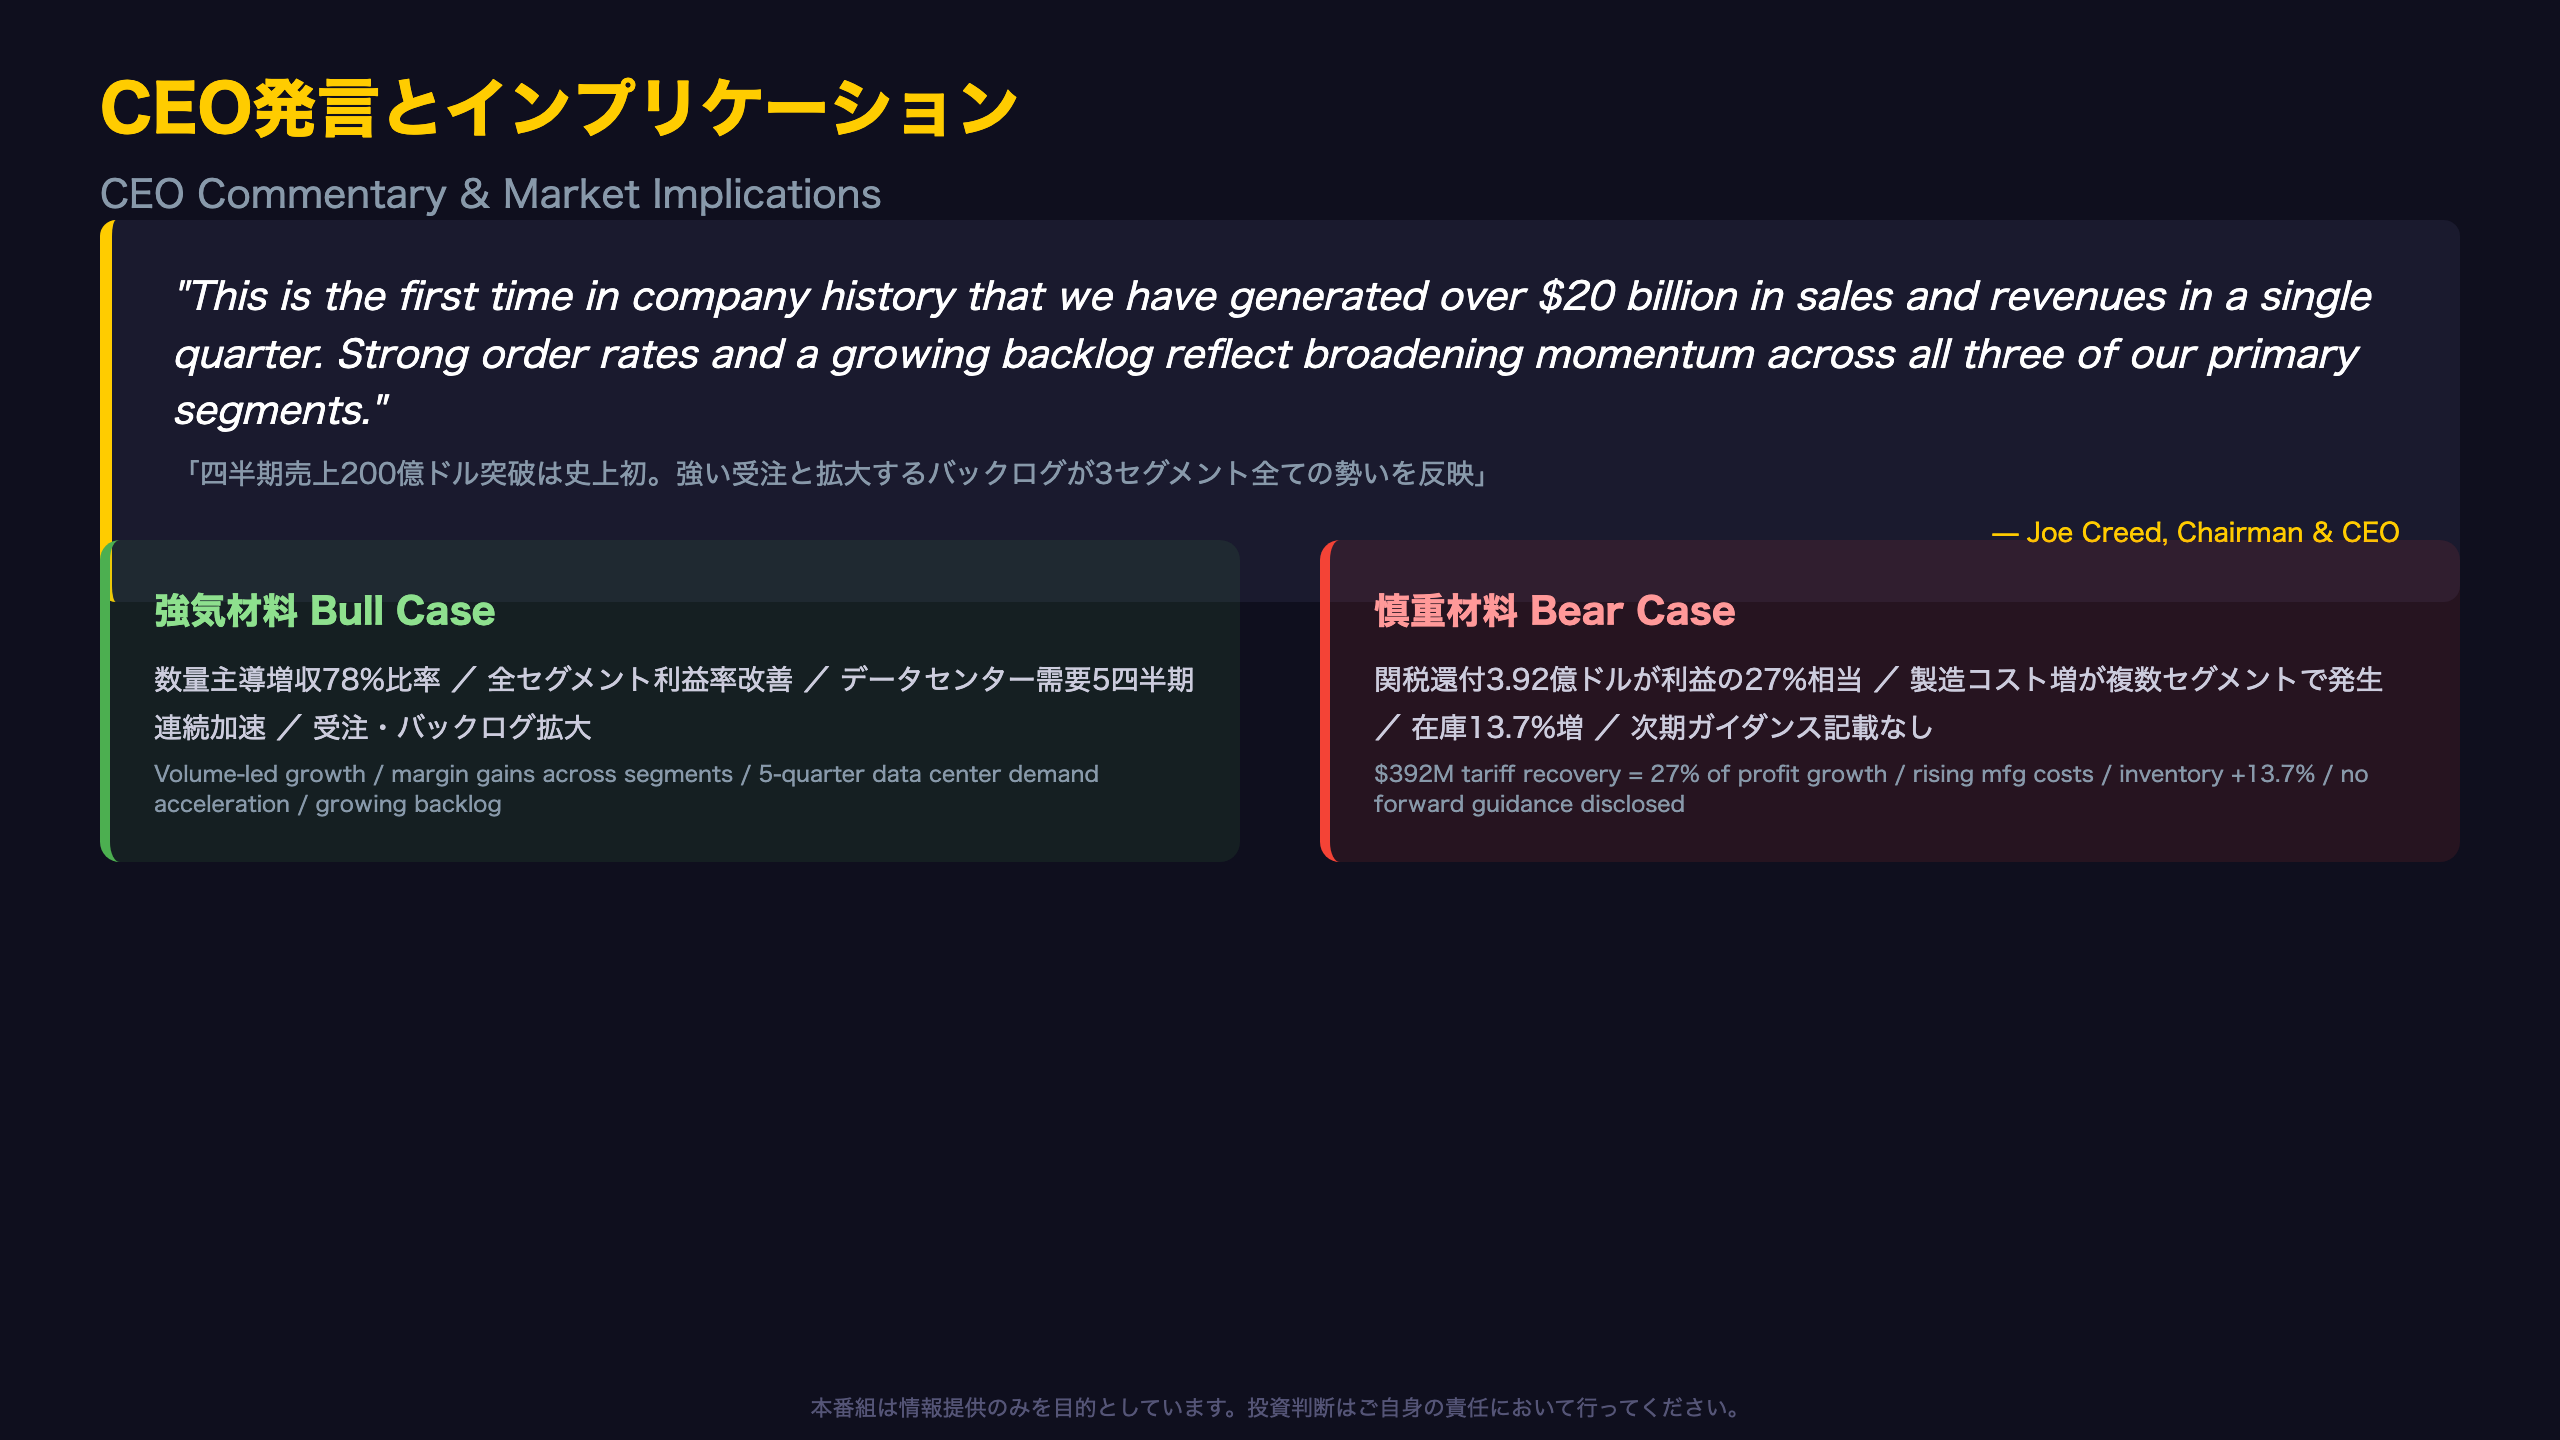
CEO Joe Creed’s full statement reads: “This is the first time in company history that we have generated over $20 billion in sales and revenues in a single quarter… Strong order rates and a growing backlog reflect broadening momentum across all three of our primary segments.”
References to a “growing backlog” and “strong order rates” are forward-looking positive signals suggesting demand durability beyond just this quarter. However, no specific backlog dollar figures or growth rates are disclosed in this filing — the comment remains qualitative.
Chain of Evidence for Market Implications
Revenue of $20.543B (+24% YoY), with volume driving 78% of the increase → suggests genuine demand-led growth → markets generally reward demand-driven (versus price-driven) revenue growth with higher valuation multiples, though this filing alone cannot confirm the actual stock price reaction, especially absent disclosed consensus estimates.
Adjusted EPS of $8.17 (+73% YoY), with roughly 27% of profit growth tied to a one-time tariff recovery → markets often discount earnings growth that includes non-recurring items as “lower quality” → but without consensus estimates disclosed in this filing, the magnitude of any market reaction cannot be predicted here.
Inventory up 13.7%, pressuring operating cash flow → inventory builds can reflect management confidence in future demand, but also carry supply-demand mismatch risk → inventory turnover trends next quarter will help clarify which interpretation applies.
Balancing the Bull and Bear Case
Bullish factors include: (1) volume-driven revenue growth, (2) margin expansion across all three segments, (3) five consecutive quarters of accelerating data center power demand, and (4) CEO commentary on expanding order rates and backlog. Cautionary factors include: (1) meaningful reliance on a one-time tariff recovery, (2) rising manufacturing costs in Resource Industries and Power & Energy, (3) unresolved interpretation of the inventory build, and (4) the absence of forward guidance in this release, leaving near-term visibility limited.
Bridge to the Next Quarter
Three things to watch in Q3 2026: (1) whether the tariff recovery persists, (2) whether inventory levels normalize, and (3) whether Power Generation retail sales growth continues accelerating or shows signs of peaking. Management commentary during the Q&A portion of the Aug. 4, 2026, 7:30 a.m. Central Time earnings call will be an important near-term data point.
Disclaimer: This article is for informational purposes only. All investment decisions are made solely at your own risk.