📺 Watch the Full Video Analysis
This article was automatically generated by the NFC Market Live AI analysis system. (Updated: 2026-08-05 05:14 JST)
SpaceX (Nasdaq: SPCX) reported Q2 2026 results.
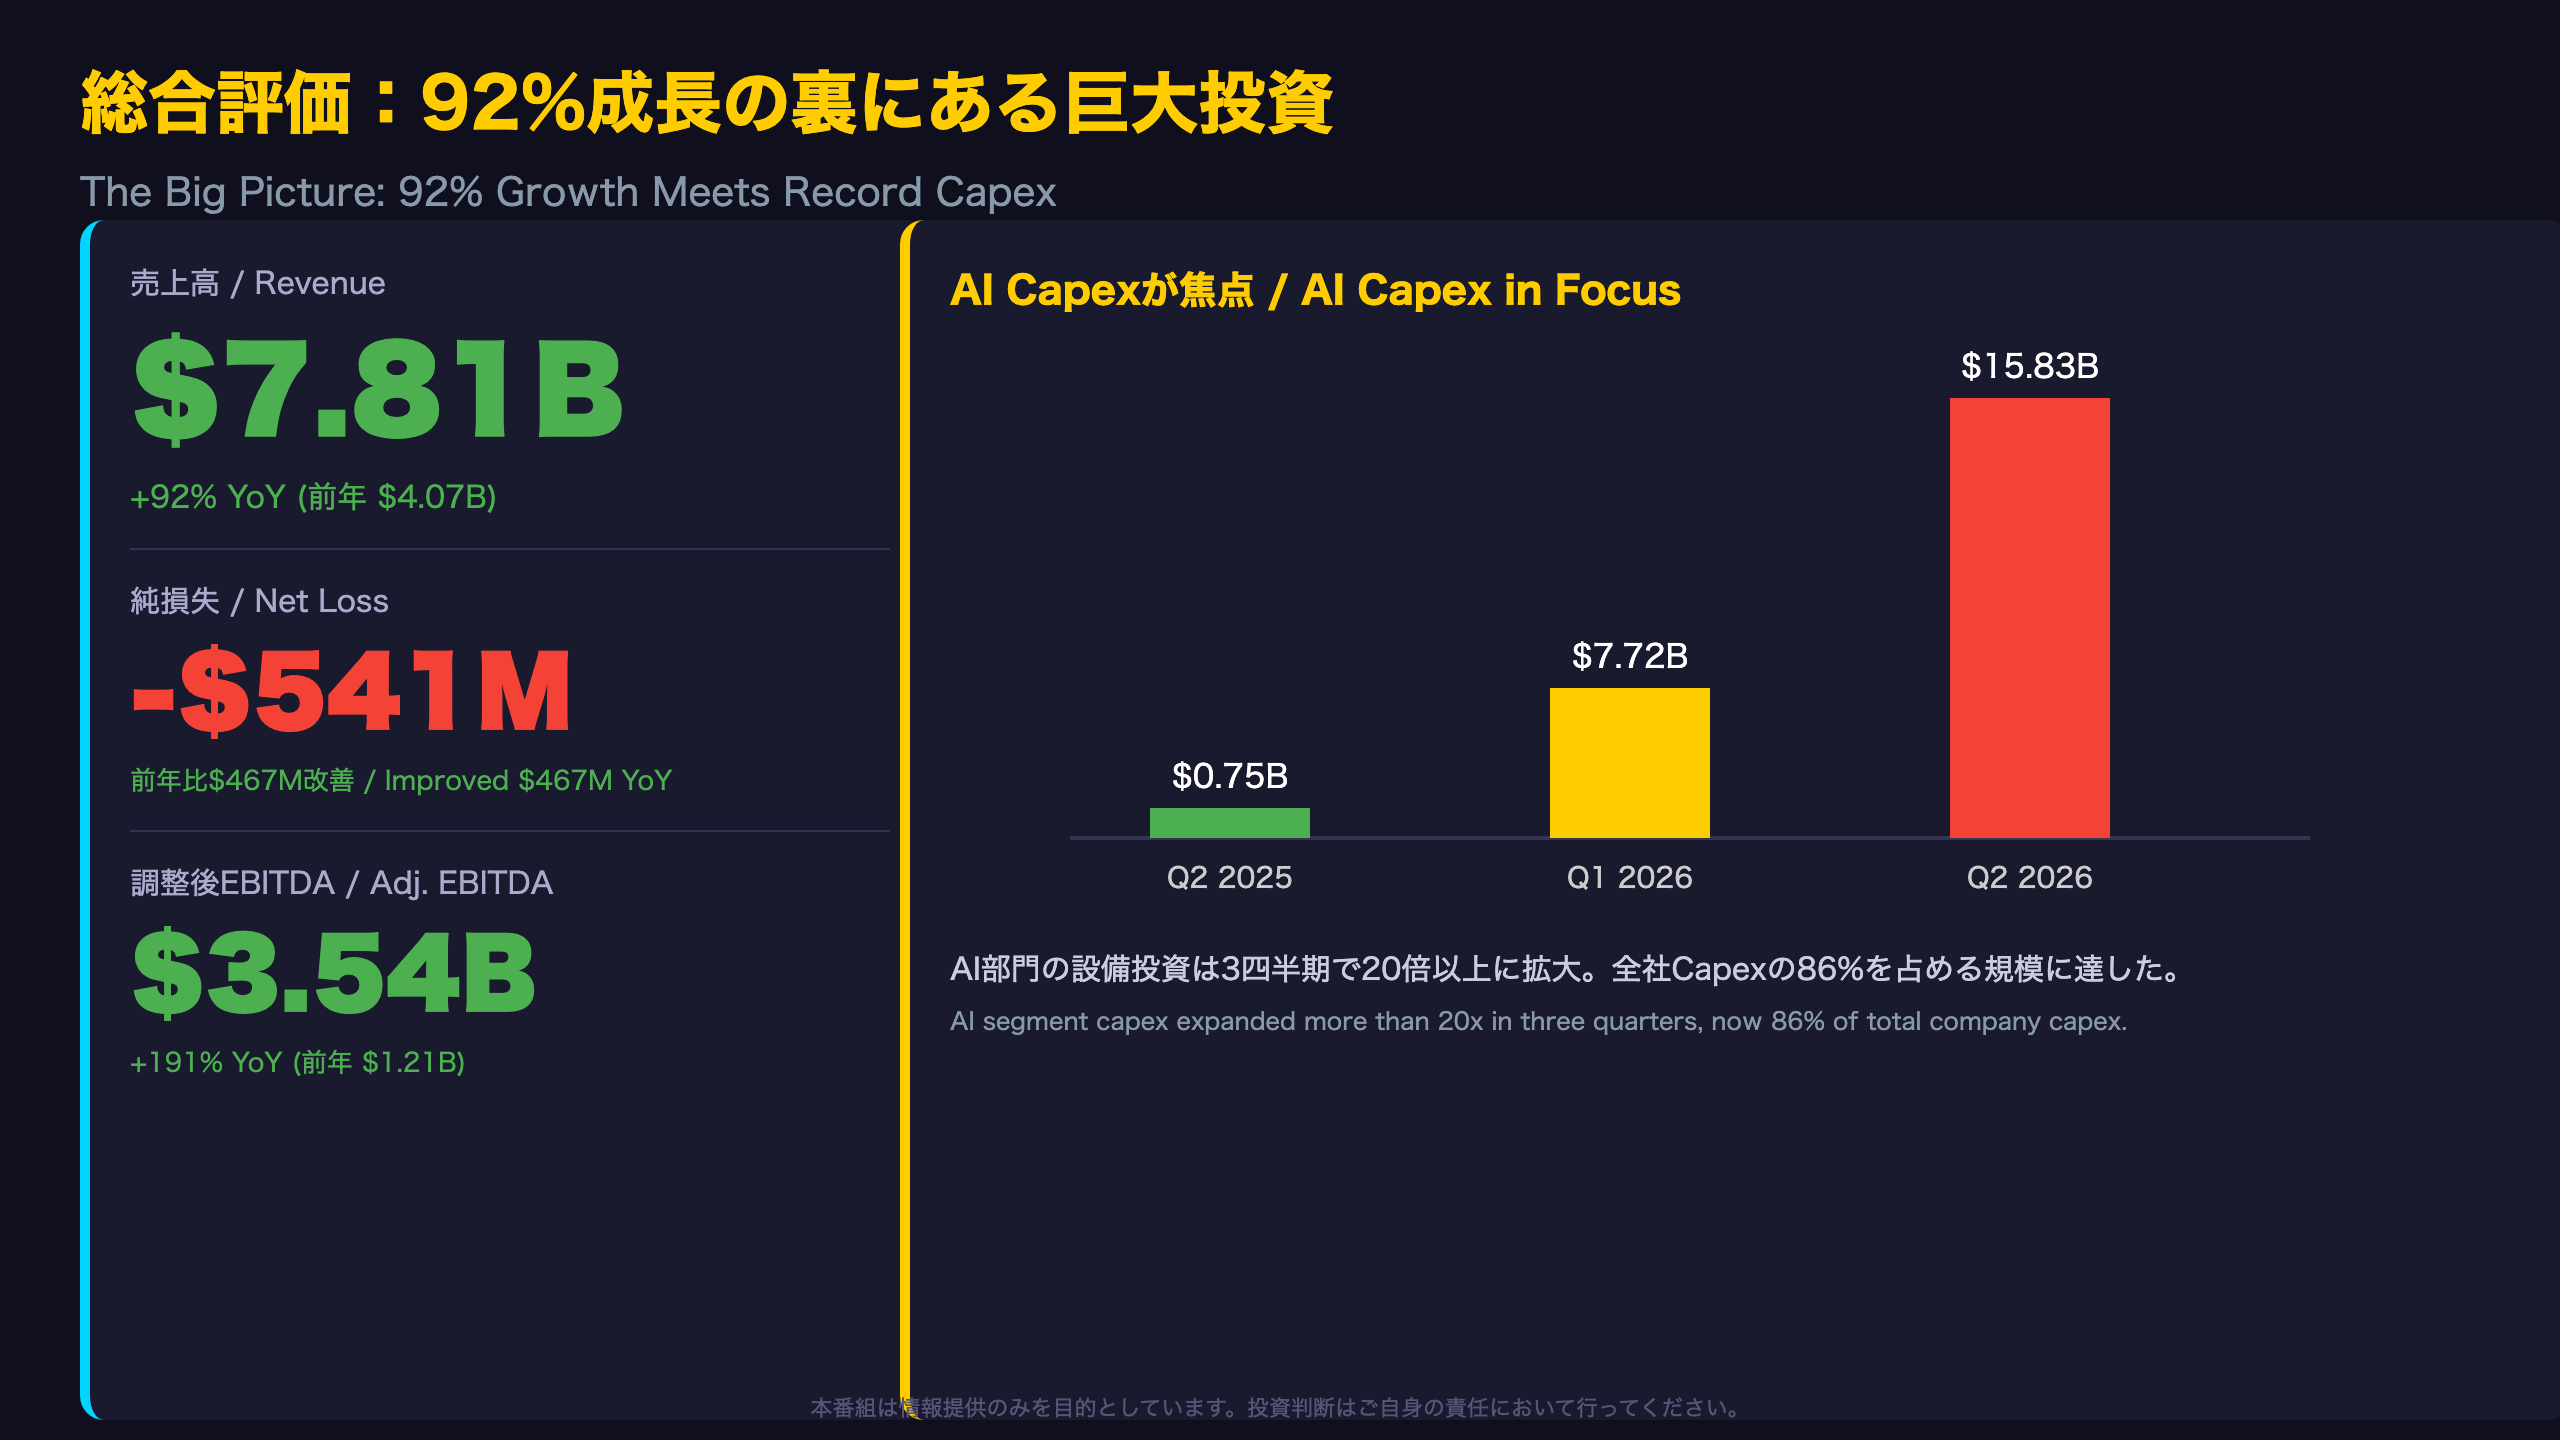
📊 Revenue hit $7.814B, up 92% YoY. Adjusted EBITDA surged 191% to $3.538B.
💡 The AI segment turned EBITDA-positive after securing $14.1B in Cloud Services Agreements, even as capex exploded to $15.828B (from just $749M a year ago).
📈 Starlink subscribers doubled to 12.0 million, making Connectivity the company’s profit engine.
⚠️ Following its IPO and bond issuance, SpaceX now holds ~$100B in cash — but the sustainability of its massive capex remains the key question ahead.
総合評価:92%成長の裏にある巨大投資 / The Big Picture: 92% Growth Meets Record Capex
Q2 2026 Overview: Growth Meets Capital Intensity
Space Exploration Technologies Corp. (Nasdaq: SPCX) — better known as SpaceX — reported second quarter 2026 revenue of $7.814 billion, up 92% year-over-year from $4.071 billion, and up 66% sequentially from Q1’s $4.694 billion. This marks a notable acceleration versus the six-month cumulative growth rate of 54% ($12.508 billion vs. $8.138 billion), suggesting momentum built through the quarter rather than a one-time jump.
Understanding the Net Loss Bridge
The reported net loss of $541 million represents a $467 million improvement from the prior-year quarter’s $1.008 billion loss. Loss from operations fell sharply to $143 million (from $970 million a year ago), but below the operating line, interest expense of $629 million (including $327 million to related parties) weighed on the bottom line. Six-month “other income (expense), net” showed a $1.962 billion loss, a factor investors should isolate from core operating performance.
Context for U.S. Investors: A Newly Public “Hard Tech” Company
Unlike established Nasdaq large caps, SPCX only began trading on June 12, 2026, following an IPO that raised approximately $85.7 billion in net proceeds from 638,888,888 Class A shares. Five days later, the company closed a $25 billion investment-grade bond offering across five tranches (2031–2056 maturities), with a weighted average coupon of 5.855%. Investors comparing SPCX to hyperscalers like Amazon or Microsoft should note its capital structure is still transitioning from a privately-financed model (heavy related-party debt) toward a public-market capital stack.
Market Implications
The near-simultaneous IPO, bond issuance, and AI capex acceleration ($15.8 billion in Q2 alone) suggest management is front-loading investment while capital costs are favorable. For equity investors, the key monitorable is whether Adjusted EBITDA growth (+191% YoY) can outpace depreciation growth from this capex wave — a dynamic directly comparable to the capex/depreciation debate dominating US mega-cap AI infrastructure investors.
四半期トレンド:加速する成長 / Quarterly Trend: Accelerating Growth
Reading the Quarterly Trend
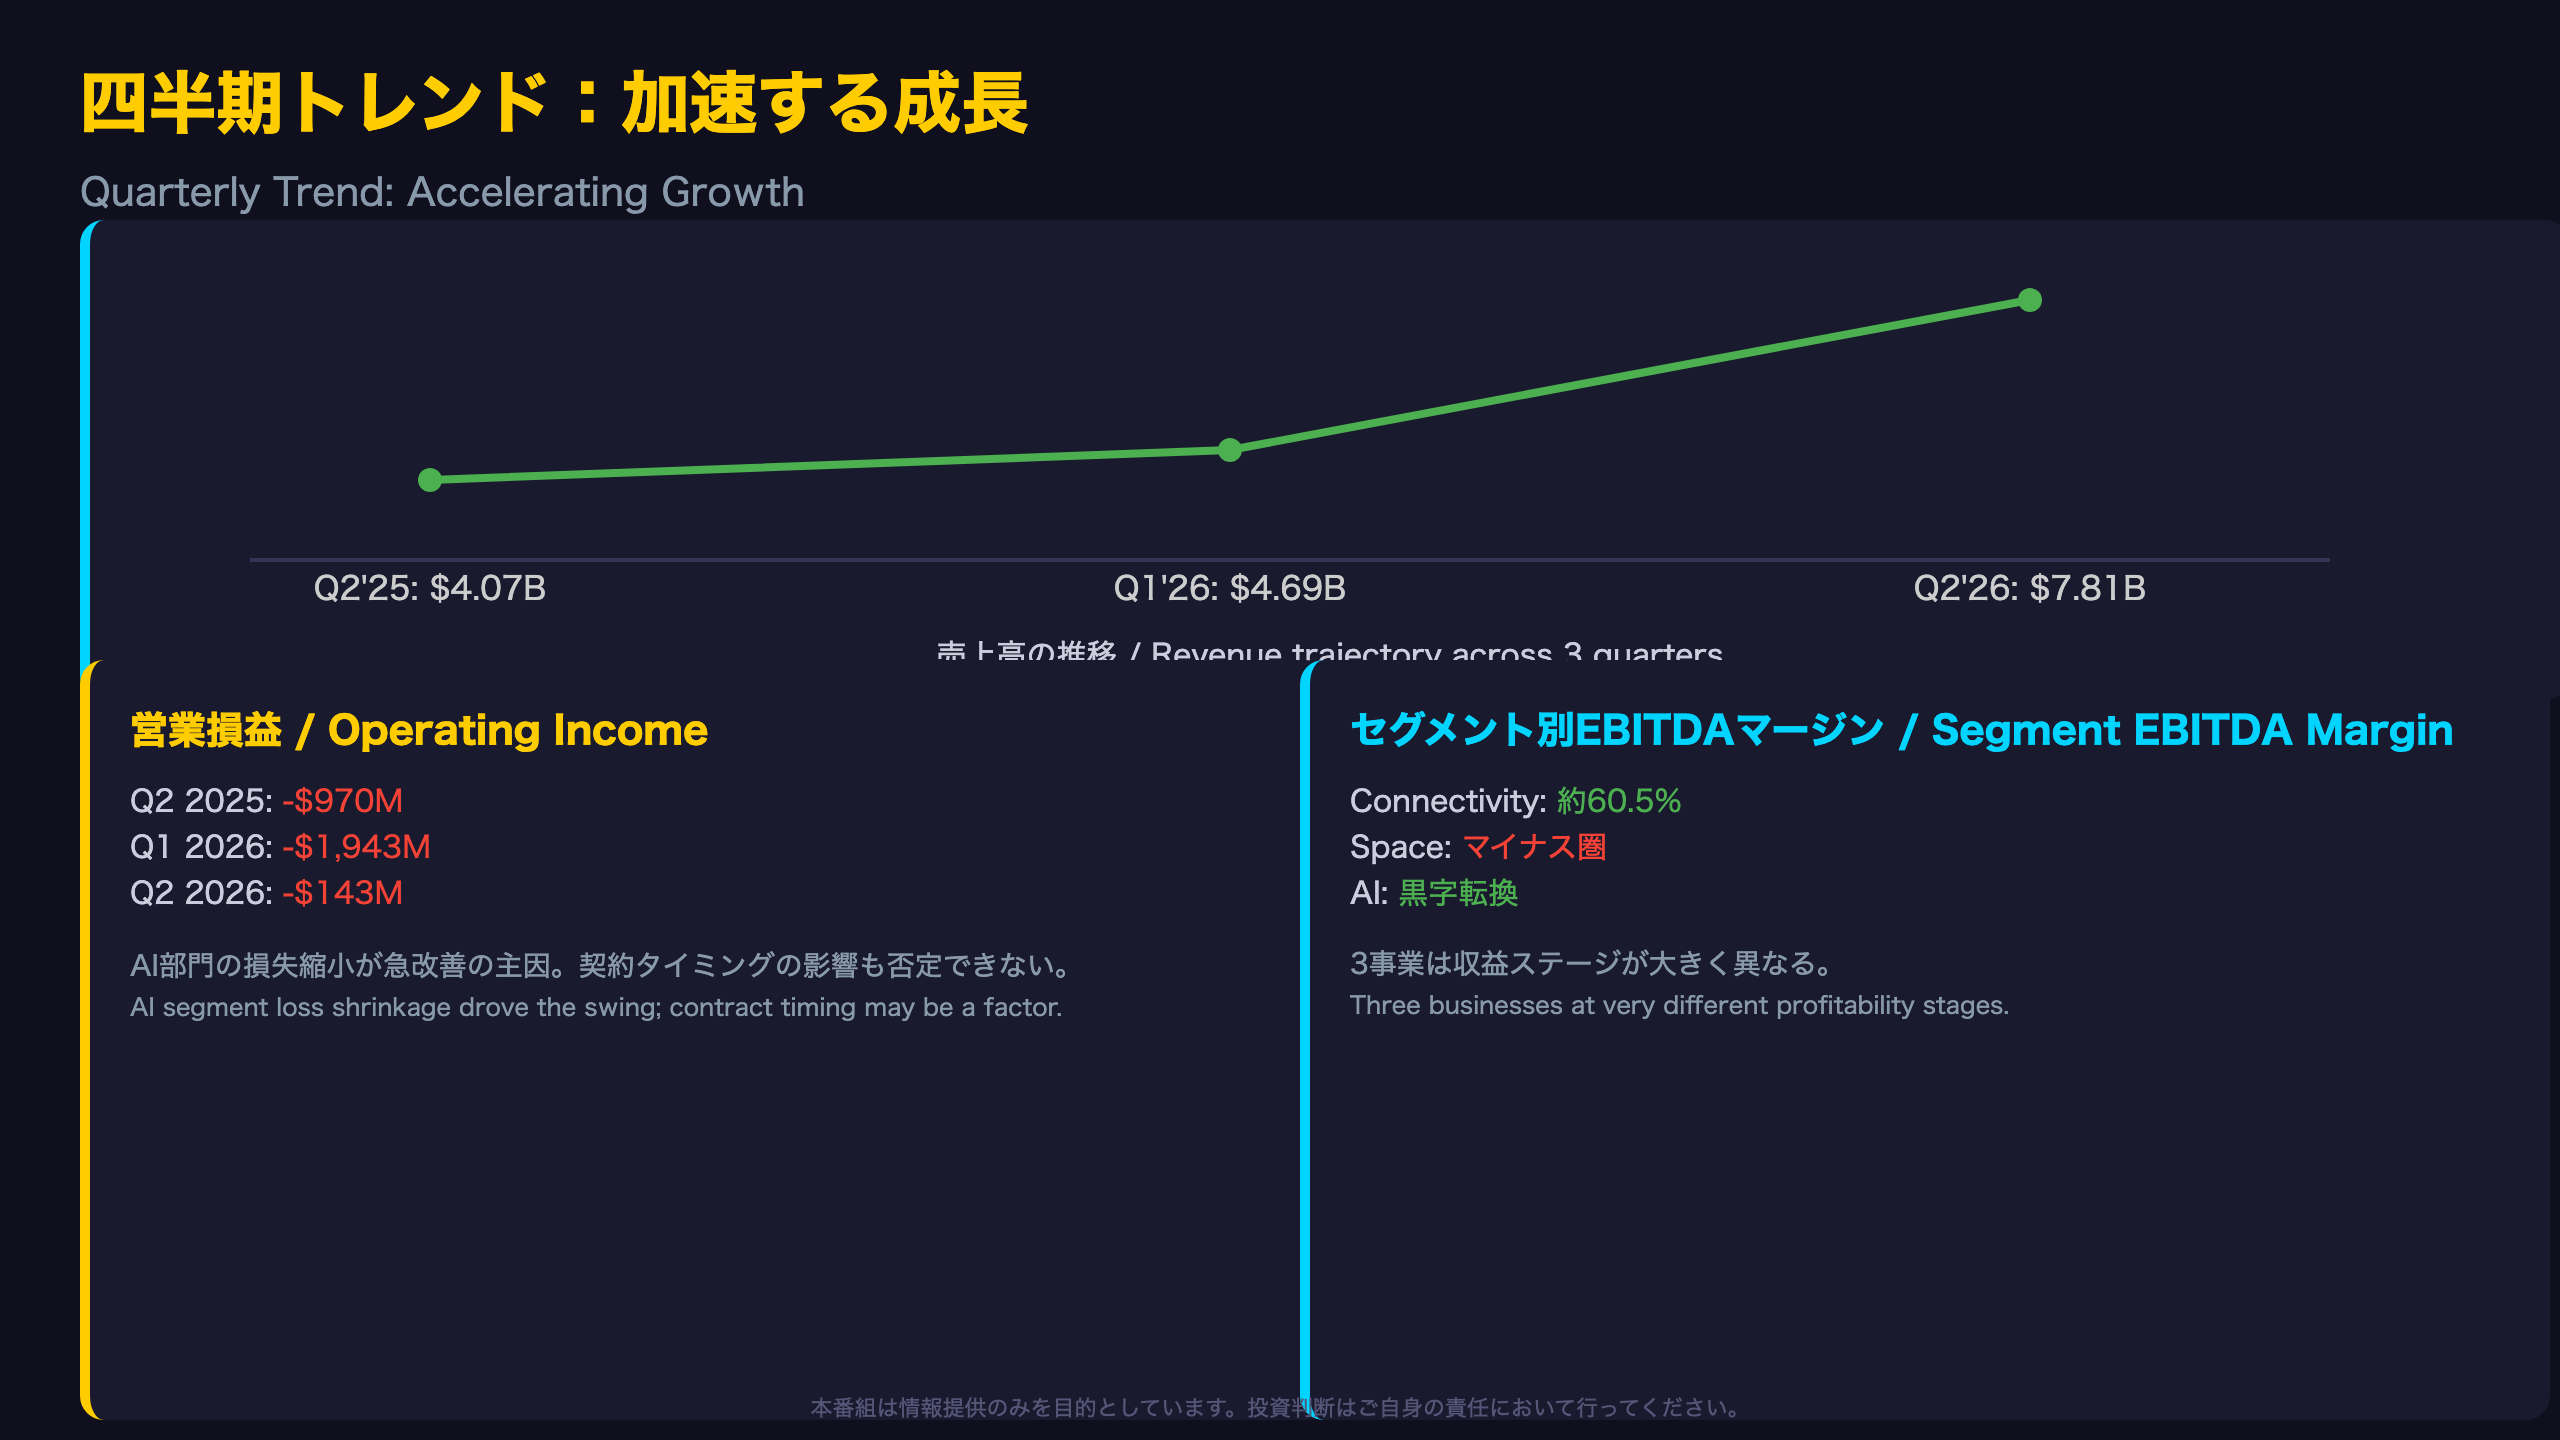
Placing three quarters side by side reveals a shift in growth quality, not just growth quantity.
| Metric | Q2 2025 | Q1 2026 | Q2 2026 |
|---|---|---|---|
| Revenue | $4.071B | $4.694B | $7.814B |
| Operating Income (Loss) | -$0.970B | -$1.943B | -$0.143B |
| Adjusted EBITDA | $1.214B | $1.127B | $3.538B |
Operating losses actually widened in Q1 2026 versus the year-ago quarter before sharply narrowing in Q2. The primary driver: AI segment operating losses nearly halved, from $2.469 billion in Q1 to $1.257 billion in Q2.
A Caveat on Sustainability
Whether this improvement is structural or partly timing-driven cannot be determined from a single quarter’s data. The AI segment recognized $1.6 billion of incremental revenue in Q2 specifically tied to new Cloud Services Agreements — a reminder that large contract recognition timing can meaningfully swing quarterly results. Investors should watch whether similar revenue recognition levels persist in Q3.
Segment Profitability Divergence
Connectivity’s Adjusted EBITDA margin (roughly 60.5% — $2.597B on $4.291B revenue) starkly contrasts with Space, which remains EBITDA-negative (-$205M on $962M revenue). This divergence underscores that SpaceX today is effectively three businesses at very different maturity stages, a nuance U.S. investors accustomed to single-segment companies should keep in mind when valuing SPCX.
宇宙セグメント:赤字拡大でもStarship投資は加速 / Space Segment: Losses Widen as Starship Bets Accelerate
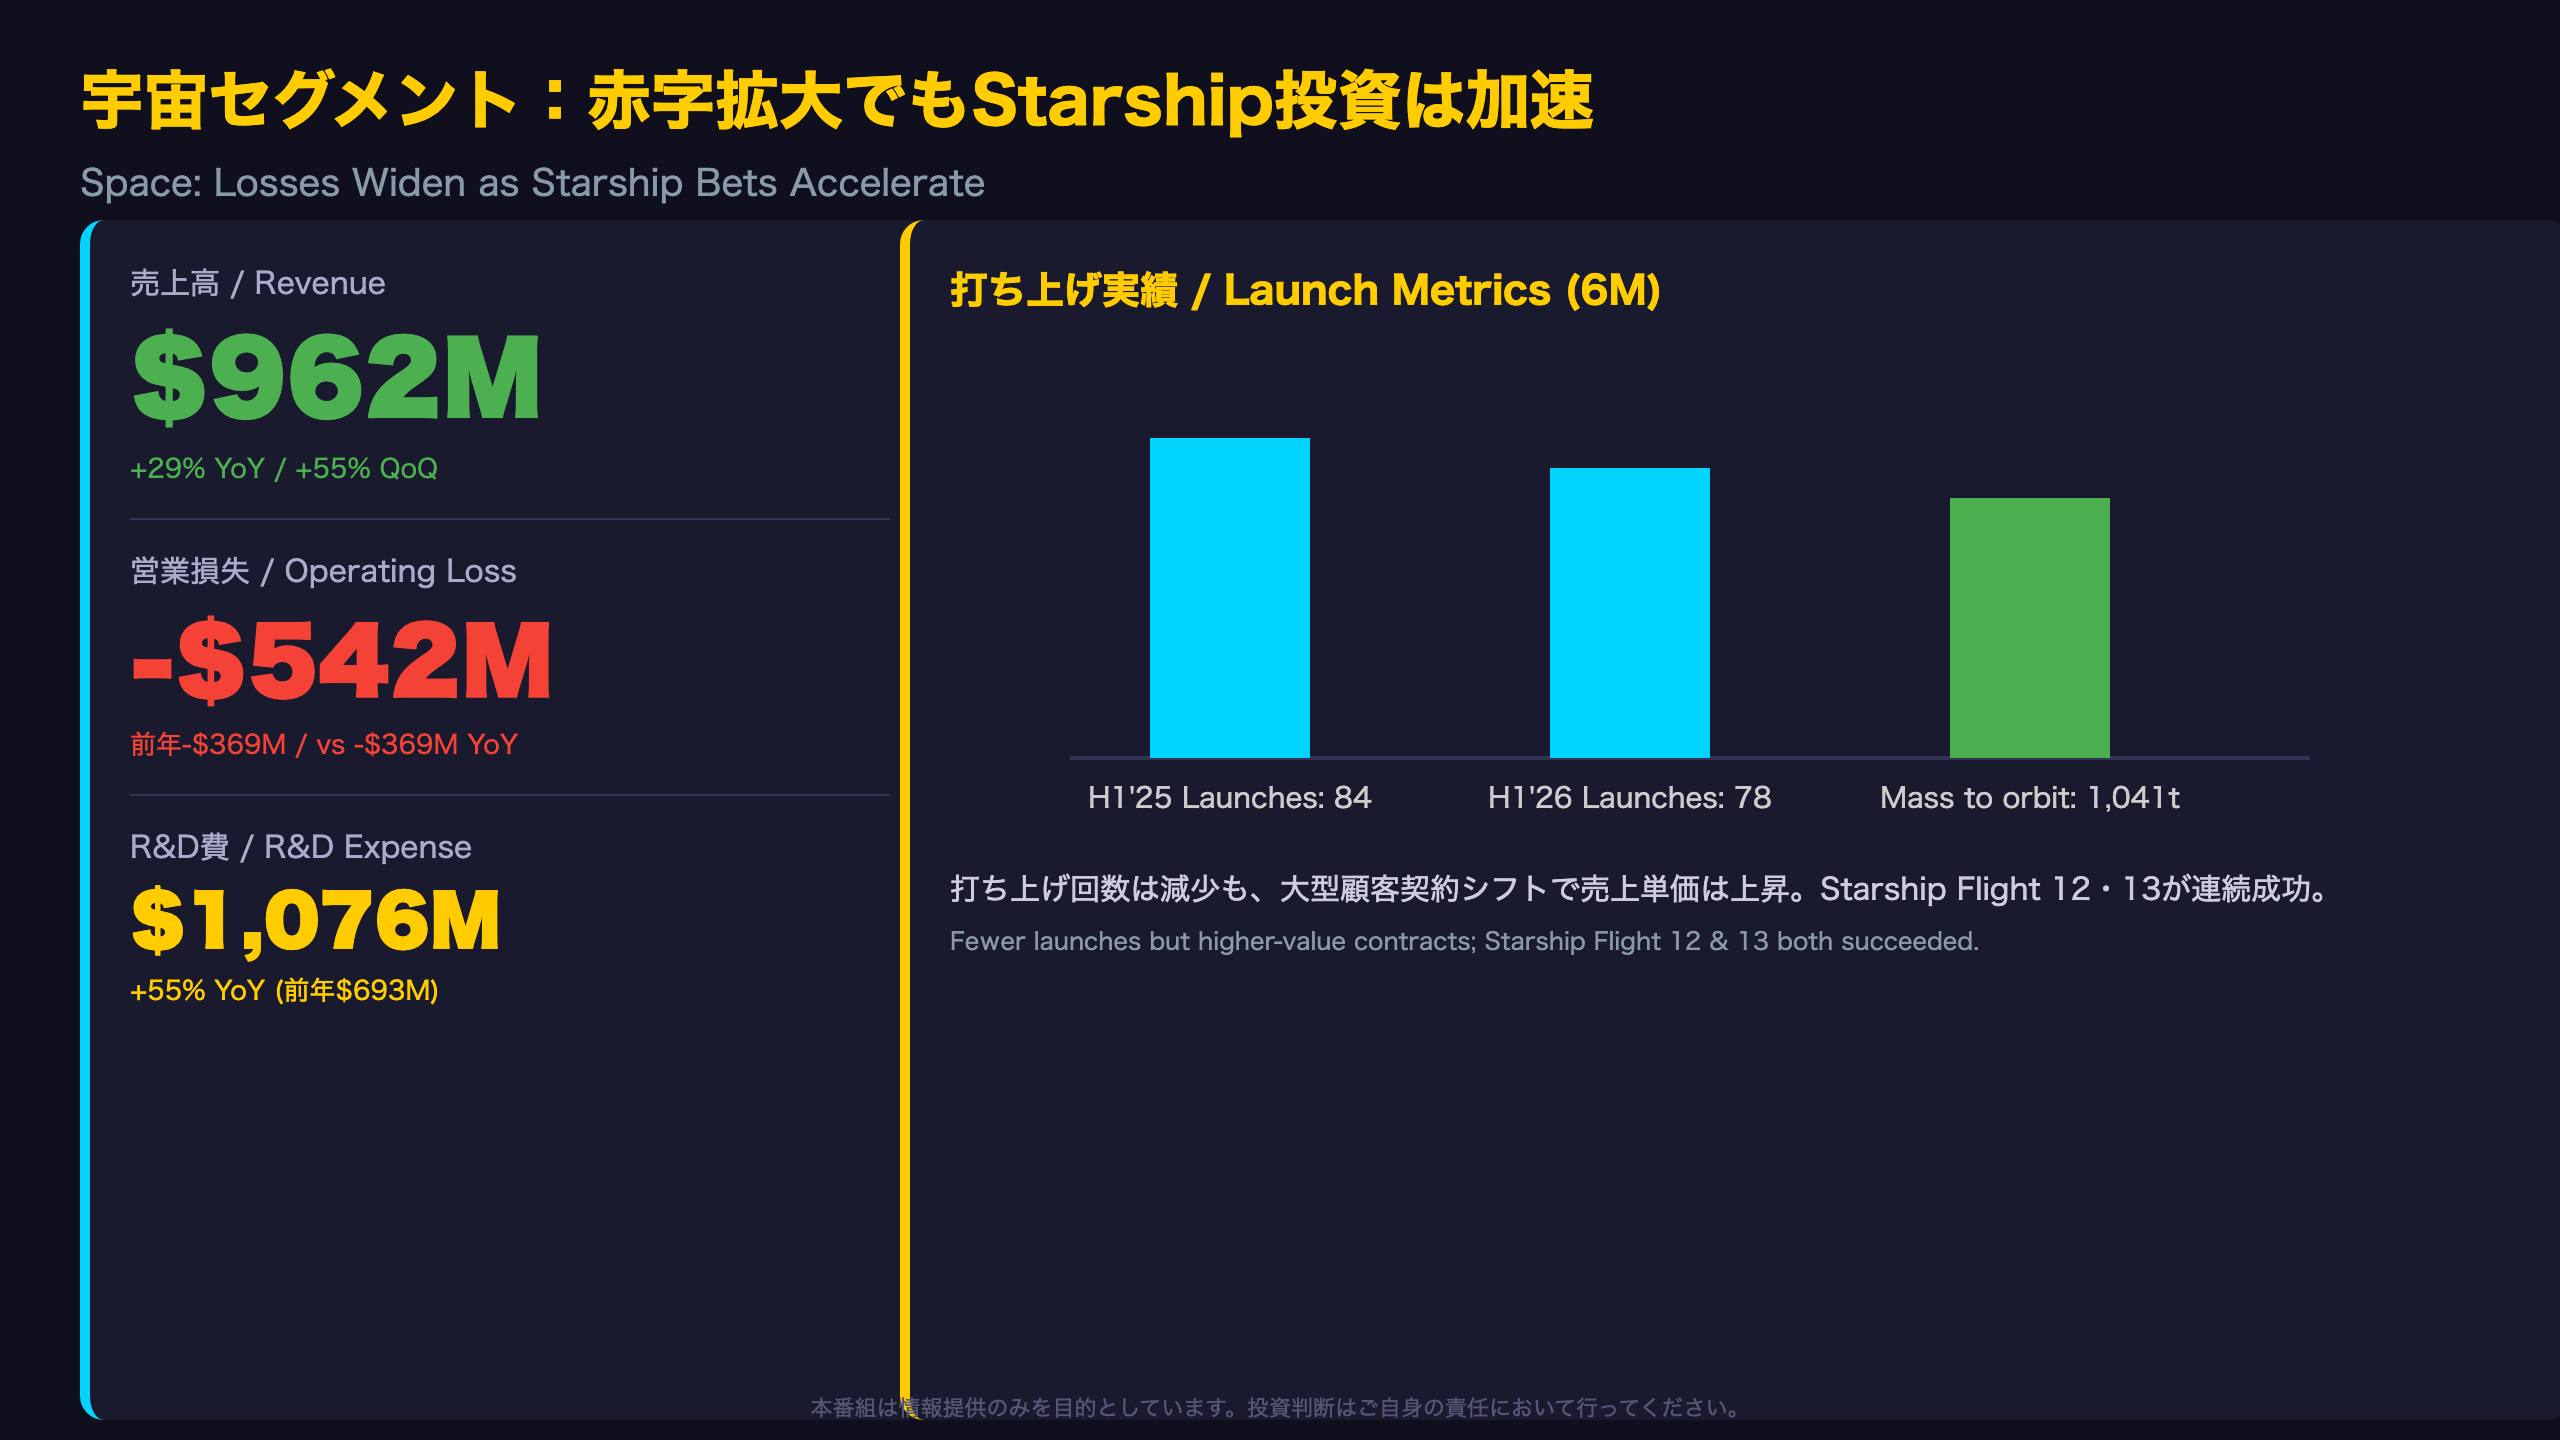
Space Segment: Losses Reflect Investment, Not Deterioration
The Space segment’s operating loss of $542 million widened by $173 million year-over-year. Breaking down the components, cost of revenue was essentially flat ($329M vs. $330M a year ago), while R&D expense jumped 55% to $1.076 billion from $693 million. This pattern suggests the widening loss stems from deliberate acceleration of Starship development spending rather than deteriorating unit economics.
Launch Cadence Details
Total launches this quarter were 38 (10 customer, 28 internal), down from 40 in Q1 and 46 a year ago. Mass to orbit also declined to 485 metric tons from 556 (Q1) and 652 (year-ago). At face value, launch cadence appears to be slowing.
However, the company attributes segment revenue growth to “a higher number of large customer launches and a favorable customer shift” — meaning fewer, larger, higher-value launches rather than pure volume. This implies average revenue per launch rose meaningfully year-over-year (roughly $25.3M vs. ~$16.2M implied a year ago), an important nuance for investors modeling Space segment economics.
Starship V3: Two Consecutive Successes
Flight 12 (May) achieved a successful liftoff from the new Starbase pad, precision upper-stage landing, and deployment of modified V2 Starlink satellites. Flight 13 (July, a subsequent event) deployed 20 production V3 satellites, demonstrated in-space Raptor engine relight, and achieved what the company calls its “softest ever splashdown,” providing intact heatshield data. Management’s stated goal — reducing cost-to-orbit by “99% or more” relative to historical averages — would, if achieved, be transformative not just for Space but for the capital intensity of the Connectivity and AI segments that depend on it for satellite and hardware deployment.
コネクティビティ:最大の収益エンジン / Connectivity: The Profit Engine
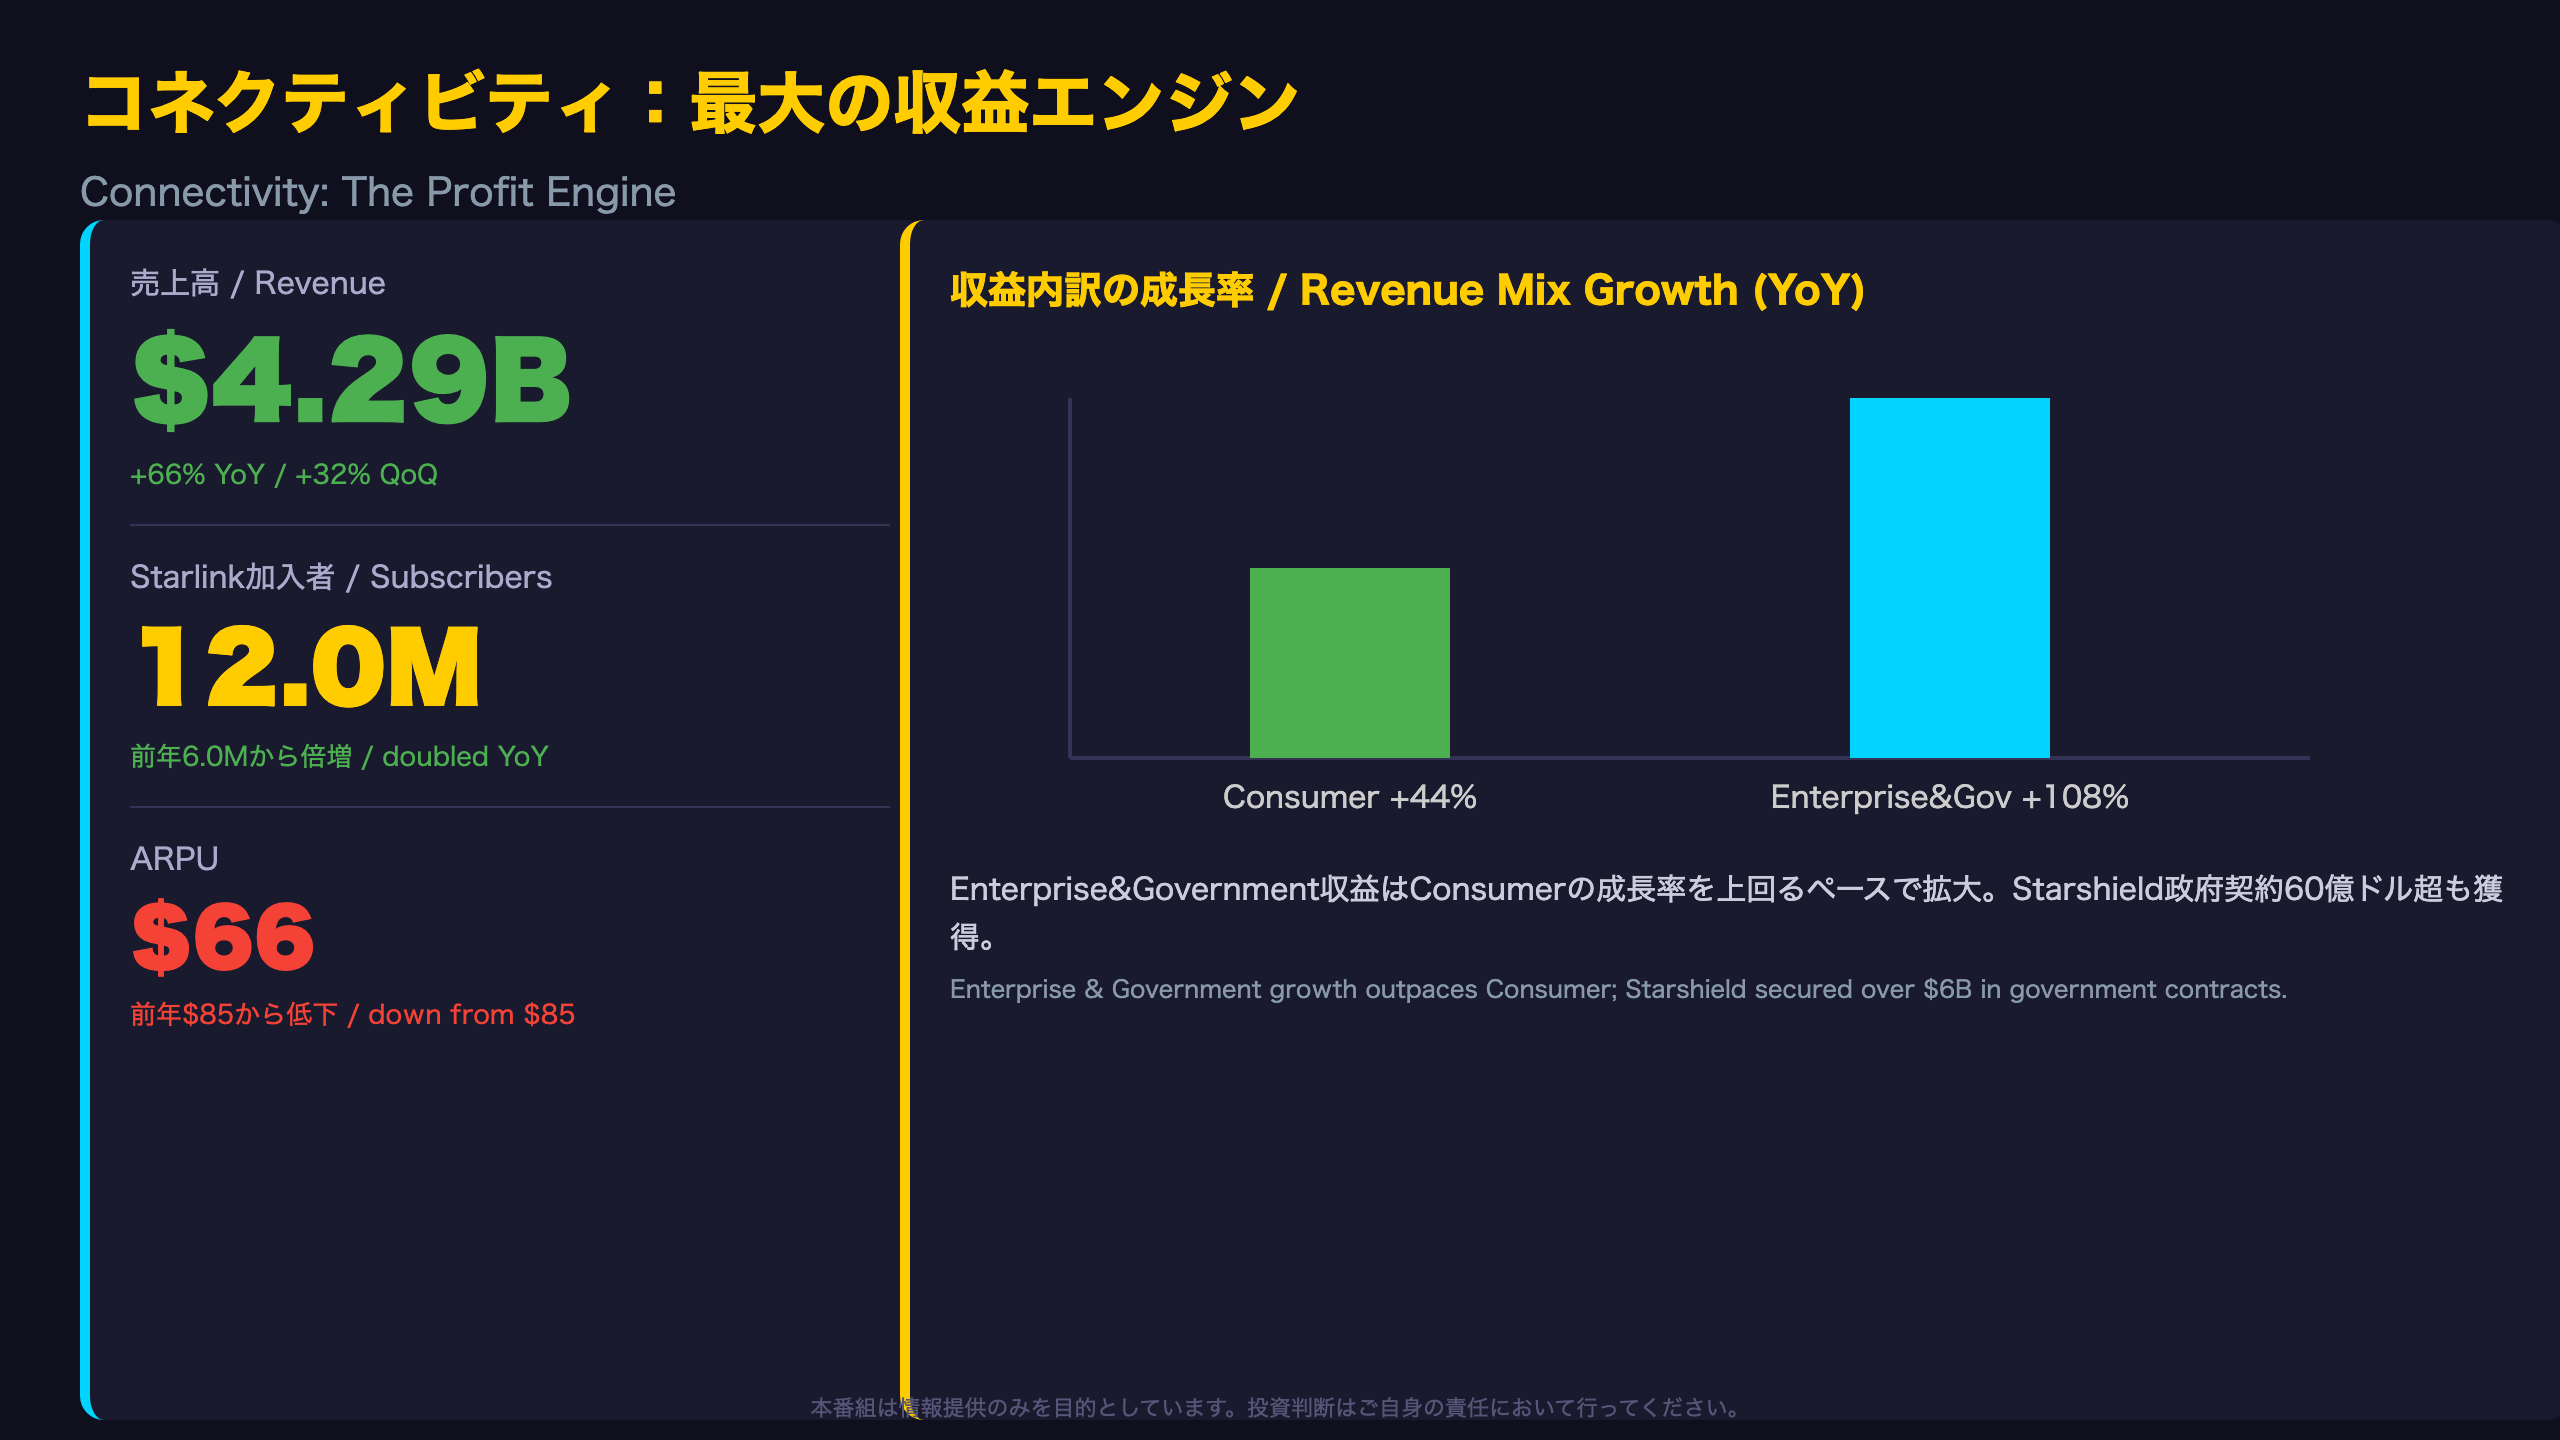
Connectivity: The Financial Backbone
Connectivity’s Adjusted EBITDA of $2.597 billion represents 73% of total company Adjusted EBITDA ($3.538B), with an implied EBITDA margin of roughly 60.5% on segment revenue. This segment effectively subsidizes the still-loss-making Space and AI businesses — a structure investors should understand when assessing consolidated valuation multiples.
Interpreting the ARPU Decline
Starlink ARPU fell to $66/month from $85 a year ago, even as subscribers doubled from 6.0 million to 12.0 million. This pattern is consistent with — but does not definitively prove — a shift from an early, higher-paying adopter base toward broader mass-market penetration. The document does not disaggregate whether this reflects pricing actions, geographic mix shift, or product mix, so a definitive causal claim cannot be made from this data alone.
Enterprise & Government: The Faster-Growing Sub-Segment
Enterprise & Government revenue grew 108% year-over-year to $1.806 billion, outpacing 44% growth in Consumer revenue. This quarter’s highlights include a major agreement with American Airlines, new airline activations (Southwest, Virgin Atlantic, Iberia, Aer Lingus), and expanded Starlink Mobile partnerships with SoftBank, NTT Docomo, and Spark NZ. Additionally, the Starshield secure satellite network won over $6 billion in multi-year U.S. government contracts, primarily from two major Space Force contracts covering LEO-based communications and sensing constellations.
Spectrum Expansion
FCC approval of the EchoStar license transfer added 65 MHz of U.S. spectrum plus certain global Mobile Satellite Service licenses — a forward-looking asset that could expand future broadband capacity, though the release does not quantify near-term revenue impact.
Market Implication
For investors benchmarking against terrestrial telecom or satellite peers, Connectivity’s combination of 66% revenue growth and 60%+ EBITDA margins is a rare combination in the sector, and likely the segment analysts will weight most heavily in near-term valuation models.
AI部門:急成長の裏の巨大投資 / AI Segment: Hypergrowth Meets Hyperscale Capex
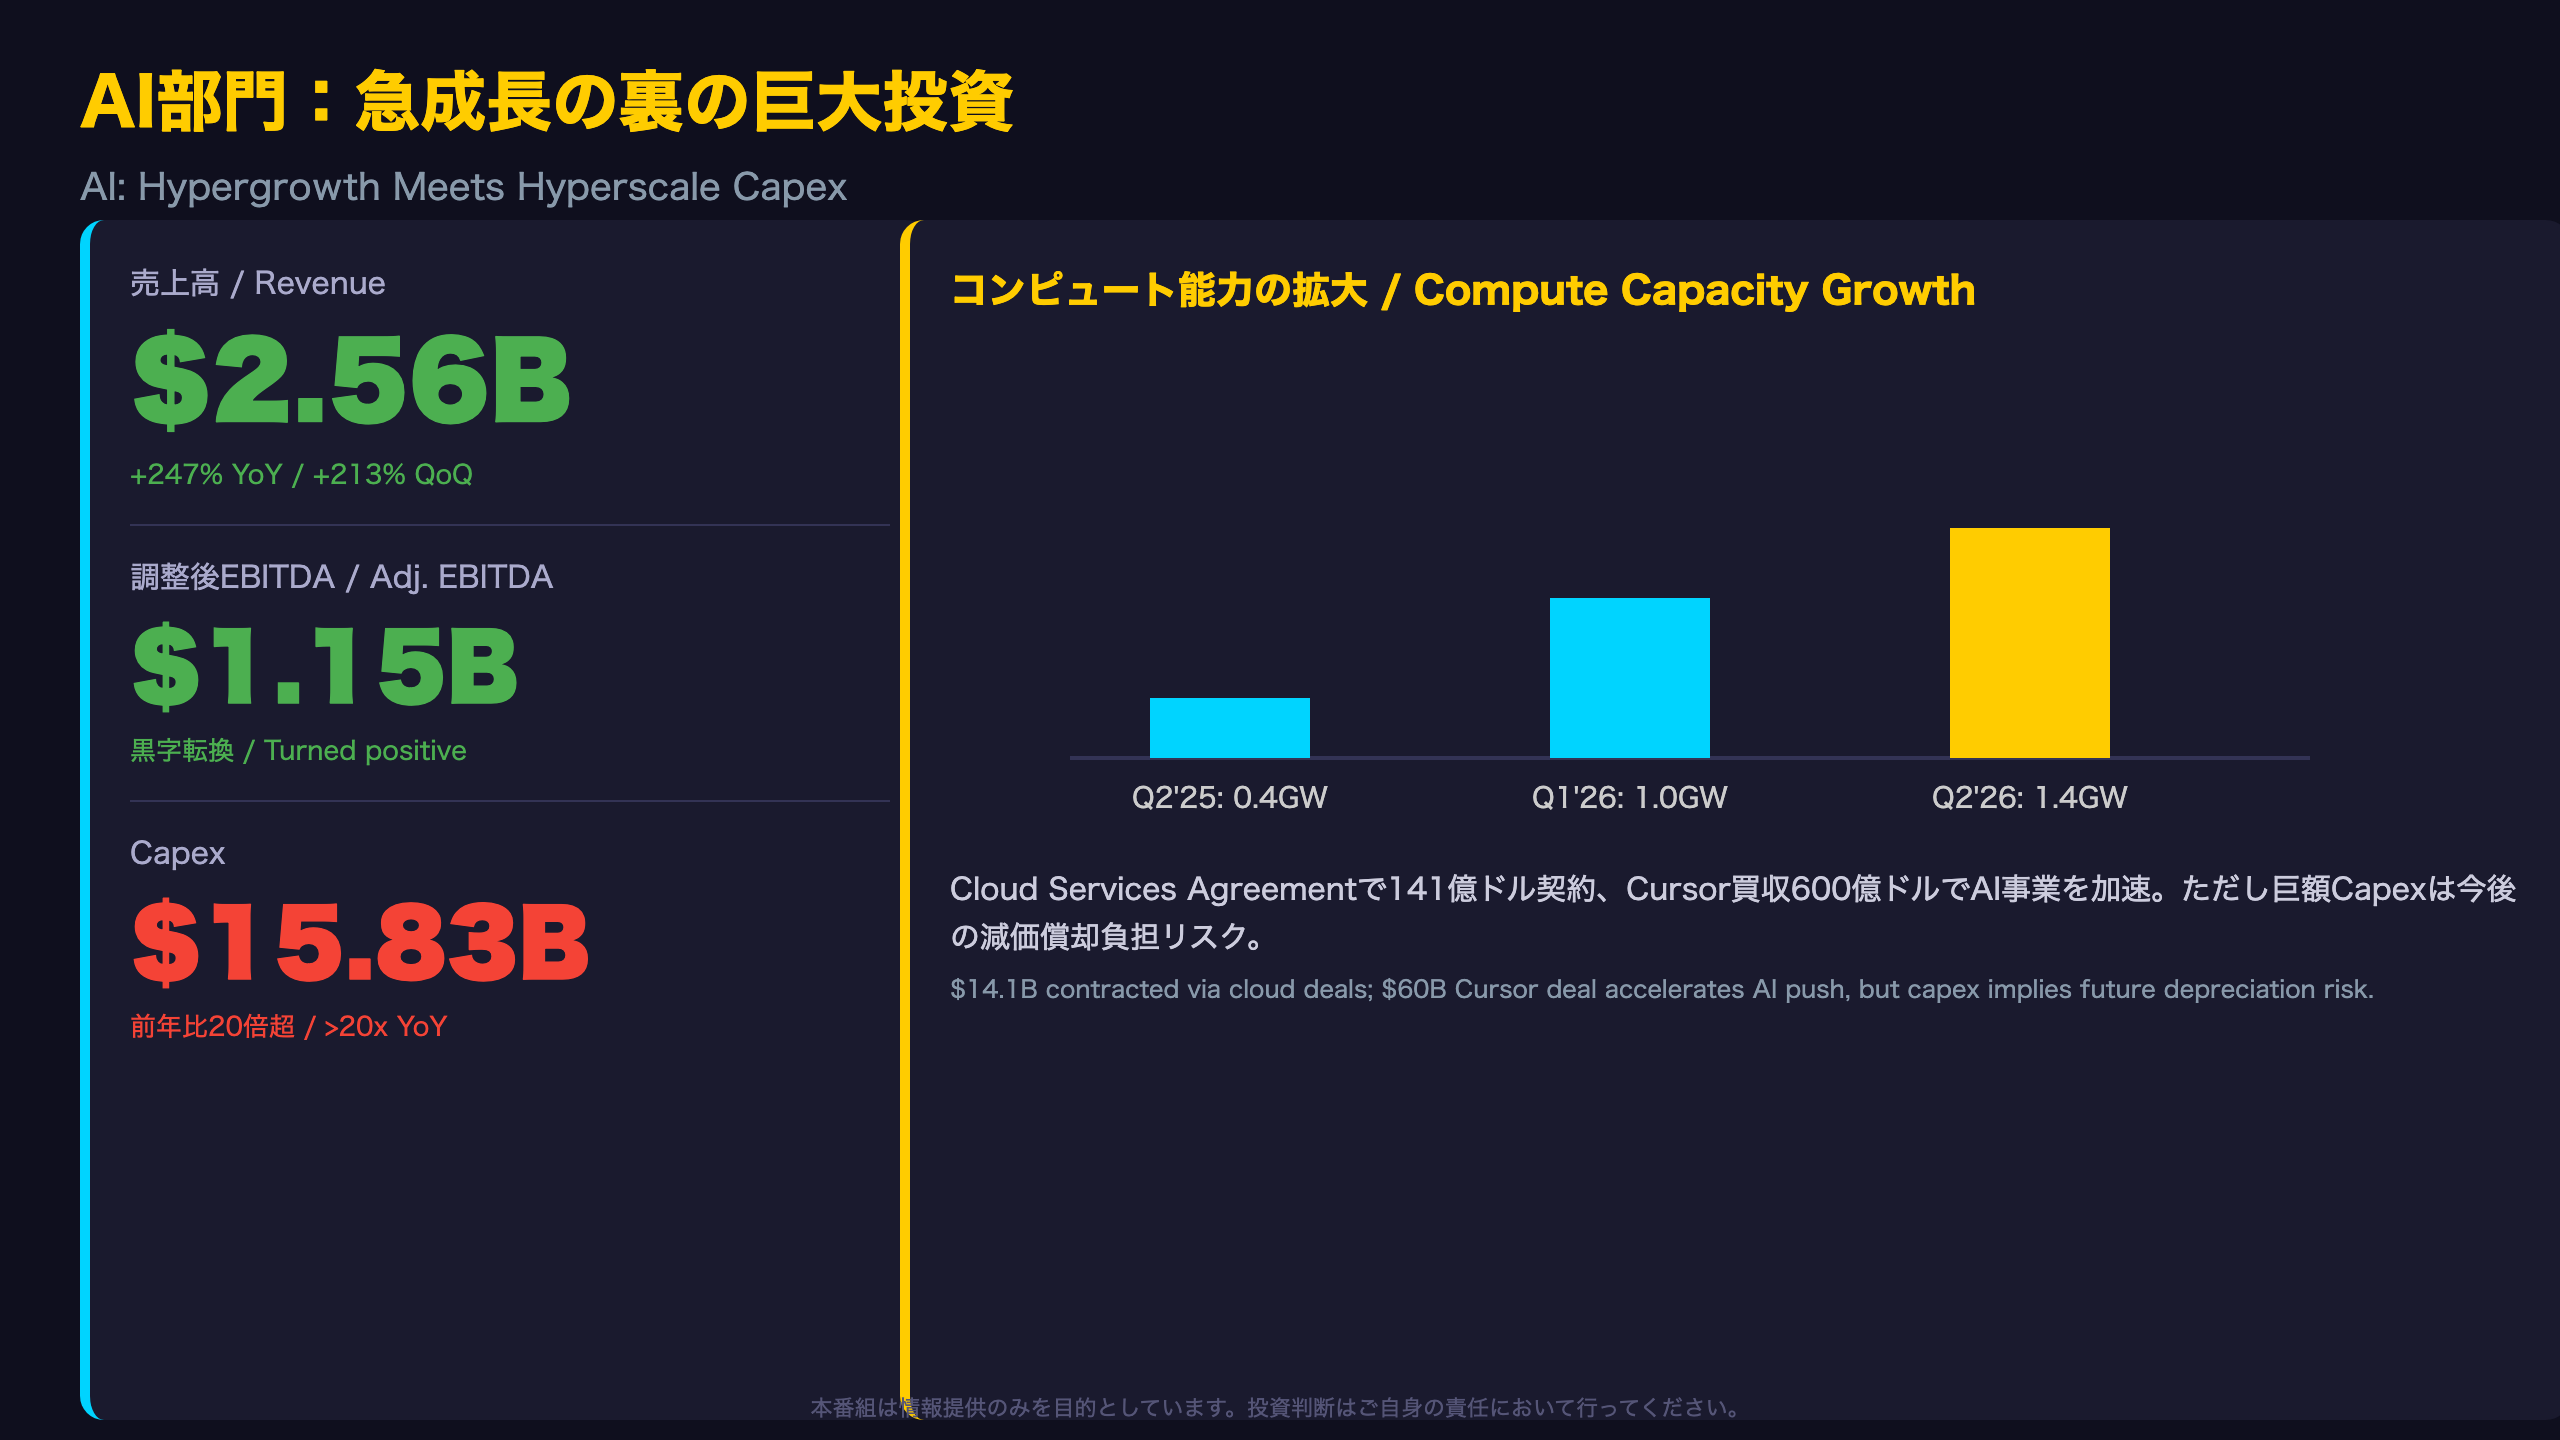
AI Segment: Profitability Inflection Meets Record Capex
The AI segment achieved positive Adjusted EBITDA of $1.146 billion this quarter — a sharp improvement from -$609 million in Q1 2026 and -$276 million a year ago.
The Cloud Services Agreement Effect
AI solutions & infrastructure revenue reached $2.194 billion, up more than 4.6x from $475 million in Q1. Per the release, the company signed “several Cloud Services Agreements totaling $14.1 billion in contracted sales,” generating “$1.6 billion in incremental AI infrastructure revenues for the second quarter” alone. Contracted sales represent revenue to be recognized over future periods (excluding cancellable amounts), suggesting a partial revenue backlog cushion for upcoming quarters — though the pace of recognition beyond Q3 remains undisclosed.
Capex Scale: A Hyperscaler-Level Bet
AI segment capex of $15.828 billion this quarter alone exceeds the combined capex of Space ($1.174B) and Connectivity ($1.367B) by more than 5 times, and represents 86% of total company capex ($18.369B). This spending is funding continued build-out of “Colossus II” and additional capacity under construction — positioning SpaceX’s AI infrastructure ambitions on par with dedicated hyperscale AI infrastructure players that U.S. investors track closely.
The Cursor Acquisition and Grok 4.5
The $60 billion agreement to acquire Cursor (expected to close Q3 2026) marks a serious push into AI coding tools. Grok 4.5, released in July, incorporates a 1.5-trillion-parameter V9 foundation model and was reportedly “trained alongside Cursor.” How this acquisition translates into incremental AI solutions revenue will be a key data point in coming quarters.
The Depreciation Overhang
Despite the EBITDA turnaround, GAAP operating loss for AI remained substantial at $1.257 billion. The primary gap between EBITDA and operating income is depreciation and amortization ($1.885 billion this quarter alone) — a structural reminder that today’s record capex will generate rising depreciation charges for years, a dynamic directly analogous to the capex-versus-earnings debate playing out across the broader U.S. AI infrastructure sector.
資金調達力:IPOと社債で1000億ドルの弾薬 / Capital Firepower: IPO and Bonds Fund $100B War Chest
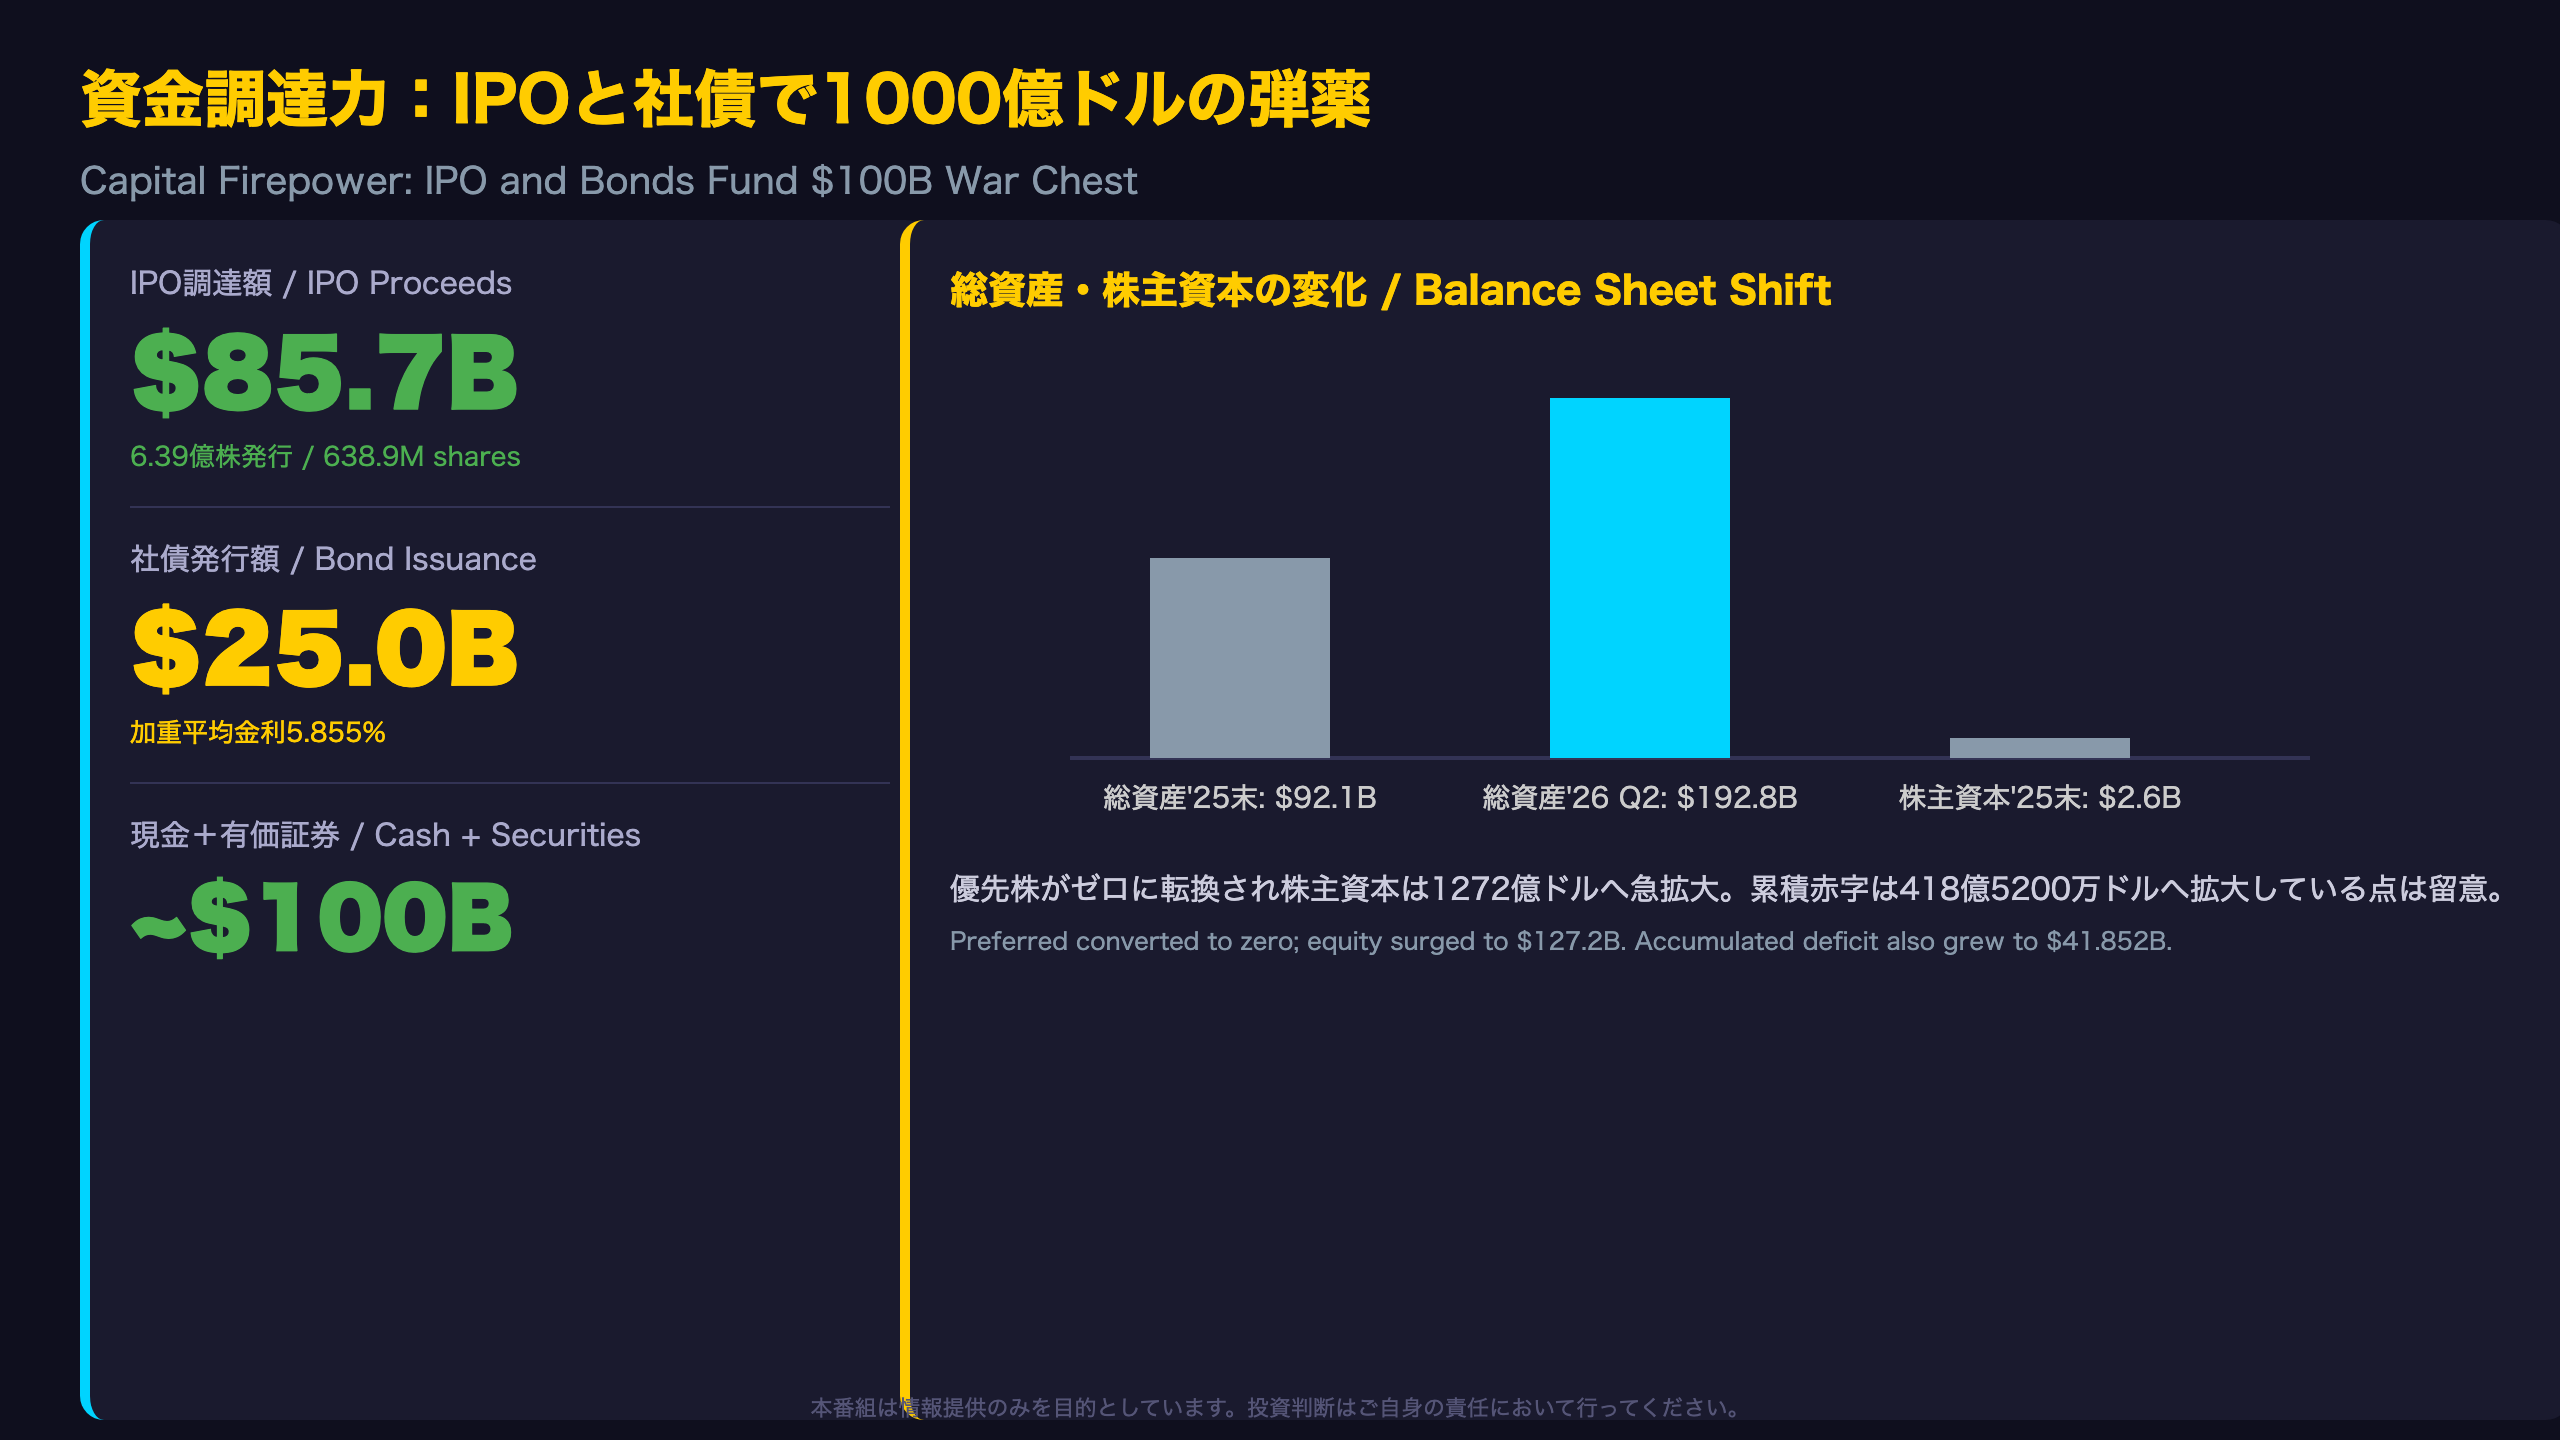
Balance Sheet Transformation
Total assets nearly doubled over six months, from $92.079 billion at year-end 2025 to $192.770 billion by June 30, 2026 — a transformation driven almost entirely by capital markets activity rather than organic asset growth.
Financing Activity Detail
Per the cash flow statement, financing activities generated $100.291 billion in the first half of 2026 (versus $9.199 billion a year earlier). Investing activities consumed $34.487 billion (versus $6.032 billion a year earlier), reflecting the AI segment’s capex surge. Operating cash flow was a positive $3.466 billion, up sharply from $351 million a year ago — an important sign that core operations, not just financing, are becoming self-funding.
Preferred-to-Common Conversion: A Structural Signal
Redeemable convertible preferred stock, which stood at $38.752 billion at year-end 2025, fell to zero by June 30, 2026 — clear evidence that the IPO triggered conversion of preferred shares into common stock, a standard mechanic for late-stage private companies going public. This is why shareholders’ equity expanded so dramatically, from just $2.573 billion to $127.224 billion.
Debt Profile: Related-Party to Public Markets
Total liabilities grew from $50.754 billion to $65.546 billion. Long-term debt and finance leases rose from $21.968 billion to $36.839 billion, with the related-party portion increasing from $4.052 billion to $11.290 billion. The new $25 billion public bond issuance (five tranches, 2031–2056 maturities, 5.35%–6.65% coupon range, 5.855% weighted average) represents a shift toward market-based financing alongside continued related-party lending — a capital structure nuance international investors should factor into credit risk assessments.
Accumulated Deficit Still Rising
Accumulated deficit grew from $37.035 billion to $41.852 billion, reflecting the six-month net loss of $4.817 billion. Investors should not conflate the capital-raising-driven asset expansion with underlying profitability — these are separate dynamics, and the deficit trajectory remains the more relevant signal for assessing path-to-profitability timing.
経営陣の発言:規律ある資本配分への意志 / Management’s Voice: Discipline Amid Expansion
Parsing Management’s Language
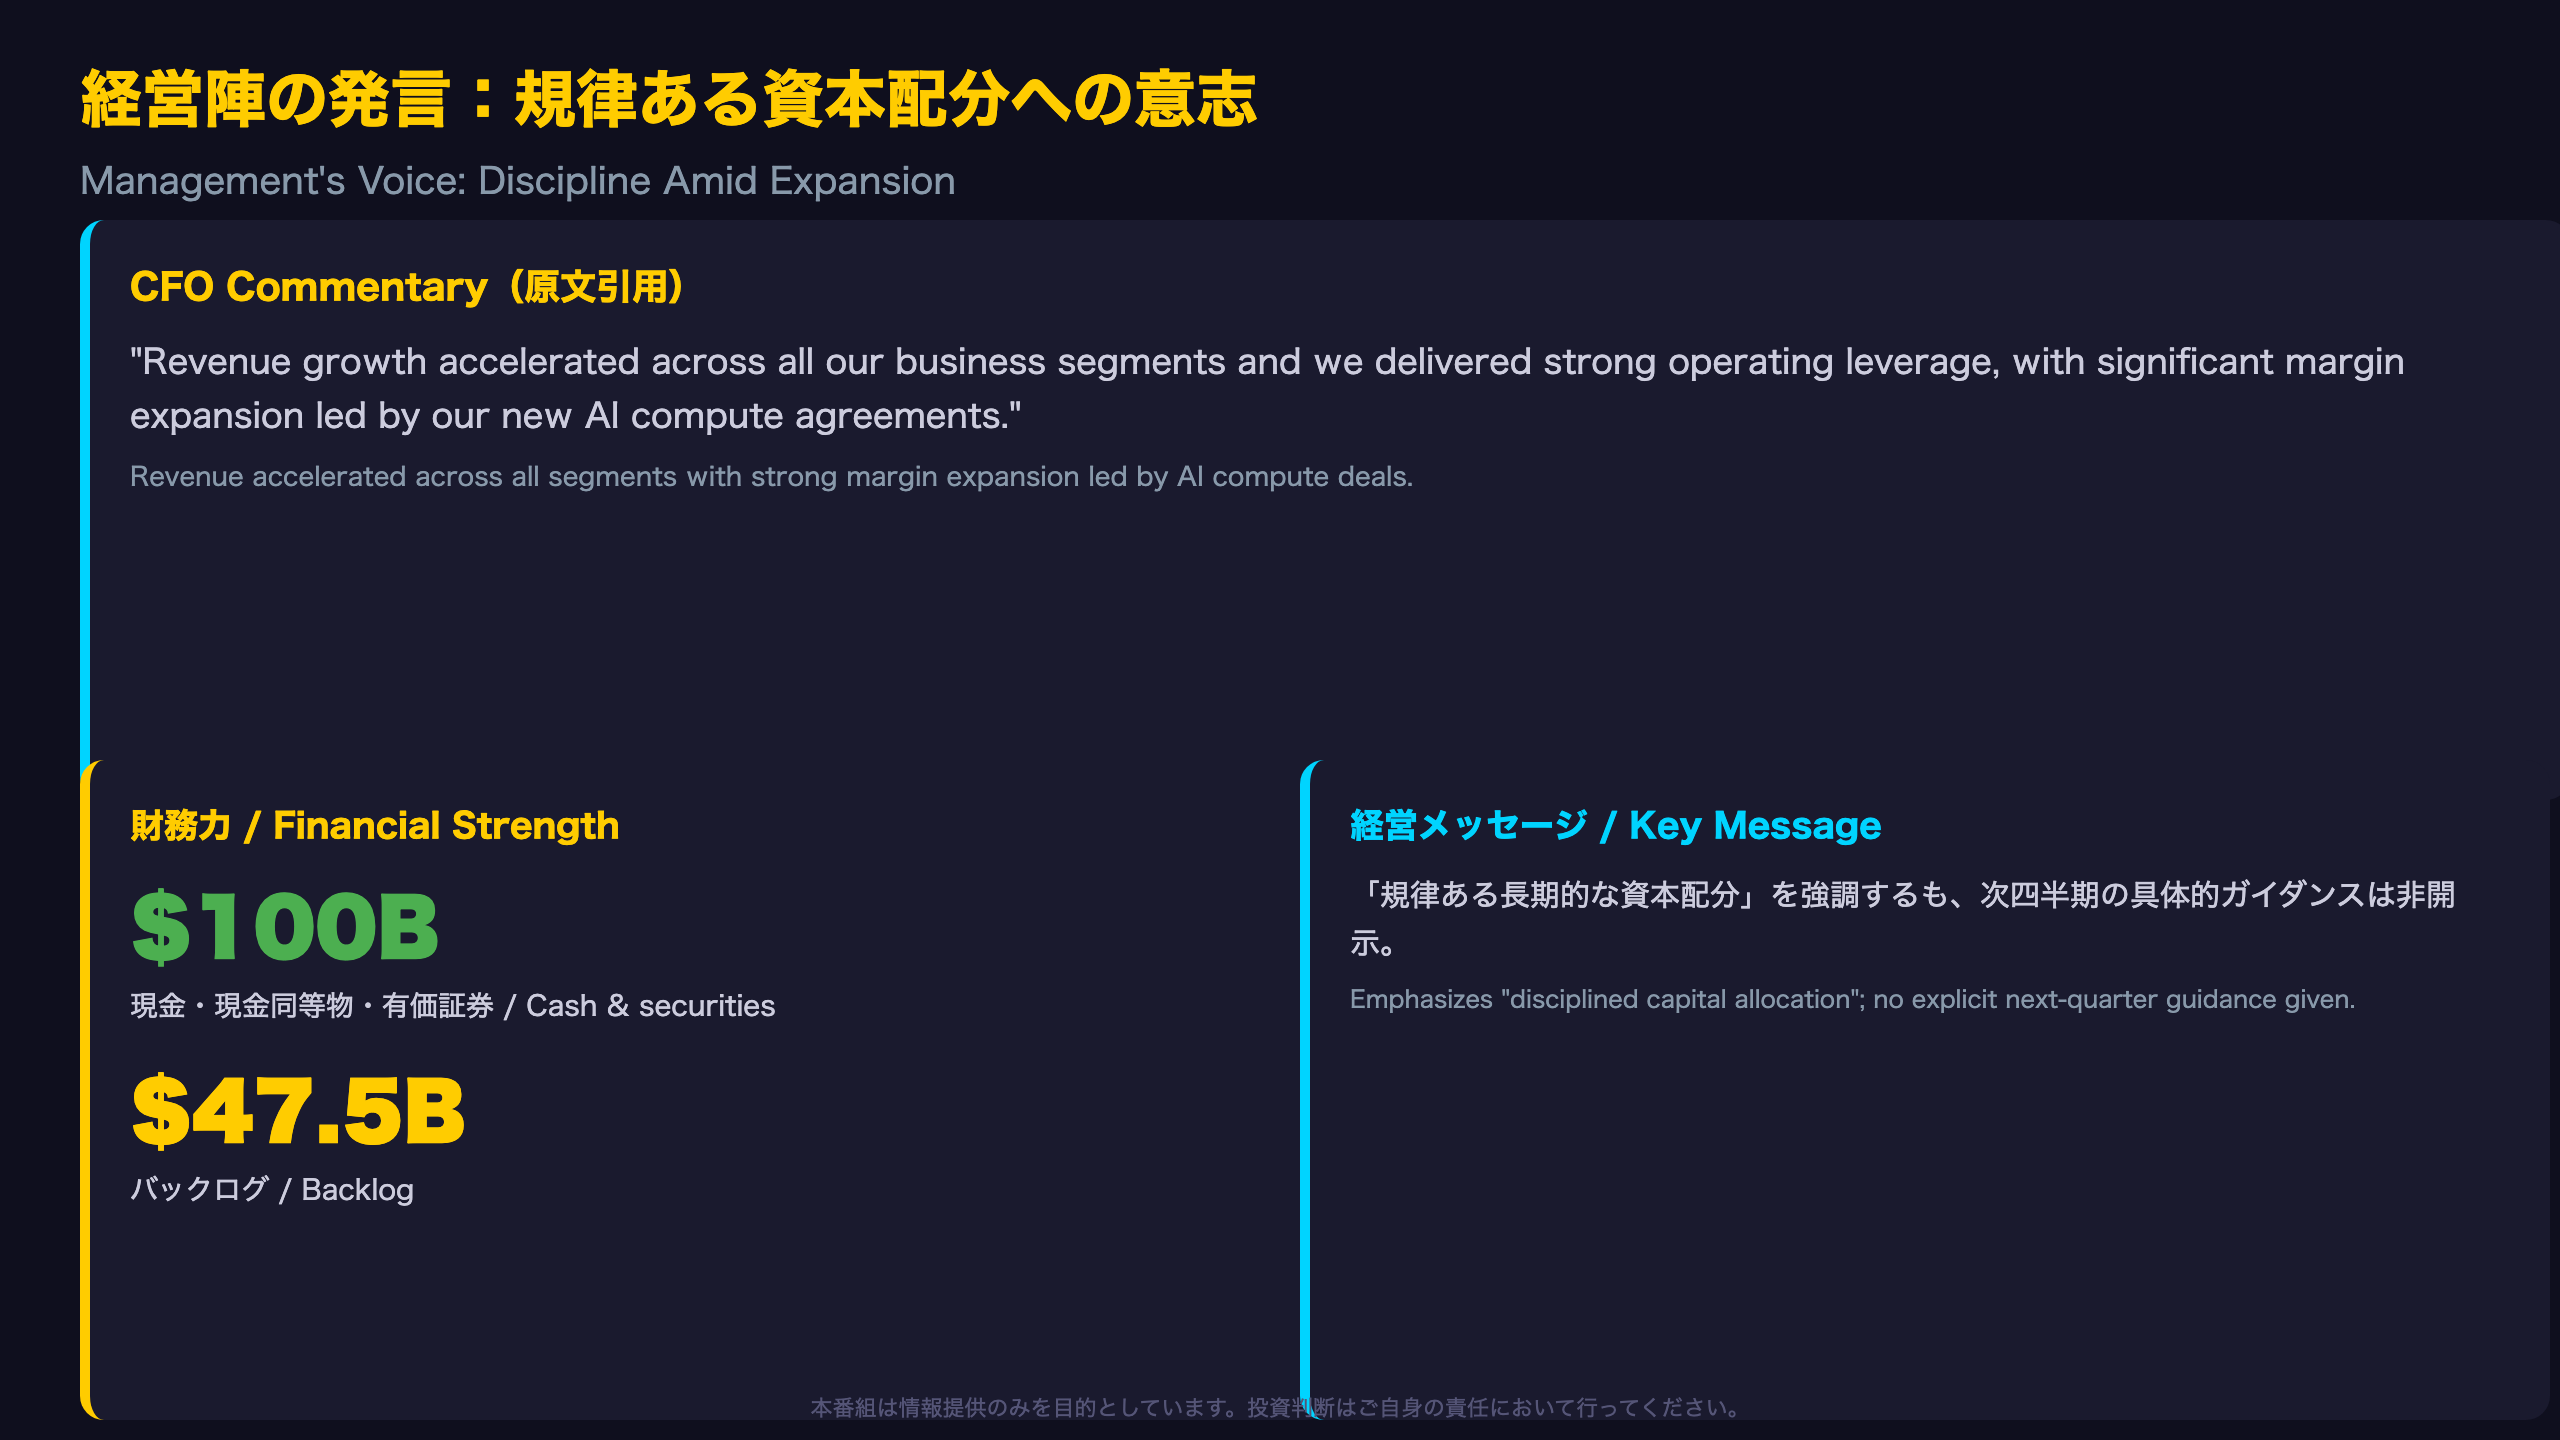
One notable phrase in the CFO commentary: “As a newly public company, we are delighted to welcome our broad base of shareholders and bondholders.” This explicitly frames SpaceX’s transition from a privately-held company to one with a broader, more diverse stakeholder base following the June IPO and bond issuance — a framing worth noting given how recently this transition occurred.
What the $47.5 Billion Backlog Tells Us
The release states the company ended the quarter with “$47.5 billion in backlog,” though it does not break this figure down by segment. Given that AI segment contracted sales alone were disclosed at $14.1 billion, it’s plausible — though not confirmed in the text — that a meaningful portion of the backlog is concentrated in AI and Connectivity’s large enterprise/government contracts. This remains an inference (Level C confidence), not a stated fact.
The Weight of “Disciplined Capital Allocation”
Given that AI segment capex surged more than 20x year-over-year, the CFO’s specific use of the phrase “disciplined long-term capital allocation framework” reads as a direct response to likely investor concerns about overinvestment risk. This is a stated management intention, not yet a verified outcome — the real test will be whether Adjusted EBITDA growth continues to outpace the depreciation burden this capex wave will generate in coming quarters.
Forward-Looking Statement Caveats
The release includes standard forward-looking statement language, directing readers to risk factors in the company’s Form 10-Q for the quarter ended June 30, 2026, and its IPO prospectus (Rule 424(b)(4)). Notably, the release does not provide specific quantitative guidance for next-quarter revenue or EPS — a gap investors accustomed to more conventional earnings releases should keep in mind when modeling forward estimates.
市場への示唆:成長株か資本集約型リスクか / Market Implications: Growth Story or Capital-Intensity Risk
Market Implications via the Evidence Chain
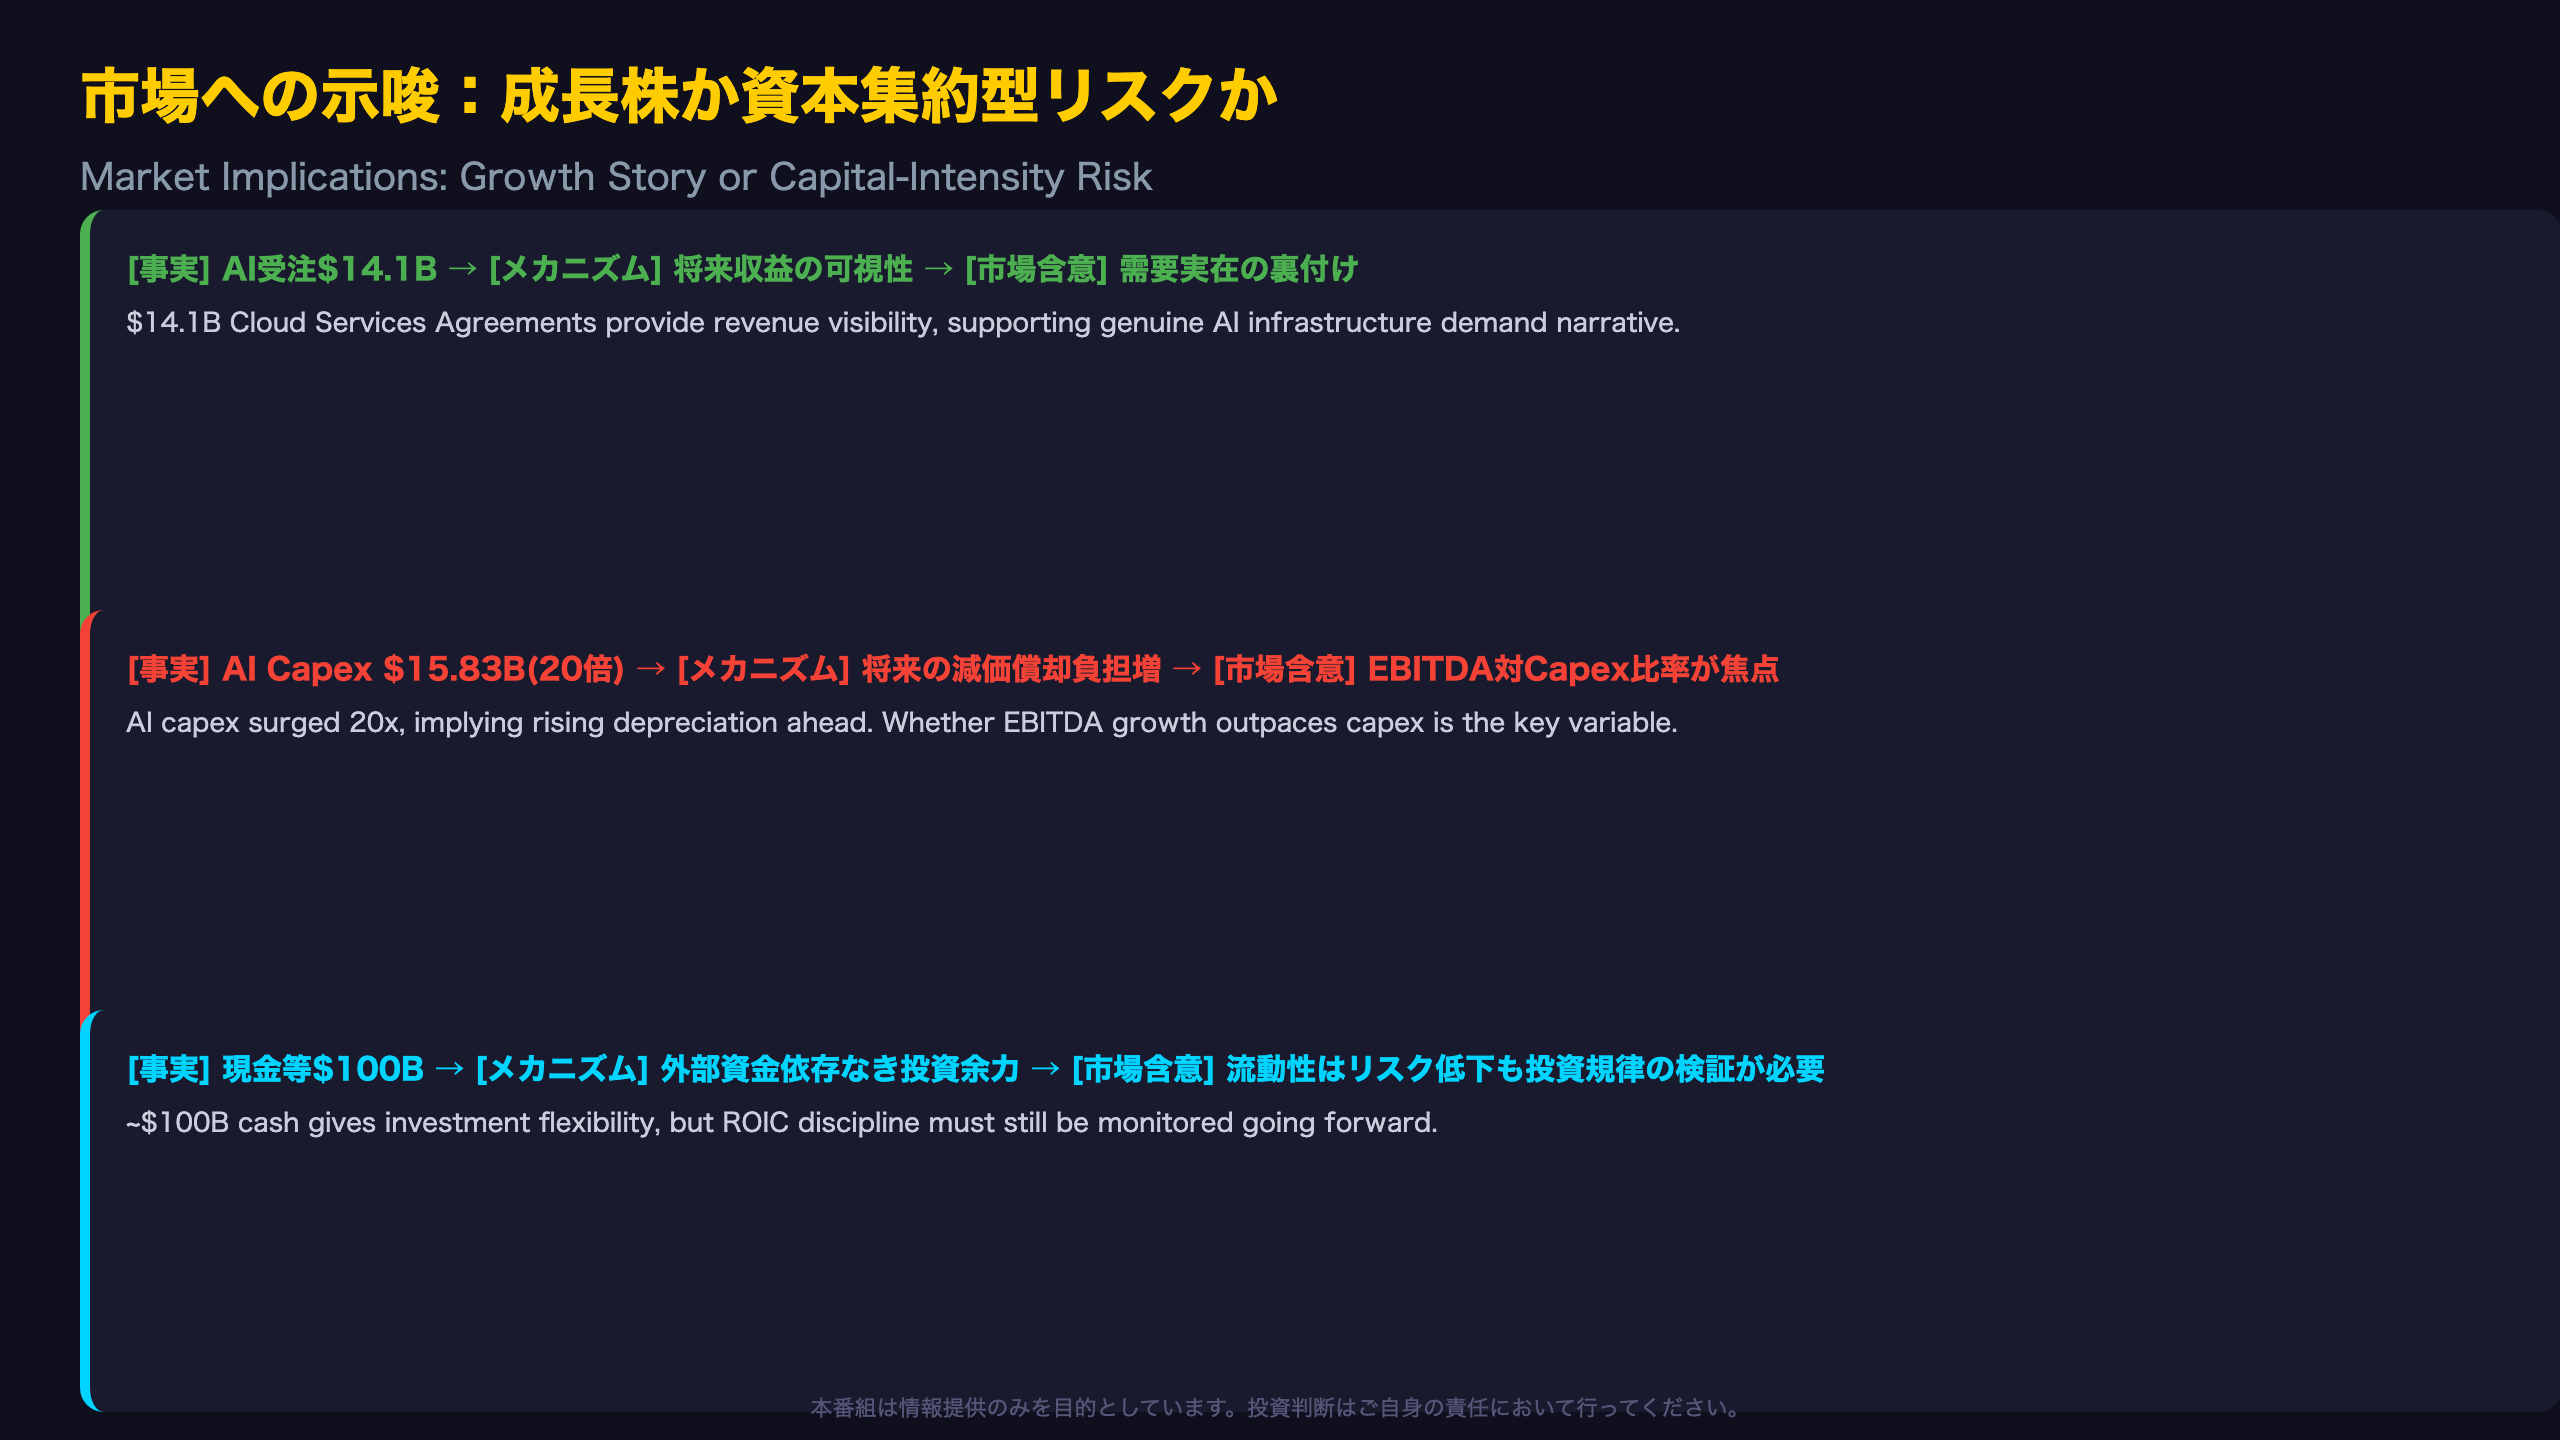
[Fact] The AI segment secured $14.1 billion in Cloud Services Agreement contracted sales, with $1.6 billion recognized as incremental revenue this quarter.
[Mechanism] Contracted sales represent revenue expected to be recognized over multiple future quarters, providing a degree of revenue visibility.
[Market Implication] This offers concrete evidence of genuine AI infrastructure demand, which could support positive sentiment toward SPCX shares and AI infrastructure names more broadly.
[Fact] AI segment capex reached $15.828 billion, more than 20x the $749 million spent a year earlier, representing 86% of total company capex.
[Mechanism] It is generally understood that rapid capex expansion pressures future operating margins through rising depreciation charges over subsequent years.
[Market Implication] However, this single quarter’s data cannot quantify the future scale of depreciation burden or its relationship to EBITDA growth. Whether Adjusted EBITDA growth continues to outpace capex expansion in coming quarters will be the single largest variable for SPCX’s valuation trajectory.
[Fact] The company raised $85.7 billion via IPO and $25 billion via bond issuance, ending the quarter with approximately $100 billion in cash and marketable securities.
[Mechanism] Ample liquidity provides financial flexibility to fund large capital programs without relying on further external financing in the near term.
[Market Implication] While abundant liquidity is generally viewed as reducing near-term financial risk, it can also enable continued aggressive capex without immediate capital-market discipline. Investors should monitor return on invested capital (ROIC) trends as the more meaningful long-term signal.
Limited Direct FX/Rate Implications
This is a single-company earnings report and does not carry direct structural implications for USD/JPY or broader U.S. rate levels. That said, the sheer scale of AI infrastructure investment SPCX represents — a single company’s quarterly capex of $15.8 billion — is a data point worth watching for its potential spillover into sentiment around broader U.S. capital expenditure statistics and semiconductor/power-related equities.
Disclaimer: This article is for informational purposes only. All investment decisions are made solely at your own risk.