📺 Watch the Full Video Analysis
This article was automatically generated by the NFC Market Live AI analysis system. (Updated: 2026-08-07 21:39 JST)
📄 Primary Source
Statistics Canada
https://www150.statcan.gc.ca/n1/daily-quotidien/260807/dq260807a-eng.htm
📊 Deep dive into Canada’s July 2026 Labour Force Survey.
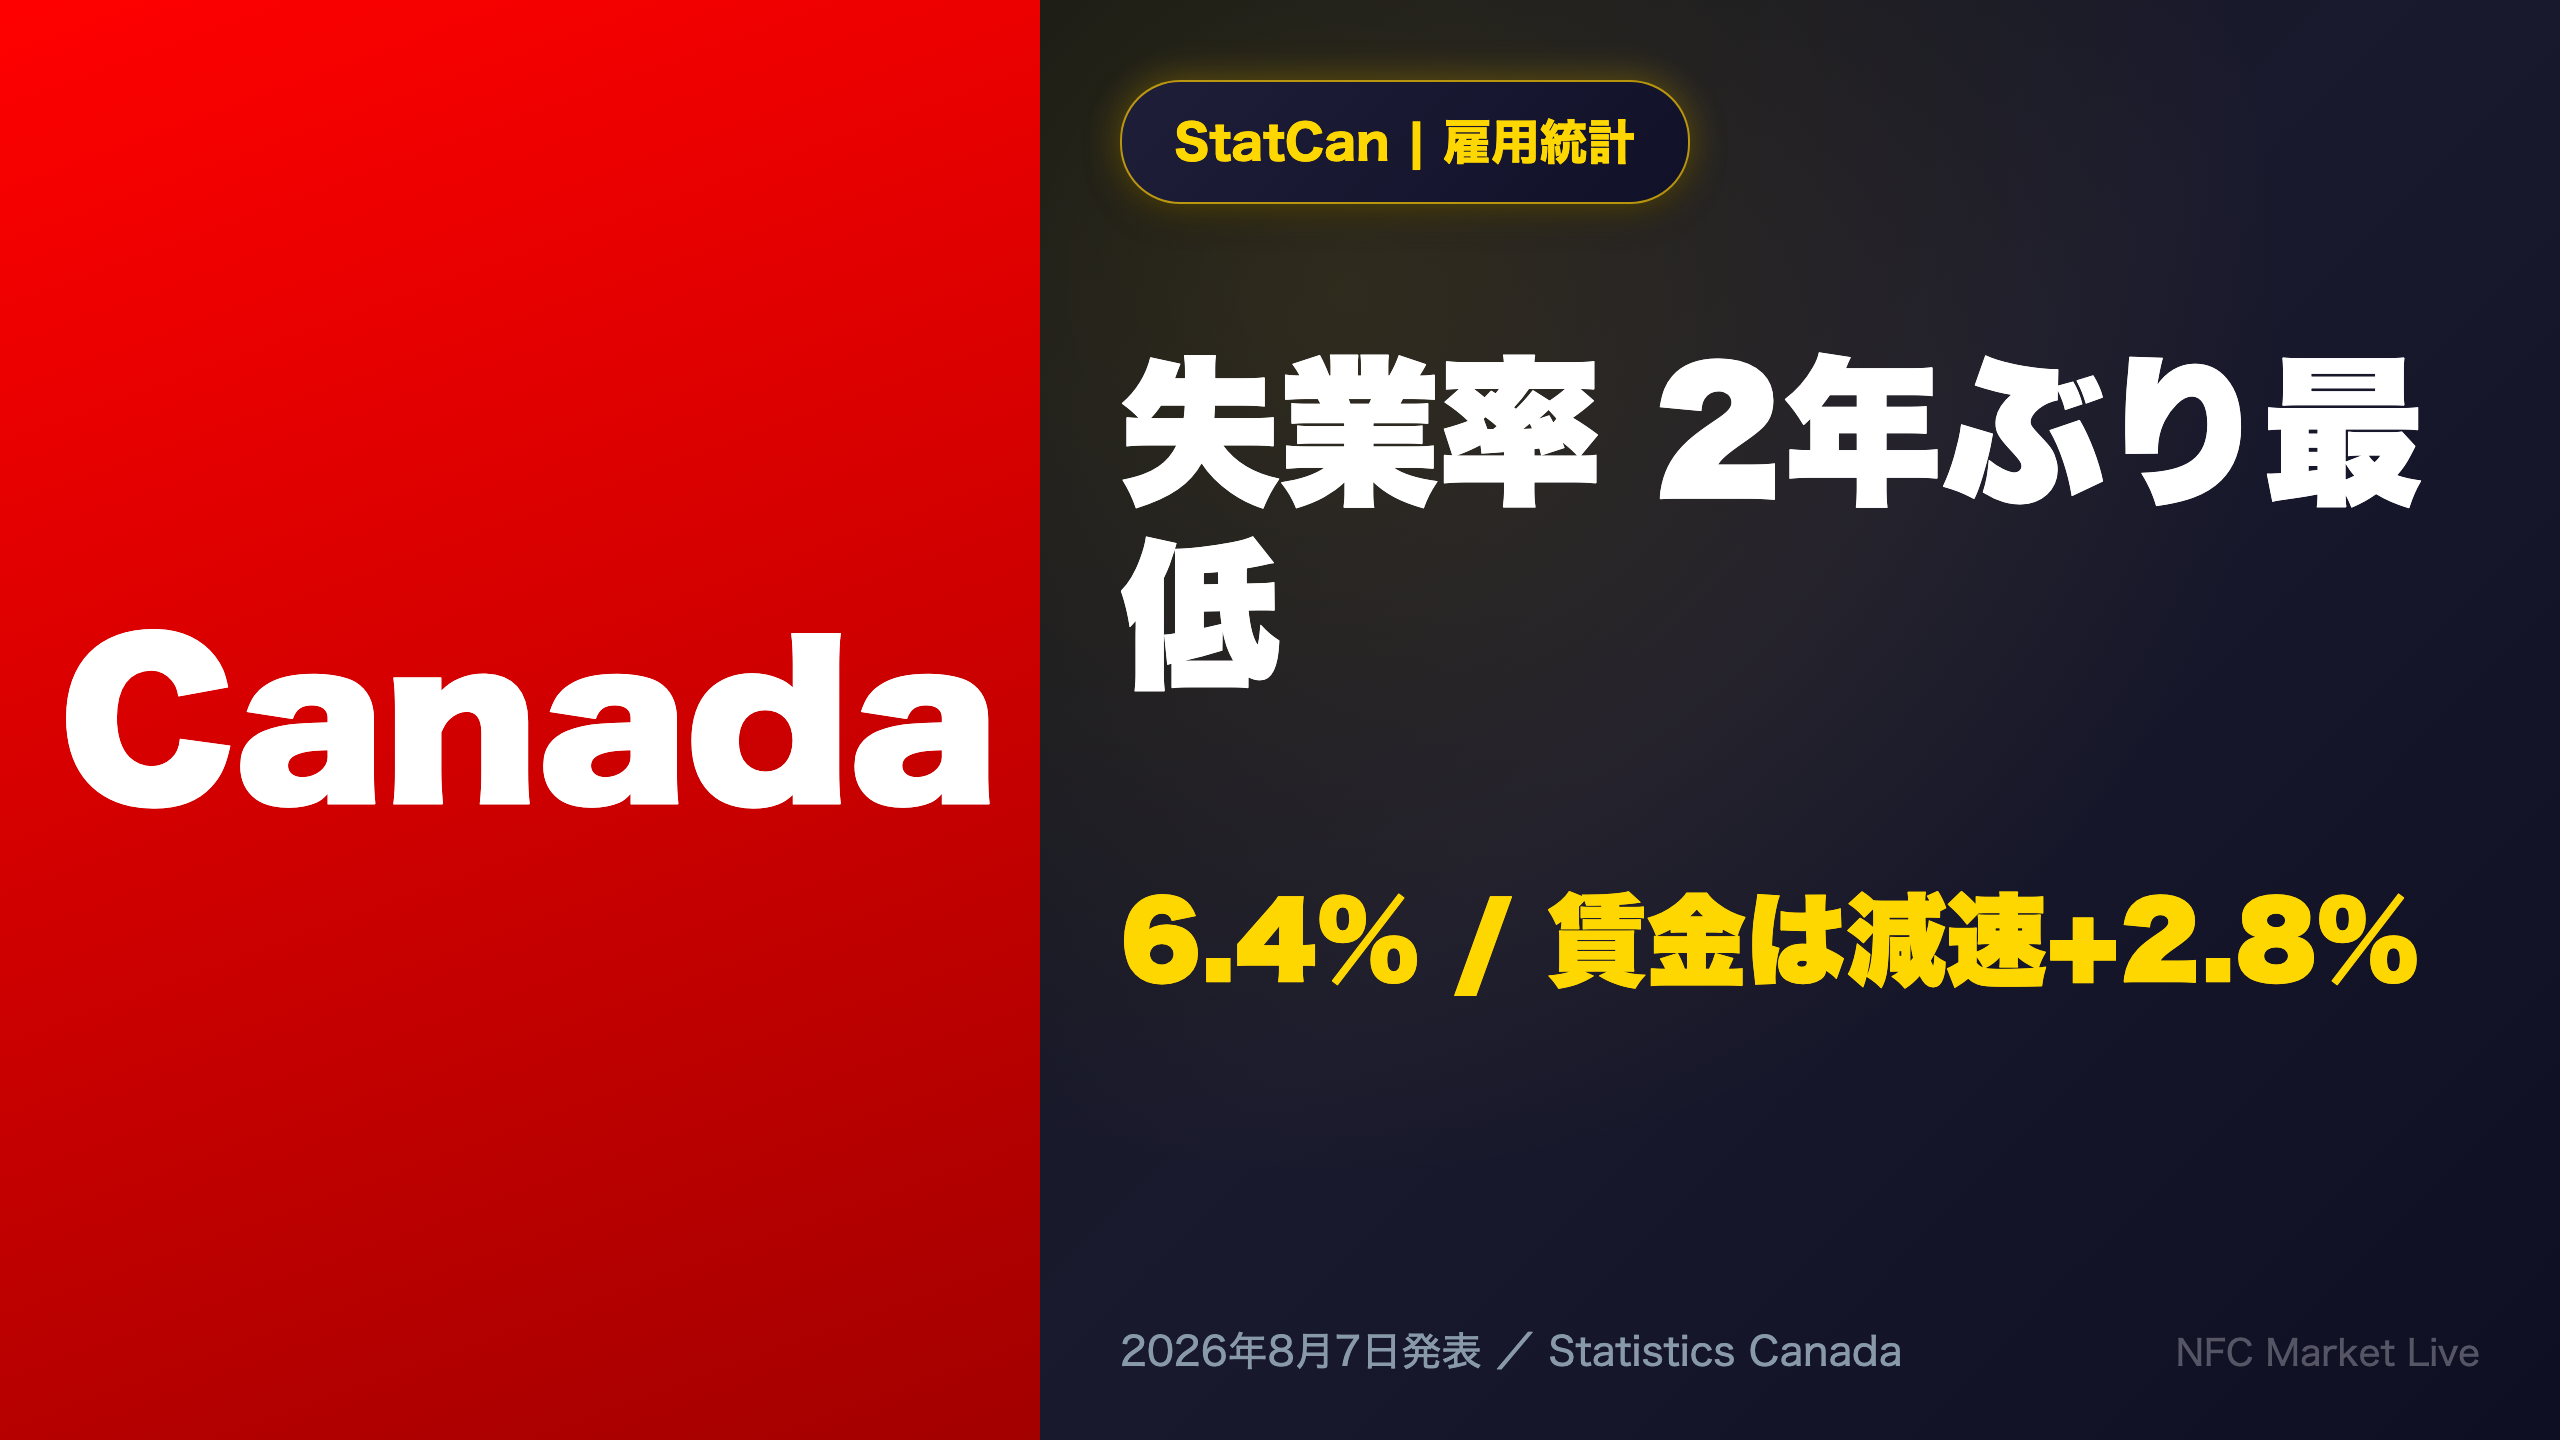
Employment rose by +75,000 (+0.4%) while the unemployment rate fell 0.1pt to 6.4% — the lowest level in two years.
💡 Key takeaways
・Job growth since April has been full-time led (+193,000)
・Private sector and self-employment drove gains; public sector shrank
・Average hourly wages rose +2.8% YoY, slowing from +3.3% in June
・Unemployment improved most for core-age women and youth
⚠️ The wage growth slowdown is a key input for the Bank of Canada’s policy path. We break down whether Canada’s labour market is cooling gently or losing momentum.
Next release: September 4, 2026 (August data).
雇用+75,000人、失業率6.4%で2年ぶり最低
The Big Picture
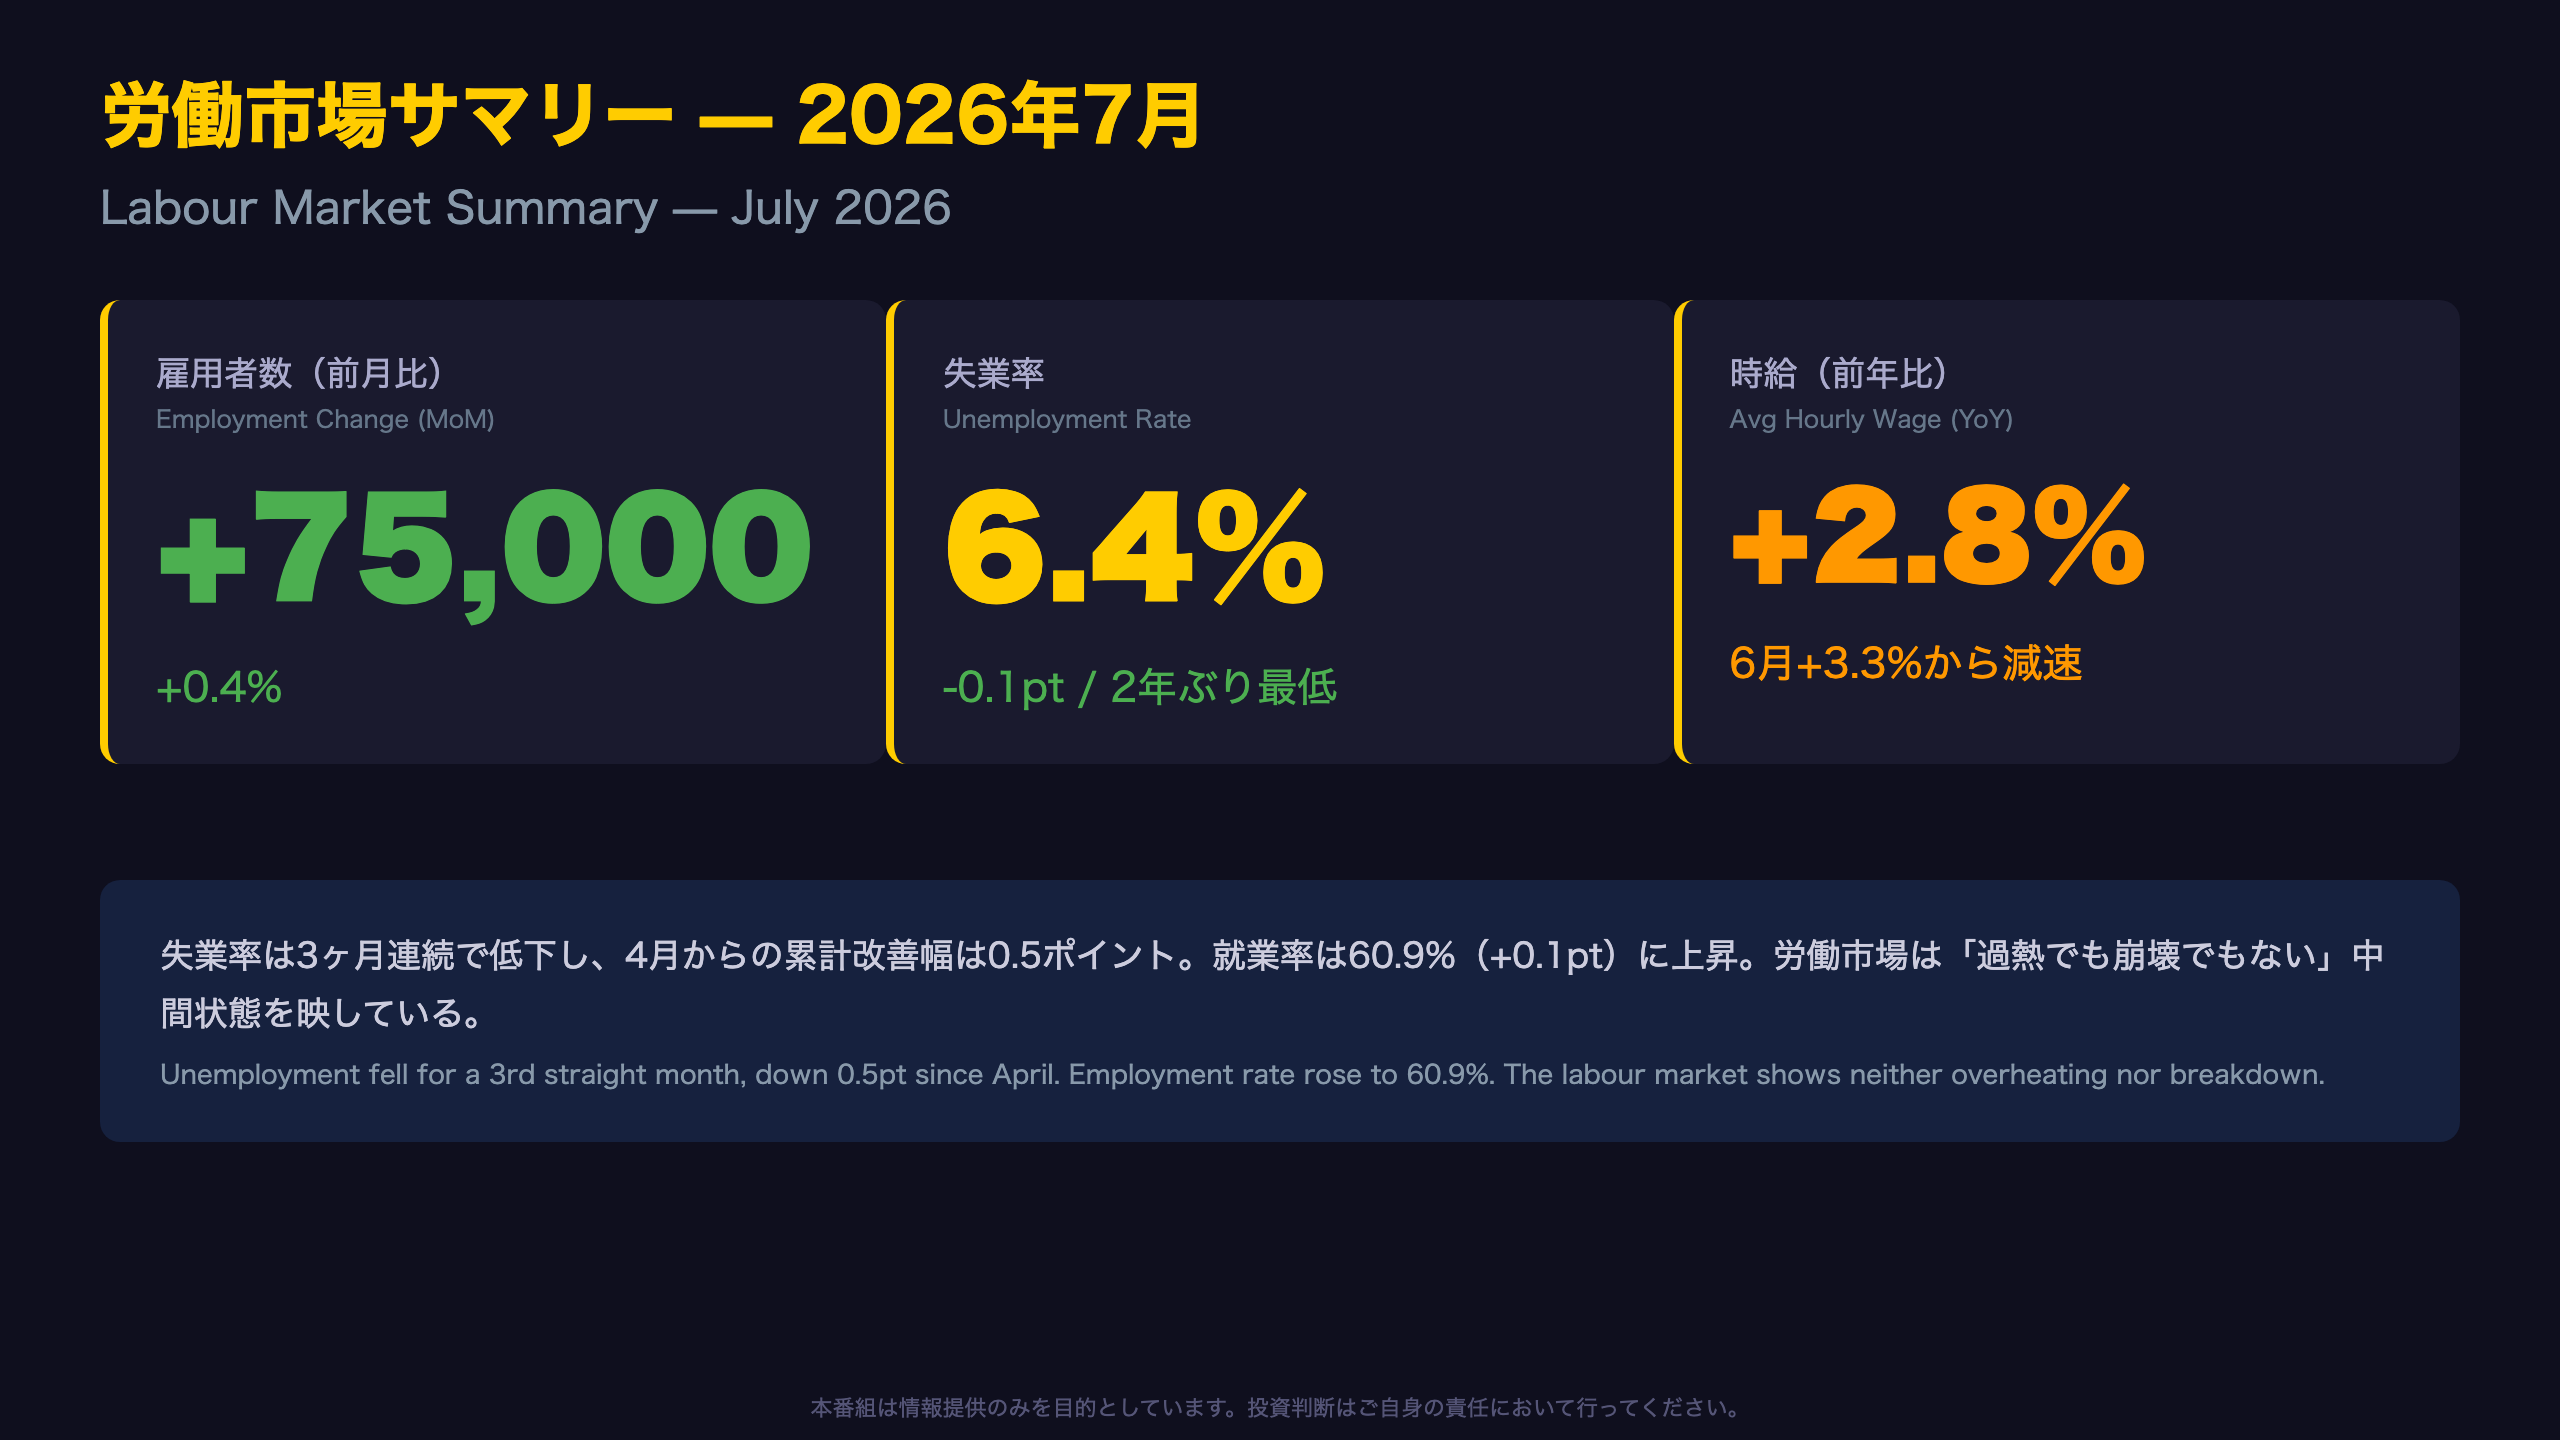
Statistics Canada’s Labour Force Survey (LFS) — a monthly household survey of roughly 65,000 Canadian households — reported July 2026 employment up +75,000 (+0.4%), with the unemployment rate falling to 6.4%, down 0.1 percentage point.
“Employment increased by 75,000 (+0.4%) in July and the employment rate rose 0.1 percentage points to 60.9%. The unemployment rate declined 0.1 percentage points to 6.4%.”
Historical Context
At 6.4%, Canada’s jobless rate is at its lowest level since July 2024 — a two-year low. This marks the third consecutive monthly decline, with a cumulative 0.5-point drop since April, and the rate is also down 0.5 points year-over-year.
Why This Matters for International Investors
Unlike the U.S. Bureau of Labor Statistics’ nonfarm payrolls, Canada’s LFS is a household survey similar to the U.S. Current Population Survey, making unemployment rate trends directly comparable across the two economies. Canada’s 6.4% compares to a US rate that has recently hovered in a similar mid-single-digit range — useful context for CAD/USD rate differential analysis.
Wage Data Caveat
Average hourly wages rose 2.8% YoY to $37.17, down from June’s 3.3% — but this figure is not seasonally adjusted, meaning month-to-month noise is possible.
Bull vs. Bear Read
Bulls will point to the three-month unemployment downtrend as evidence of labour market resilience. Bears (or more neutral observers) will flag the wage deceleration as an early signal of softening demand — though a single month’s data cannot confirm a structural shift.
Next release: September 4, 2026, covering August data (reference week Aug 9–15).
4月以降の雇用拡大、フルタイムと民間セクターが主導
Assessing the Quality of Job Growth
The StatCan release states:
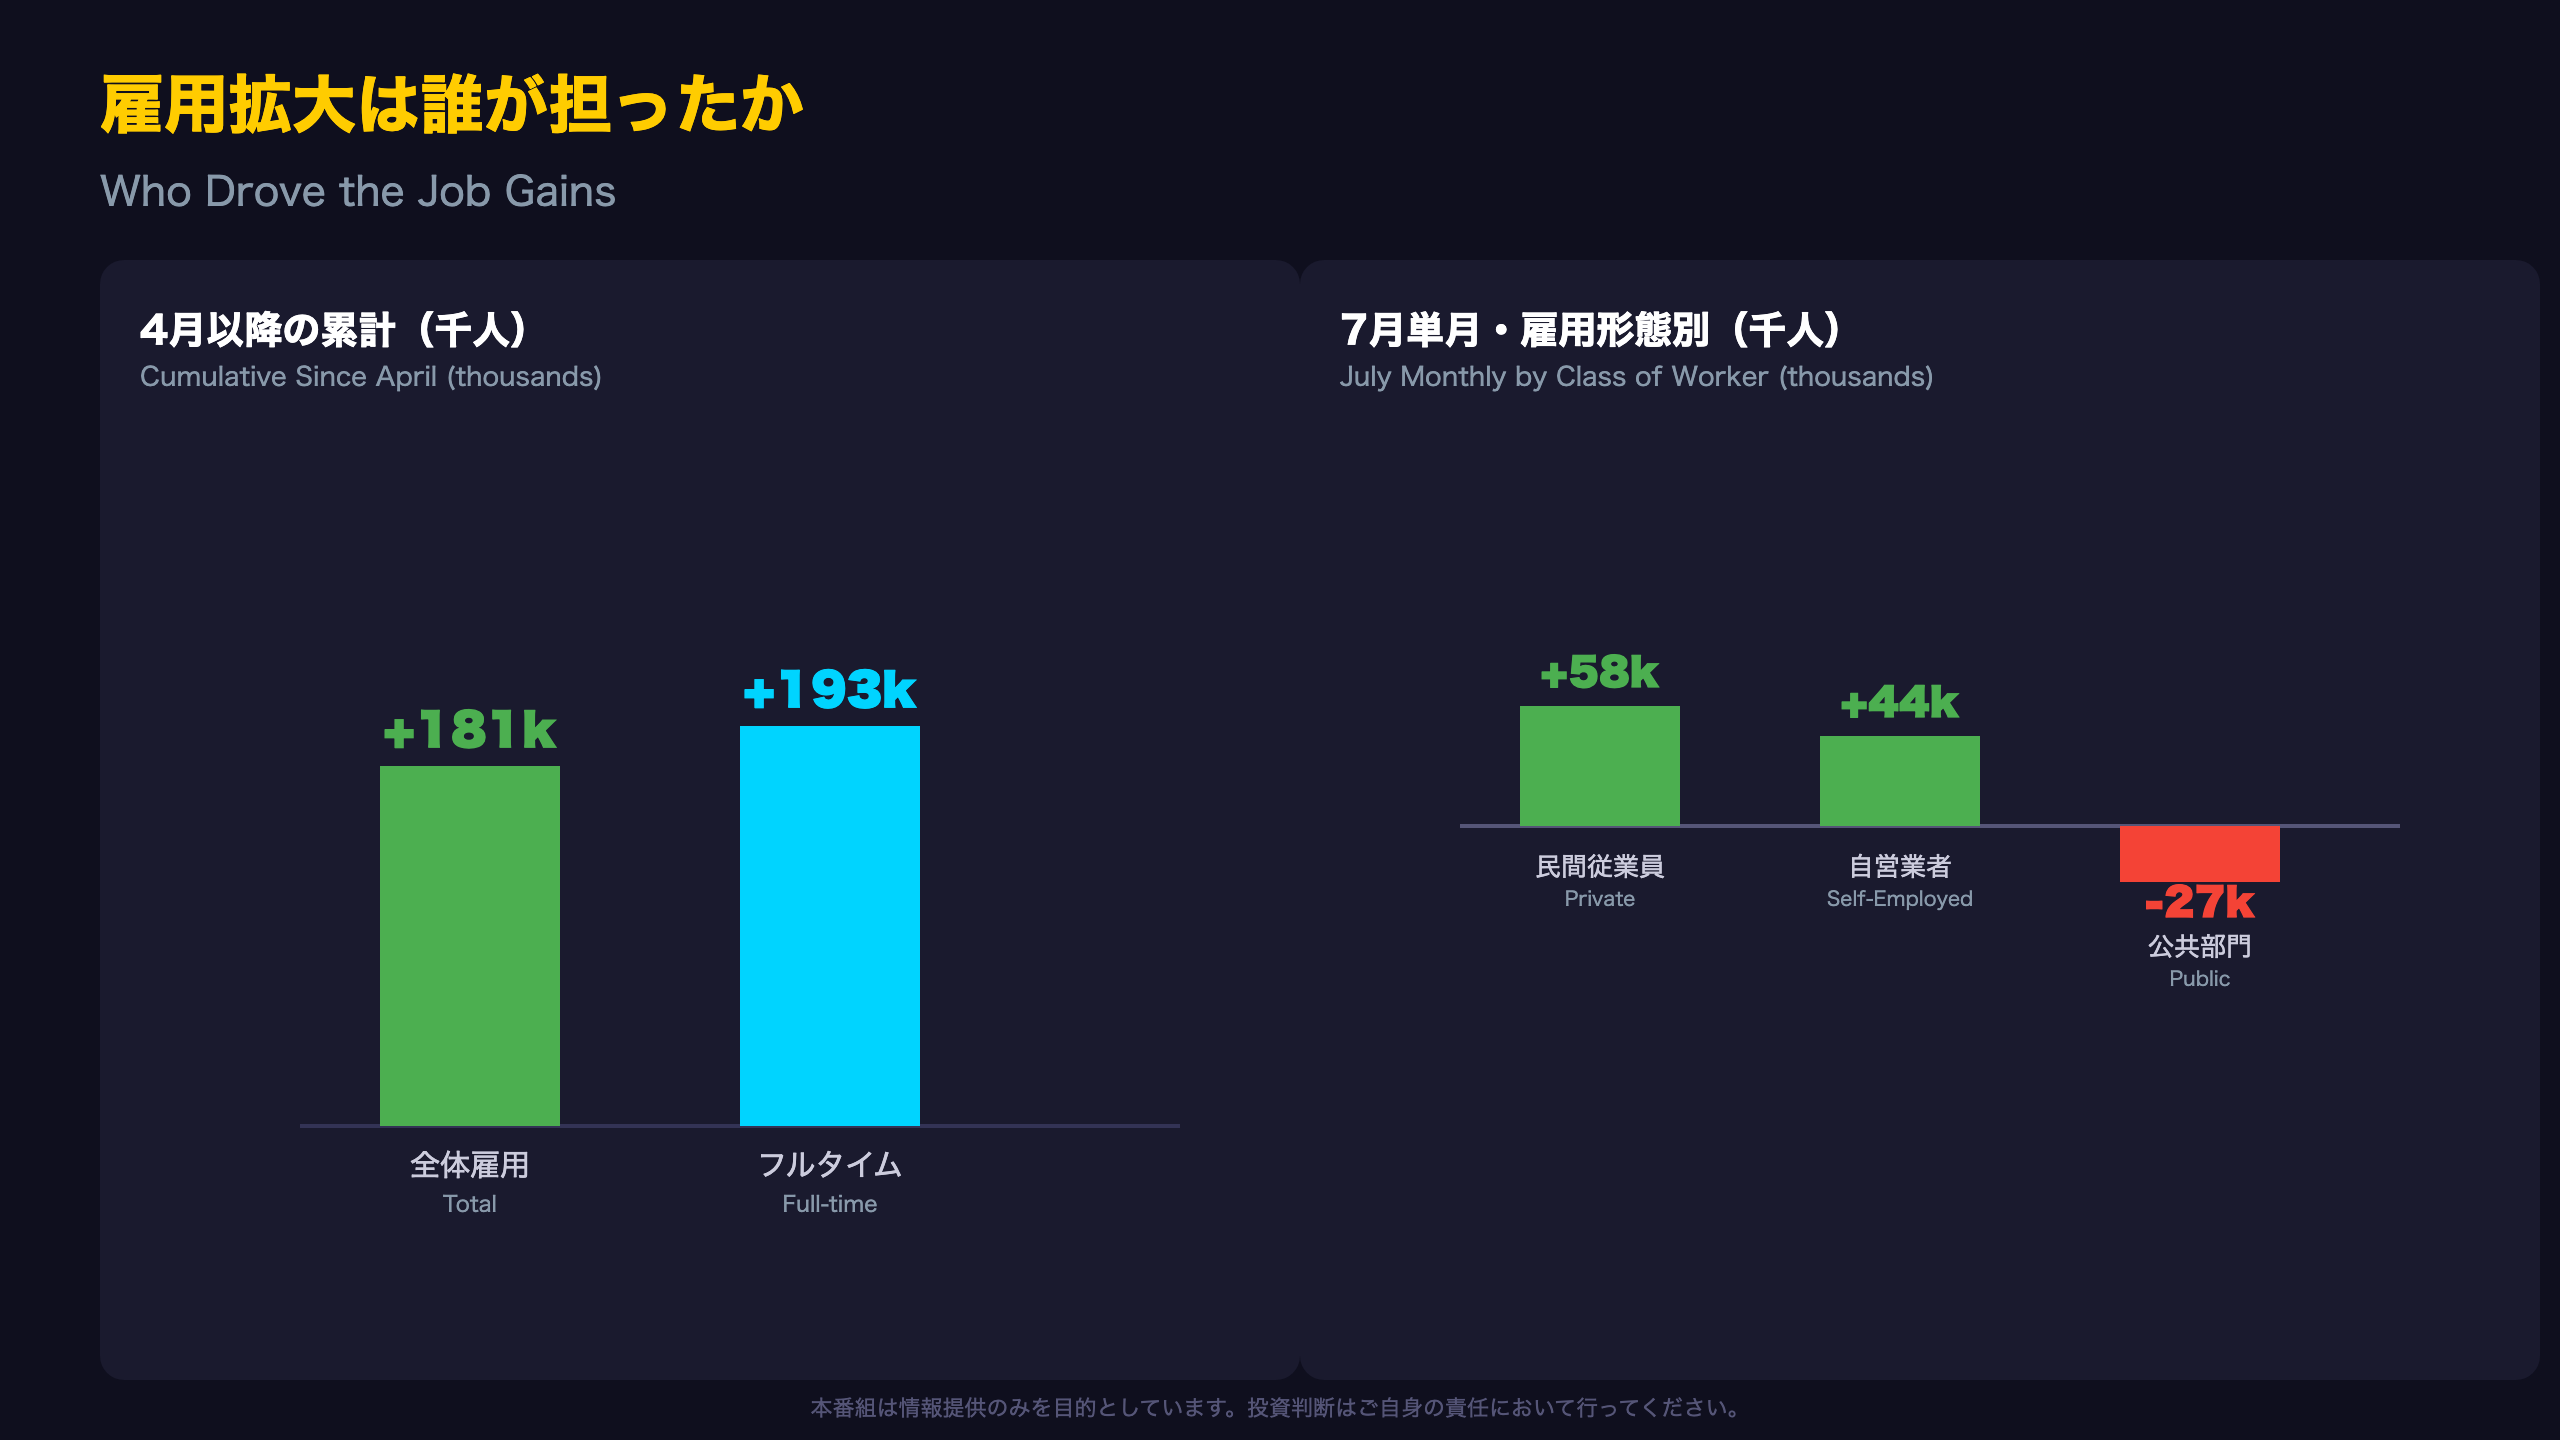
“Employment increased by 75,000 (+0.4%) in July, with gains split between full-time and part-time work. Since April, total employment was up by 181,000 (+0.9%), driven by a rise in full-time work (+193,000; +1.1%).”
Important Caveat
The report does not disclose the specific full-time/part-time breakdown for the single month of July — only the cumulative since-April figure (+193,000 full-time). Readers should avoid over-interpreting July’s monthly quality from this cumulative number alone.
Class-of-Worker Breakdown (July, monthly)
| Category | Change | Rate |
|---|---|---|
| Private employees | +58,000 | +0.4% |
| Self-employed | +44,000 | +1.6% |
| Public employees | -27,000 | -0.6% |
Self-employment’s +1.6% monthly pace is the strongest of the three categories, and cumulative since April it is up 73,000 (+2.7%) — a notably brisk trend for Canada, where self-employment growth is often counter-cyclical.
Bull vs. Bear
Bulls see this as evidence of self-sustaining private-sector expansion, less reliant on government hiring. However, whether the -27,000 public-sector drop reflects a one-off fiscal/administrative adjustment or a structural downsizing trend cannot be determined from this single data point — an important distinction for the Bank of Canada’s assessment of underlying labour demand.
失業率低下はコア女性層と若年層が牽引
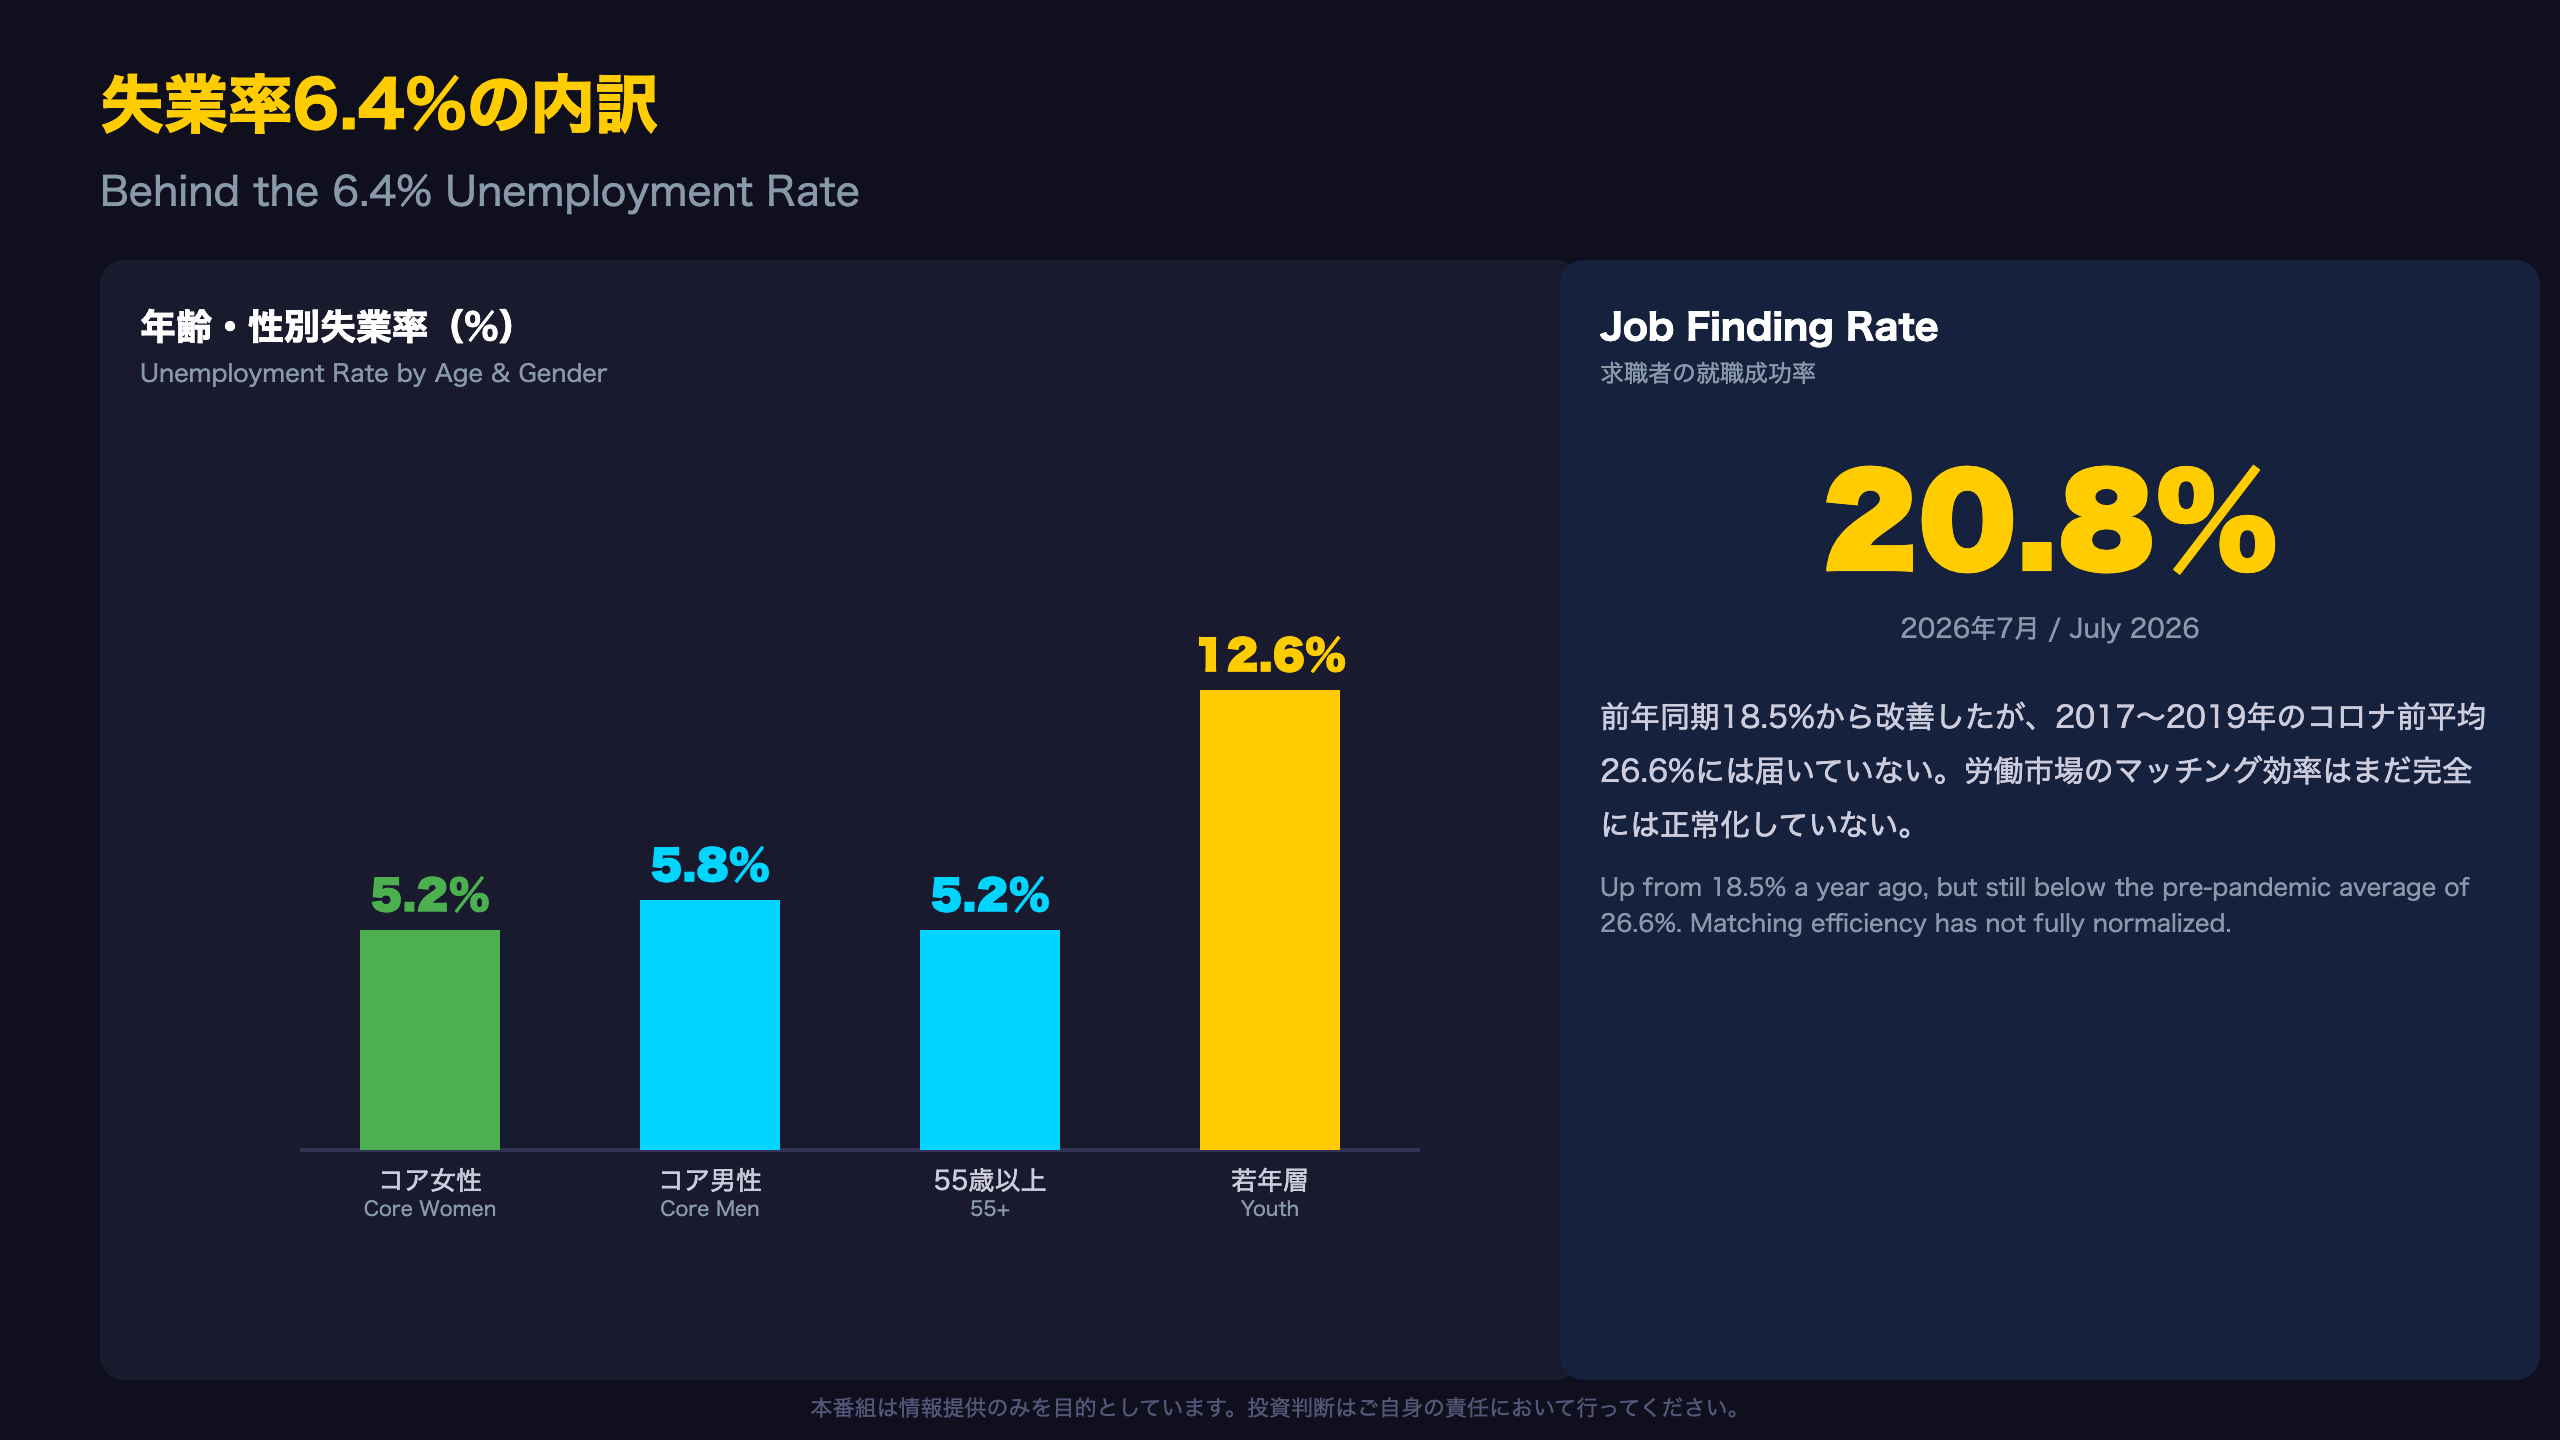
Who Is Driving the Unemployment Decline
From the release:
“Among core-aged women (25 to 54 years old), the unemployment rate fell 0.3 percentage points to 5.2% in July, coinciding with an increase in employment for this group (+33,000; +0.5%).”
Breakdown by Age and Gender
| Group | Unemployment Rate | Change |
|---|---|---|
| Core-age women (25-54) | 5.2% | -0.3pt |
| Core-age men (25-54) | 5.8% | Little changed |
| 55 and older | 5.2% | Little changed |
| Youth (15-24) | 12.6% | -0.1pt |
The employment rate for core-age women climbed to 81.2% (+0.4pt, +1.1pt YoY), now above the 2017-2019 pre-pandemic average of 79.1% — a notable milestone. Core-age men’s employment rate, at 86.5%, is essentially flat and matches the pre-pandemic average of 86.4%, showing limited further room for improvement in that cohort.
Youth Disparities by Group
The data reveals meaningful gaps among racialized youth cohorts: Black youth unemployment stood at 22.6% (barely changed from 23.4% a year earlier), Chinese youth at 15.4% (down 5.1pt YoY), and South Asian youth at 13.9% (down 3.2pt YoY). This divergence is a structural feature worth monitoring for policymakers focused on labour market equity — a dimension the Bank of Canada does not typically factor into rate decisions but which matters for broader economic assessments.
Job-Finding Rate: Still Below Normal
At 20.8% (vs. 18.5% a year ago), the job-finding rate has improved but remains well below the pre-pandemic (2017-2019) average of 26.6% — suggesting labour market matching efficiency has not fully normalized even as headline unemployment falls.
業種は卸小売・金融・建設が牽引、州はオンタリオ・BCが主導
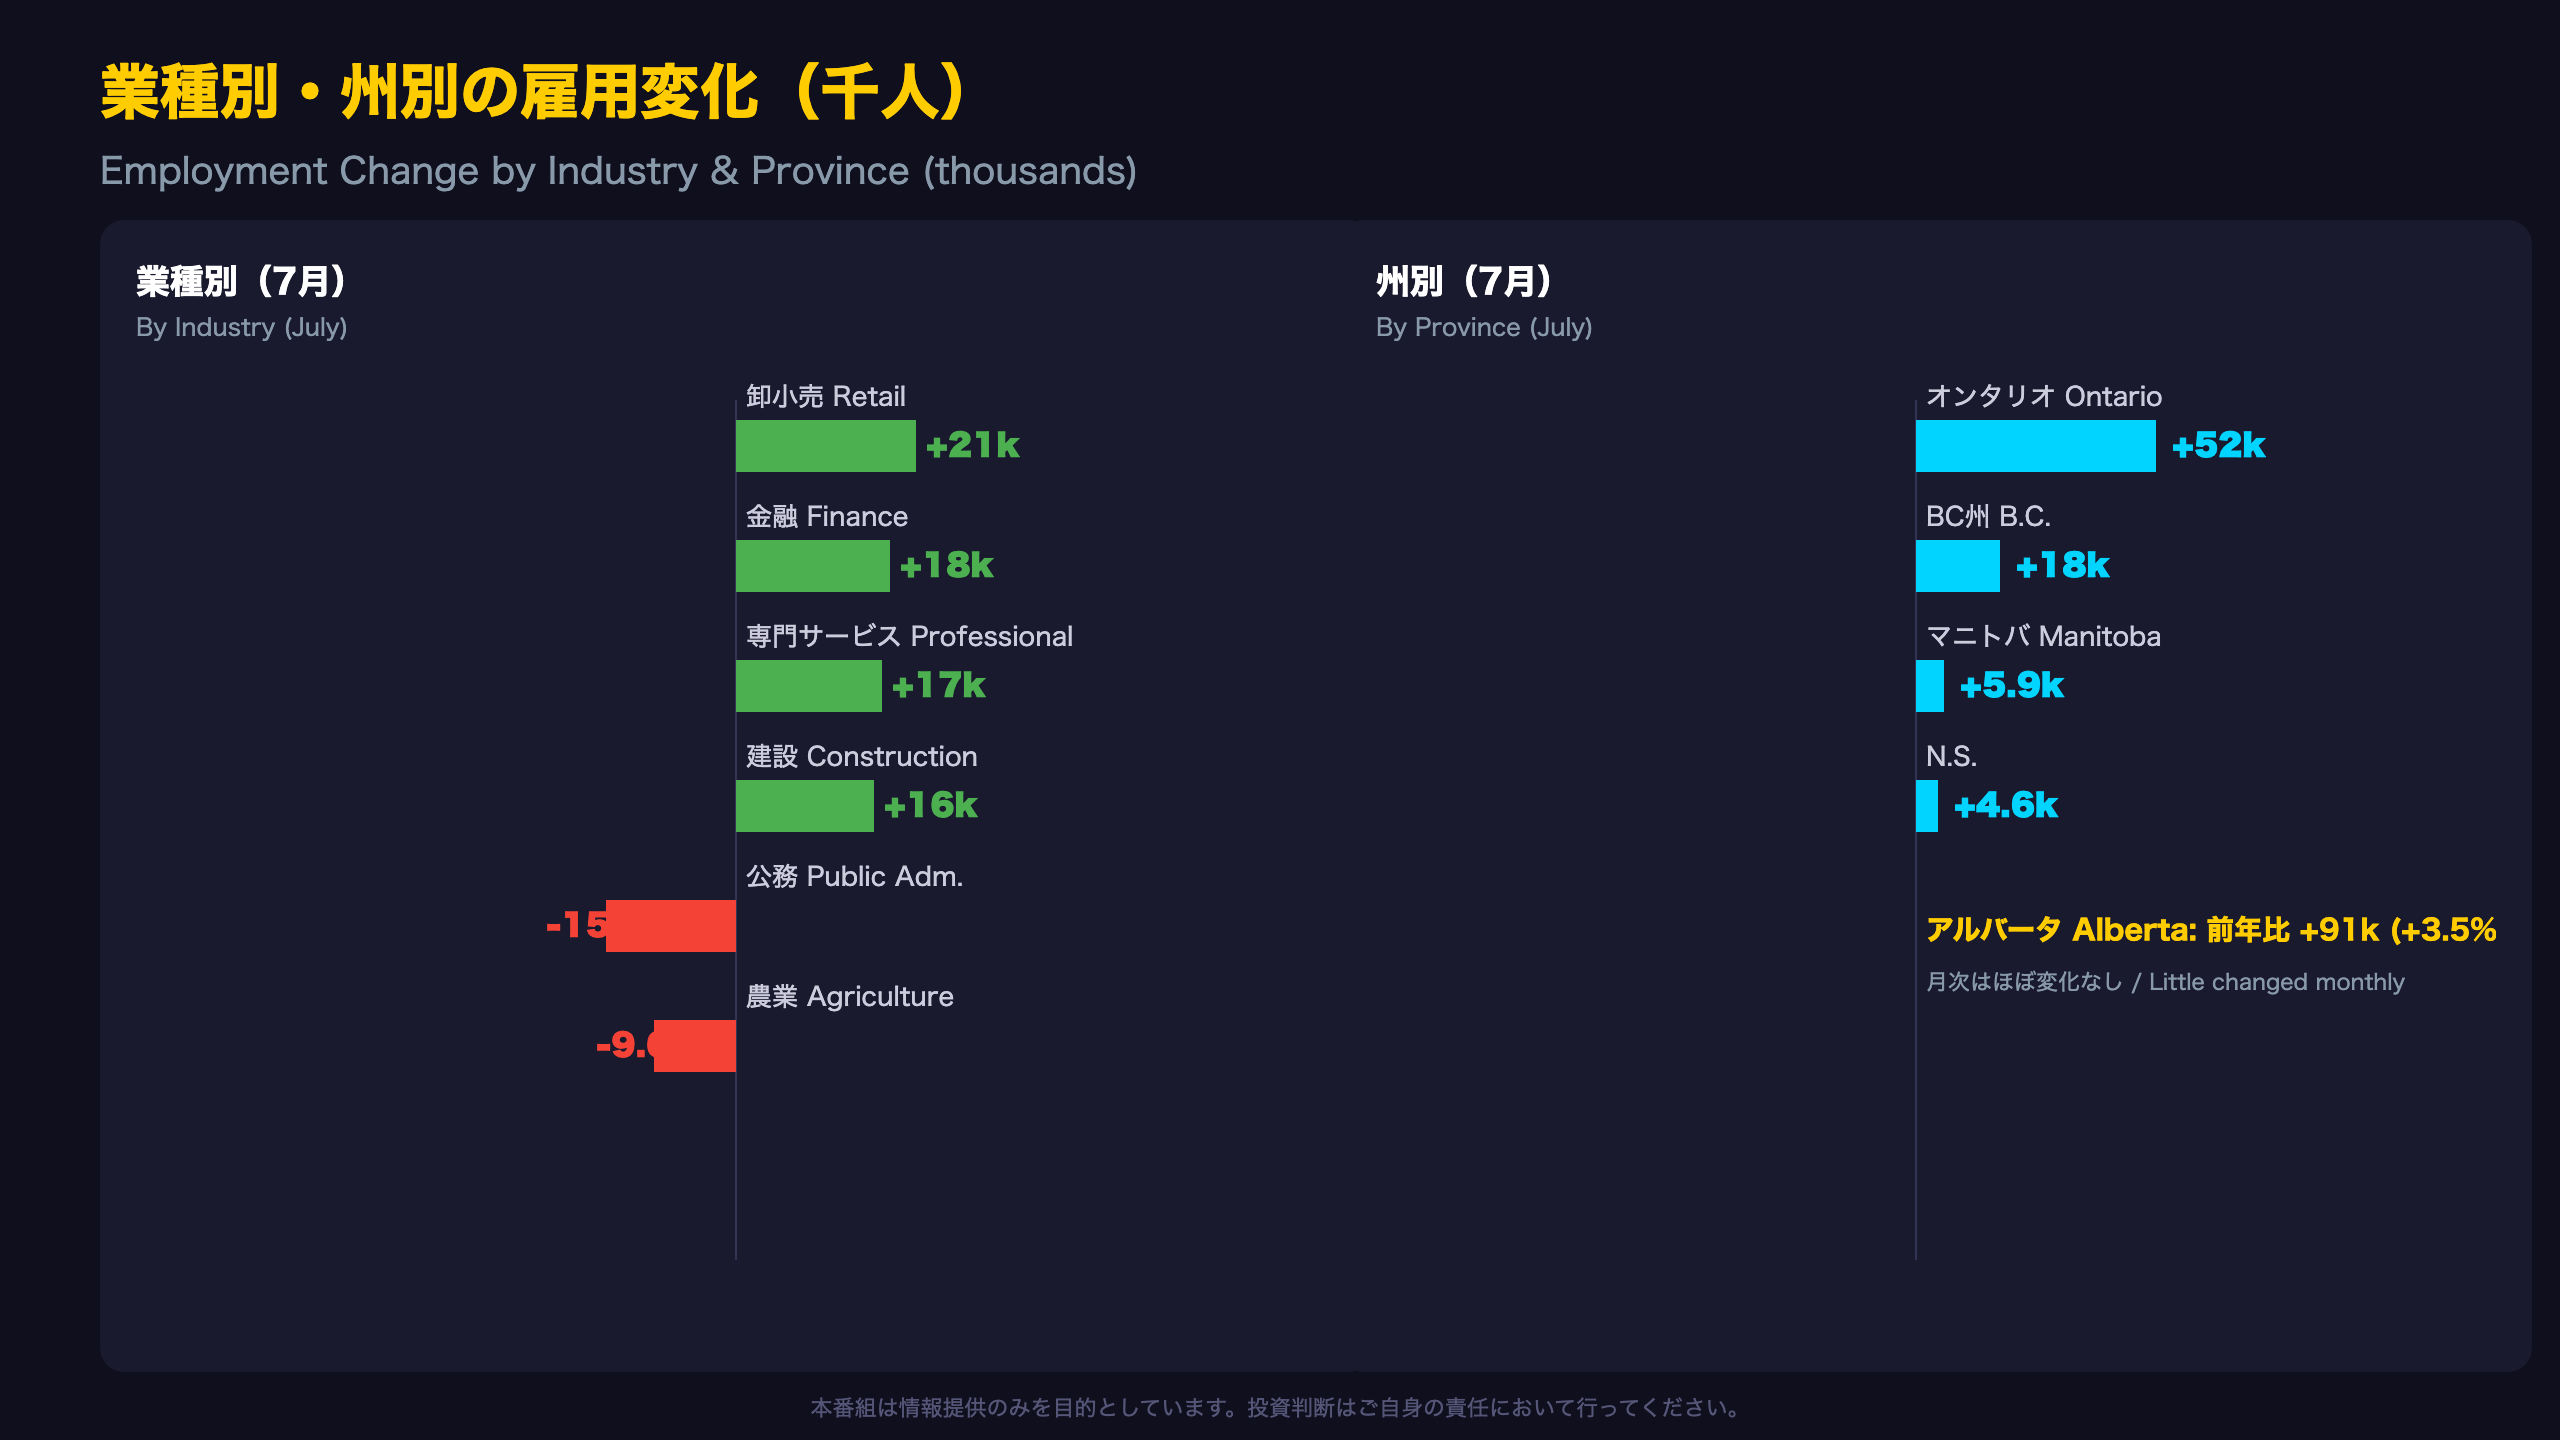
Industry and Regional Heatmap
Sector Strength
“Wholesale and retail trade (+21,000; +0.7%) recorded the largest employment increase across industries in July.”
Notably, despite the monthly gain, wholesale and retail trade employment is still down 50,000 (-1.7%) year-over-year, reflecting a downward trend that persisted from January through May 2026. Finance, professional services, and construction all posted monthly gains but were “little changed” year-over-year — meaning this month’s strength has not yet translated into a confirmed multi-month trend reversal.
Provincial Detail
- Ontario: +52,000, unemployment 6.8% (-0.2pt), down sharply from a recent high of 7.9% in December 2025 — its lowest rate since July 2024.
- British Columbia: +18,000, unemployment 6.2%, down for a second straight month from May’s recent high of 6.8%.
- Manitoba: +5,900, its first monthly increase since March; unemployment 5.0%, matching April’s level.
- Nova Scotia: +4,600, second consecutive monthly gain; up 12,000 (+2.4%) year-over-year.
- Quebec: Little changed, unemployment steady at 5.6%.
- Alberta: Little changed monthly, but +91,000 (+3.5%) YoY — the largest proportional gain of any province, with unemployment at 7.0%, down 0.9pt from a year ago.
CMA Comparison
Among Canada’s three largest metro areas, Montréal’s unemployment rose 0.7pt to 6.6%, Vancouver’s fell 0.6pt to 6.0%, and Toronto’s was little changed at 6.7% — though sharply down from a recent high of 9.0% in July 2025. For currency traders, Ontario’s outsized share of Canada’s economy (roughly 40% of GDP) means its labour trends often move CAD sentiment more than smaller provinces.
時給上昇率2.8%に減速、BOCが注視するインフレ関連指標
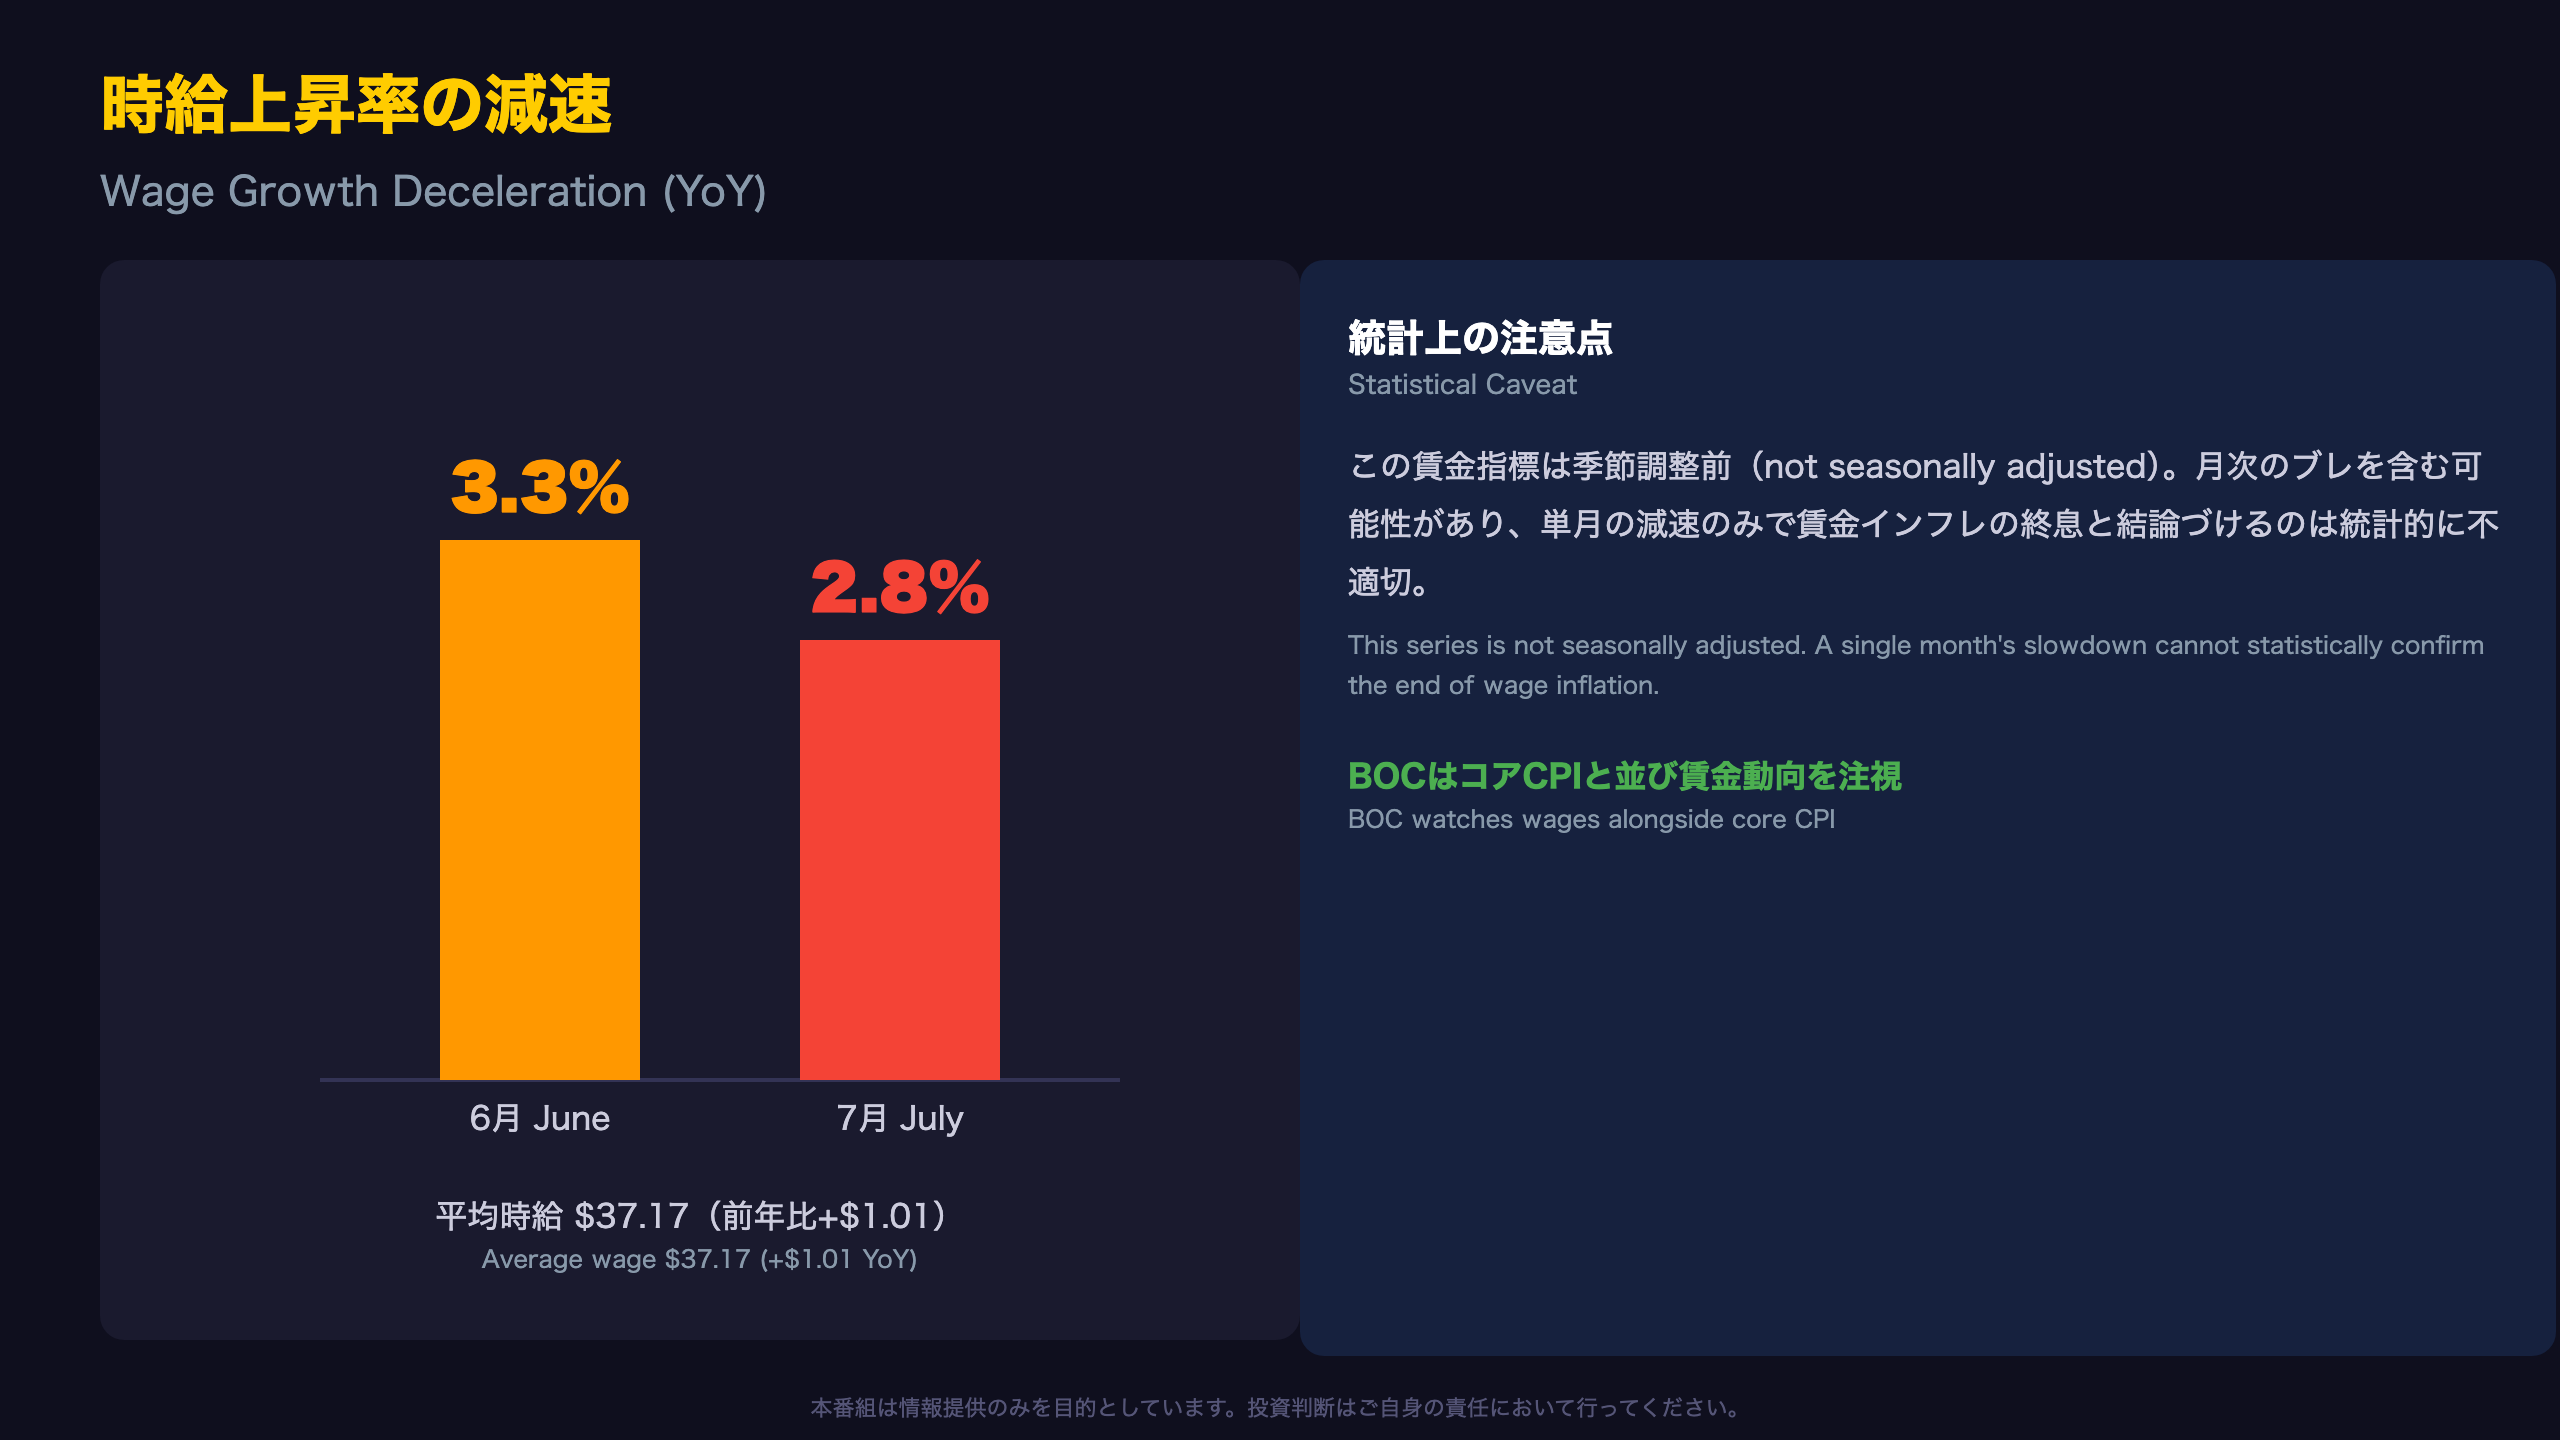
Reading the Wage Data Correctly
From the release:
“Average hourly wages among employees were up 2.8% (+$1.01 to $37.17) on a year-over-year basis in July, following growth of 3.3% in June (not seasonally adjusted).”
A Key Statistical Caveat
This wage series is explicitly not seasonally adjusted — unlike the headline unemployment rate and employment figures. That means bonus-payment timing, industry-mix shifts, and other seasonal noise could be embedded in the month-to-month change. Concluding that “wage inflation is ending” from one month of unadjusted data would overstate the statistical confidence the release actually supports.
Comparison with Student Wage Data
Interestingly, returning students (ages 15-24) saw:
“For those who were employees, their average weekly wages were $523.05, up 2.9% compared with 12 months earlier.”
At 2.9%, student wage growth is essentially in line with the 2.8% headline figure — suggesting wage pressure among younger workers is not diverging meaningfully from the broader trend.
What This Means for the Bank of Canada
For context, U.S. Federal Reserve officials watch the Employment Cost Index and Average Hourly Earnings similarly to how the BOC tracks this LFS wage series alongside core CPI. A deceleration to 2.8% — while employment rises and unemployment falls — could suggest lingering labour market slack even as headline metrics improve. This is a Level-B inference (multiple indicators pointing the same direction), not a certainty: the data alone cannot confirm the BOC’s next rate decision.
Looking Ahead
The next release lands September 4, 2026. Whether August’s unadjusted wage growth extends the slowdown below 2.8% or rebounds will be an important signal for whether this is a genuine trend or monthly noise.
失業率6.4%は「引き締まりも崩れず」— BOCへの含意
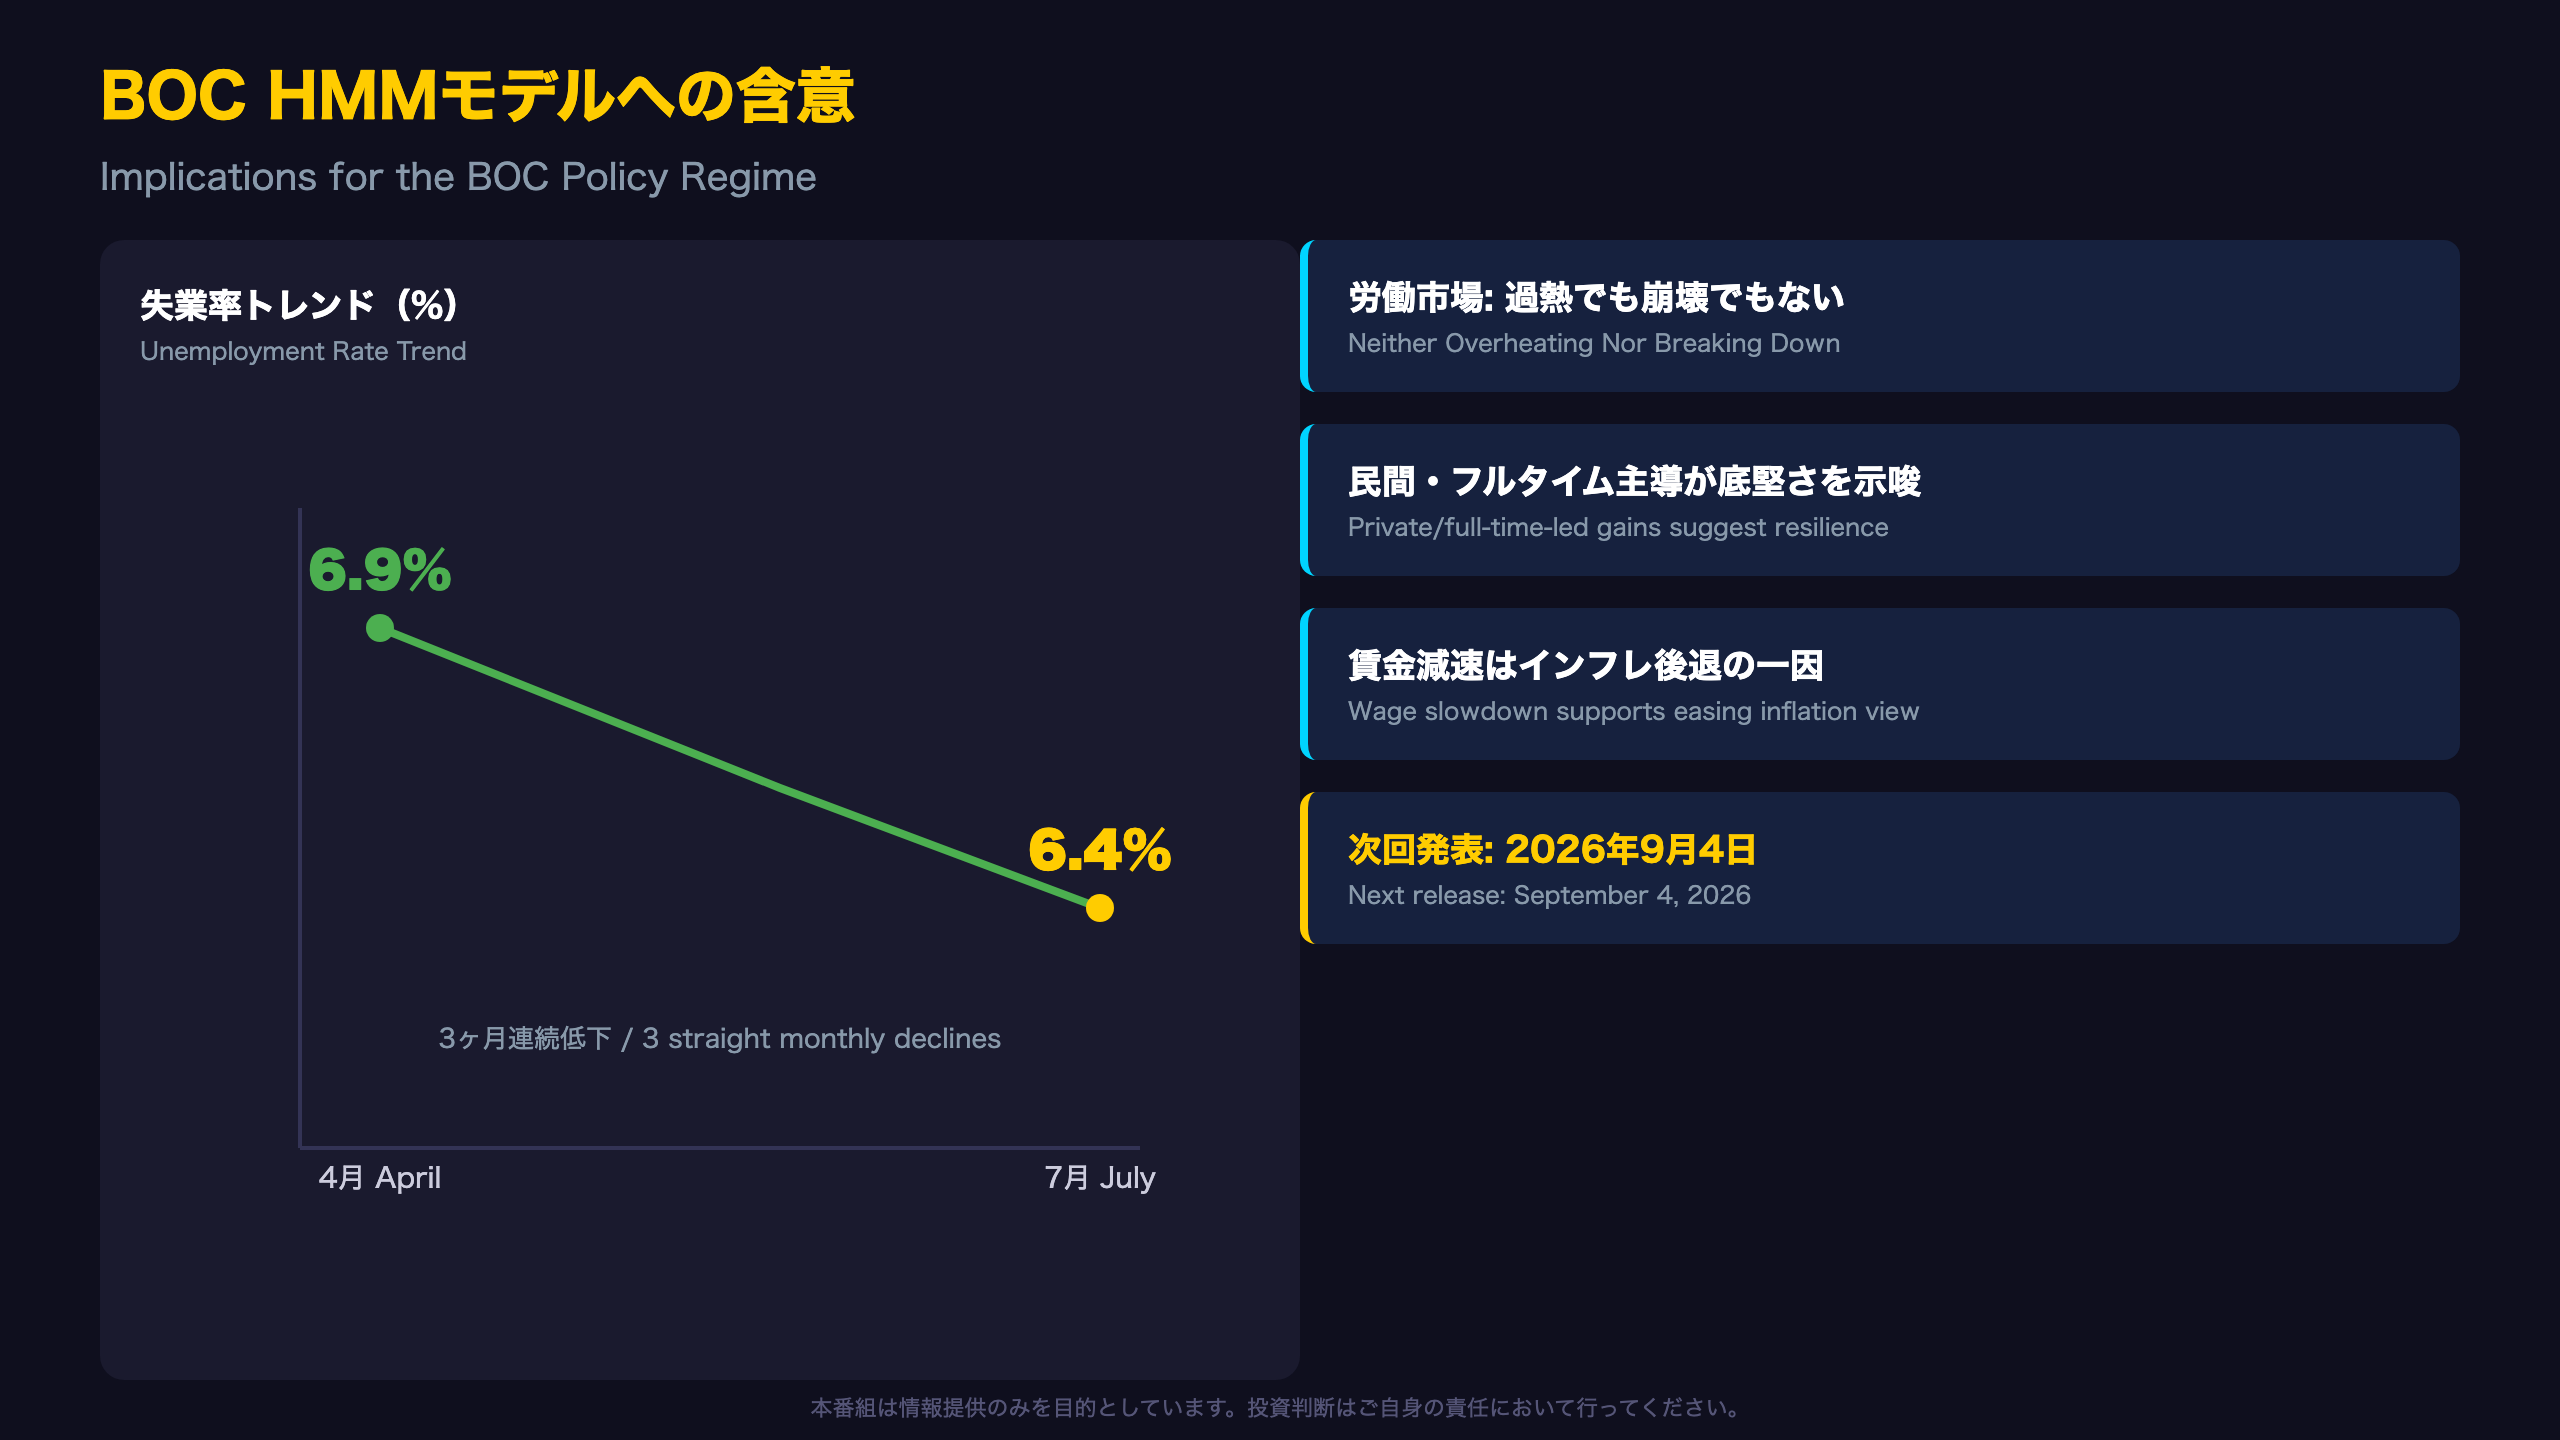
Connecting to the BOC’s Policy Regime Assessment
Quantifying the Unemployment Trend
From the release: “the unemployment rate…has fallen by 0.5 percentage points since April.” Working backward, April’s rate was 6.4% + 0.5pt = 6.9%.
| Period | Unemployment Rate |
|---|---|
| April 2026 | 6.9% |
| July 2026 | 6.4% (3rd straight monthly decline) |
Chain of Reasoning (Market Implications)
“Unemployment fell for a third straight month to 6.4%, a two-year low” → “the labour market is tightening gradually without signs of overheating” → “conditions may be forming that allow the BOC to maintain its current gradual policy stance.” Generally, a labour market that stays resilient while wage inflation cools is considered a favorable combination for central banks — but this single dataset cannot confirm the BOC’s specific decision at its next meeting.
What This Means for CAD
“Wage growth slowed to 2.8% YoY (from 3.3% in June)” → “this is one input suggesting easing core inflation pressure” → “generally considered supportive of a continued dovish-leaning stance, though this data point alone cannot determine currency direction.”
For the Hidden Markov Model Framework
As an observed variable feeding models like the BOC’s hidden Markov regime-detection framework, a clean three-month downtrend in unemployment (6.9% → 6.4%) is a stronger signal than a single monthly print — it reduces the probability weight on a “labour market deterioration” regime and modestly increases confidence in a “stable/improving” regime classification.
Looking Ahead
The next release is September 4, 2026, covering August (reference week Aug 9-15). Whether unemployment holds at or below 6.4%, and whether wage growth continues decelerating below 2.8%, will determine whether this “stable middle ground” persists.
Disclaimer: This article is for informational purposes only. All investment decisions are made solely at your own risk.