📺 Watch the Full Video Analysis
This article was automatically generated by the NFC Market Live AI analysis system. (Updated: 2026-06-25 21:14 JST)
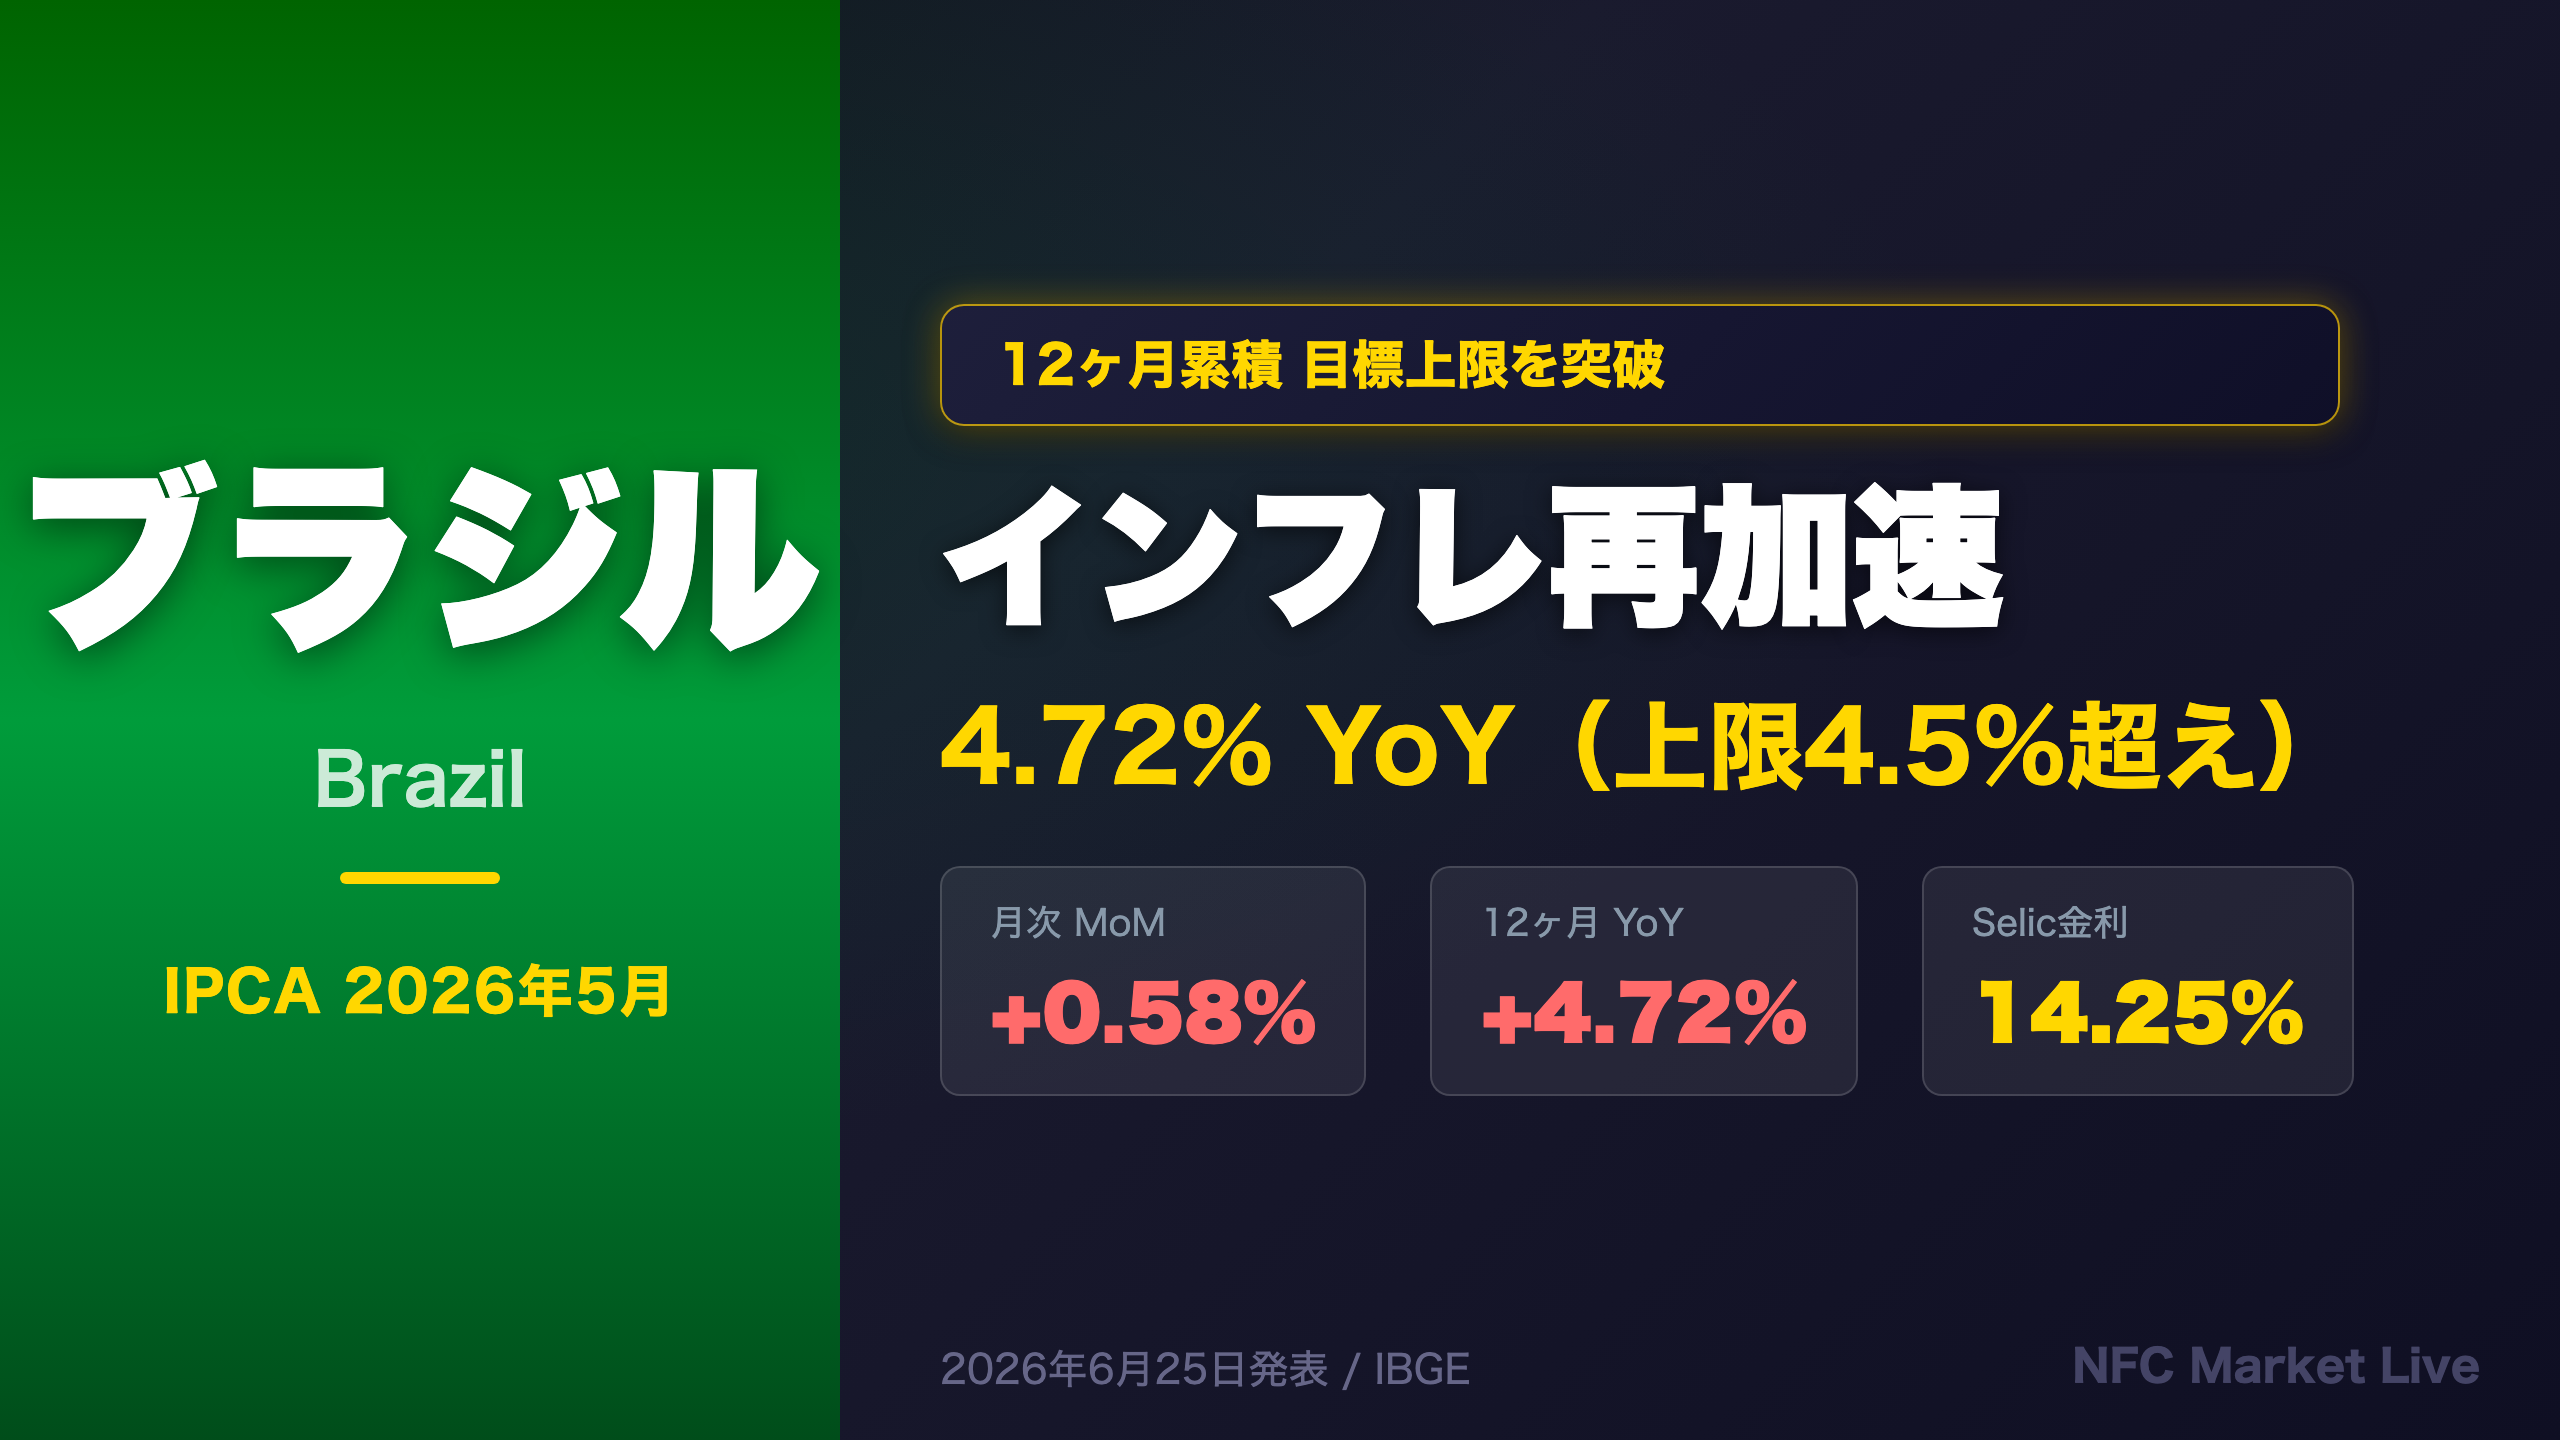
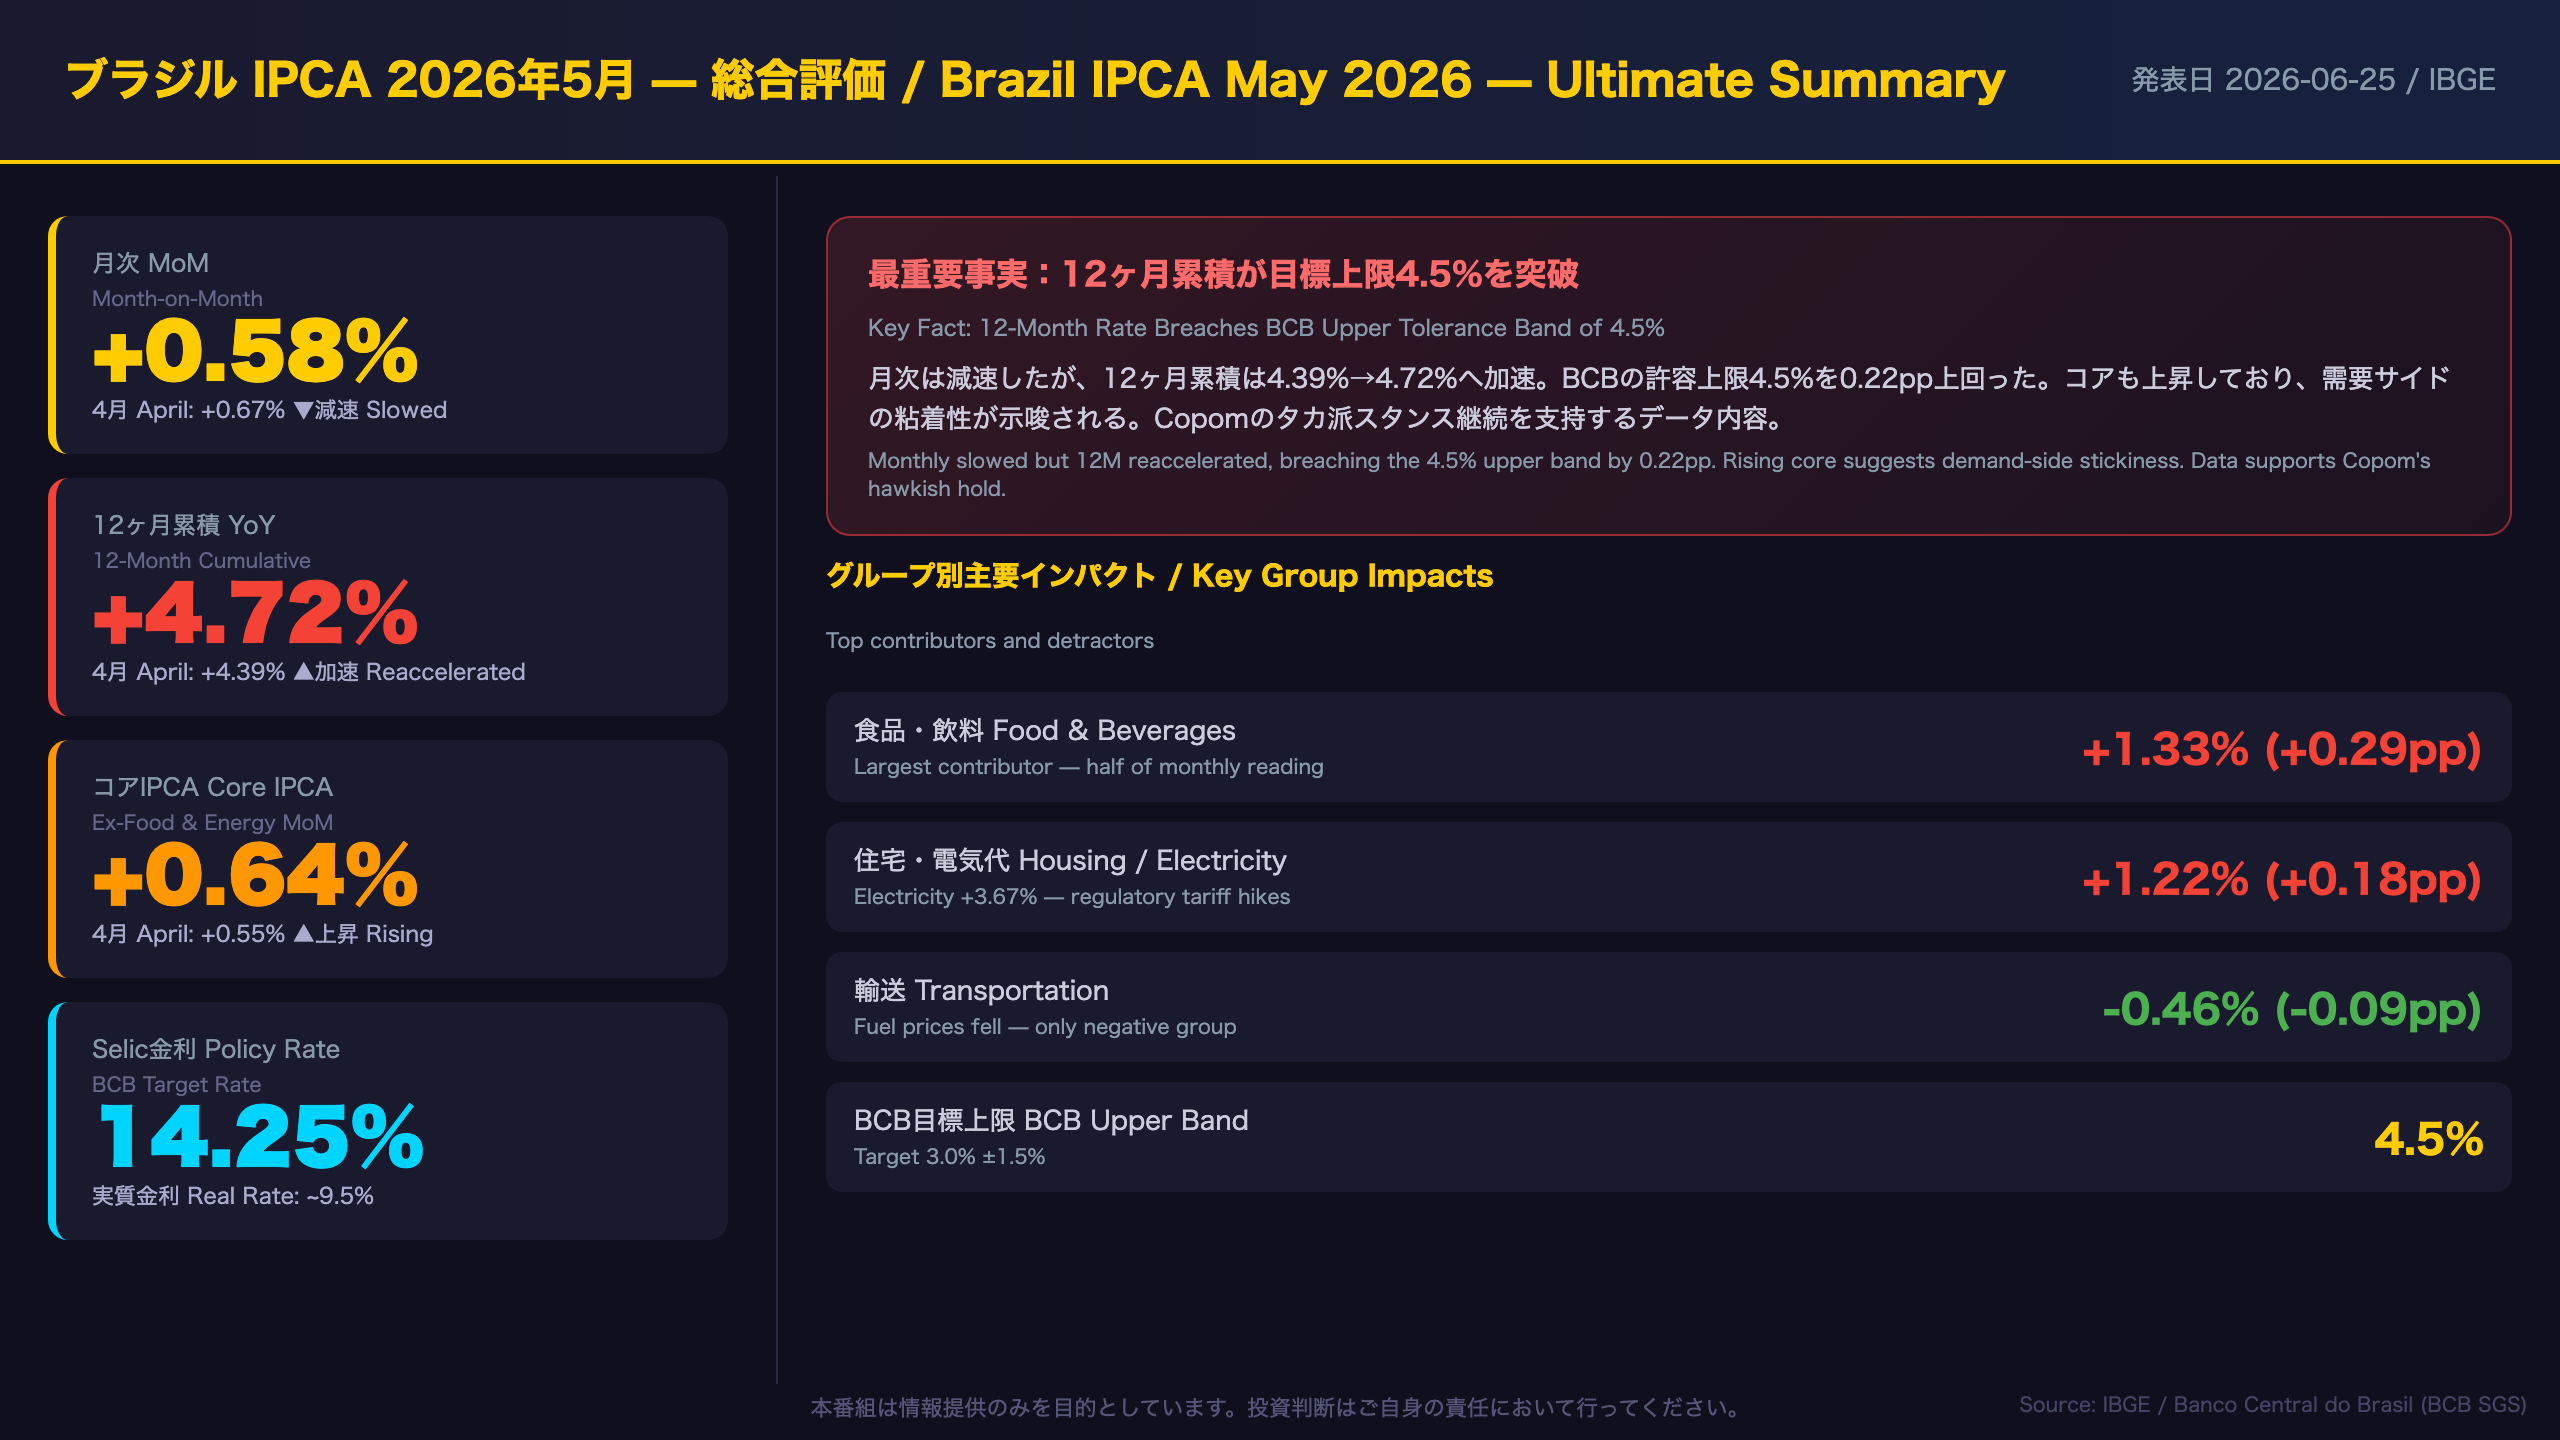
Brazil’s IPCA for May 2026 came in at +0.58% MoM (down from +0.67% in April), but the 12-month cumulative rate reaccelerated to 4.72% — breaching BCB’s 4.5% upper tolerance band. Food & beverages (+1.33%) and residential electricity (+3.67%) were the main drivers. Core IPCA held firm at +0.64%. With Selic at 14.25% and real rates near 9.5%, we analyze what this means for Copom policy and BRL.
The Ultimate Summary — 5月IPCA総合評価
May 2026 IPCA: The Divergence That Matters
What Is IPCA?
IPCA (Índice Nacional de Preços ao Consumidor Amplo) is Brazil’s official broad consumer price index, calculated monthly by IBGE (Instituto Brasileiro de Geografia e Estatística — Brazil’s national statistics agency). It covers households earning 1 to 40 minimum wages and spans 16 metropolitan regions. The BCB (Banco Central do Brasil) uses IPCA as the primary benchmark for its inflation targeting framework.
The Key Divergence
The headline monthly print of +0.58% MoM appears benign — it decelerated from April’s +0.67%. But the 12-month cumulative rate tells a different story: it reaccelerated to 4.72% YoY from 4.39%, breaching BCB’s upper tolerance band of 4.5% (target: 3.0% ±1.5%).
| Metric | May 2026 | April 2026 | May 2025 |
|---|---|---|---|
| MoM | +0.58% | +0.67% | +0.26% |
| YoY | +4.72% | +4.39% | +5.32% |
| YTD | +3.20% | — | — |
| Core MoM | +0.64% | +0.55% | — |
Structural Drivers vs. Transitory Factors
Structural (persistent) pressures:
– Core IPCA rose to +0.64% from +0.55%, suggesting demand-side inflation is not fully contained
– Food at home surged +1.65%, driven by potatoes (+44.69%), tomatoes (+20.62%), and onions (+16.80%) — partly seasonal but also reflecting supply constraints
– Residential electricity +3.67%, incorporating regulatory tariff adjustments across multiple cities
Transitory (one-off) factors:
– Transportation fell -0.46% as ethanol dropped -6.20% and gasoline -1.46% — this relief may not persist
– The base effect from May 2025’s low +0.26% print is amplifying the YoY comparison
Comparison with Global Context
Brazil’s 4.72% YoY compares unfavorably with the US Fed’s 2% target (US CPI was running near 2.3% in early 2026) but is significantly lower than Brazil’s own recent history (peak of 12.13% in April 2022). The BCB’s real policy rate of approximately 9.5% (Selic 14.25% minus IPCA 4.72%) remains among the highest globally, reflecting the central bank’s commitment to anchoring expectations.
12ヶ月累積トレンド — 再加速の構造を読む
12-Month IPCA Trend: Separating Base Effects from Structural Pressure
The Reacceleration in Context
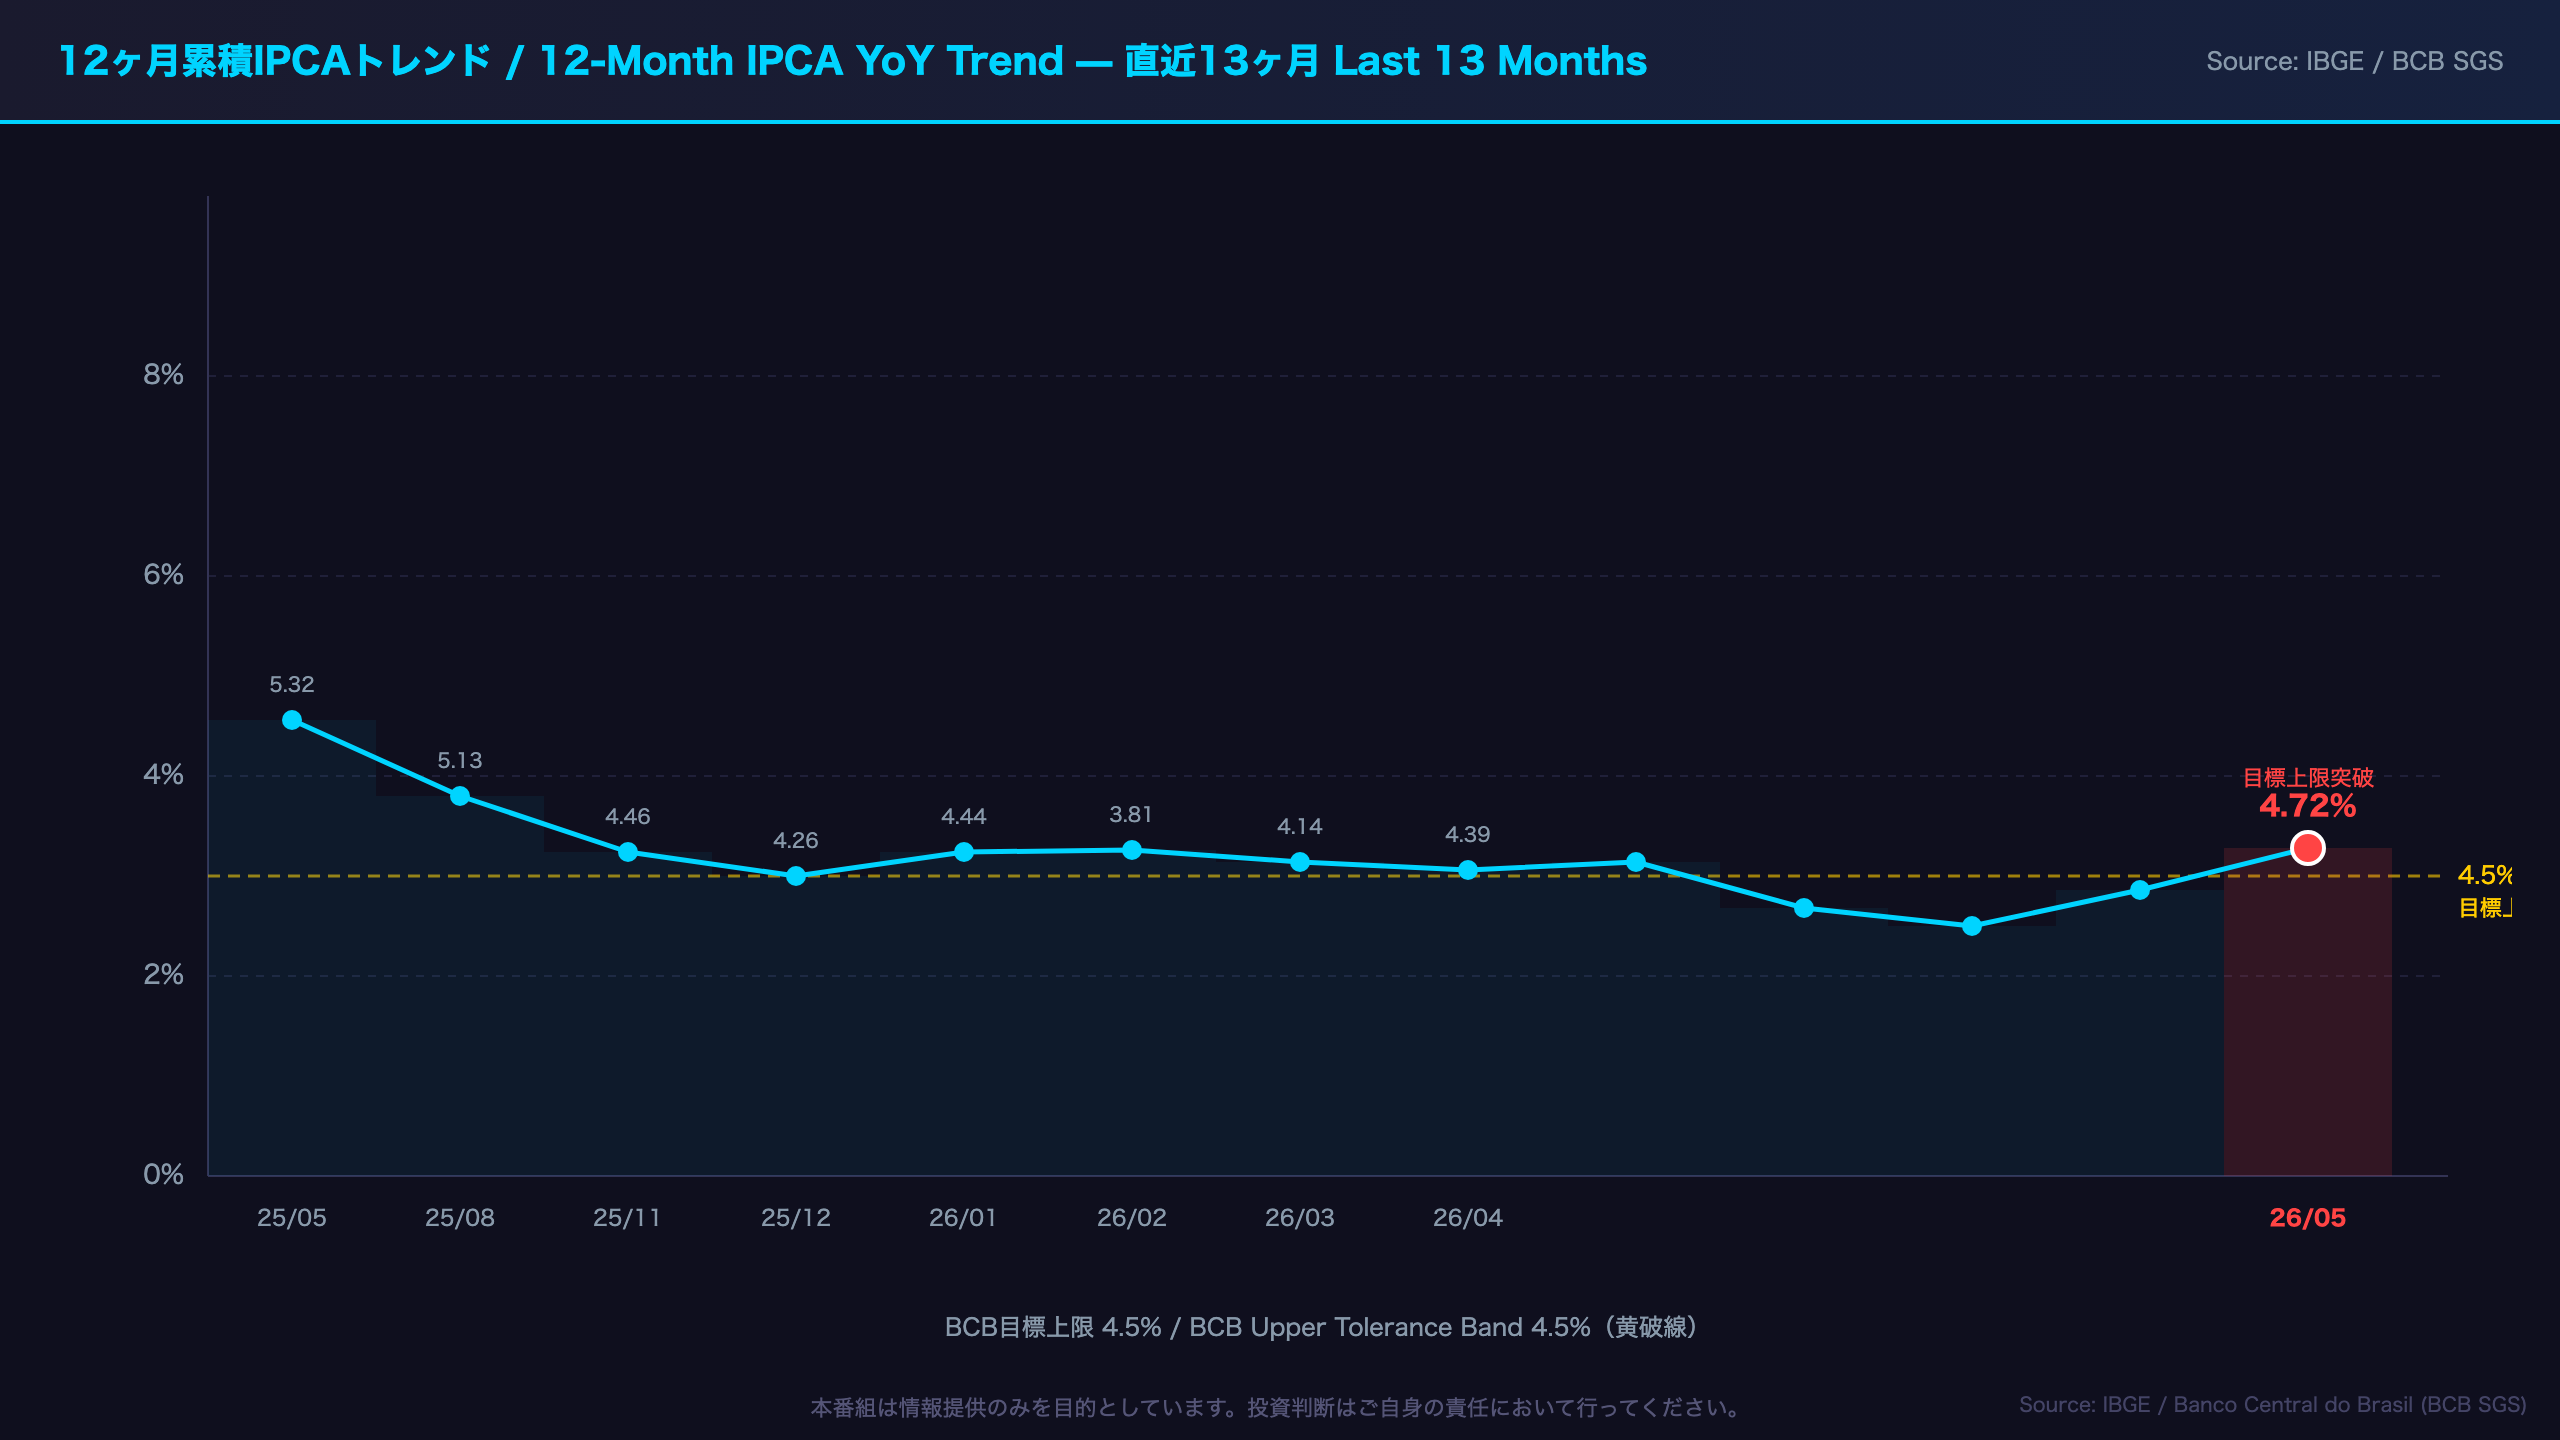
Brazil’s 12-month IPCA has now risen for three consecutive months, from 4.14% in March to 4.39% in April to 4.72% in May 2026. This breach of BCB’s 4.5% upper tolerance band is notable, but understanding why it happened is critical for assessing whether it represents a structural deterioration or a statistical artifact.
Base Effect Mechanics
A significant portion of the YoY reacceleration reflects base effects — the mathematical consequence of comparing current prices against an unusually low baseline from 2025. Key data points:
- May 2025 MoM: +0.26% vs. May 2026 MoM: +0.58% — the 0.32pp gap directly inflates the YoY comparison
- August 2025 printed -0.11% MoM — as this negative month rolls off the 12-month window in August 2026, it will mechanically push YoY higher
- June–July 2025 were also subdued (+0.24%, +0.26%), suggesting continued upward base-effect pressure through mid-2026
Is This Structural or Transitory?
The honest answer is: both elements are present.
Base-effect driven (transitory): The YoY acceleration from 4.39% to 4.72% is partly mechanical. If monthly prints stabilize around 0.40–0.50%, the 12-month rate could plateau or even decline in H2 2026 as higher 2025 base months re-enter the window.
Structural (persistent): Core IPCA rising from 0.55% to 0.64% MoM is harder to dismiss. Core inflation excludes food and energy, so this uptick reflects underlying demand conditions — services inflation, wages, and domestic consumption — which are less responsive to commodity price swings.
Historical Perspective for International Investors
For investors unfamiliar with Brazil’s inflation history: the country experienced hyperinflation exceeding 2,000% annually in the early 1990s. The 1994 Plano Real stabilization brought inflation to single digits for the first time in decades. Today’s 4.72% YoY, while above target, represents a fundamentally different and far more stable macroeconomic environment. The relevant comparison is not the 1990s but rather Brazil’s own inflation targeting era (post-1999), where the upper band breach is a policy signal rather than an existential threat.
グループ別内訳 — 食品・電気代 vs 燃料の綱引き
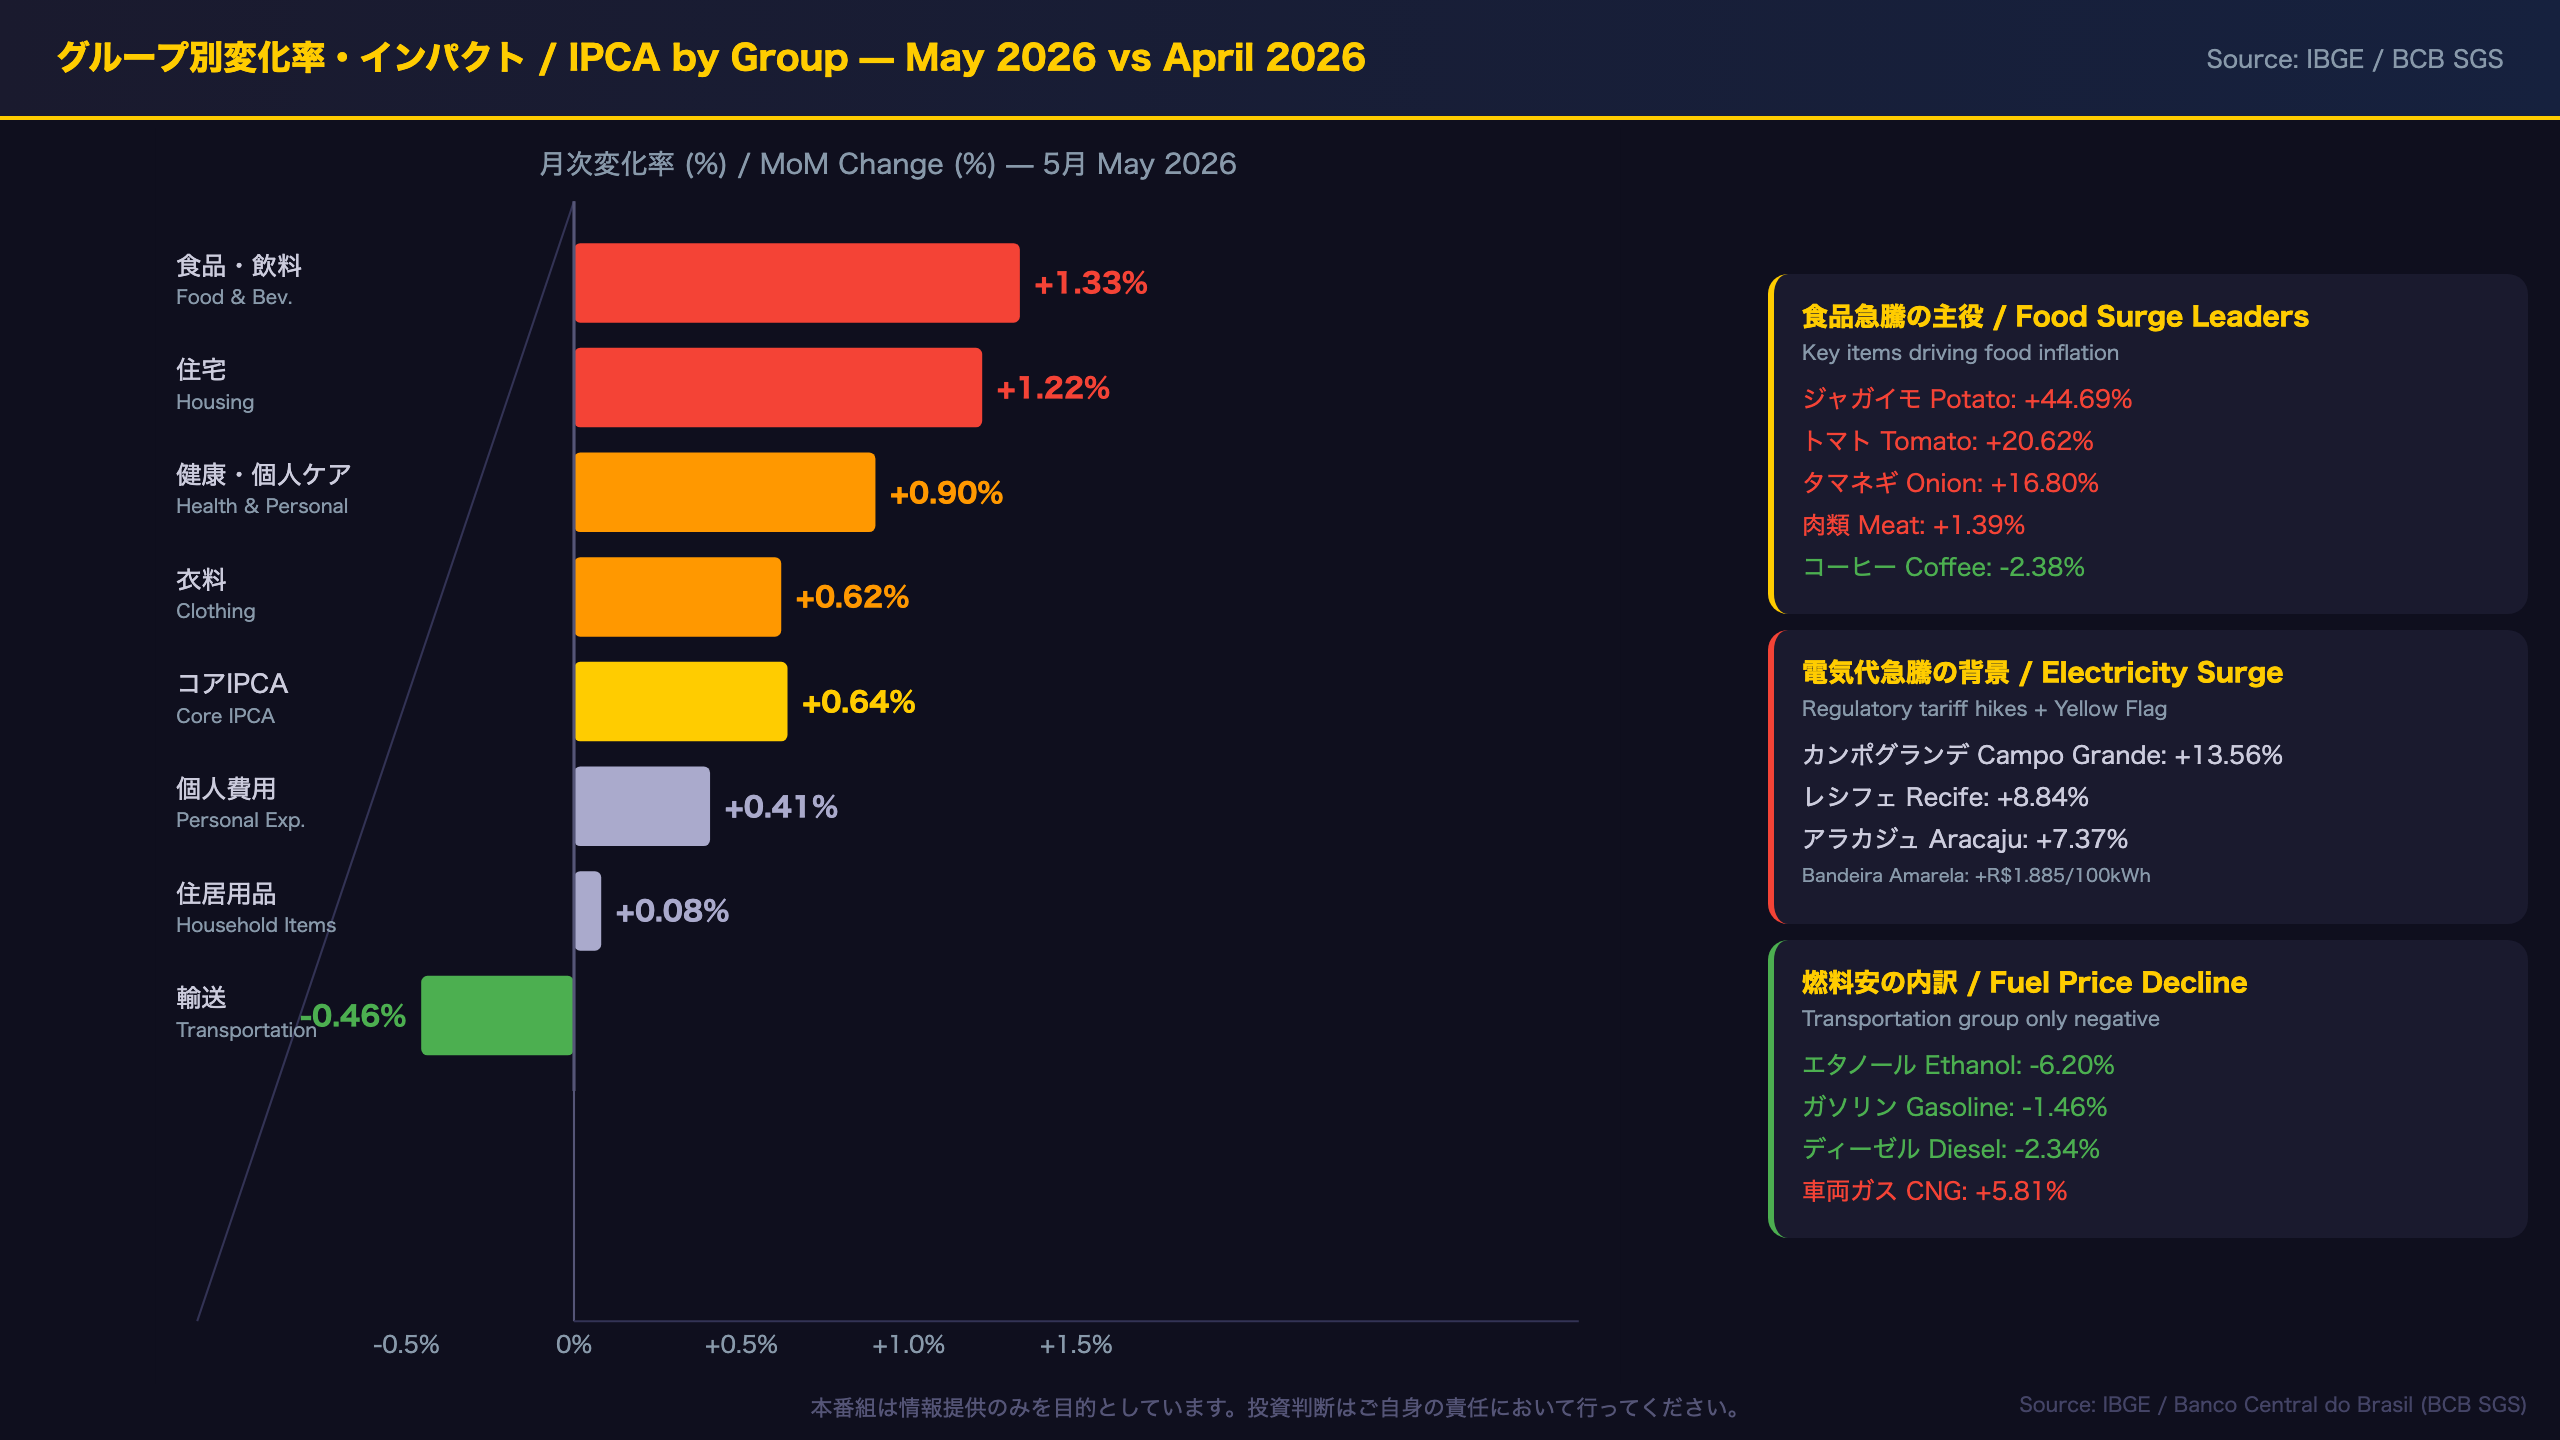
Group-by-Group Breakdown: Food & Electricity vs. Fuel — A Structural Tug-of-War
The Dominant Driver: Food & Beverages
Food and beverages contributed 0.29 percentage points to May’s 0.58% reading — exactly half of the entire monthly inflation. This concentration of inflationary pressure in a single group is significant for two reasons:
-
Food inflation disproportionately affects lower-income households, which spend a larger share of their budget on food. The INPC (a narrower index covering households earning 1–5 minimum wages) also showed food products at +1.33% in May, confirming broad-based food pressure across income groups.
-
Vegetable price spikes are often transitory but can persist if supply disruptions continue. Potatoes +44.69%, tomatoes +20.62%, and onions +16.80% are extreme single-month moves that likely reflect seasonal supply constraints rather than structural demand shifts. However, meat prices +1.39% are more indicative of sustained demand.
Electricity: Regulatory Tariff Concentration
Residential electricity rose 3.67% in May, contributing 0.15pp — the single largest individual item impact of the month. This was driven by regulatory tariff adjustments (reajustes tarifários) across multiple cities:
- Campo Grande: +13.56% (effective April 24)
- Recife: +8.84% (effective April 29)
- Aracaju: +7.37% (effective April 22)
- Fortaleza: +6.94% (effective April 22)
Additionally, the Bandeira Amarela (Yellow Flag) tariff surcharge was in effect during May, adding R$1.885 per 100 kWh consumed. Brazil’s electricity tariff system uses a “flag” mechanism (green/yellow/red) to signal reservoir levels and adjust consumer bills accordingly. The Yellow Flag represents a moderate surcharge level.
The Fuel Relief: Durable or Temporary?
Transportation’s -0.46% reading was driven by ethanol (-6.20%) and gasoline (-1.46%). Ethanol prices in Brazil are closely linked to sugarcane harvest cycles and the relative price competitiveness with gasoline. The sharp ethanol decline in May may reflect seasonal harvest dynamics. Whether this fuel relief persists into June–July will be a key variable for the next IPCA reading.
コアIPCA vs ヘッドライン — 需要インフレの粘着性
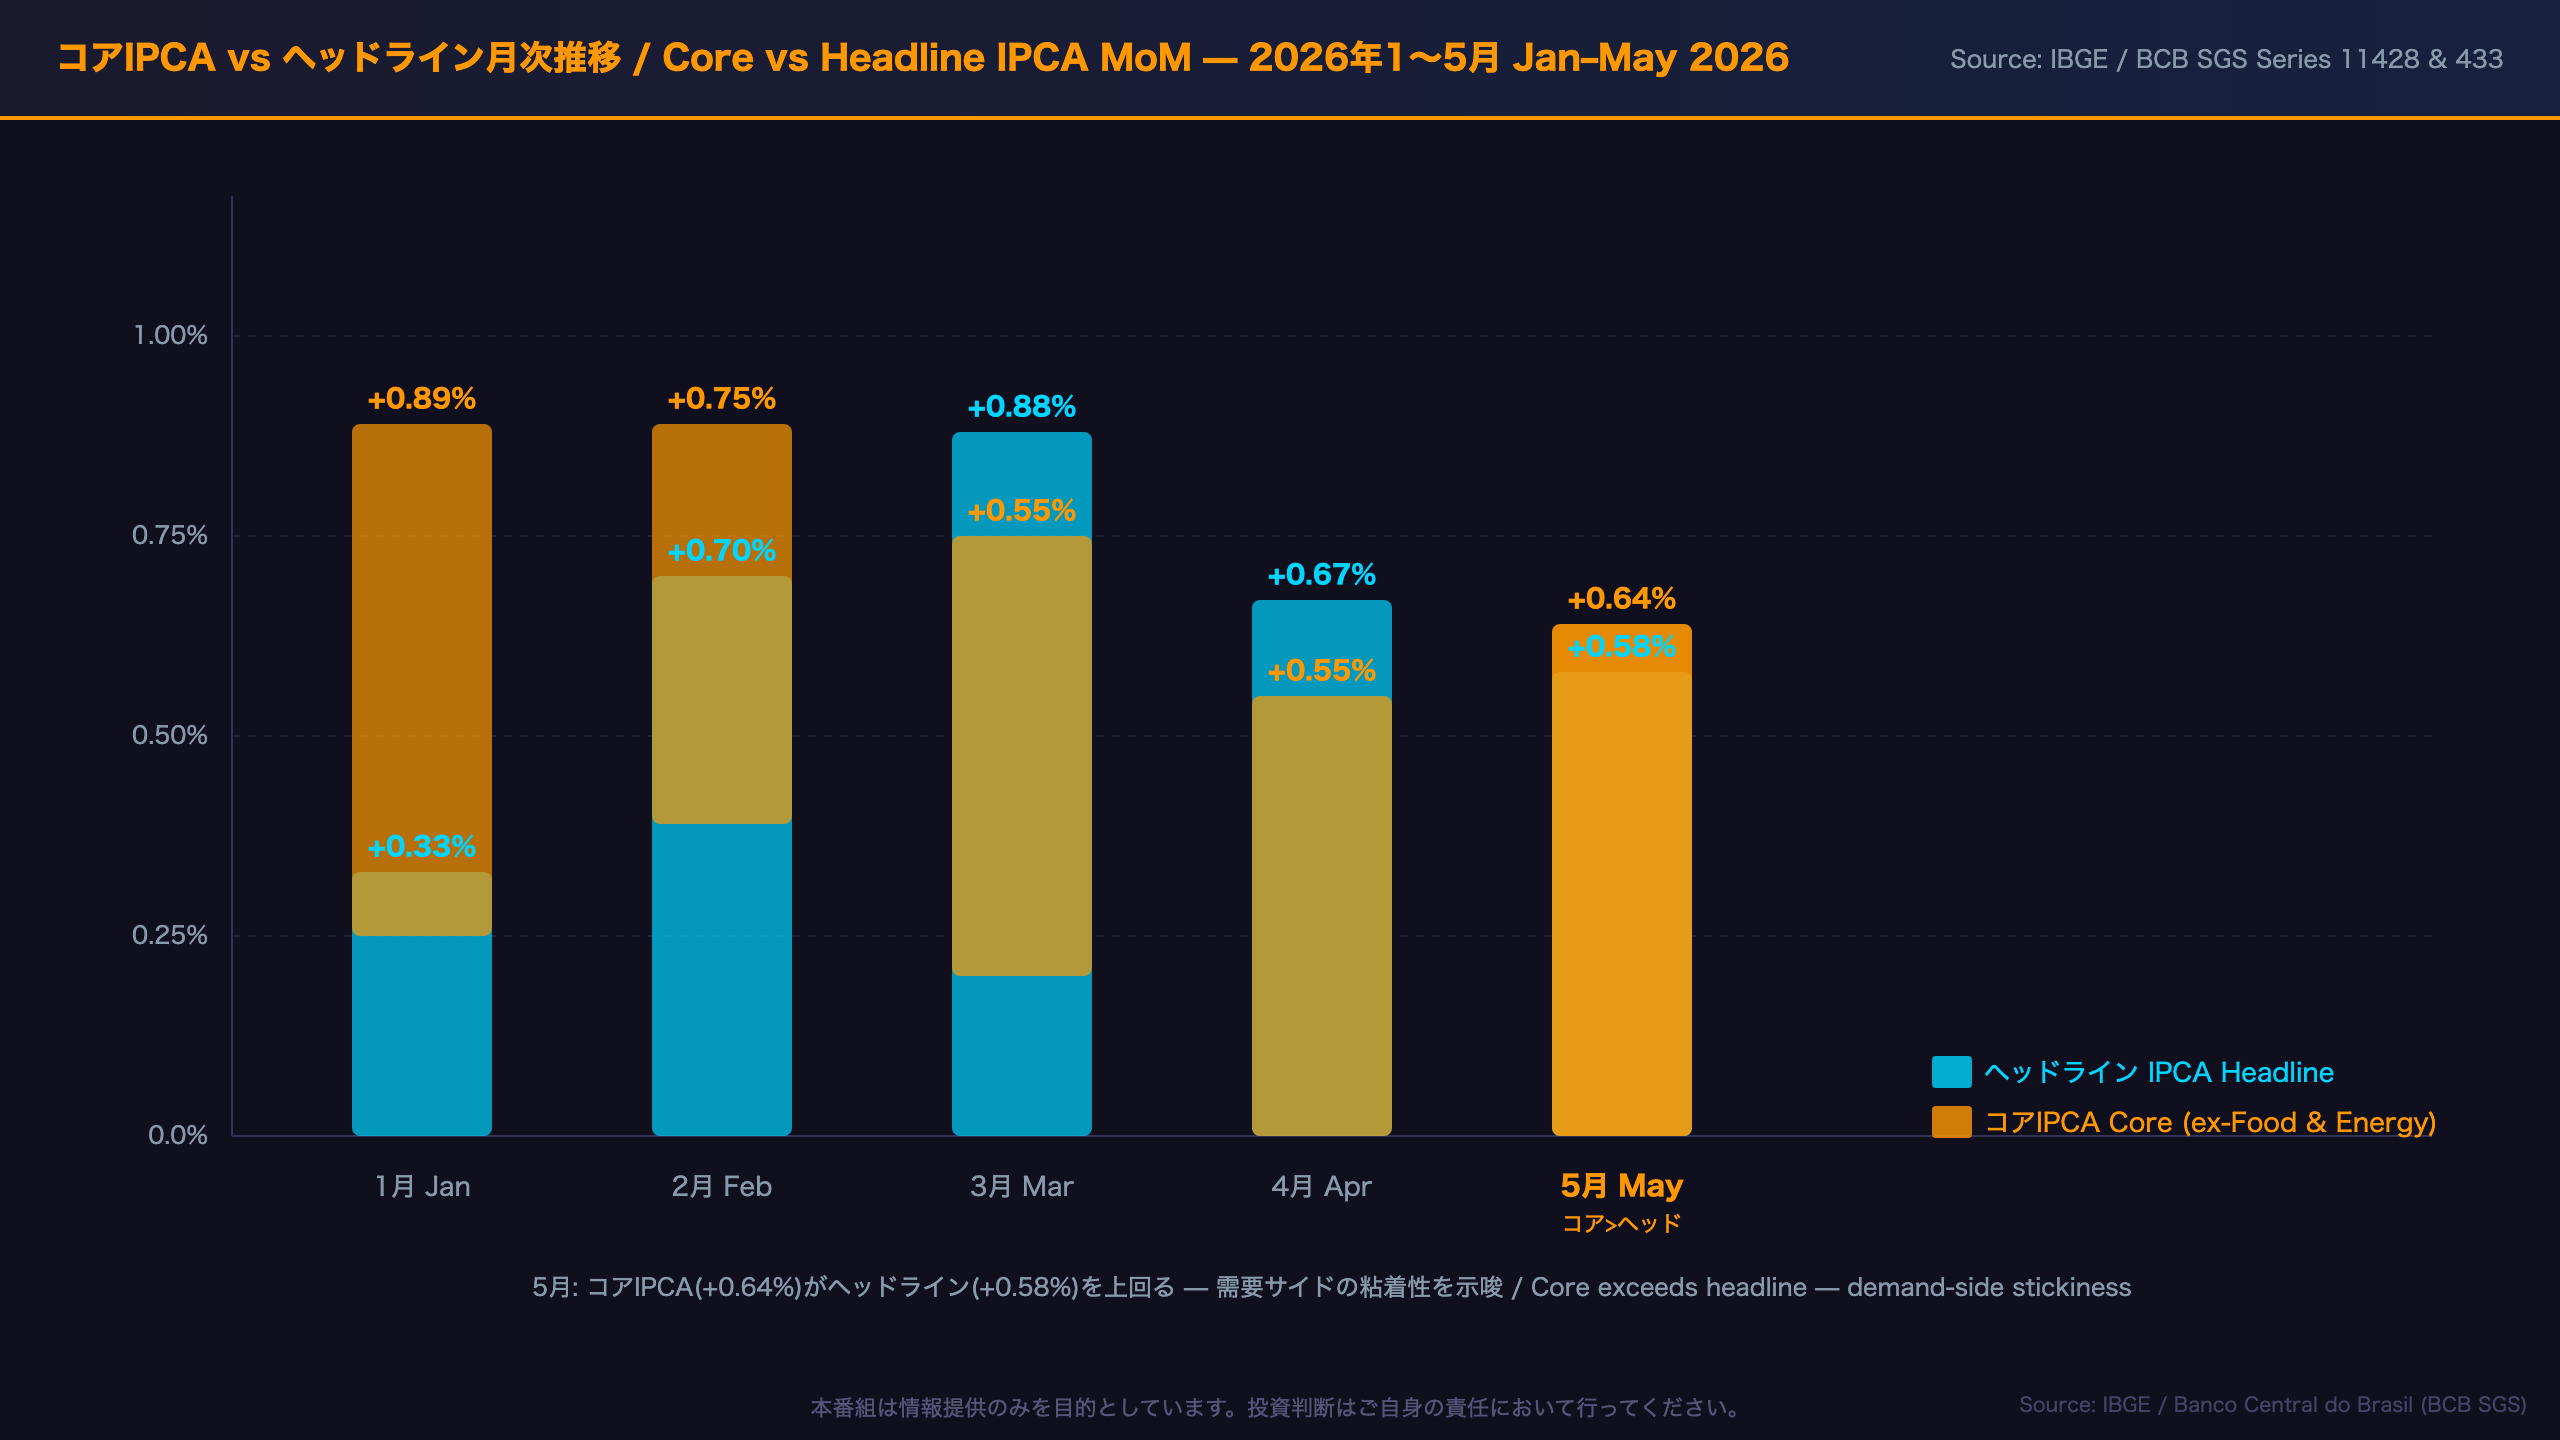
Core IPCA Deep Dive: Measuring the Stickiness of Demand-Side Inflation
Why Core Matters More Than Headline
For central bank watchers, core inflation is often more informative than the headline reading because it strips out the volatile food and energy components that can swing dramatically due to weather, commodity cycles, or regulatory changes. When core exceeds headline — as it did in May 2026 (0.64% vs 0.58%) — it signals that underlying demand conditions are generating inflationary pressure independent of commodity price movements.
The 2026 Core Trend: A Concerning Upturn
Core IPCA was remarkably subdued in H2 2025:
– September 2025: 0.00%
– August 2025: +0.07%
– October 2025: +0.17%
– November 2025: +0.16%
This near-zero core inflation in mid-2025 likely reflected the lagged impact of Selic’s aggressive tightening cycle. However, since January 2026, core has been on an upward trajectory:
– January 2026: +0.25%
– February 2026: +0.89% (sharp spike)
– March 2026: +0.75%
– April 2026: +0.55%
– May 2026: +0.64%
The February spike was notable but may have been partly driven by seasonal factors (back-to-school, Carnival-related services). The subsequent readings of 0.75%, 0.55%, and 0.64% suggest a stabilization at an elevated level rather than a one-off event.
What This Means for Copom
Brazil’s Copom (Comitê de Política Monetária — the BCB’s monetary policy committee, equivalent to the FOMC in the US) sets the Selic rate at meetings held approximately every 45 days. The committee’s decisions are heavily influenced by the inflation outlook, particularly core inflation dynamics.
With core running at 0.64% MoM — which annualizes to approximately 7.9% if sustained — Copom has clear justification to maintain its hawkish stance. The data does not support an imminent rate cut. However, the current 0.64% is well below the 2022 peak of 1.24–1.34% MoM, suggesting the situation is elevated but not in a deteriorating spiral. A sustained decline in core below 0.40% MoM would likely be needed before rate cut discussions gain traction.
Selic・実質金利・政策インプリケーション
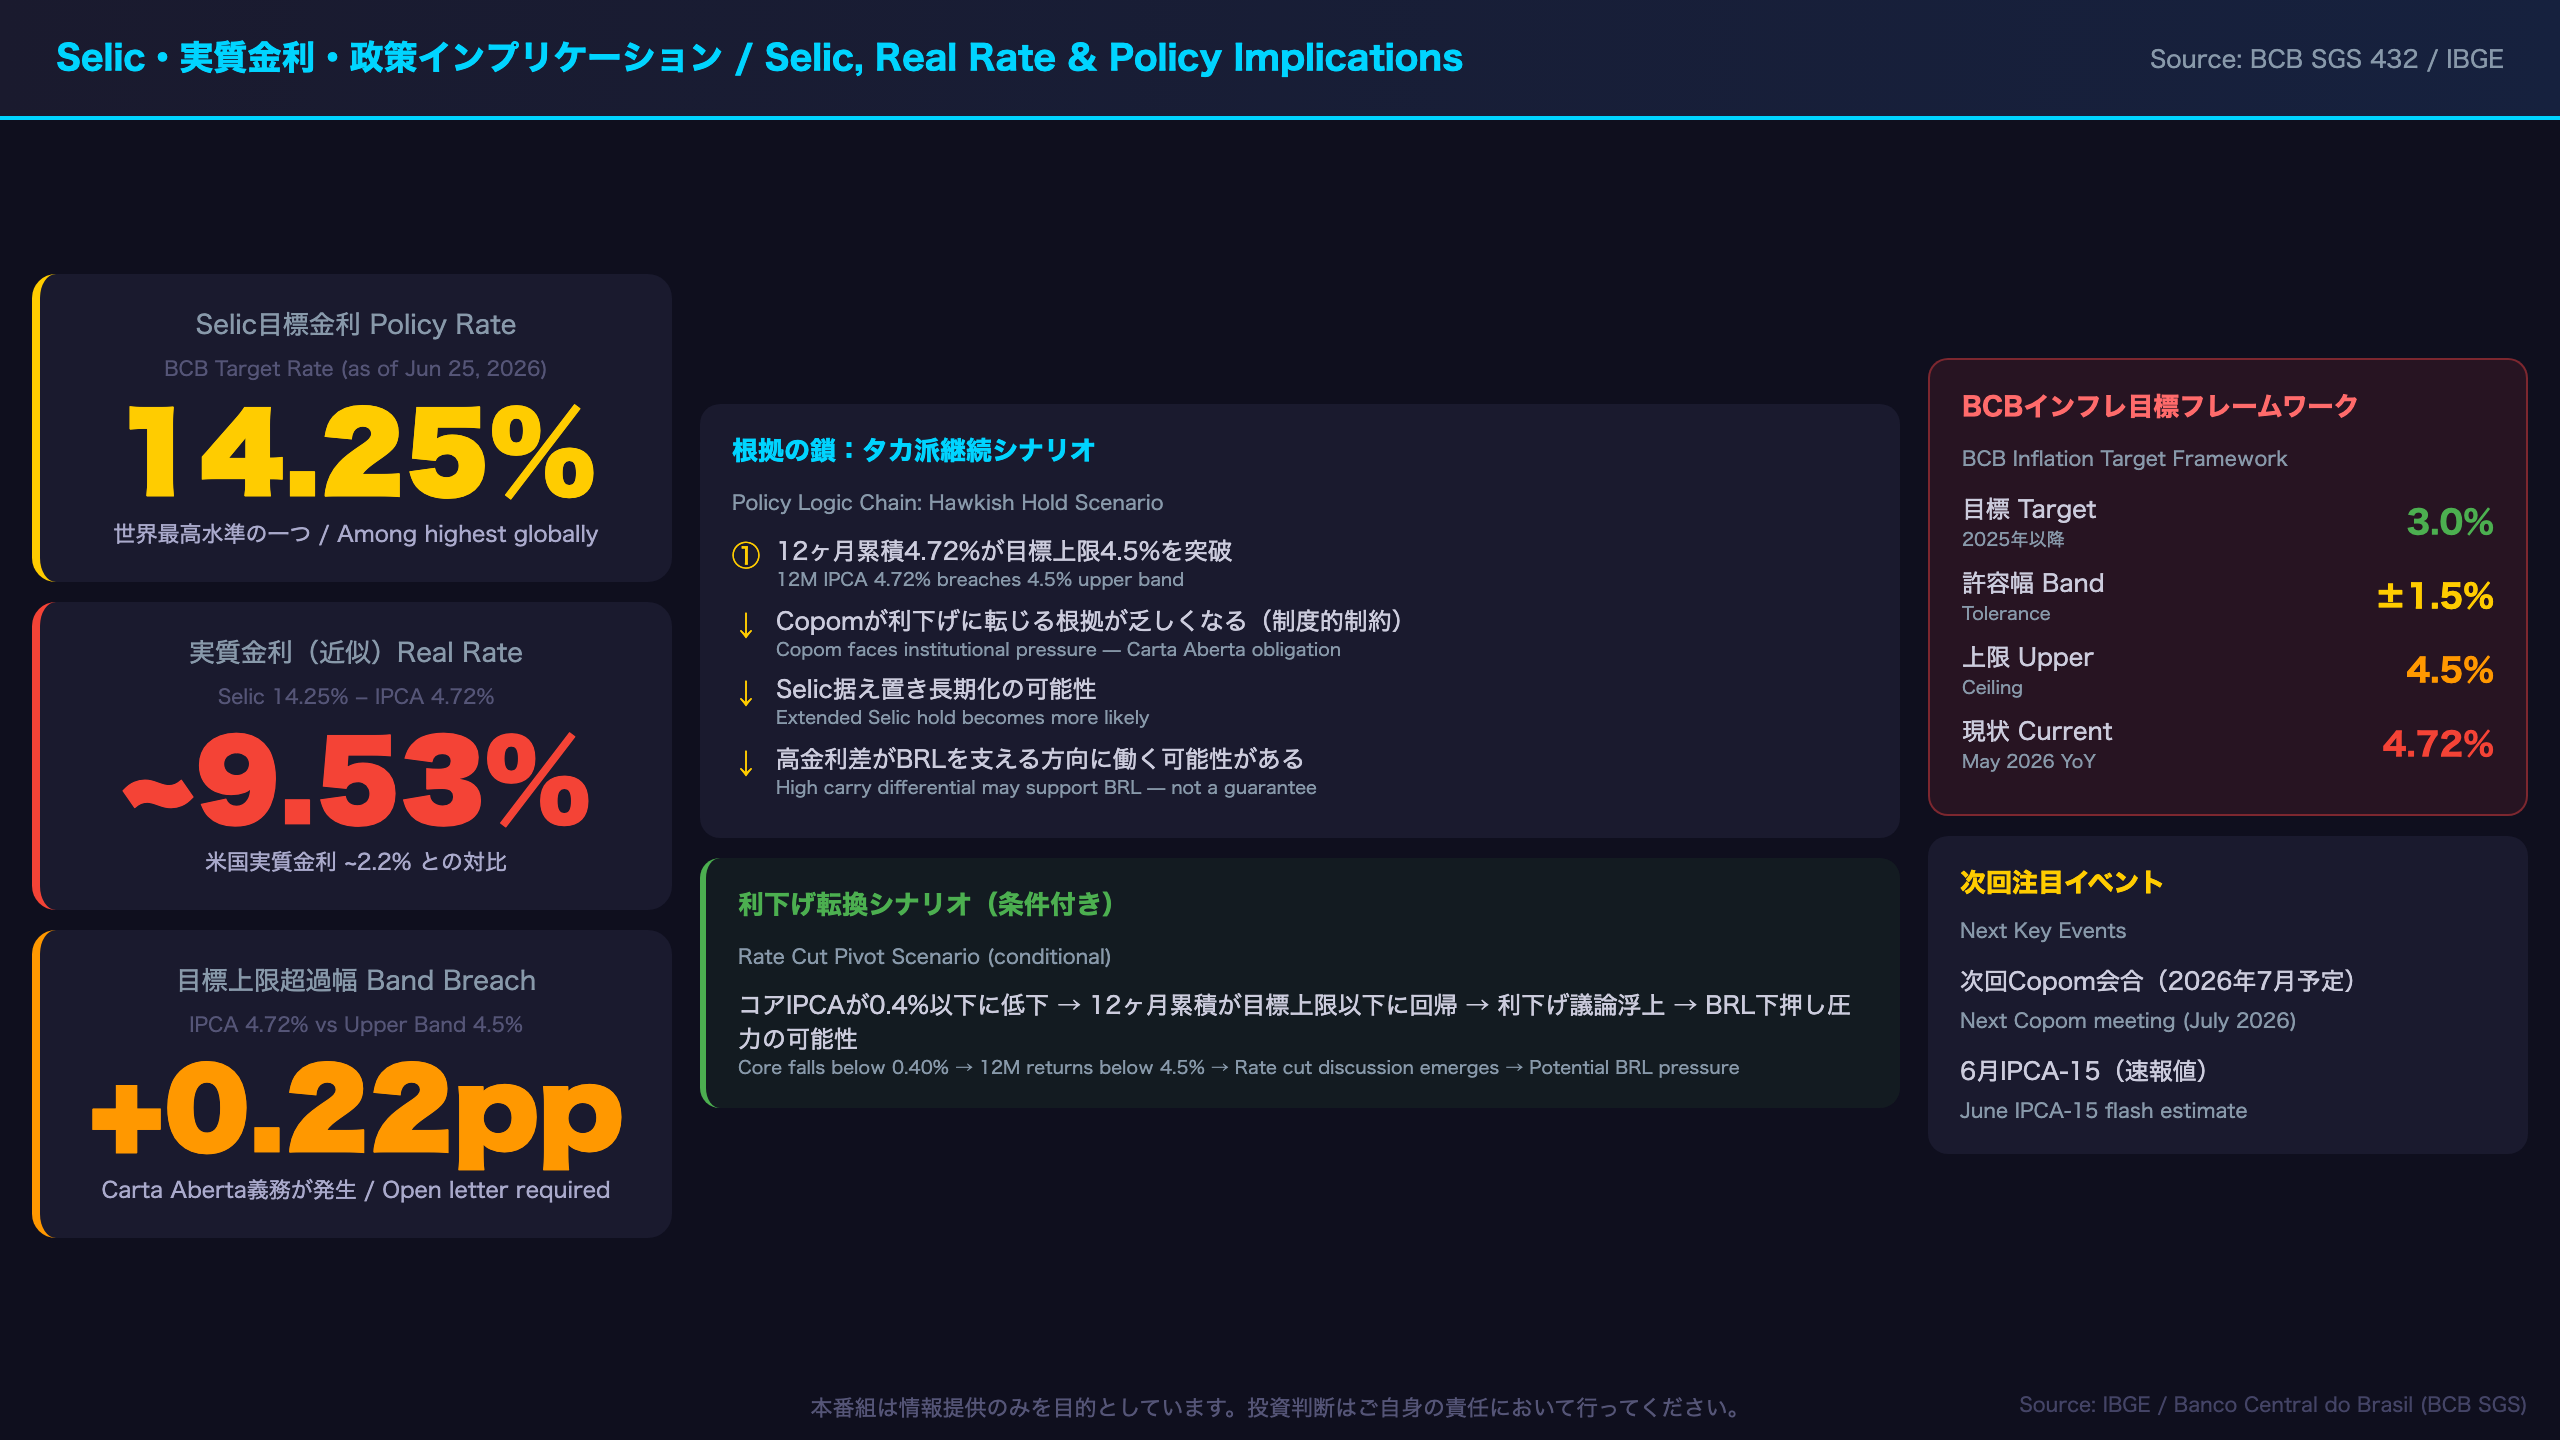
Selic, Real Rates, and Copom Policy Implications
Brazil’s Real Interest Rate in Global Context
With Selic at 14.25% and 12-month IPCA at 4.72%, Brazil’s ex-post real interest rate stands at approximately 9.53%. This is exceptionally high by any global standard:
| Country | Policy Rate | CPI YoY | Real Rate (approx.) |
|---|---|---|---|
| Brazil | 14.25% | 4.72% | ~9.53% |
| USA | ~4.50% | ~2.3% | ~2.2% |
| Eurozone | ~2.50% | ~2.2% | ~0.3% |
| Japan | ~0.50% | ~3.5% | ~-3.0% |
Note: International figures are approximate and for illustrative comparison only.
Brazil’s high real rate reflects the BCB’s deliberate strategy of maintaining restrictive monetary conditions to anchor inflation expectations, particularly given the country’s history of inflation volatility.
The Copom Framework
Copom (Comitê de Política Monetária) is Brazil’s monetary policy committee, meeting approximately every 45 days. It operates under an inflation targeting regime established in 1999, with the current target of 3.0% (±1.5% tolerance band, upper limit 4.5%) applying from 2025 onward.
A key institutional feature: when 12-month IPCA exceeds the upper tolerance band, the BCB President is required to write an open letter (Carta Aberta) to the Finance Minister explaining the breach and the corrective measures planned. This accountability mechanism creates institutional pressure to maintain a hawkish stance when inflation is above the upper band.
The Policy Logic Chain
Scenario A — Hawkish Hold (base case given current data):
12M IPCA at 4.72% breaches 4.5% upper band → Copom faces institutional pressure to demonstrate commitment to target → Selic held at 14.25% or higher → High carry differential may support BRL (though not guaranteed given global risk factors)
Scenario B — Premature Pivot (tail risk):
If growth deteriorates sharply or global risk-off intensifies → Copom may weigh growth concerns against inflation → Any rate cut signal would likely pressure BRL lower
Important caveat: These chains describe economic mechanisms, not market predictions. Copom decisions incorporate GDP growth, fiscal dynamics, exchange rate pass-through, and global monetary conditions — none of which are captured in this single IPCA print.
地域別IPCA — アラカジュ・カンポグランデ vs クリチバの格差
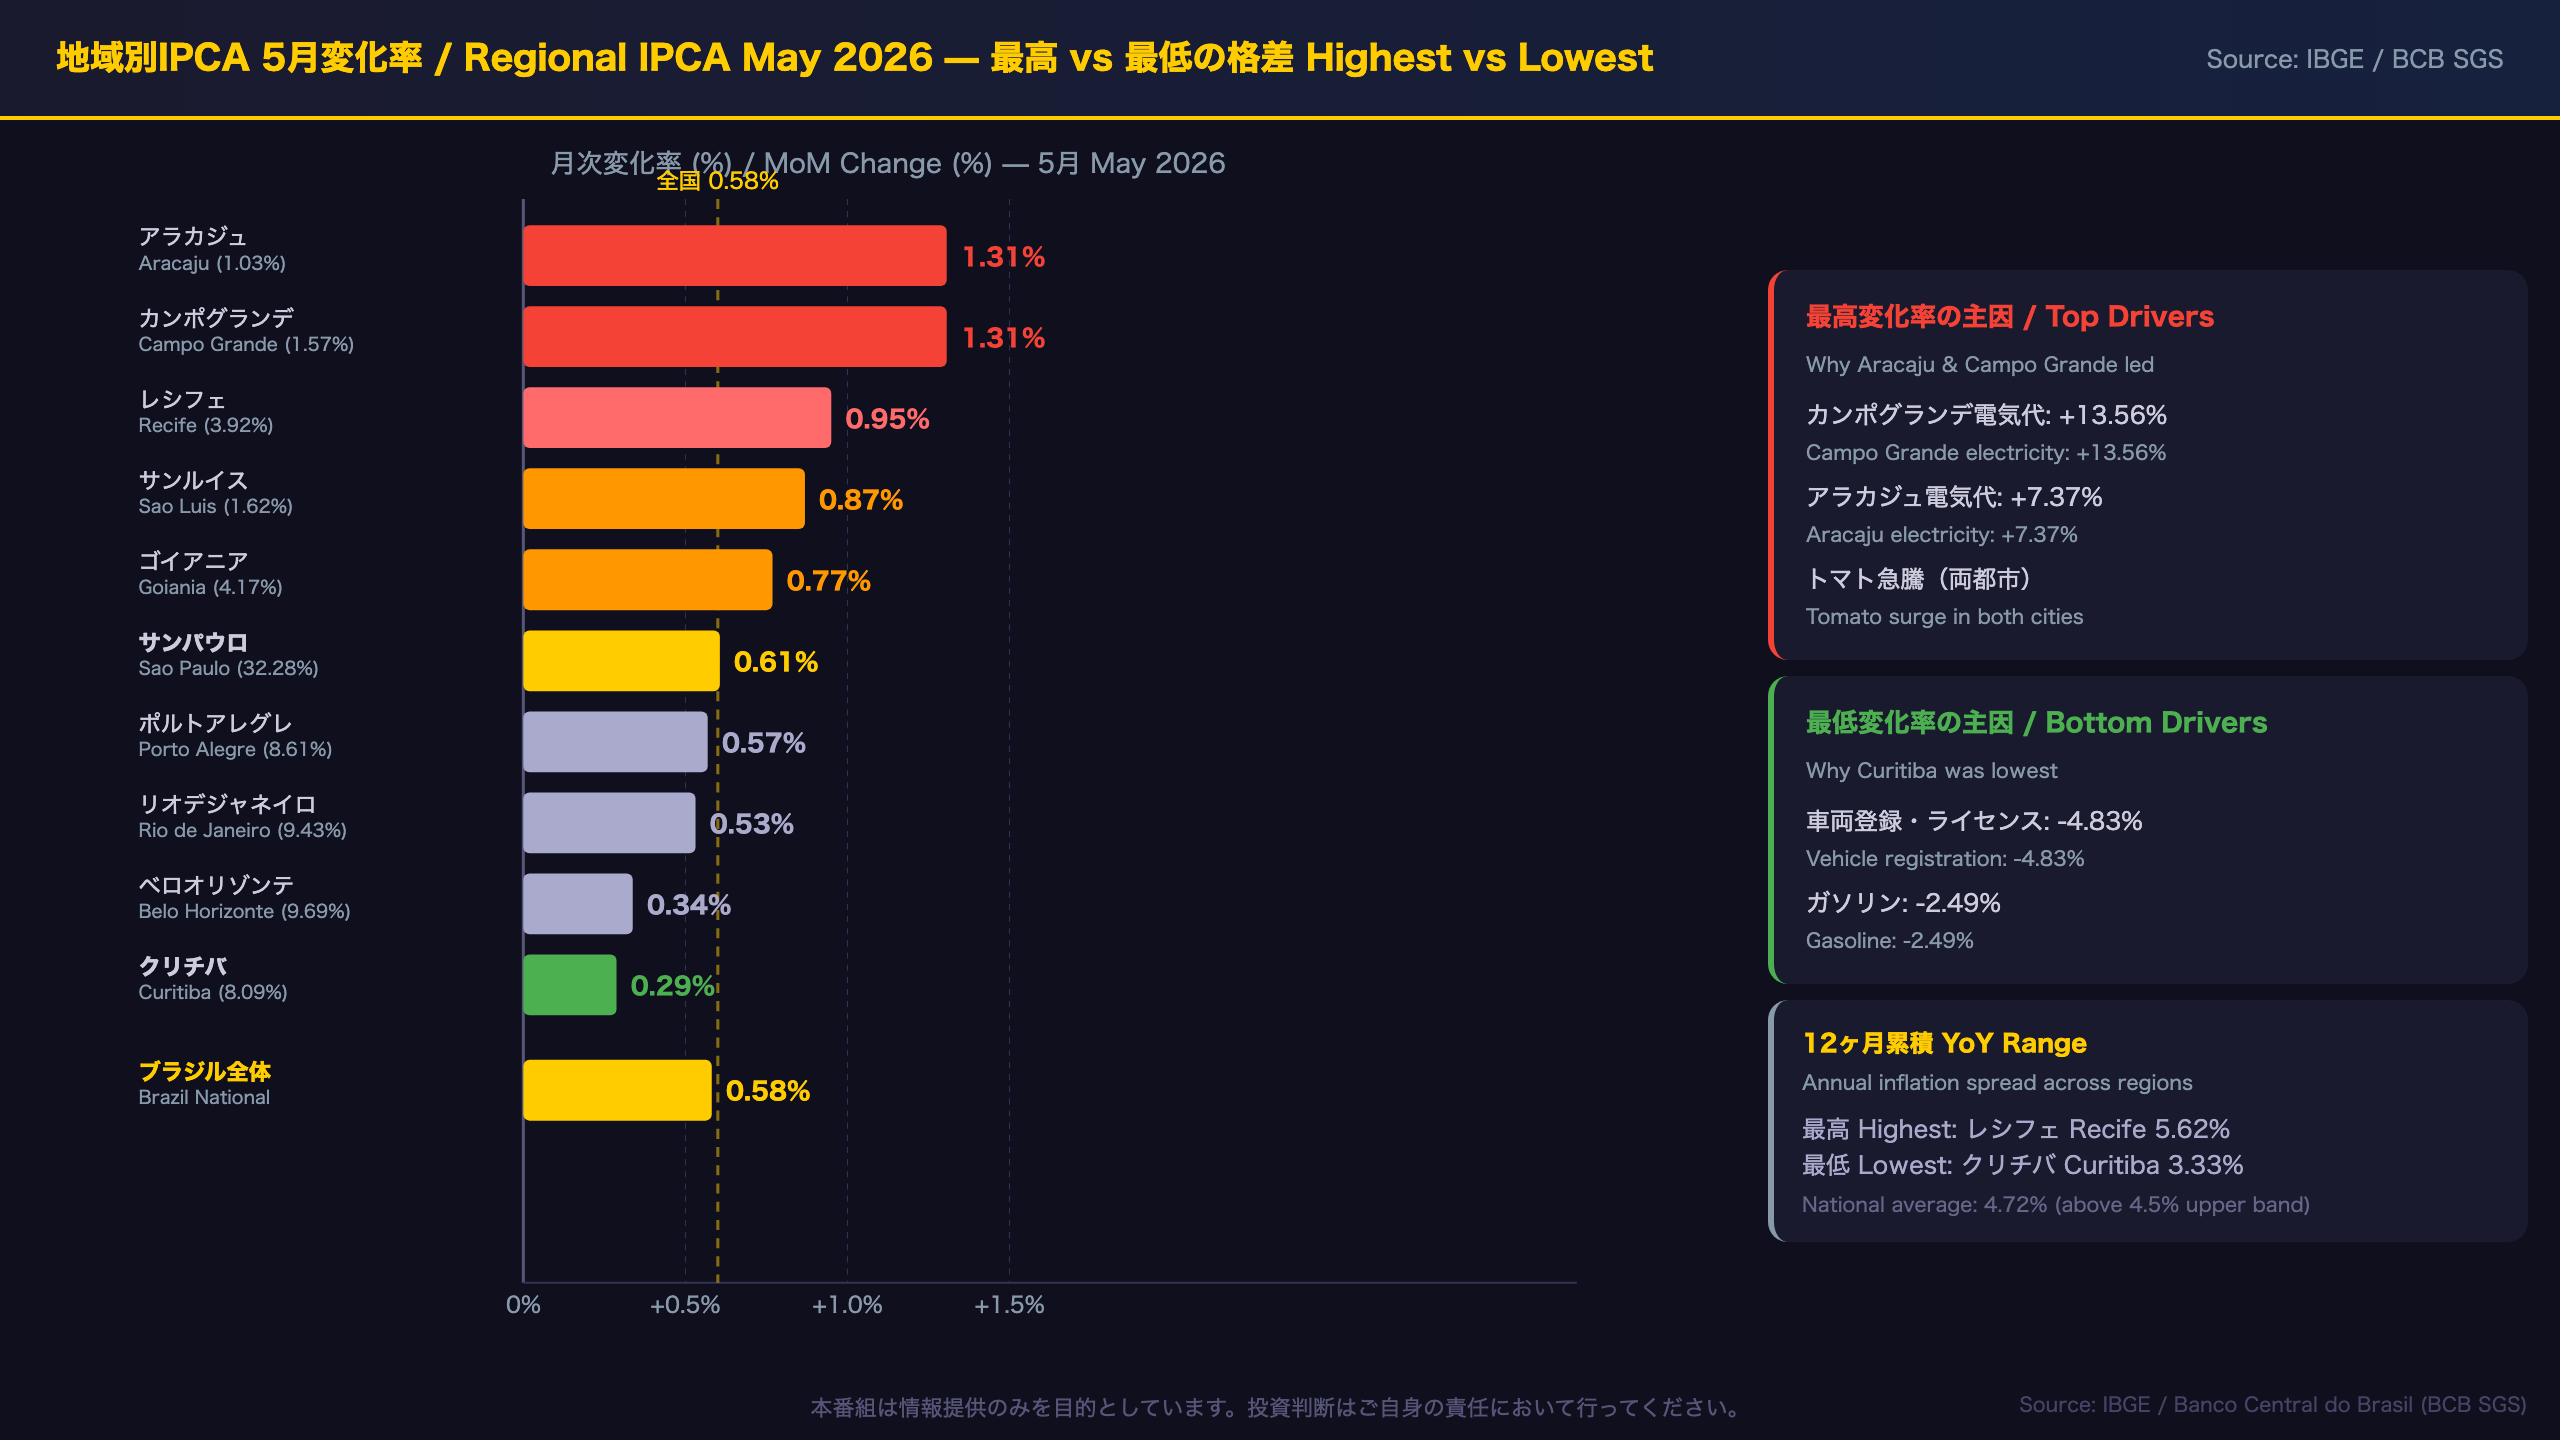
Regional IPCA: How Staggered Electricity Tariff Hikes Create a 4x Inflation Gap
The Regional Divergence
One of the most striking features of Brazil’s IPCA methodology is its regional granularity. The index covers 16 metropolitan areas, and the May 2026 data reveals a fourfold gap between the highest (Aracaju and Campo Grande at 1.31%) and lowest (Curitiba at 0.29%) regional readings.
This is not unusual for Brazil — regional electricity tariff adjustments are staggered throughout the year, creating temporary but significant divergences in local inflation rates.
The Electricity Tariff Mechanism
Brazil’s electricity distribution companies (distribuidoras) operate under regulated tariff schedules set by ANEEL (Agência Nacional de Energia Elétrica — the national electricity regulator). Each distributor has its own annual tariff review date, meaning price adjustments are spread across the calendar year rather than occurring simultaneously.
In May 2026, several cities experienced their annual tariff adjustments simultaneously:
– Campo Grande: +13.56% — the most extreme case, driven by local distributor Energisa MS
– Recife: +8.84% — Neoenergia Pernambuco adjustment
– Aracaju: +7.37% — Energisa Sergipe adjustment
These adjustments, combined with the Bandeira Amarela (Yellow Flag) surcharge of R$1.885 per 100 kWh, created a concentrated electricity inflation shock in specific cities.
São Paulo: The Anchor of the National Index
With a weight of 32.28% in the national IPCA basket, São Paulo’s reading of +0.61% effectively anchors the national average. For context, if São Paulo had printed at Campo Grande’s 1.31%, the national IPCA would have been approximately 0.80% rather than 0.58%.
However, São Paulo’s 12-month cumulative of 5.31% significantly exceeds the national average of 4.72%, suggesting that Brazil’s largest metropolitan economy is experiencing above-average inflation pressure on an annual basis — a factor worth monitoring for domestic consumption and wage dynamics.
Disclaimer: This article is for informational purposes only. All investment decisions are made solely at your own risk.