📺 Watch the Full Video Analysis
This article was automatically generated by the NFC Market Live AI analysis system. (Updated: 2026-07-29 11:43 JST)
📄 Primary Source
Australian Bureau of Statistics
https://www.abs.gov.au/statistics/economy/price-indexes-and-inflation/consumer-price-index-australia/jun-2026
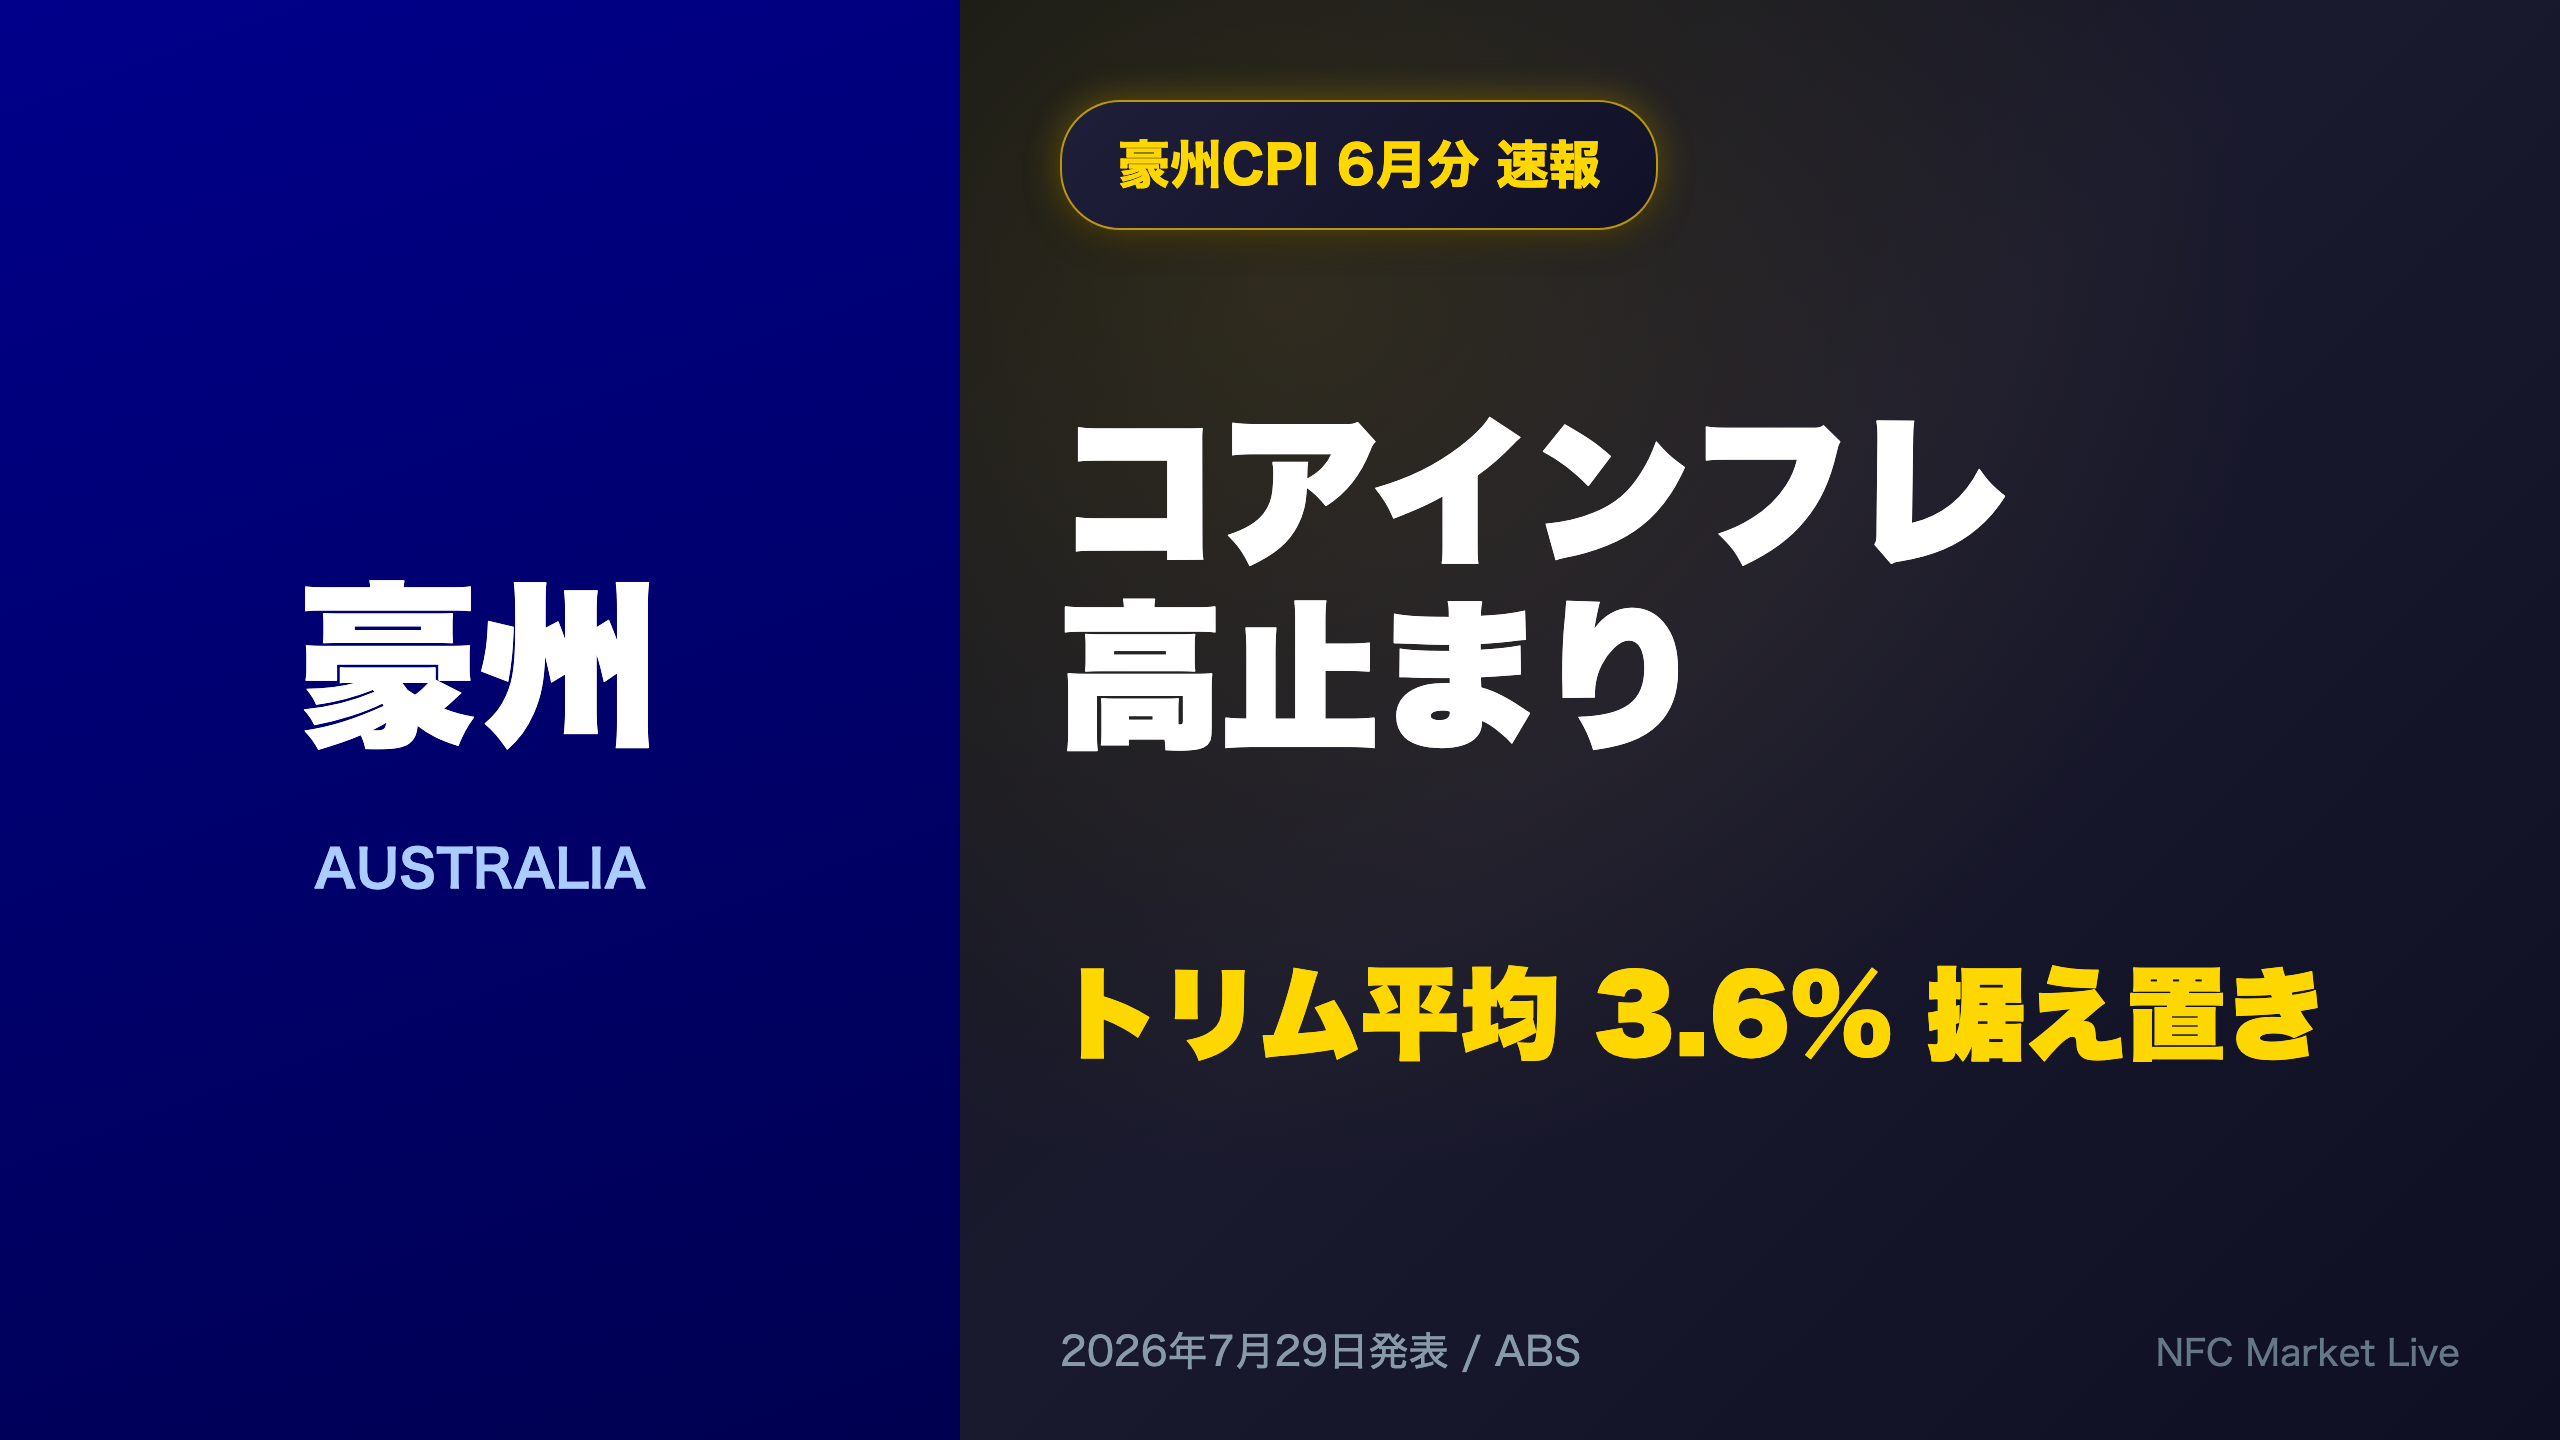
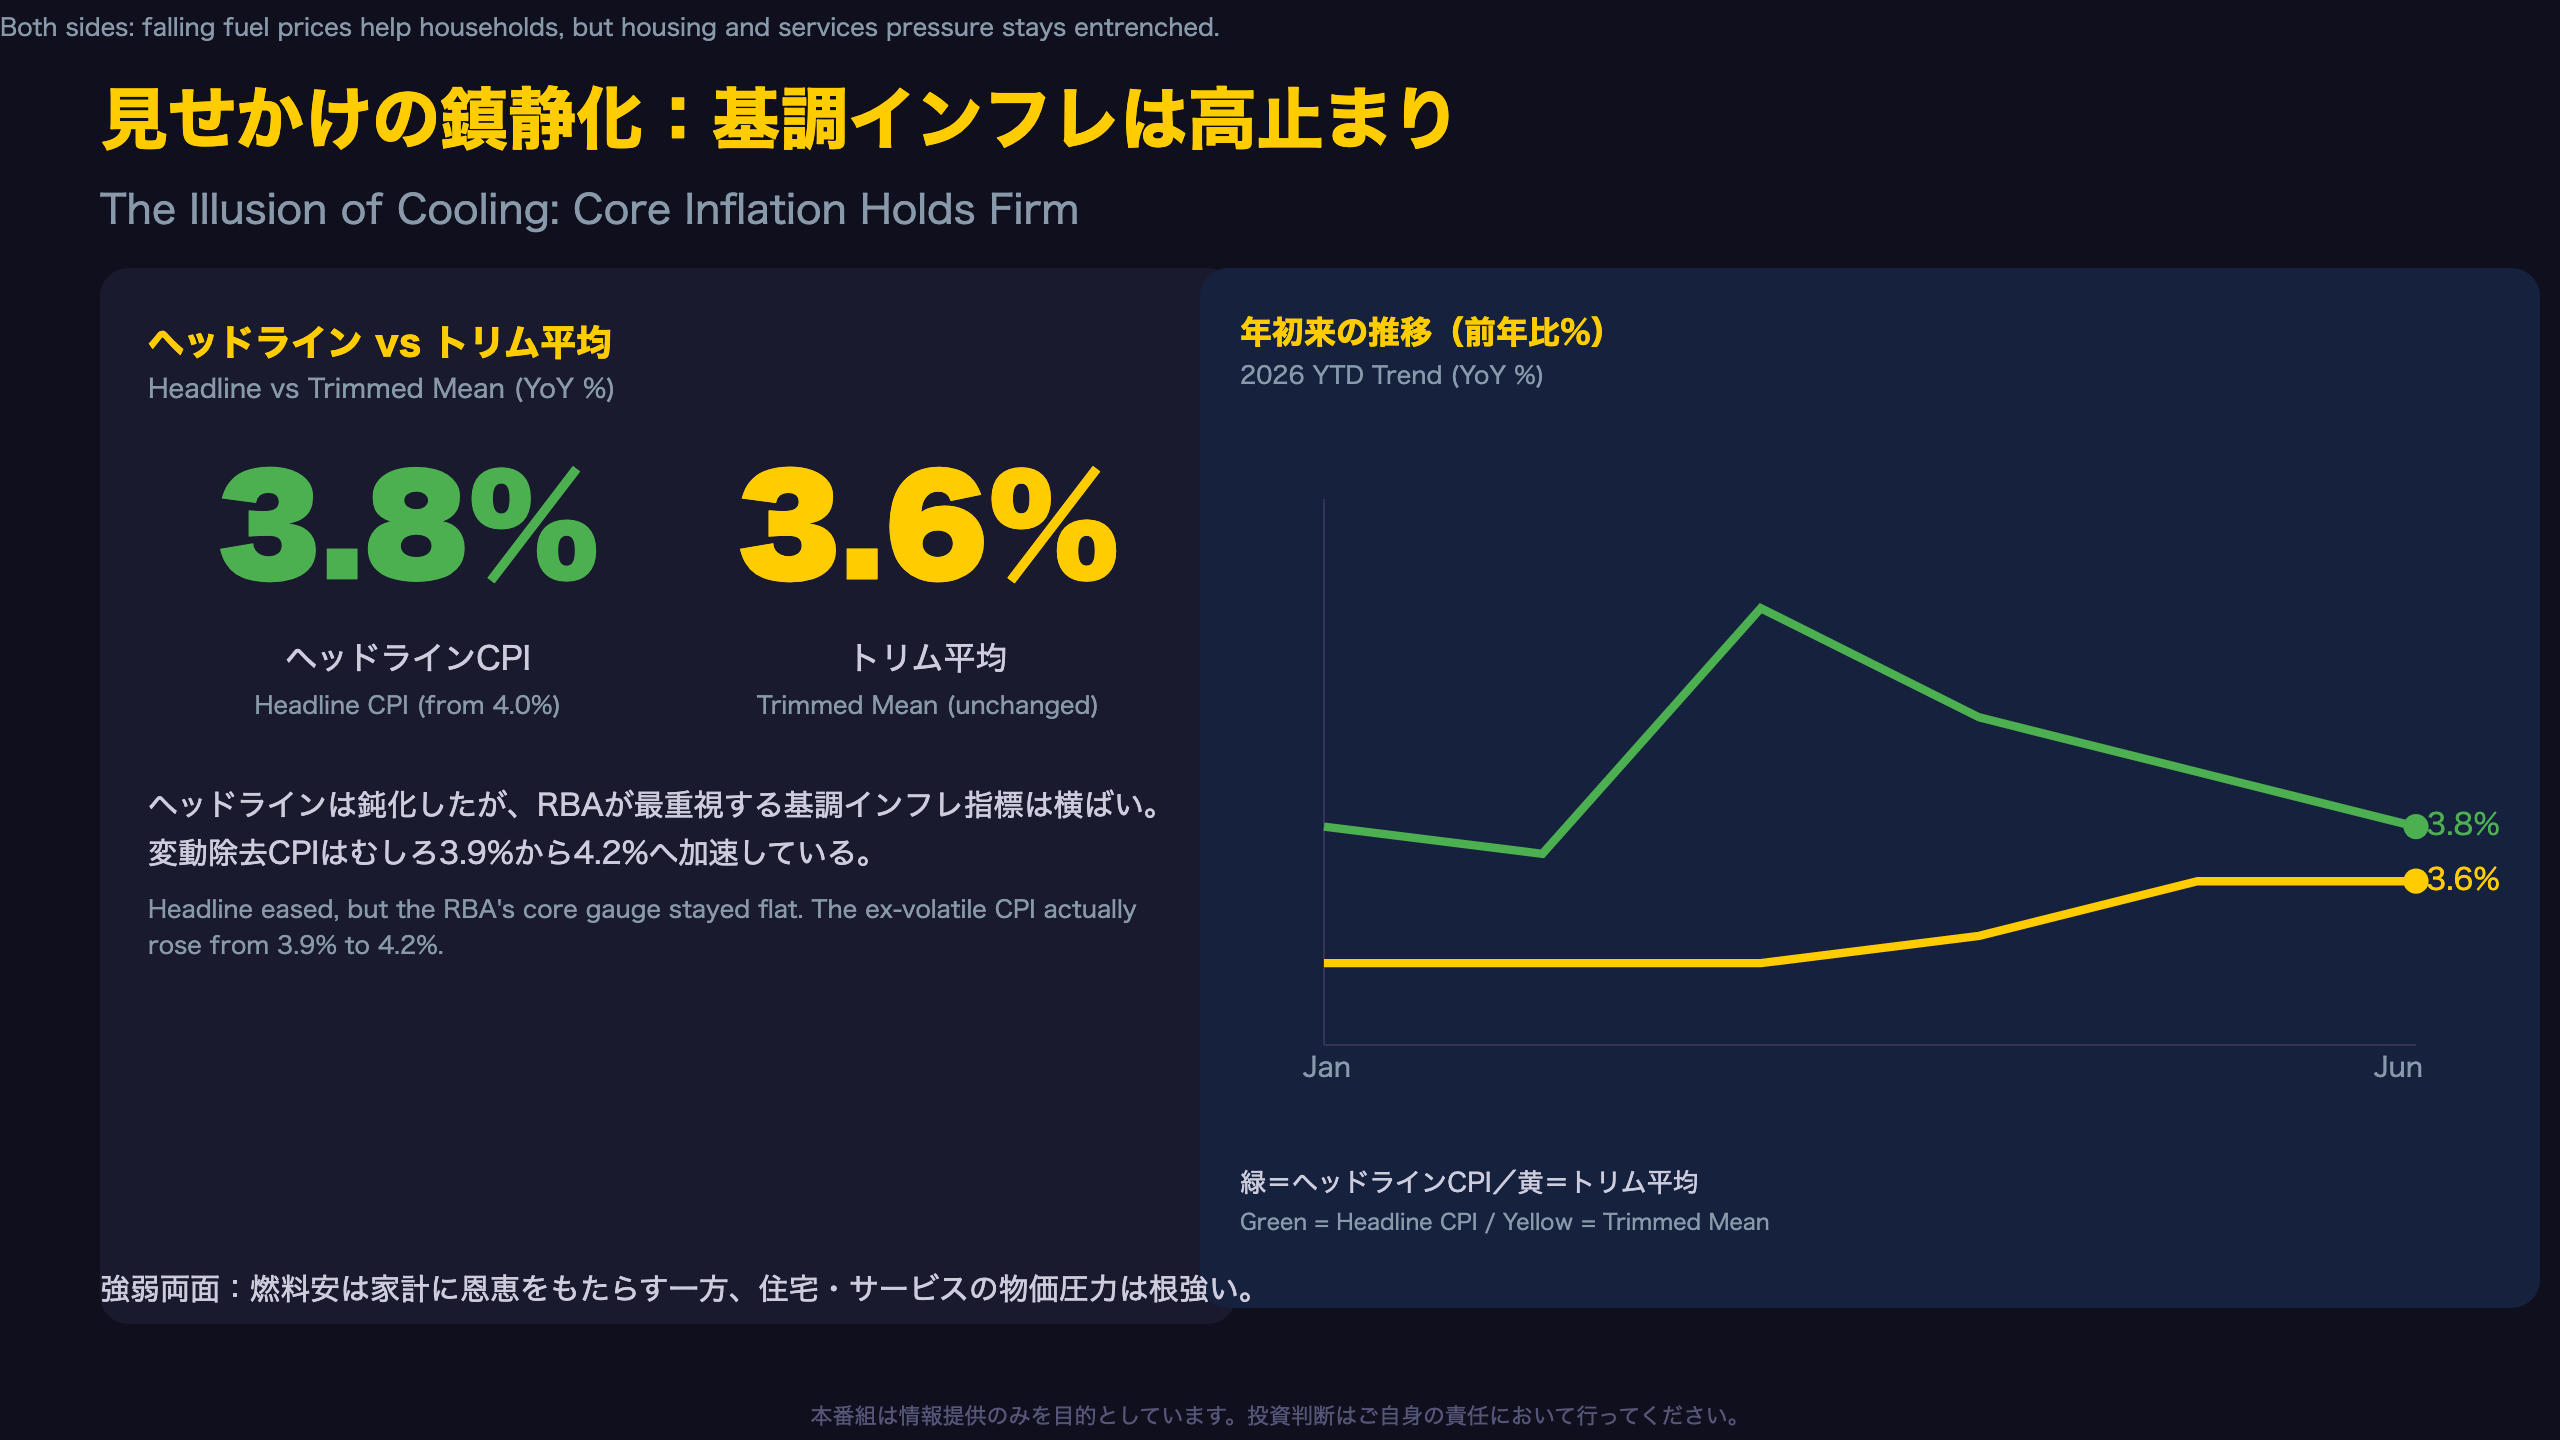
Australia’s June CPI slowed to 3.8% YoY from 4.0% in May 📉
But the RBA’s preferred trimmed mean held flat at 3.6%, while the ex-volatile items CPI accelerated from 3.9% to 4.2% 💡
The headline slowdown was driven mainly by a fuel excise cut and falling oil prices, yet housing and services inflation remain sticky 🏠
We break down both sides of the story—and what it means for RBA rate cuts and the AUD ⚠️
見せかけの鎮静化:ヘッドライン鈍化の裏で基調インフレは高止まり
Headline-Core Divergence Near a Turning Point
The Australian Bureau of Statistics (ABS), the agency responsible for compiling Australia’s CPI, introduced a complete monthly CPI series in late 2025, replacing the older quarterly-only framework. This gives the Reserve Bank of Australia (RBA) far timelier data than, say, the U.S. Fed gets from its preferred PCE deflator.
The RBA’s key policy anchor isn’t headline CPI but the trimmed mean — broadly analogous to core inflation measures used by the Fed and Bank of Canada, but calculated by statistically trimming the most extreme monthly price movements rather than excluding a fixed food-and-energy basket.
Per ABS: “Trimmed mean inflation was 3.6 per cent… unchanged from 3.6 per cent in the 12 months to May 2026.”
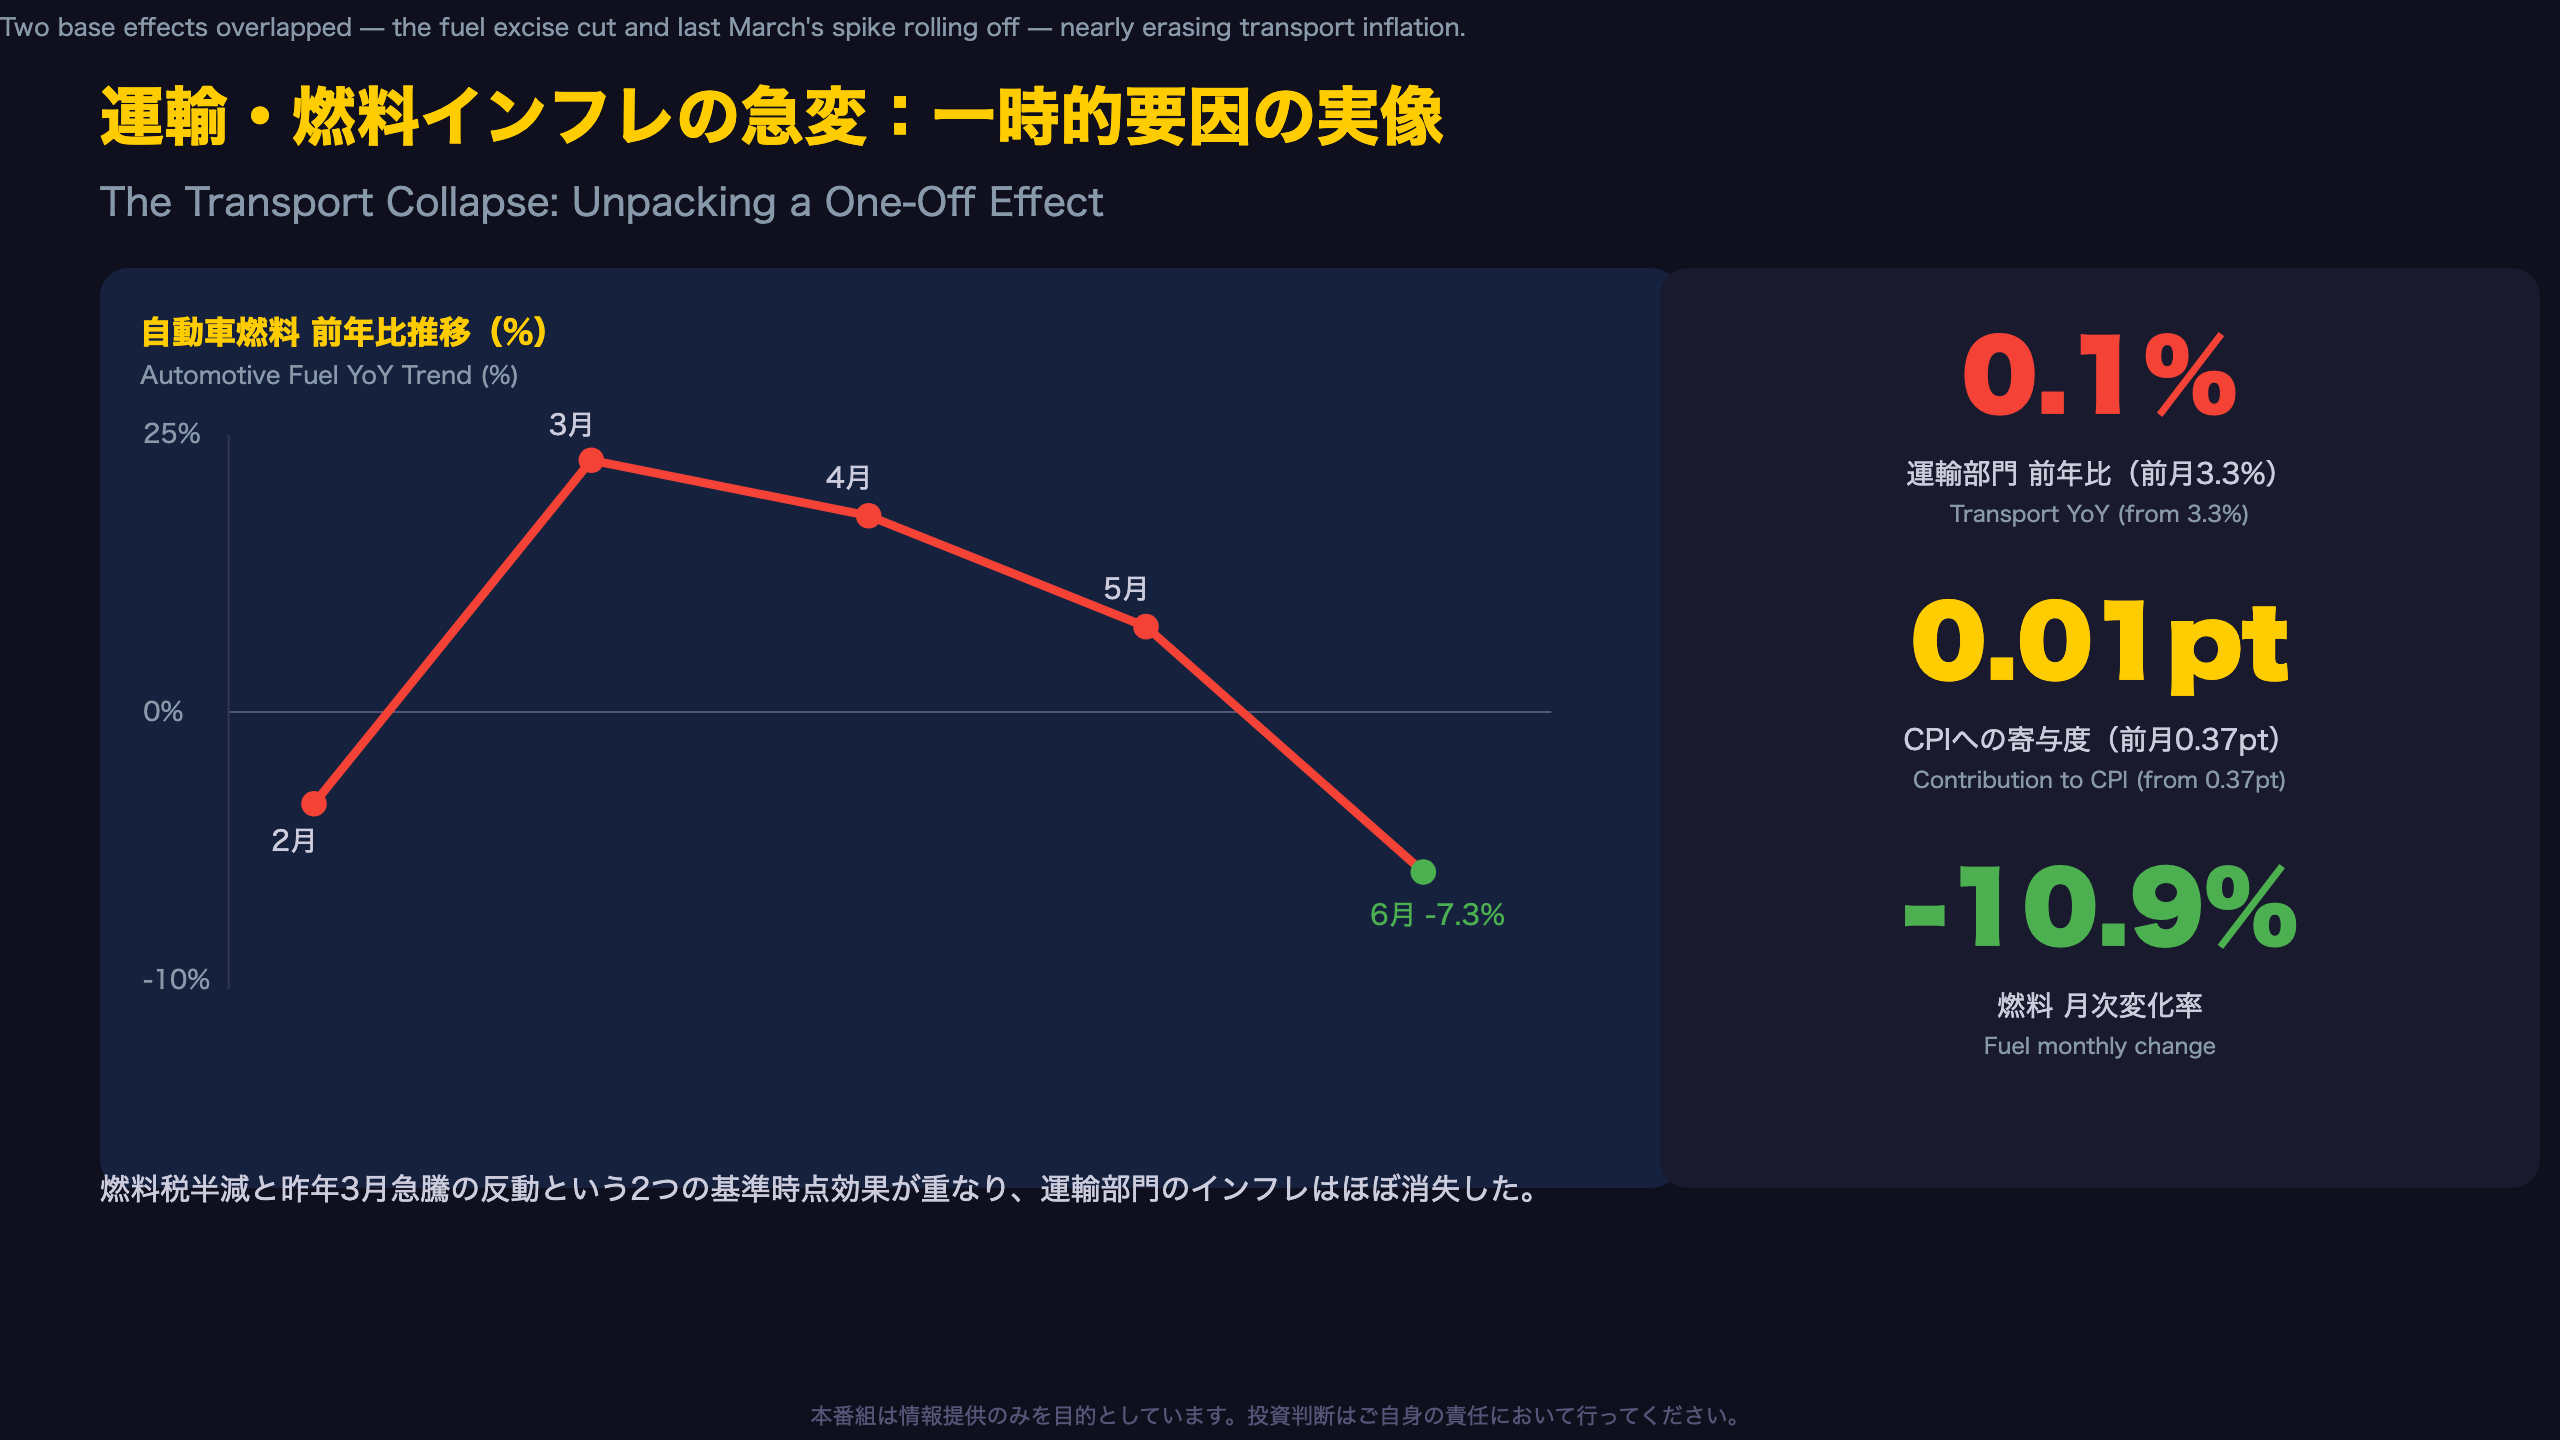
Bull case: falling fuel costs (transport’s CPI contribution shrank from 0.37 to just 0.01 percentage points) represent genuine relief for household budgets and real incomes.
Bear case: services inflation (3.7%→4.0%) and non-tradables (4.7%→4.9%) are accelerating — signs of domestically generated, demand-driven inflation that fuel base effects cannot mask indefinitely. For AUD traders, this complicates the case for near-term RBA cuts. Watch whether the trimmed mean breaks above 3.6% at the next release, due August 26, 2026.
基調インフレ計測:3つの物差しが示す高止まり
Understanding the “Ex-Volatile Items” Series
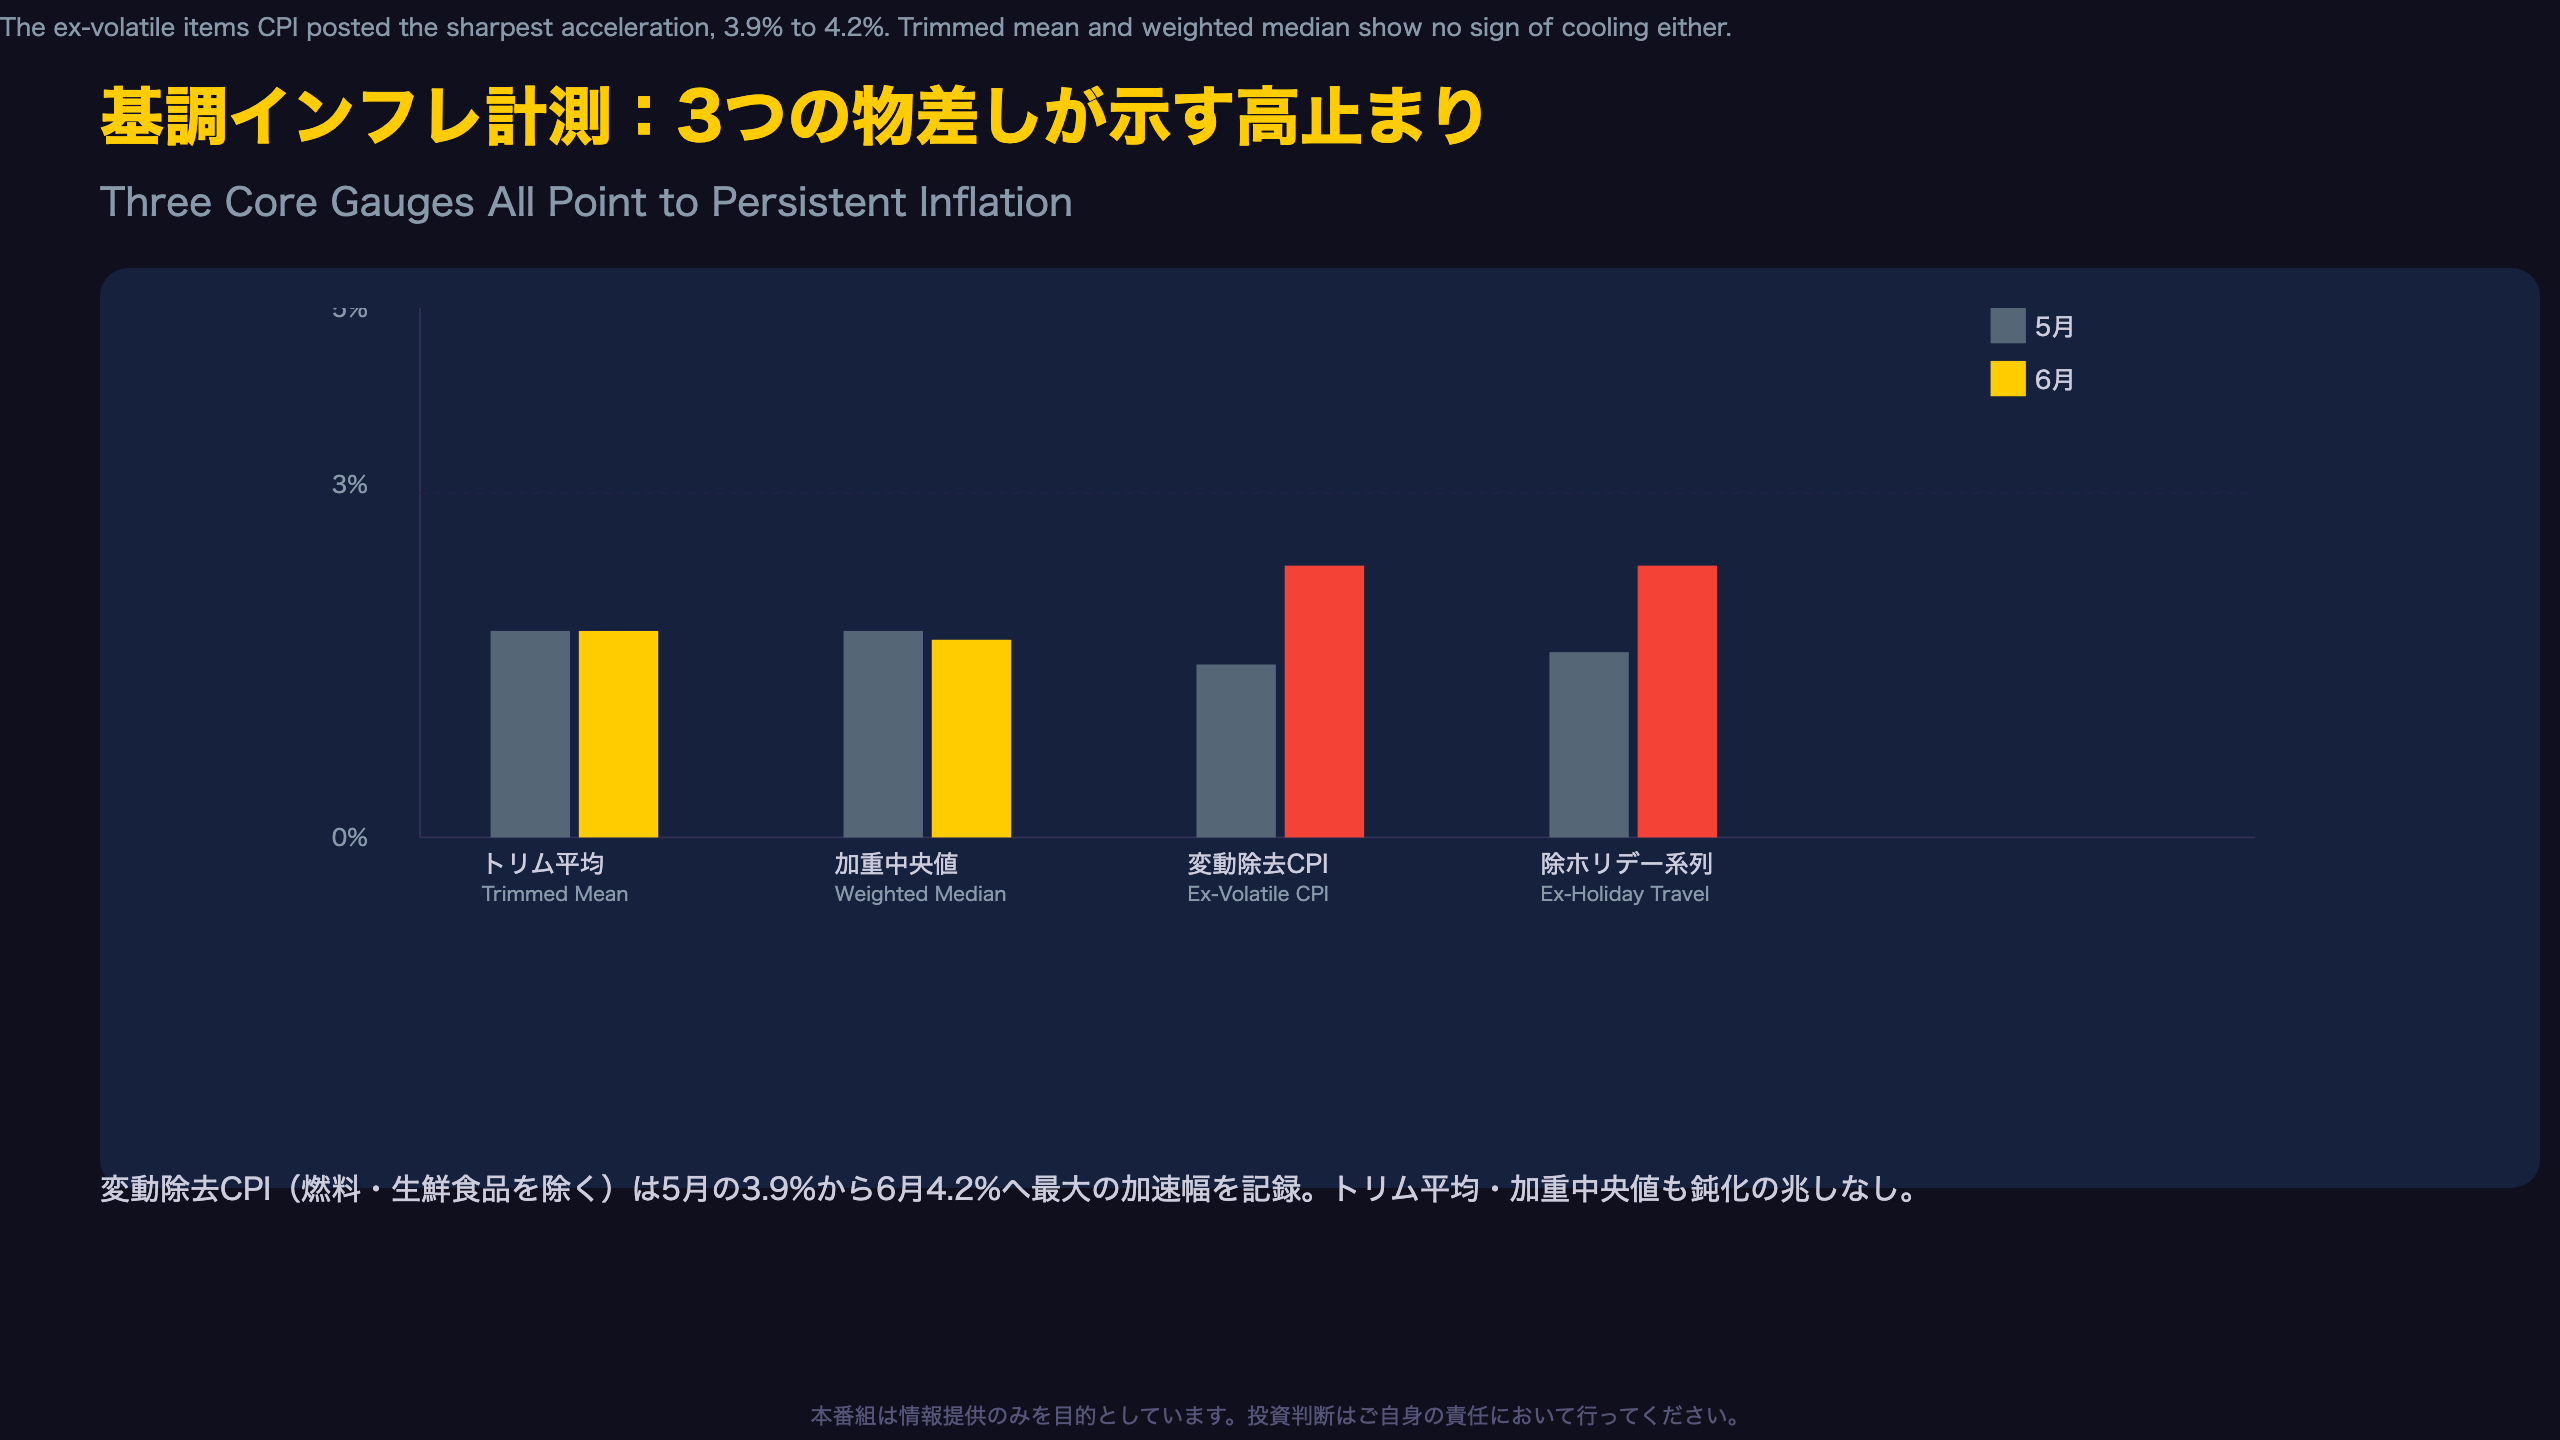
The ABS publishes an analytical series excluding Australia’s two most volatile CPI components — automotive fuel and fruit & vegetables. This measure jumped from 3.9% to 4.2% year-on-year in June, moving opposite to the headline print.
For readers unfamiliar with Australian CPI methodology: the trimmed mean is broadly analogous to the Fed’s preference for core PCE, but instead of a fixed exclusion list, it statistically trims the most extreme price movements each month — a technique also used by the Bank of Canada.
Per ABS: “CPI excluding volatile items* 0.3% (monthly) / 4.2% (annual).”
Since January 2026, the trimmed mean has quietly climbed from 3.3% to 3.6%, even as headline CPI peaked at 4.6% in March and has since fallen — the opposite trajectory to headline, a classic sign underlying dynamics have decoupled from volatile components.
Alternative read: a single month’s jump in the ex-volatile series could partly reflect one-off strength in holiday travel pricing. Confirmation from July’s data (due August 26) would strengthen the case for genuine persistence.
運輸・燃料インフレの急変:一時的要因の実像
The Fuel Excise Effect: A Policy-Driven Distortion
Australia’s federal government halved the fuel excise tax starting April 1, 2026 — a temporary relief measure that has now suppressed year-on-year petrol comparisons for three straight months (April, May, June).
Per ABS: “Automotive fuel were down 10.9% in June 2026 following a fall of 11.9% in May 2026, reflecting lower world oil prices… fuel excise relief measures… also remained in place.”
Tracking automotive fuel’s annual rate over recent months reveals extreme volatility: -7.2% (Feb), +24.2% (Mar), +18.6% (Apr), +7.7% (May), -7.3% (Jun). March’s spike was largely driven by a surge in global oil prices at the time, and its rolling out of the 12-month window is itself contributing to June’s swing negative.
Alternative interpretation: fuel excise relief is time-limited. Once it lapses, year-on-year fuel comparisons could swing back upward, unwinding today’s headline relief. The RBA is highly likely to look through this volatility, much as the Fed looks through gasoline swings in U.S. headline CPI.
住宅インフレは加速:最大の物価押し上げ要因
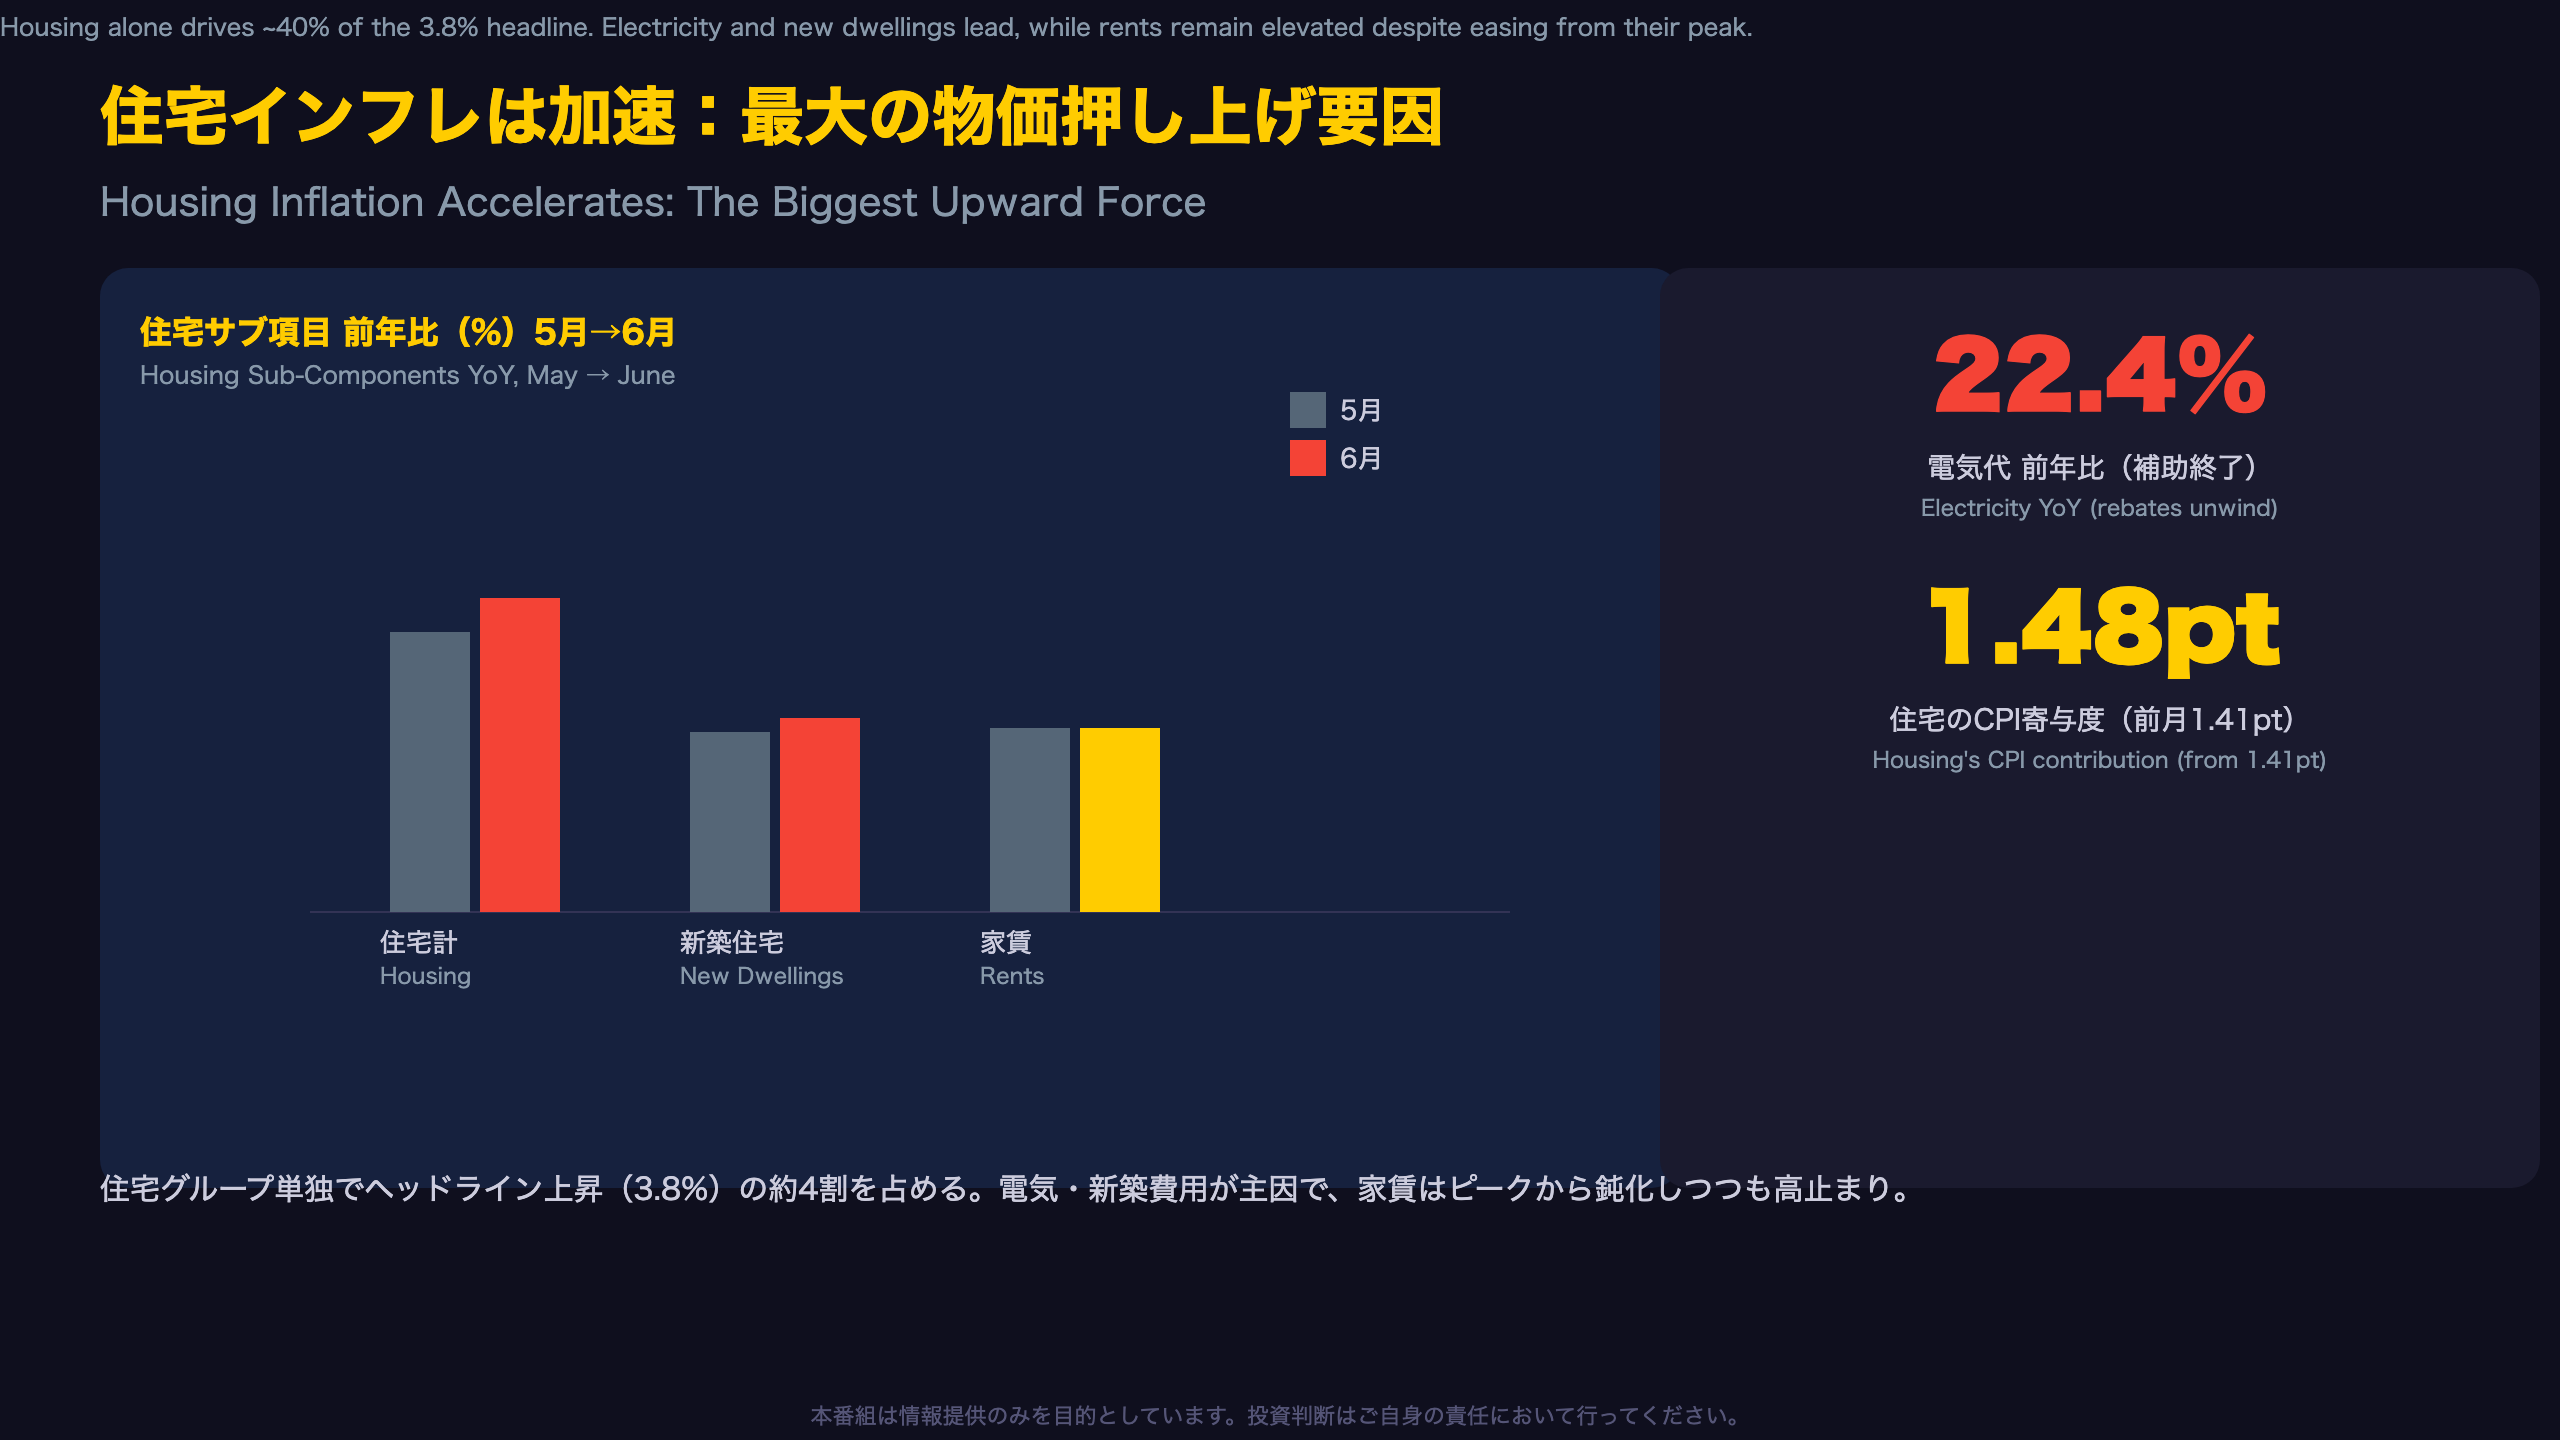
Housing Alone Drives Nearly 40% of Headline Inflation
According to ABS contribution data, Housing accounted for 1.4774 percentage points of June’s 3.8% headline CPI increase — dwarfing Food (0.5743pt) and Alcohol & Tobacco (0.2895pt) combined.
Per ABS: “Housing group rose 6.8%, up from a 6.3% rise in the 12 months to May 2026… main contributors… Electricity (+22.4%), New dwellings (+5.8%) and Rents (+3.6%).”
For context, Australia’s CPI measures housing costs via new dwelling construction (not existing home resale prices, unlike the U.S. Case-Shiller approach) plus rents and utilities — closer to how the UK’s ONS treats owner-occupied housing.
The 22.4% electricity spike is largely a policy artifact: federal and state electricity rebates that had temporarily suppressed the index are rolling off. Still, underlying retailer price reviews (from July 2025) mean some of this rise reflects genuine cost increases, not just rebate math.
Alternative view: rents have steadily decelerated from a peak above 7% in mid-2024 to a flat 3.6% in June, arguably signaling easing vacancy pressures in some capital cities. Whether new dwelling cost pass-through (5.6%→5.8%) continues will be a key watchpoint in July’s release, due August 26.
財からサービスへ:インフレの主役交代
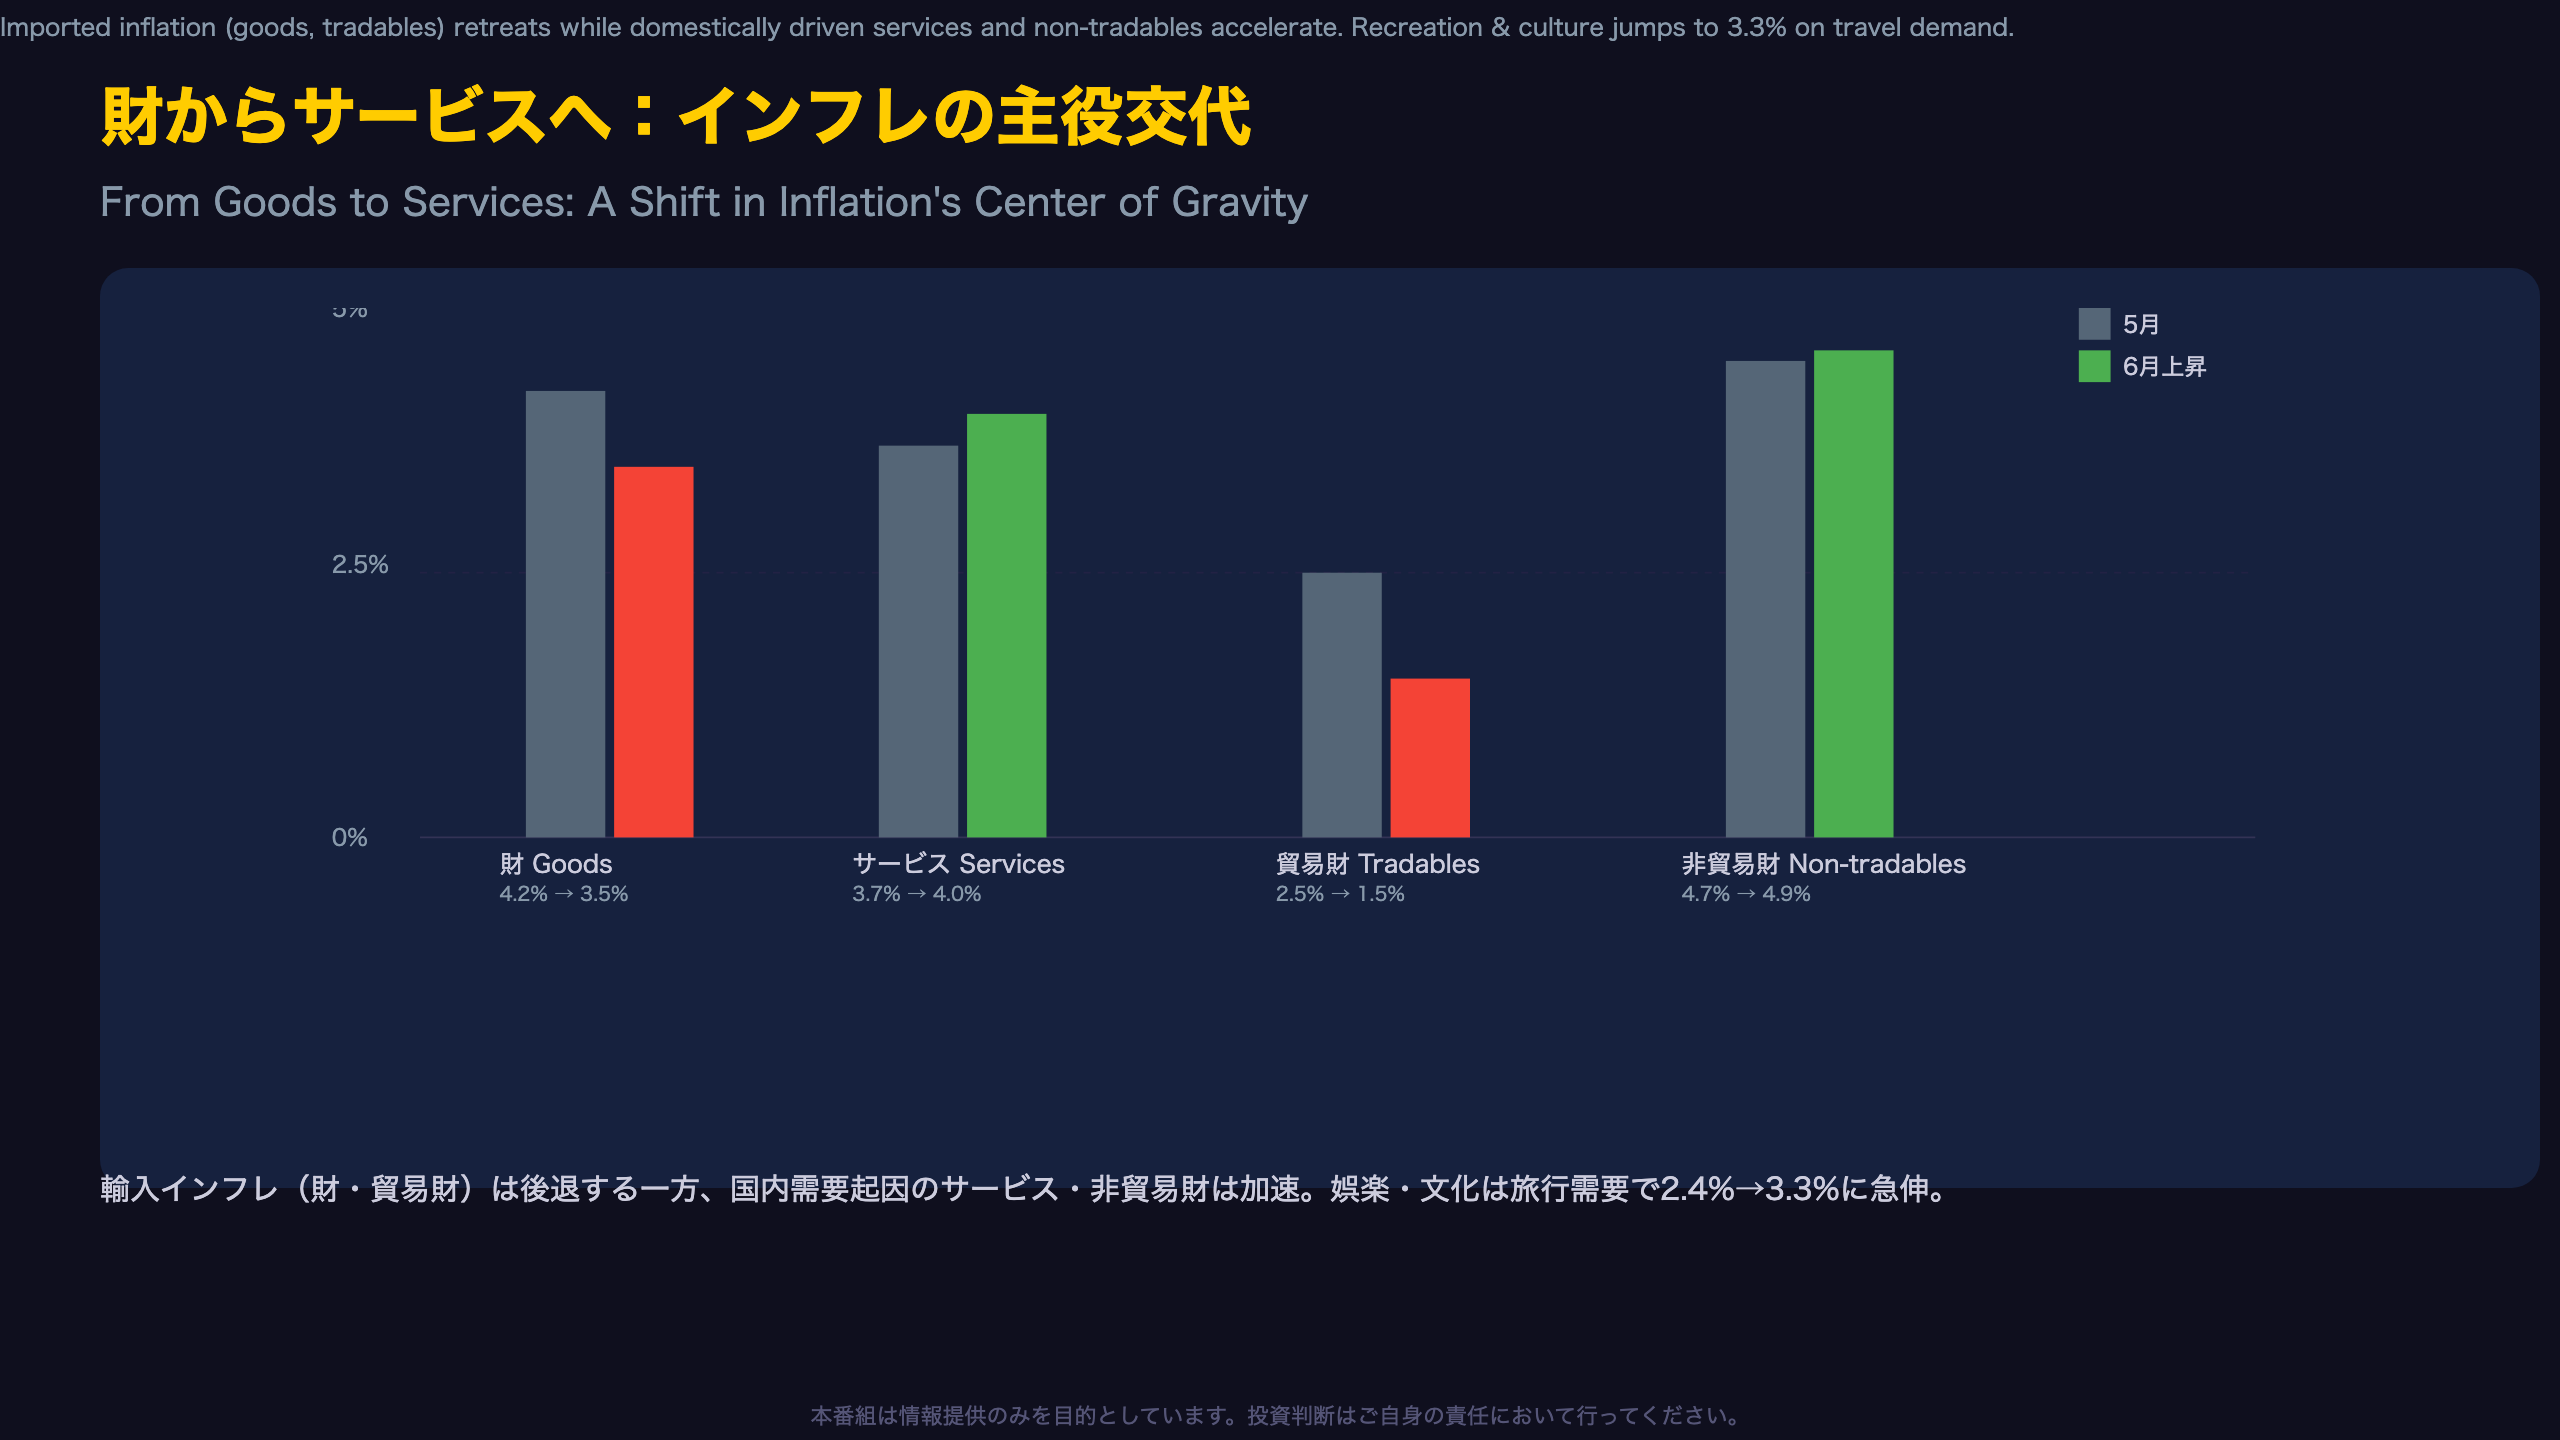
Tradables vs Non-Tradables: Diagnosing the Source of Inflation
The ABS’s Tradables/Non-tradables split is a key tool for separating imported inflation from domestically generated pressure. In June, Tradables slowed to 1.5% while Non-tradables edged up to 4.9% — one of the widest gaps between the two series this year.
For international readers: this split serves a similar diagnostic purpose to how the Fed monitors “core services ex-housing” — isolating inflation domestic policy can actually influence versus imported shocks like global oil prices, which sit largely outside the RBA’s control.
Per ABS: Tradables inflation “was 2.5 per cent in the 12 months to May 2026,” easing further to 1.5% in June, while Non-tradables held near 4.7%-4.9%.
Recreation and culture jumped to 3.3% from 2.4%, driven by a rebound in international holiday travel as the Northern Hemisphere’s peak tourist season began, compounded by higher jet fuel costs — not unambiguously bad news, as it also signals resilient discretionary spending capacity.
Alternative view: goods disinflation is overwhelmingly fuel-driven rather than broad-based. Services acceleration likely reflects wage cost pass-through, a dynamic that tends to persist while Australia’s labor market stays tight — worth watching alongside the RBA’s own wage price index.
インプリケーション:RBAの利下げ判断とAUDへの影響
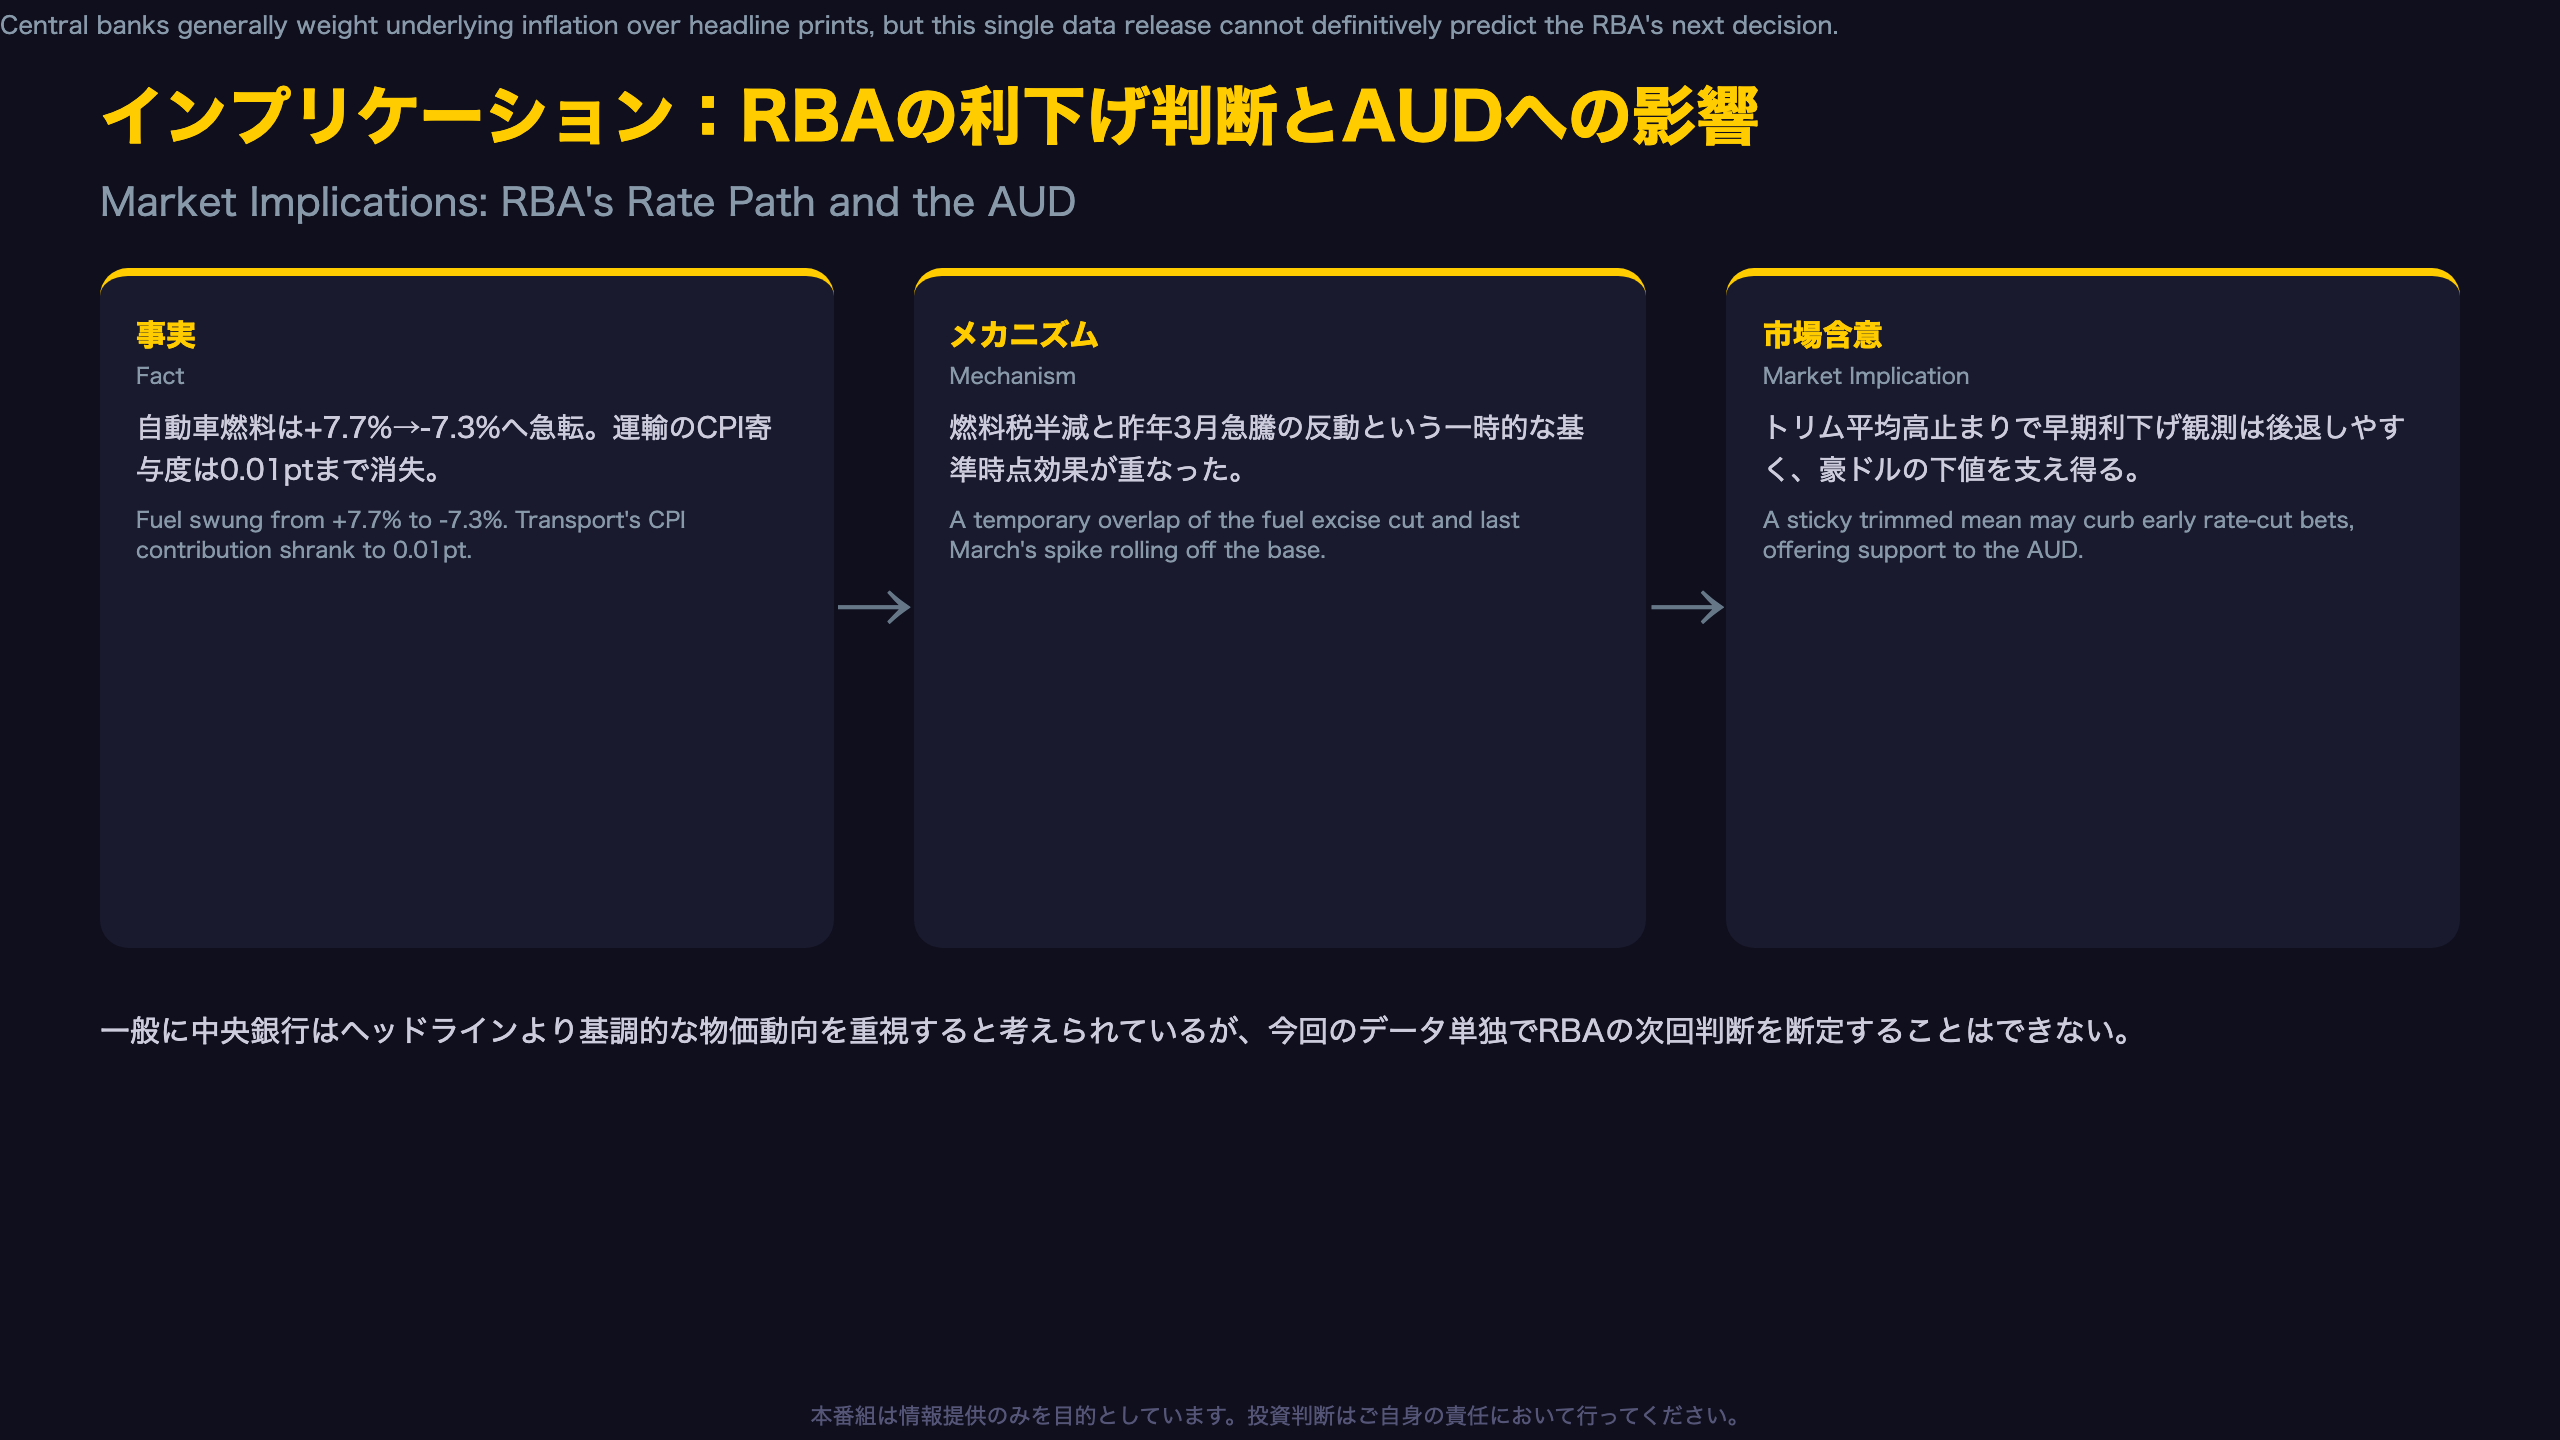
What to Watch Before the Next Release
Australia’s next monthly CPI (July data) is due August 26, 2026. The key question: does the trimmed mean break above 3.6%, or does the ex-volatile items CPI confirm its acceleration to 4.2%?
Markets pricing in RBA rate cuts based on the headline slowdown alone may be getting ahead of themselves. Given this month’s underlying inflation readings, that repricing looks premature.
Per ABS analytical series: “Trimmed mean 0.3% (monthly) / 3.6% (annual, unchanged).”
Dovish (bull) scenario: if fuel-driven headline softness persists for several more months, high-inflation months could eventually roll out of the trimmed mean’s calculation window too, gradually pulling the core measure down.
Hawkish (bear) scenario: if housing and services momentum persists over coming months, the trimmed mean could reaccelerate, forcing the RBA into an extended hold. For AUD positioning, Australian Commonwealth Government Bond yields, and pre-RBA-meeting trades, investors should track the trajectory of underlying inflation gauges — not just the headline print — heading into the August 26 release.
Disclaimer: This article is for informational purposes only. All investment decisions are made solely at your own risk.