📺 Watch the Full Video Analysis
This article was automatically generated by the NFC Market Live AI analysis system. (Updated: 2026-11-17 20:31 JST)
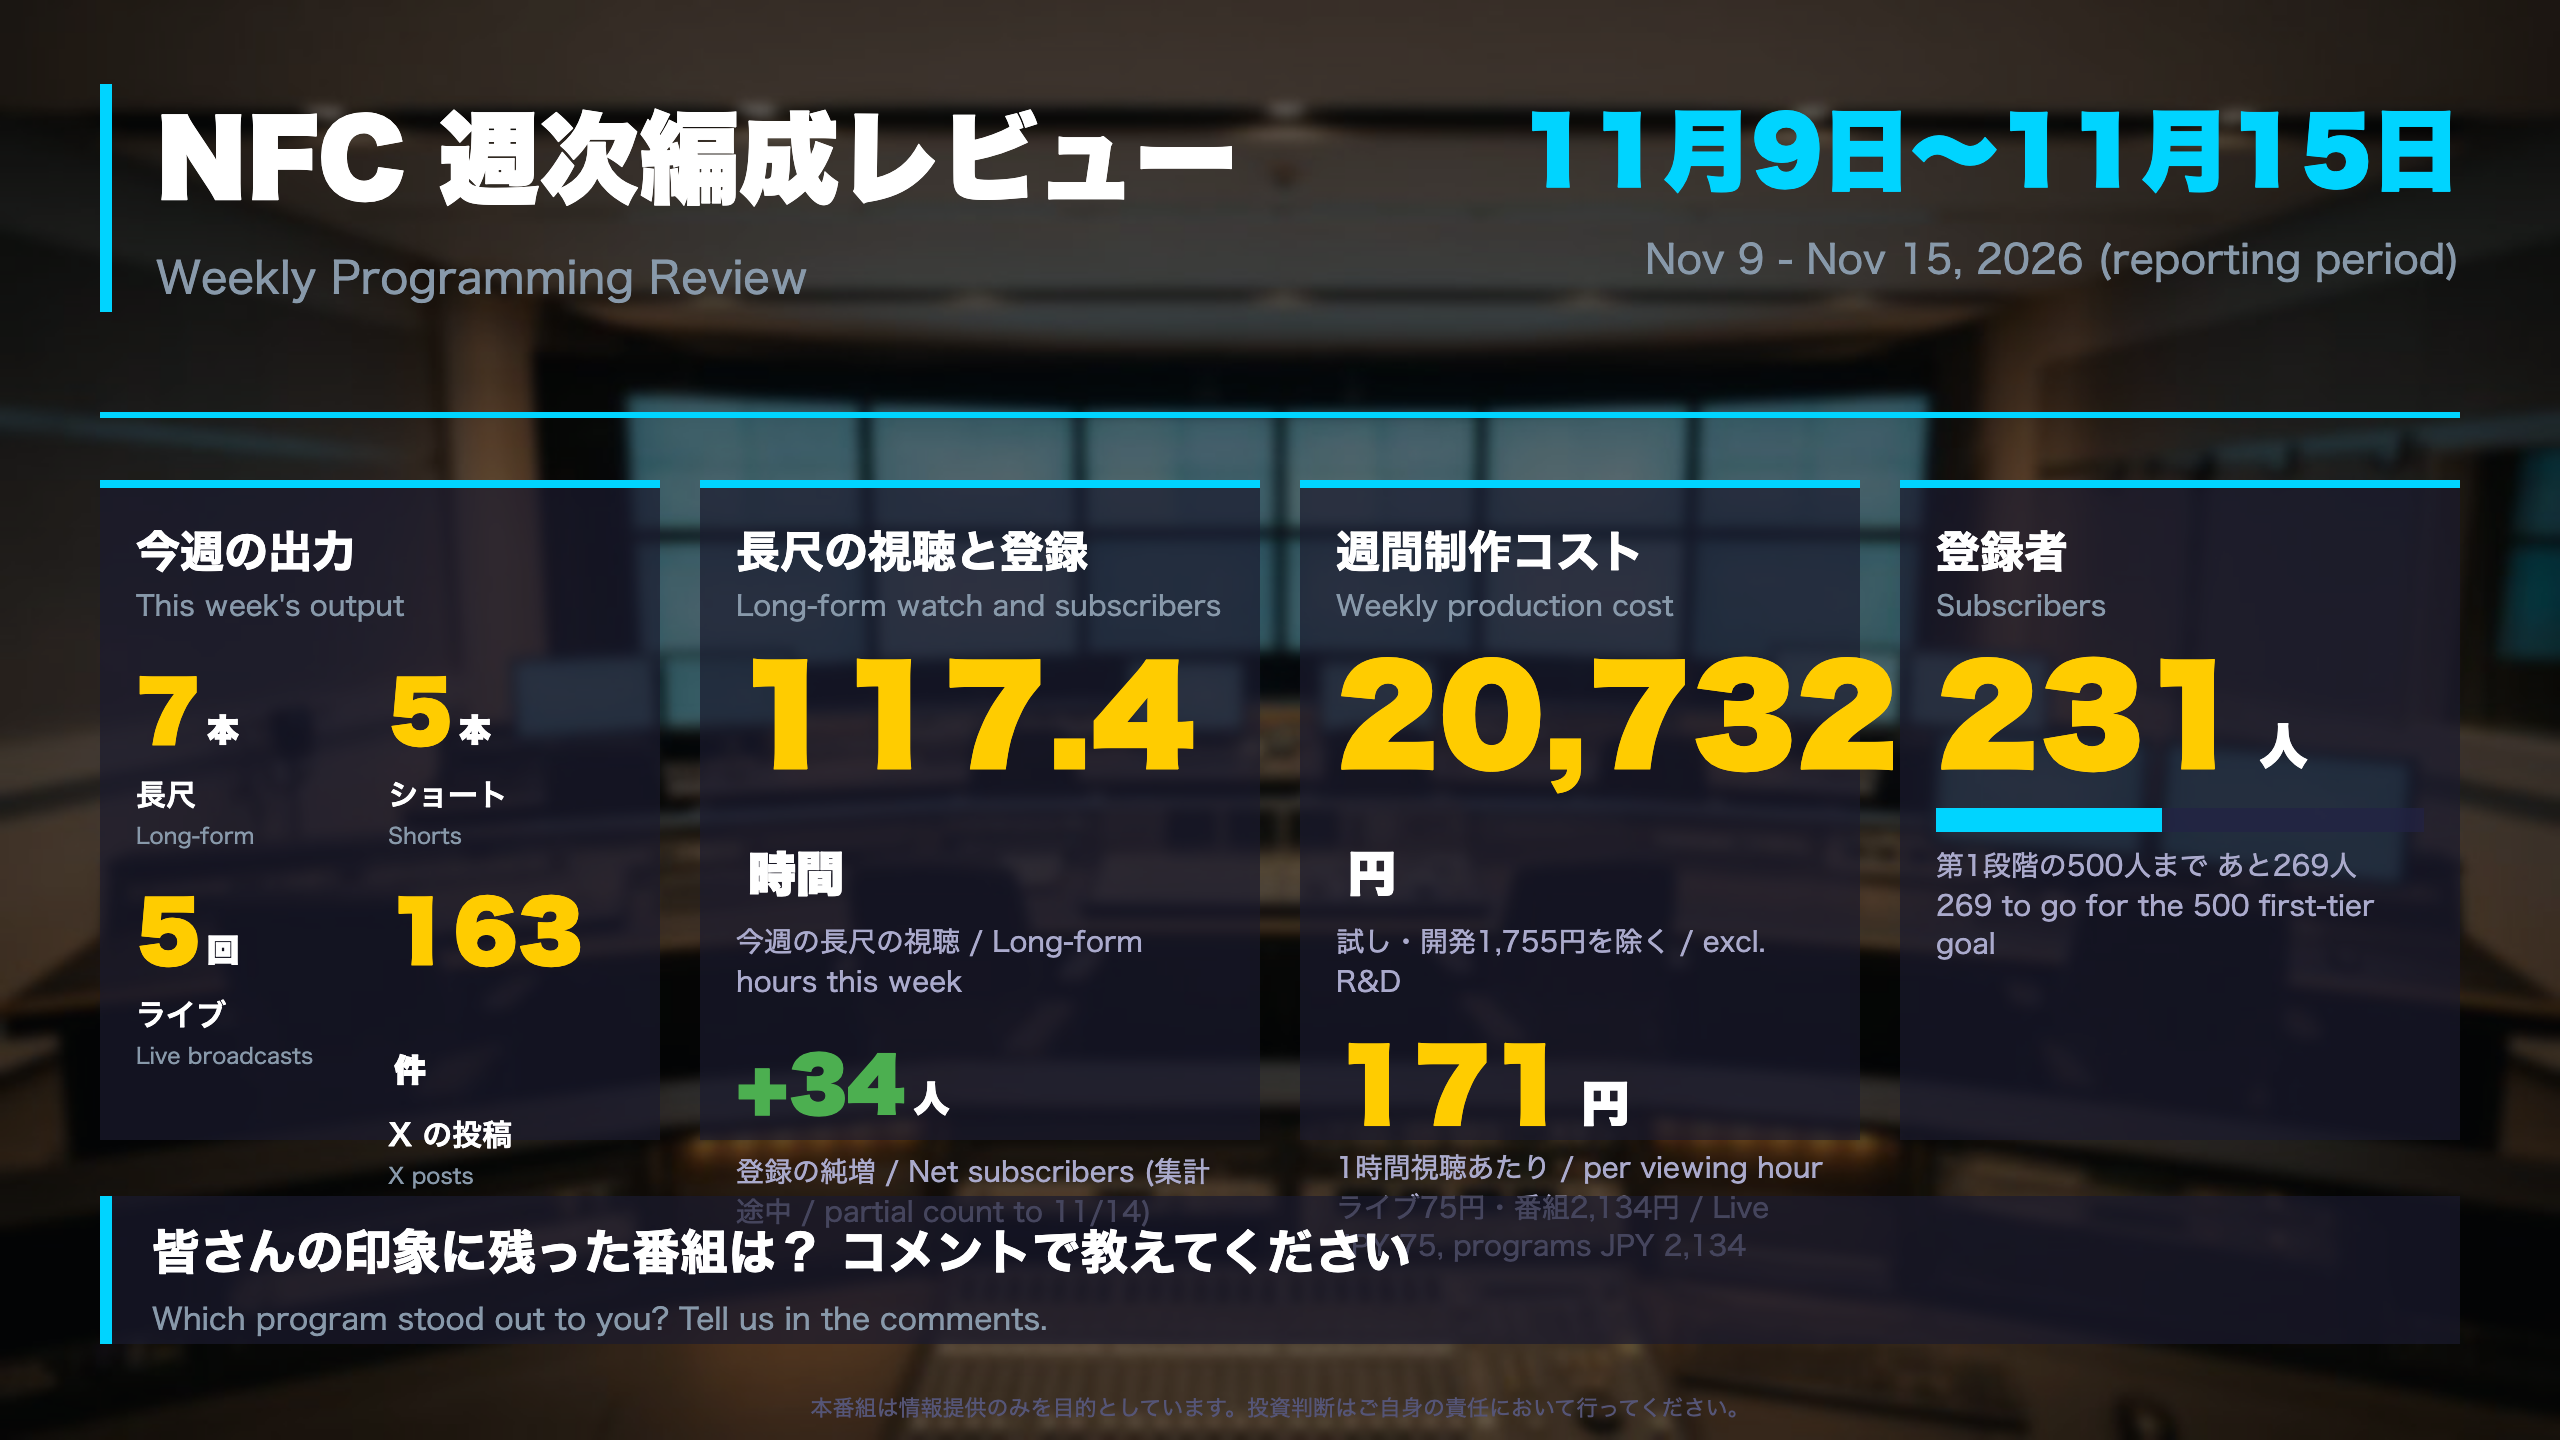
📊 Weekly programming review for Nov 9-15. Long-form viewing reached 117.4 hours (partial count), of which 116.1 hours came from live streams.
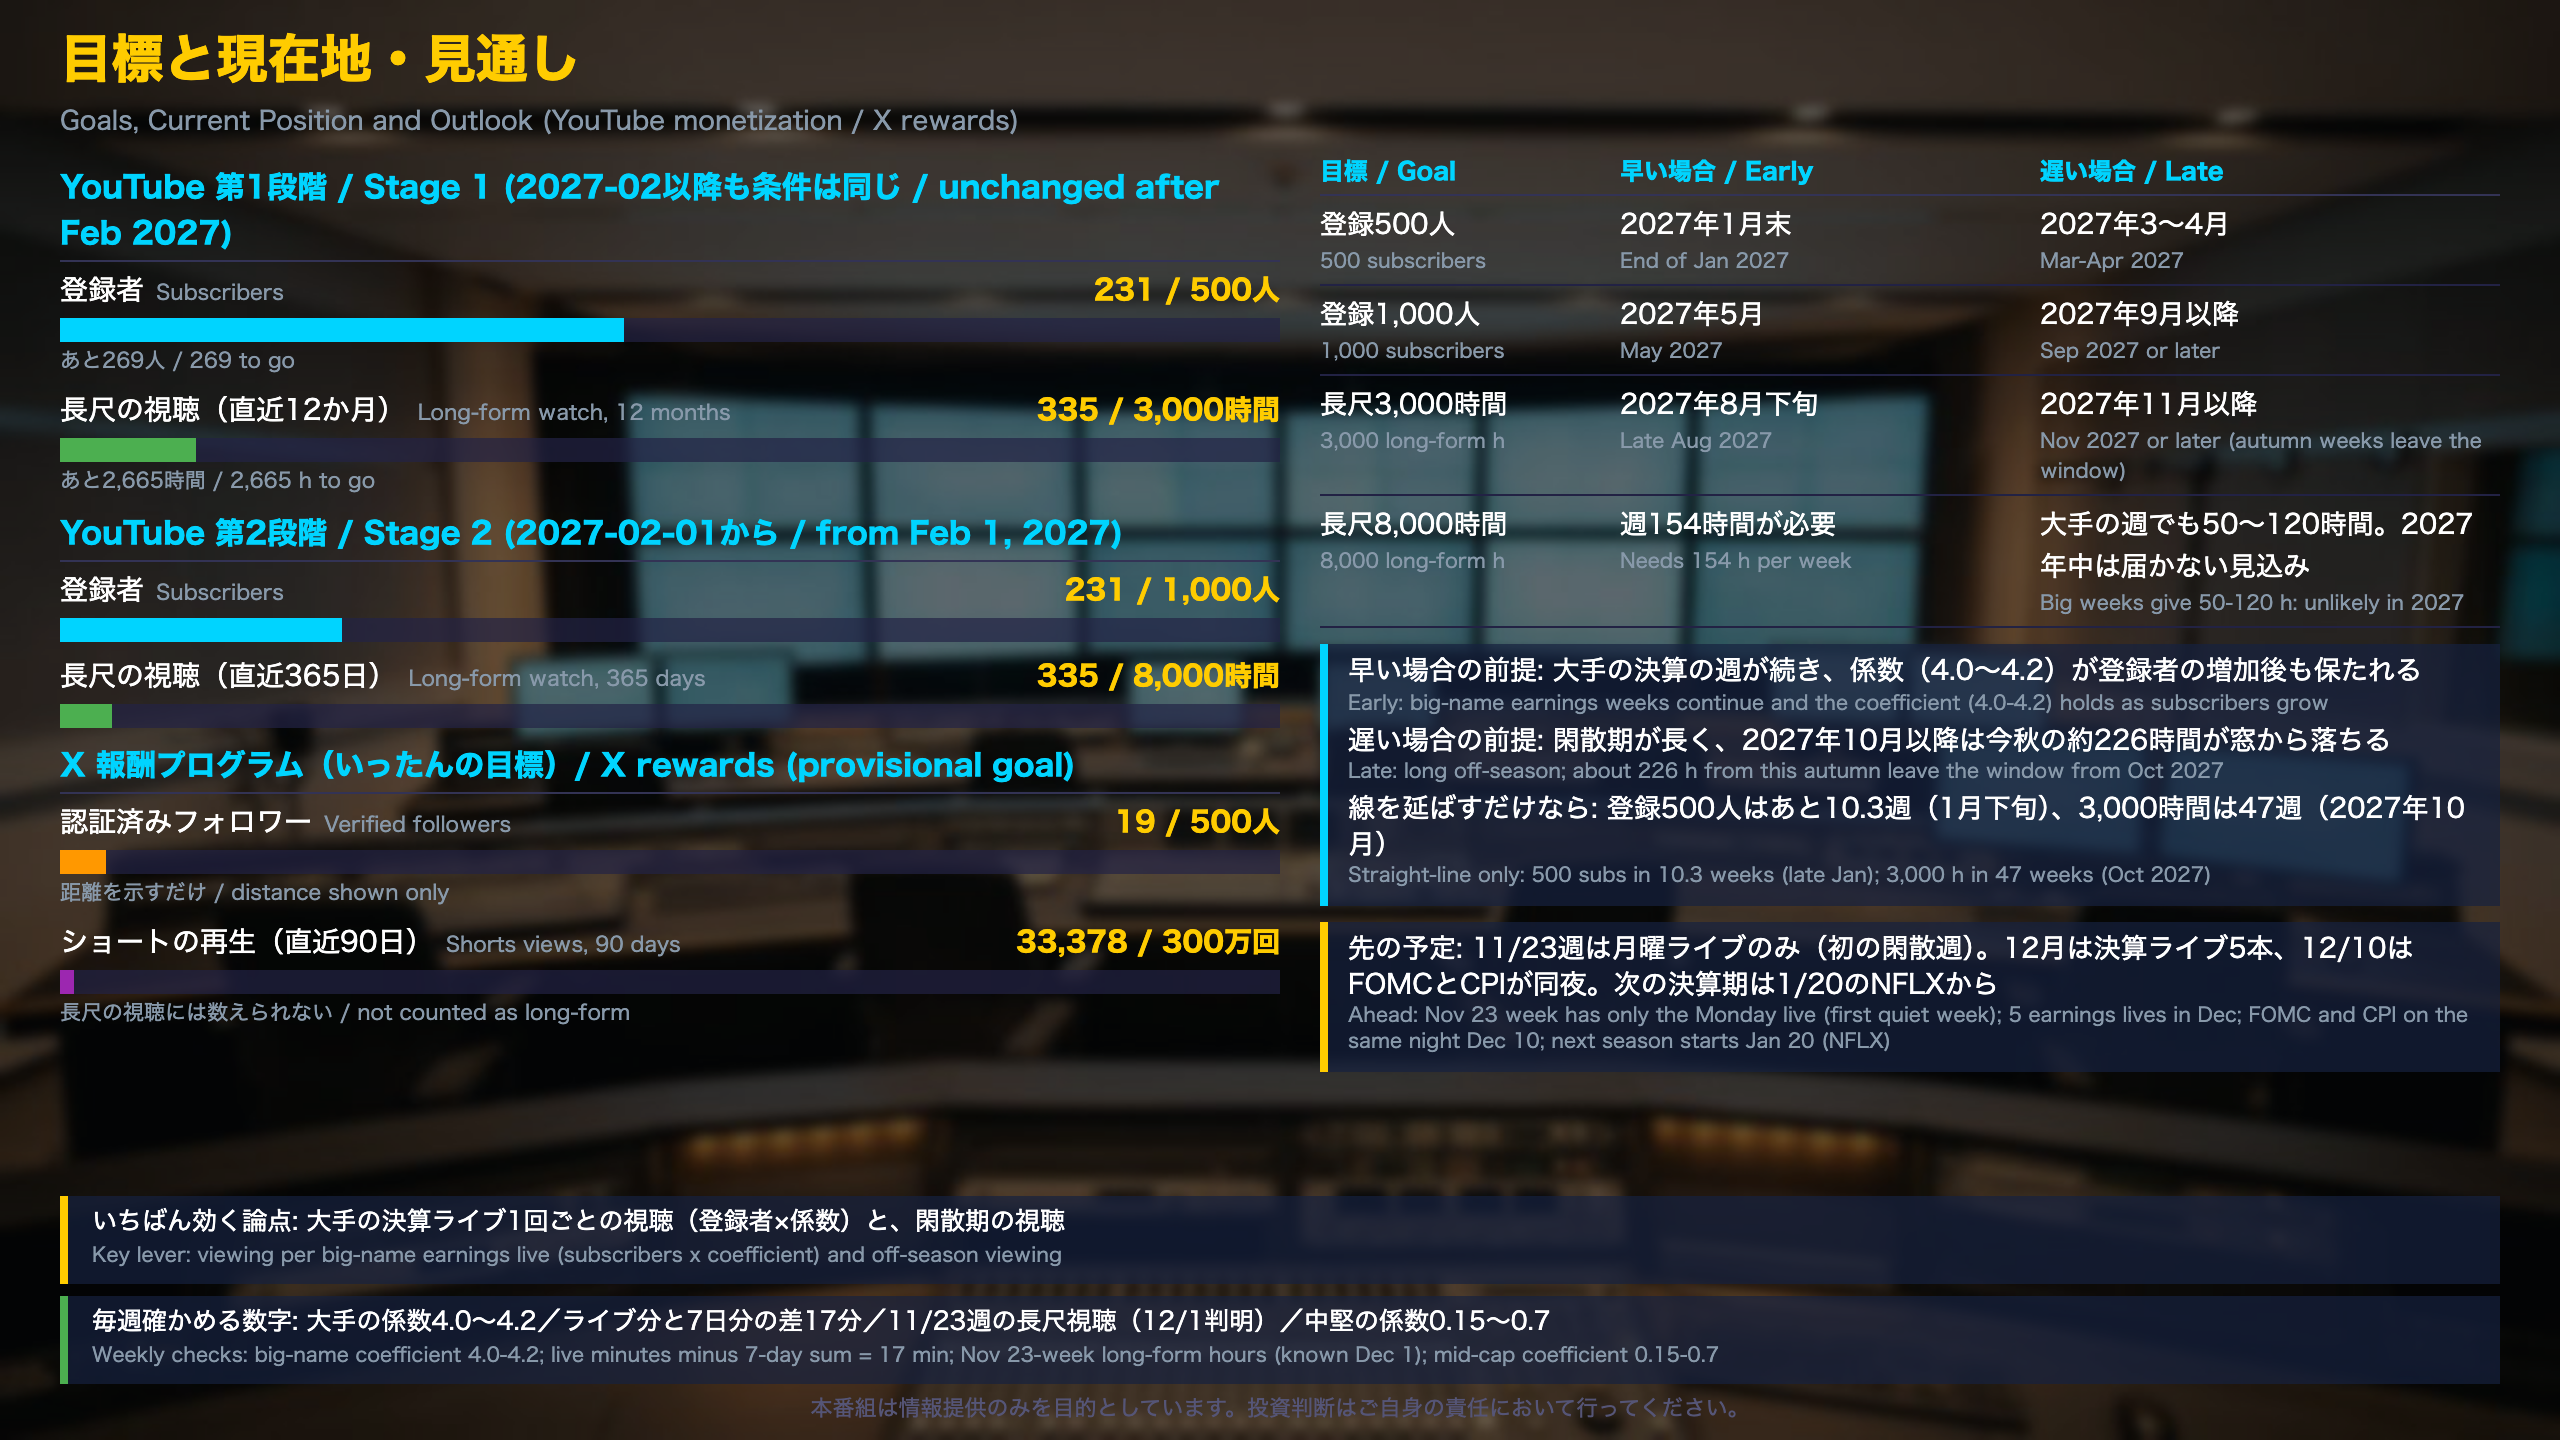
📈 Subscribers stand at 231 (+34 this week), 269 short of the 500 needed for YouTube’s first monetization tier.
⚠️ Regular videos drew only 80 minutes, so viewing still concentrates on earnings lives.
💡 Production cost was JPY 20,732, or JPY 171 per viewing hour (live JPY 75, programs JPY 2,134).
💬 Tell us in the comments which program stood out.
オープニング:今週の編成レビュー
The week at a glance
This review covers Nov 9-15 (YouTube data counted through Nov 14). We published seven long-form videos, five Shorts, ran five live broadcasts and posted 163 times on X.
What drove the numbers
- Long-form viewing: 117.4 hours, up from 49.7 hours the previous week. Live archives supplied 6,965 minutes; regular videos only 80 minutes.
- Subscribers: 231 (net +34 for the week), 269 short of the 500 required for YouTube’s first monetization tier.
- Cost: JPY 20,732 excluding R&D, or JPY 171 per viewing hour (live JPY 75, finished programs JPY 2,134).
Context for overseas readers
NFC Market Live is a Japanese-language channel that explains US and Japanese economic data and US earnings with AI. US earnings arrive after the New York close, so our earnings lives air in early-morning Tokyo, and most viewing lands on those archives. Only public long-form videos and public live archives count toward YouTube’s watch-hour requirement; Shorts do not.
Independent analysis
The editorial forecast made on Nov 8 expected 20-55 long-form hours and +8 to +25 subscribers. Actuals (117.5 hours, +34) beat both ranges, probably because hot AI names such as CoreWeave and Cerebras pull more viewers than their brand recognition implies. The caution is concentration: when nearly all viewing comes from one format, a week without big earnings, such as the Nov 23 week, will reveal the true baseline.
What to watch
NVDA (Nov 18) and PANW (Nov 19) earnings lives, then the first quiet week.
目標と現在地・見通し
What monetization requires
YouTube Partner Program (as checked on Nov 7): Tier 1 (memberships and similar) needs 500 subscribers plus 3,000 public long-form watch hours in the past 12 months. Tier 2 (ads) for new channels from Feb 1, 2027 needs 1,000 subscribers and 8,000 hours over 365 days. Shorts, unlisted or private videos and deleted live archives do not count; public live archives do.
X Creator rewards: Premium, 500 verified followers and 500,000 home-timeline impressions over 90 days. We show distance only: 19 verified followers today, 6.5% of 292.
How the range is built
Weekly long-form hours behave like a sum over live events: (subscribers at broadcast times a topic coefficient) plus search and related traffic. Big-name earnings lives show coefficients of 4.0-4.2; CoreWeave reached 14.6 over six days; mid-caps such as AMD and Qualcomm sit near 0.7, Cloudflare near 0.15.
Independent analysis
- The early case depends on the coefficient surviving subscriber growth. There are only eight big-name data points and NVDA is untested.
- The late case is the off-season. The channel has never had a week without earnings, and from October 2027 roughly 226 hours from this autumn roll out of the 12-month window.
- 8,000 hours implies about 154 hours a week, versus 50-120 in a strong earnings week, so it is out of reach in 2027 on the current format.
Note: earnings land after the New York close, so our lives air in early-morning Tokyo.
SNS 全体の推移(28日間)
Reading the 28-day chart
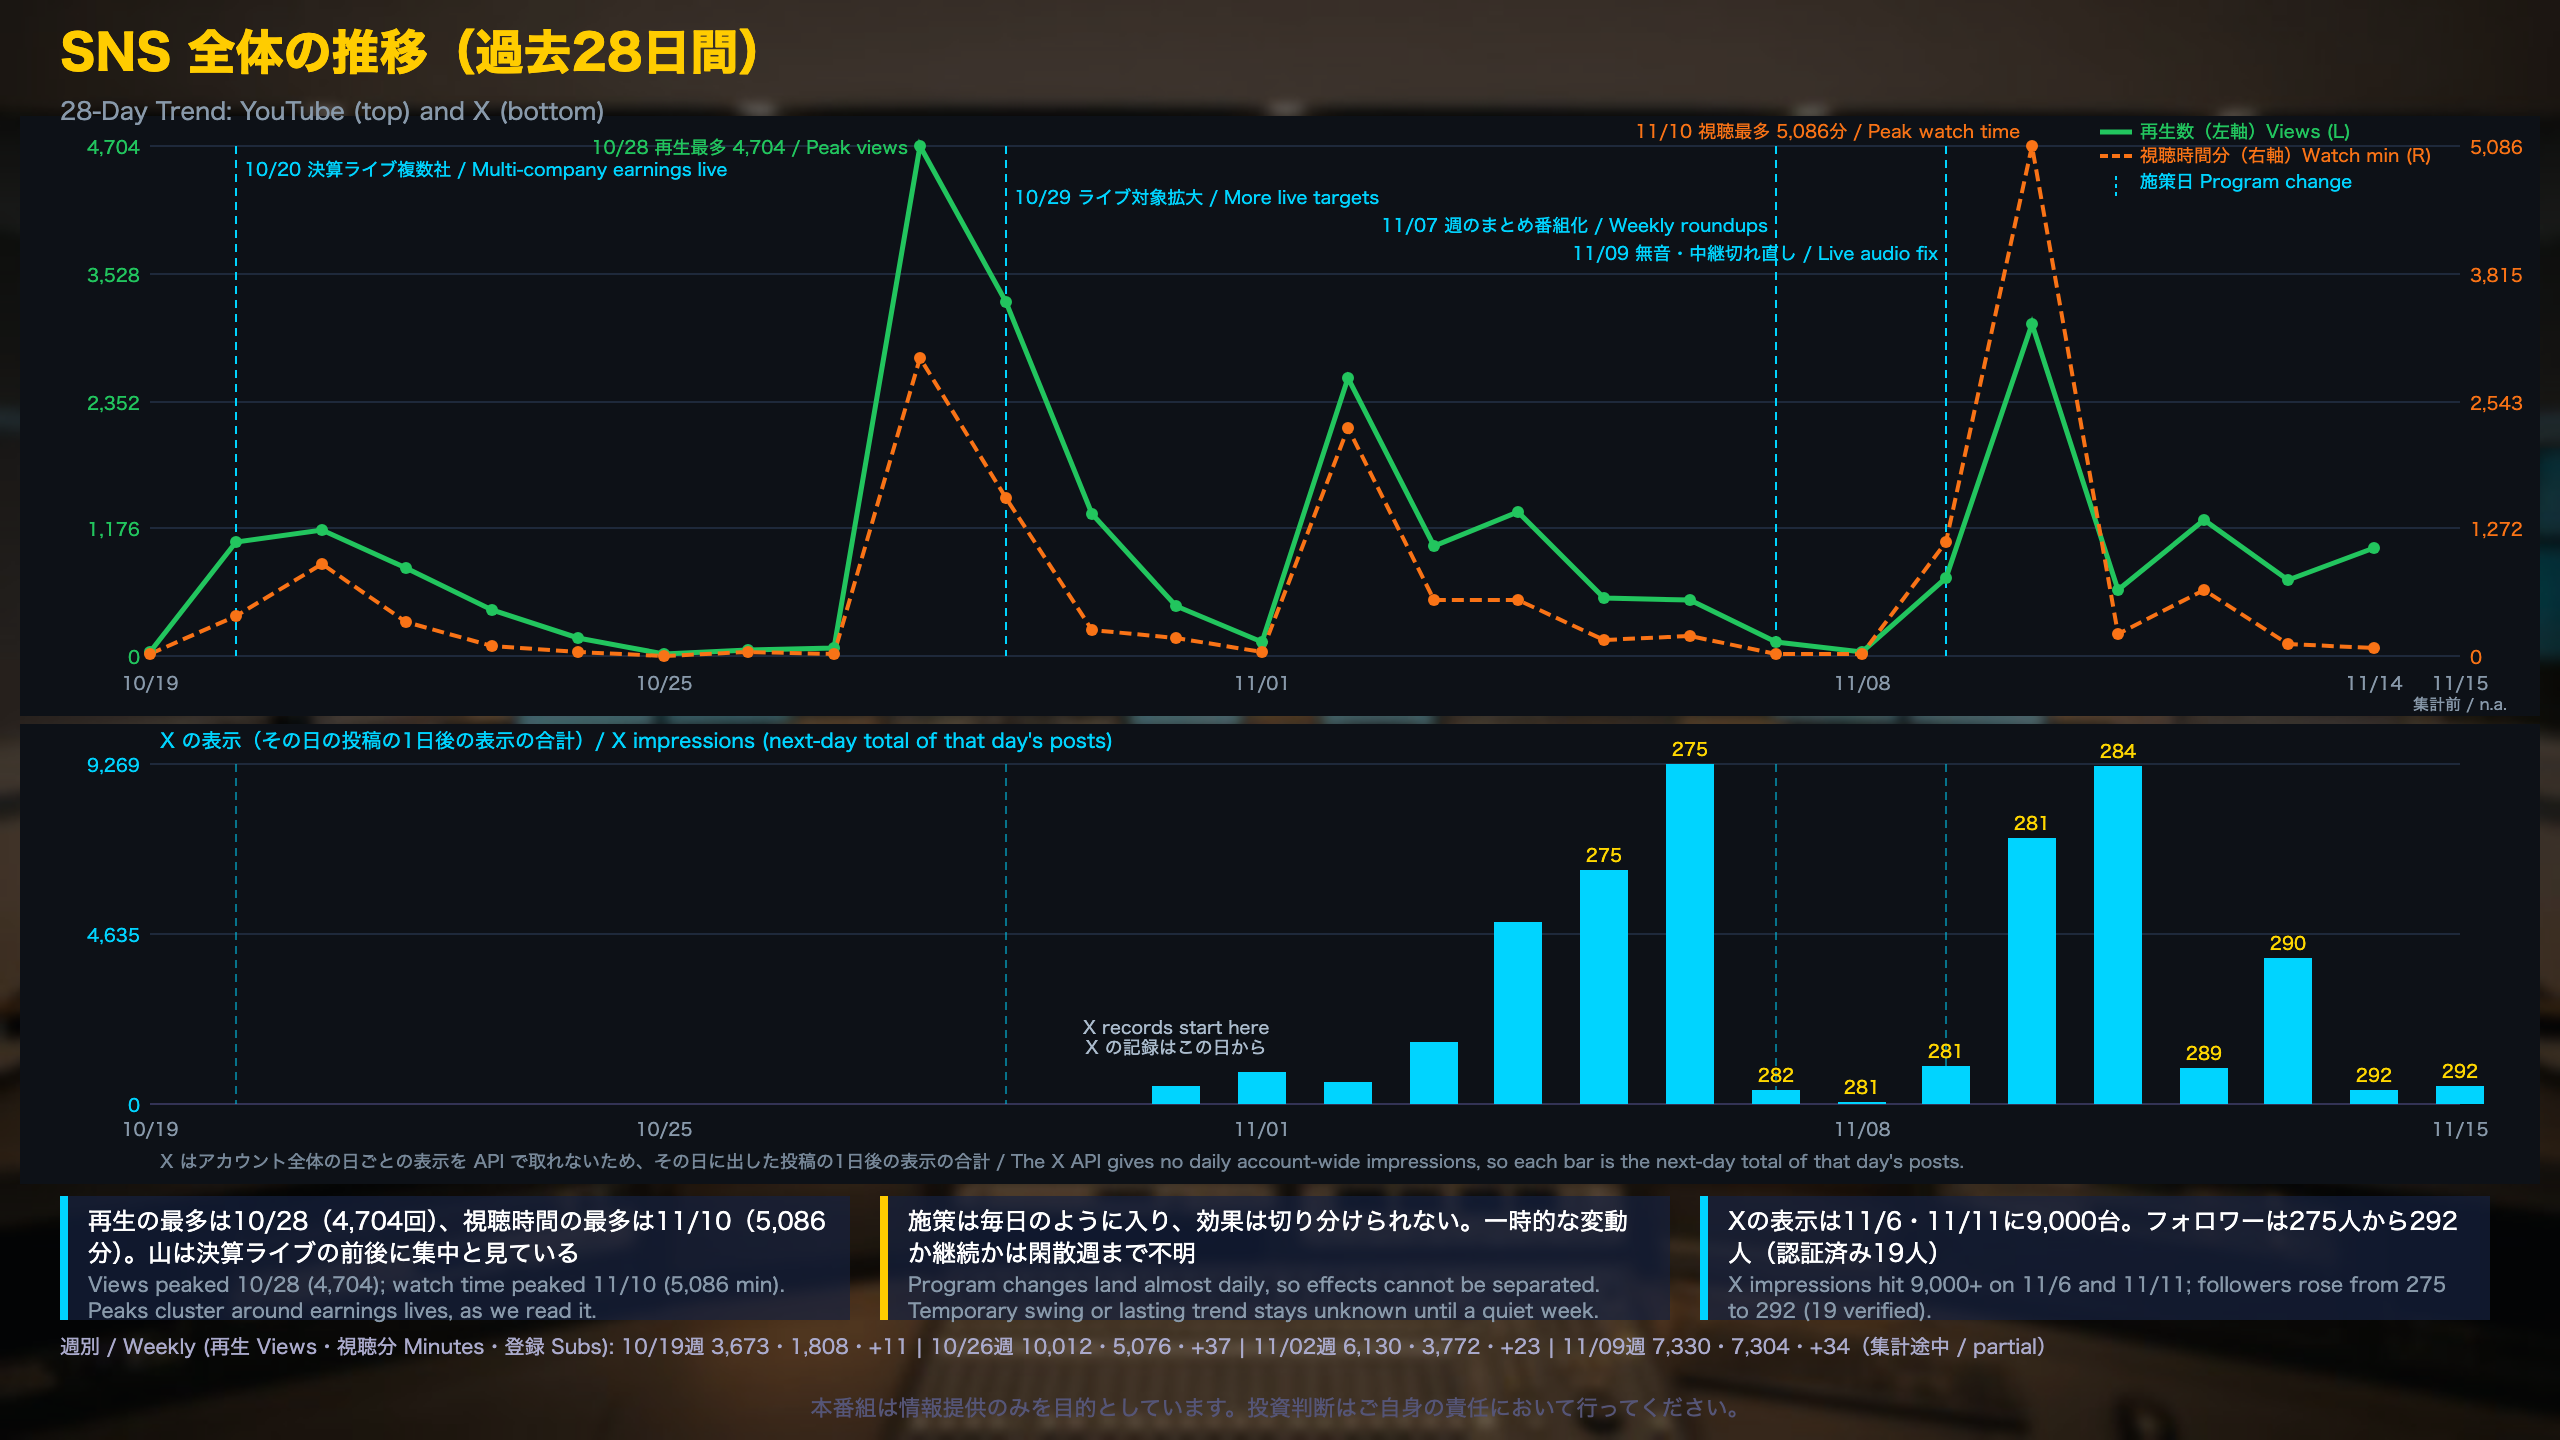
The top panel plots daily YouTube views (green, left axis) against watch minutes (orange, right axis). The bottom panel shows X impressions, defined as the next-day impressions of that day’s posts, because the X API does not expose account-wide daily impressions. X data only starts around Oct 31.
Weekly picture
- Oct 19 week: 3,673 views, 1,808 minutes, +11 subscribers
- Oct 26 week: 10,012 views, 5,076 minutes, +37
- Nov 2 week: 6,130 views, 3,772 minutes, +23
- Nov 9 week (partial, to Nov 14): 7,330 views, 7,304 minutes, +34
Views versus watch time
Views peaked on Oct 28 (4,704) but watch time peaked on Nov 10 (5,086 minutes) with fewer views (3,066). We read that as live archives being watched for longer on the latter day. YouTube Analytics dates are in Pacific time, so a spike can sit a day away from the Tokyo broadcast date.
Independent analysis
Program changes (dashed lines) land almost daily, so attribution is not possible. Valleys between peaks still run at 25-128 views a day, which suggests the baseline has not obviously risen; the bull reading is that each peak is higher than the last.
On X, impressions hit 9,269 on Nov 6 and 9,215 on Nov 11, but several live-coverage posts were missed on Nov 10 and 13 because of API credit limits, so the data understate the potential. Followers moved from 275 (Nov 5) to 292 (Nov 15); 19 are verified.
Why it matters: US earnings arrive in Tokyo’s early morning, so the channel’s reach is event-driven rather than steady.
YouTube 完パケ ① ショート:再生の多さと見られ方、目標への効き
Digging into this week’s Shorts
The five new Shorts
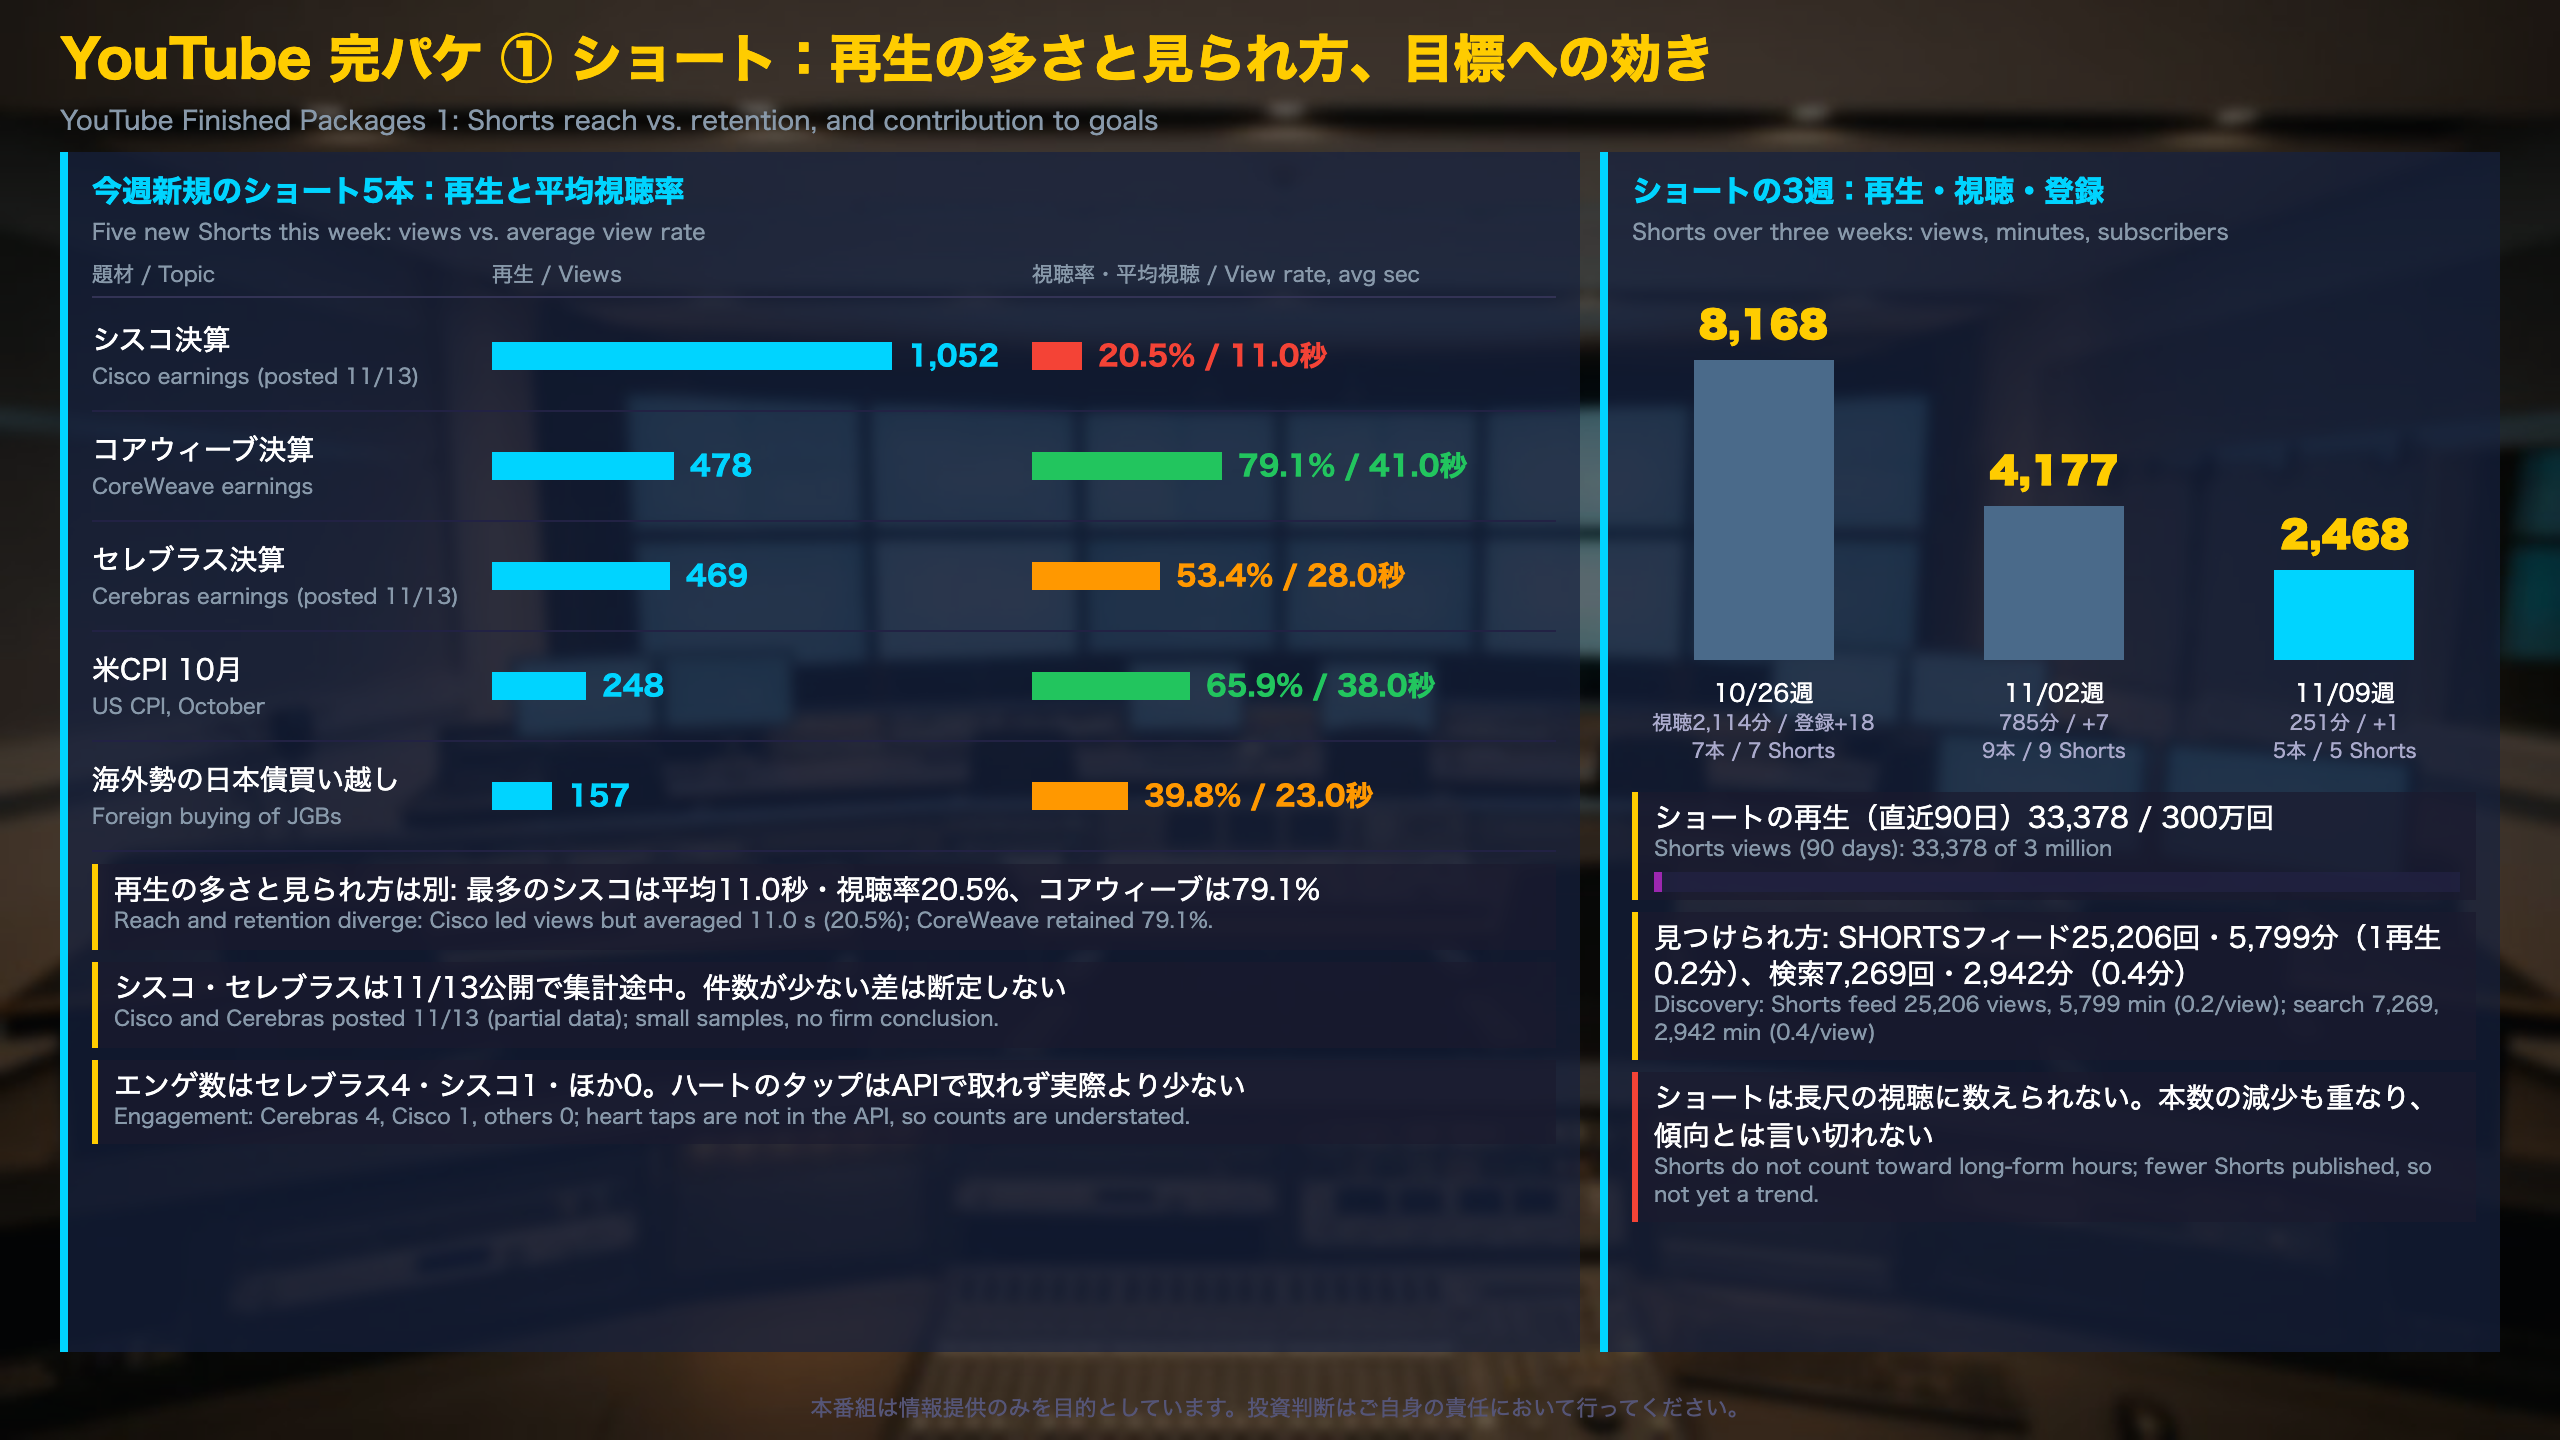
- Cisco earnings: 1,052 views, 11.0 s average, 20.5% view rate
- CoreWeave earnings: 478 views, 41.0 s, 79.1%
- Cerebras earnings: 469 views, 28.0 s, 53.4%, 4 engagements
- US CPI (October): 248 views, 38.0 s, 65.9%
- Foreign flows into Japanese bonds: 157 views, 23.0 s, 39.8%
Cisco and Cerebras went live on Nov 13, so only two to three days are counted.
Why view rate matters
YouTube Shorts are served from a swipe feed (25,206 views over 90 days, 0.2 minutes per view) and from search (7,269 views, 0.4 minutes per view). A Short with a strong topic can win the swipe but lose the viewer in the first seconds; the average-view-rate figure is the best proxy for that. Engagement counts are understated because heart taps are not available through the API.
Independent analysis
The three-week slide in Shorts views (8,168, 4,177, 2,468) and net subscribers (+18, +7, +1) coincides with fewer Shorts published (7, 9, then 5), and several companies were moved to no-Short coverage, so volume rather than quality may explain much of it. Critically for the monetization goal, Shorts never count toward the 3,000 long-form hours; they only matter through the alternative 3 million Shorts-view route, where we stand at 33,378 over 90 days.
On X, Shorts posted natively averaged 89 impressions in Japanese and 42 in English; a Nebius Short drew 212 video views there.
YouTube 完パケ ② 長尺:視聴時間の検証と投資対効果
Why regular long-form viewing is so small
Weekly trend
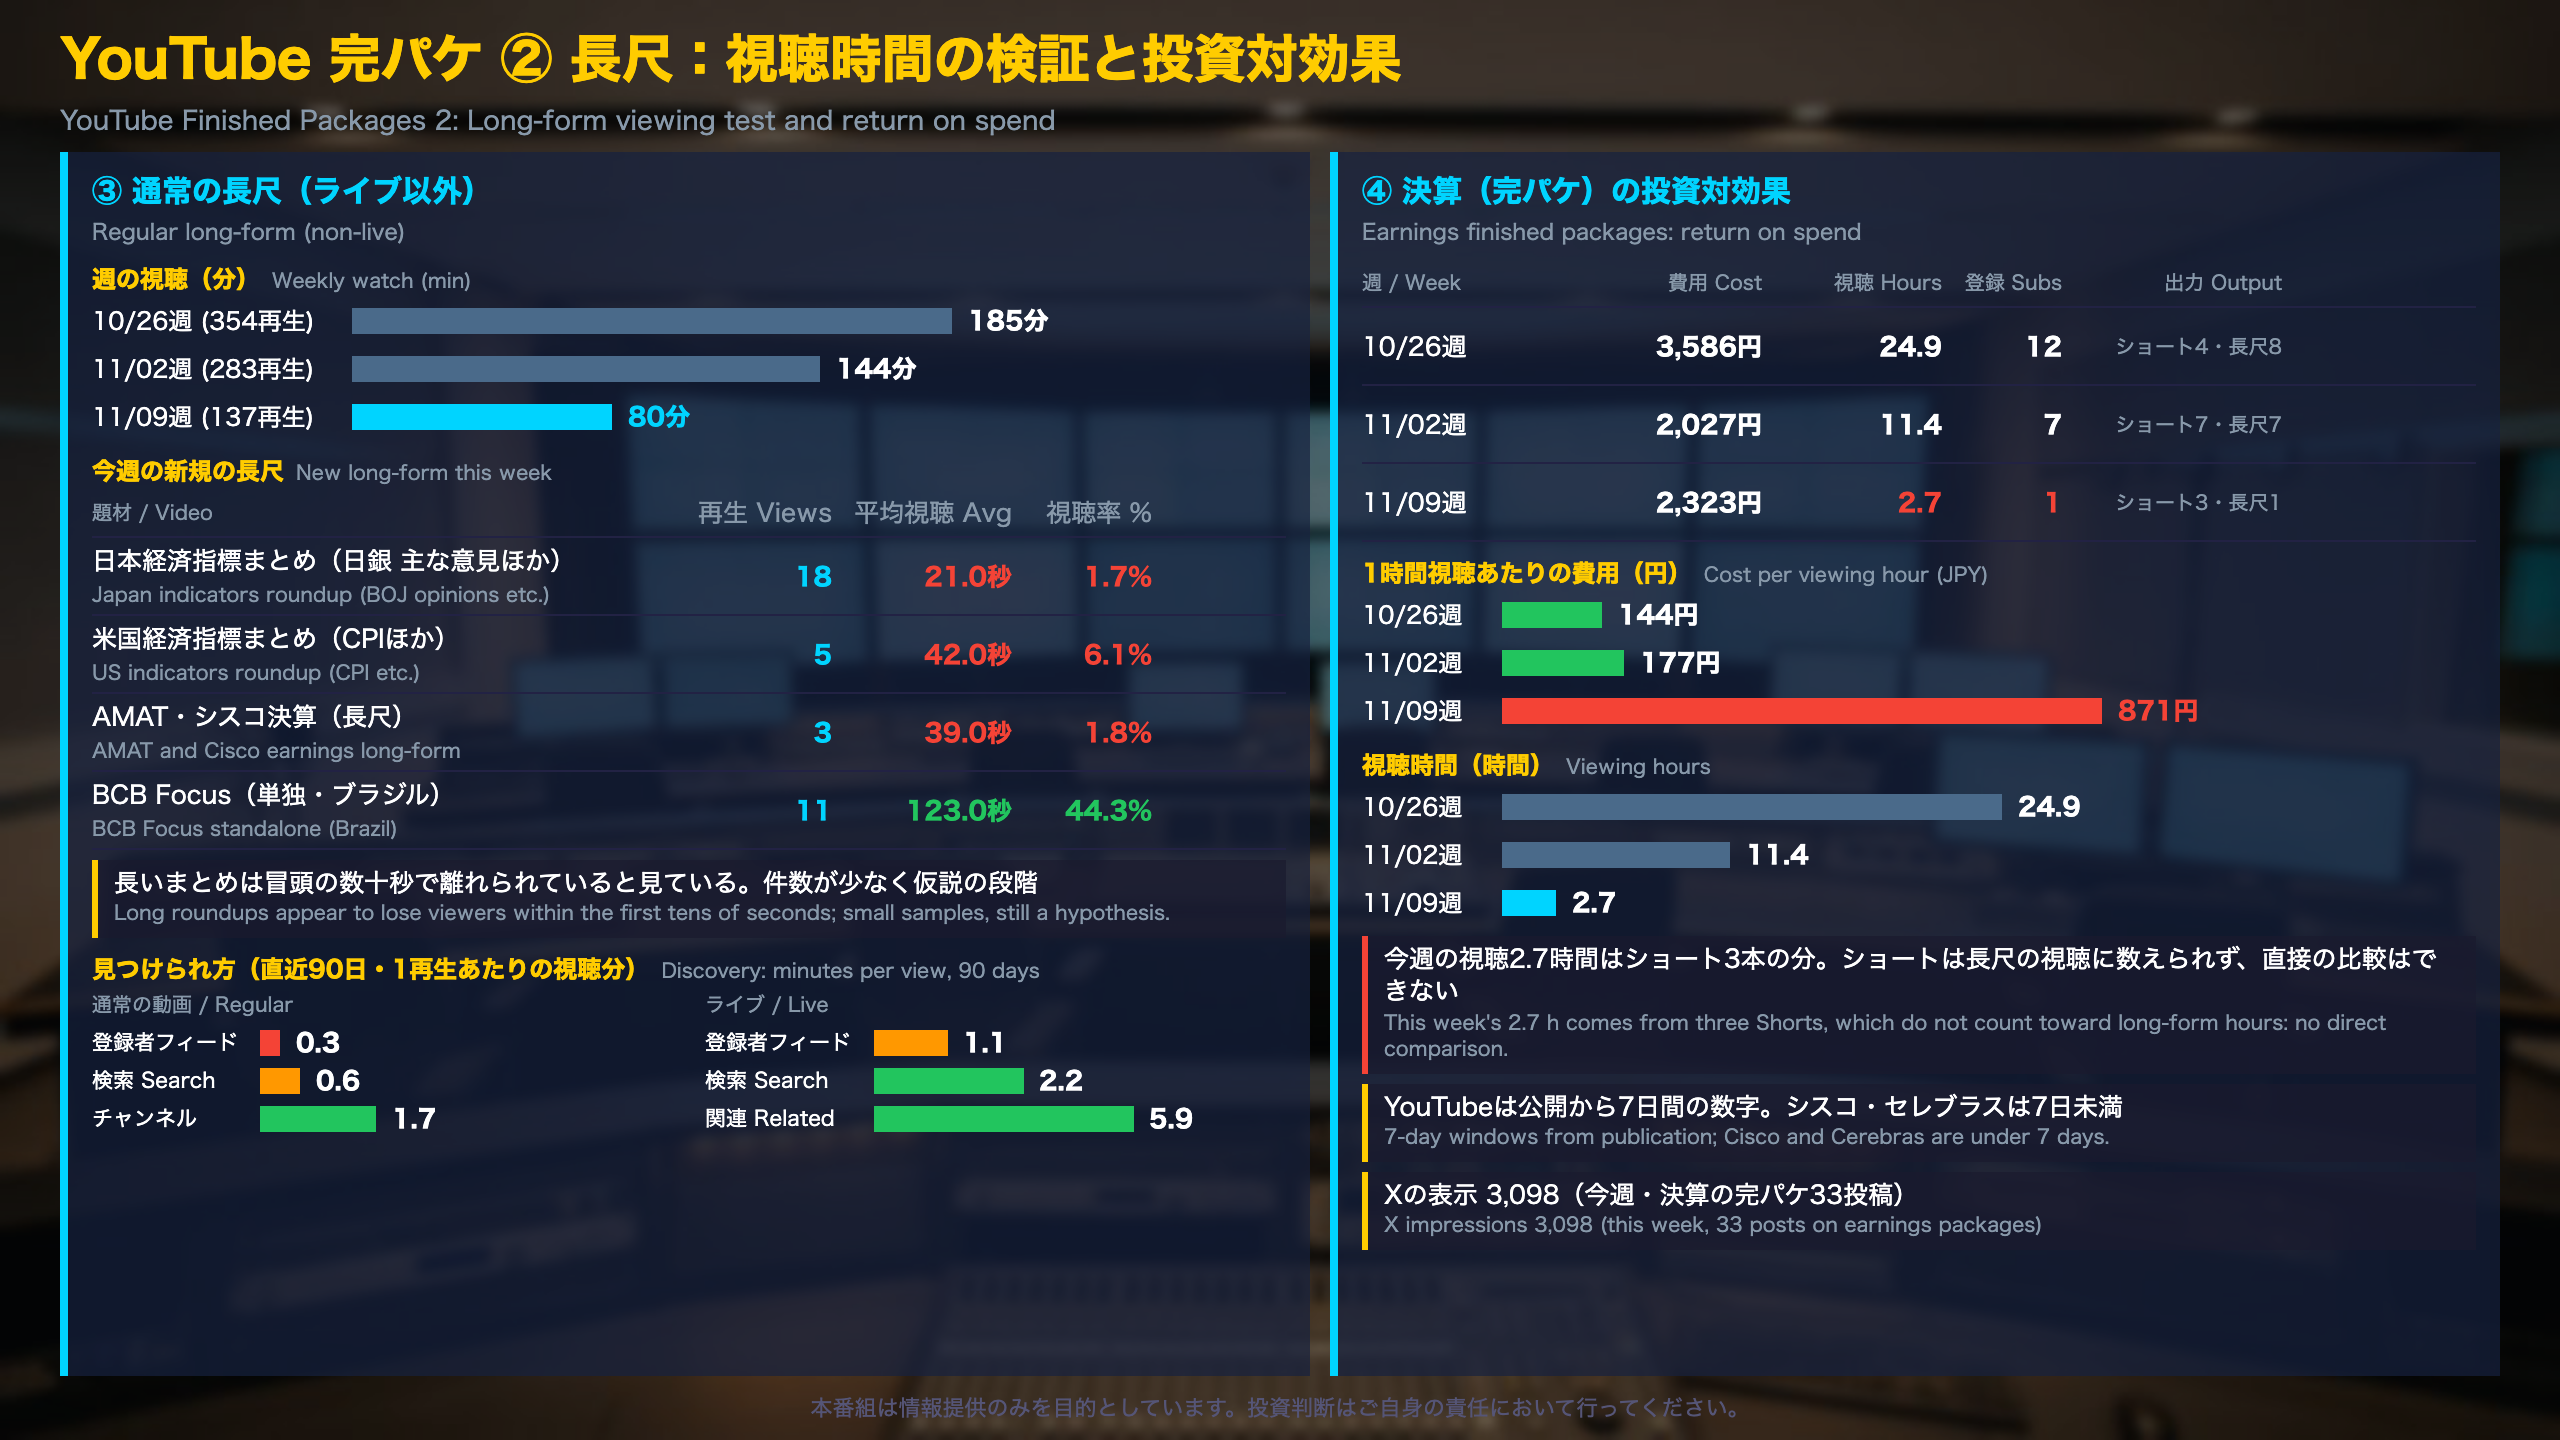
Regular (non-live) long-form videos drew 354 views and 185 minutes in the Oct 26 week, 283 views and 144 minutes in the Nov 2 week (+5 subscribers), and 137 views and 80 minutes in the Nov 9 week. The number of long-form videos published fell from 49 to 23 to 7 as standalone videos were folded into weekly roundups.
Testing the hypothesis
Our programming analysis hypothesizes that subscribers click in from their feed but leave in the opening seconds. This week’s four new uploads fit that: the Japan roundup (18 views, 21.0 s average, 1.7% view rate), the US roundup (5 views, 42.0 s, 6.1%) and the AMAT/Cisco earnings video (3 views, 39.0 s, 1.8%). The BCB Focus video, a short standalone piece on Brazilian central bank survey forecasts, lasted much longer (11 views, 123.0 s, 44.3%). The samples are tiny.
Subscriber-feed views average only 0.3 minutes per view on regular videos, versus 1.1 for live streams and 5.9 for live videos reached via related-video suggestions.
Return on spend for finished earnings packages
Cost per viewing hour went from JPY 144 to 177 to 871 while viewing hours fell from 24.9 to 11.4 to 2.7. Two caveats: this week’s hours come from three Shorts, which do not count toward long-form requirements, and some videos have less than seven days of data.
Independent analysis
The claim that more subscribers will bring more long-form viewing does not hold yet: subscribers tripled since mid-year while non-live minutes fell from 160-462 to 60-185 a week. The roundup test (data Nov 21-22) will show whether a better format changes this.
YouTube ライブ ① 視聴は「1回の突出」と「アーカイブ」
What happened
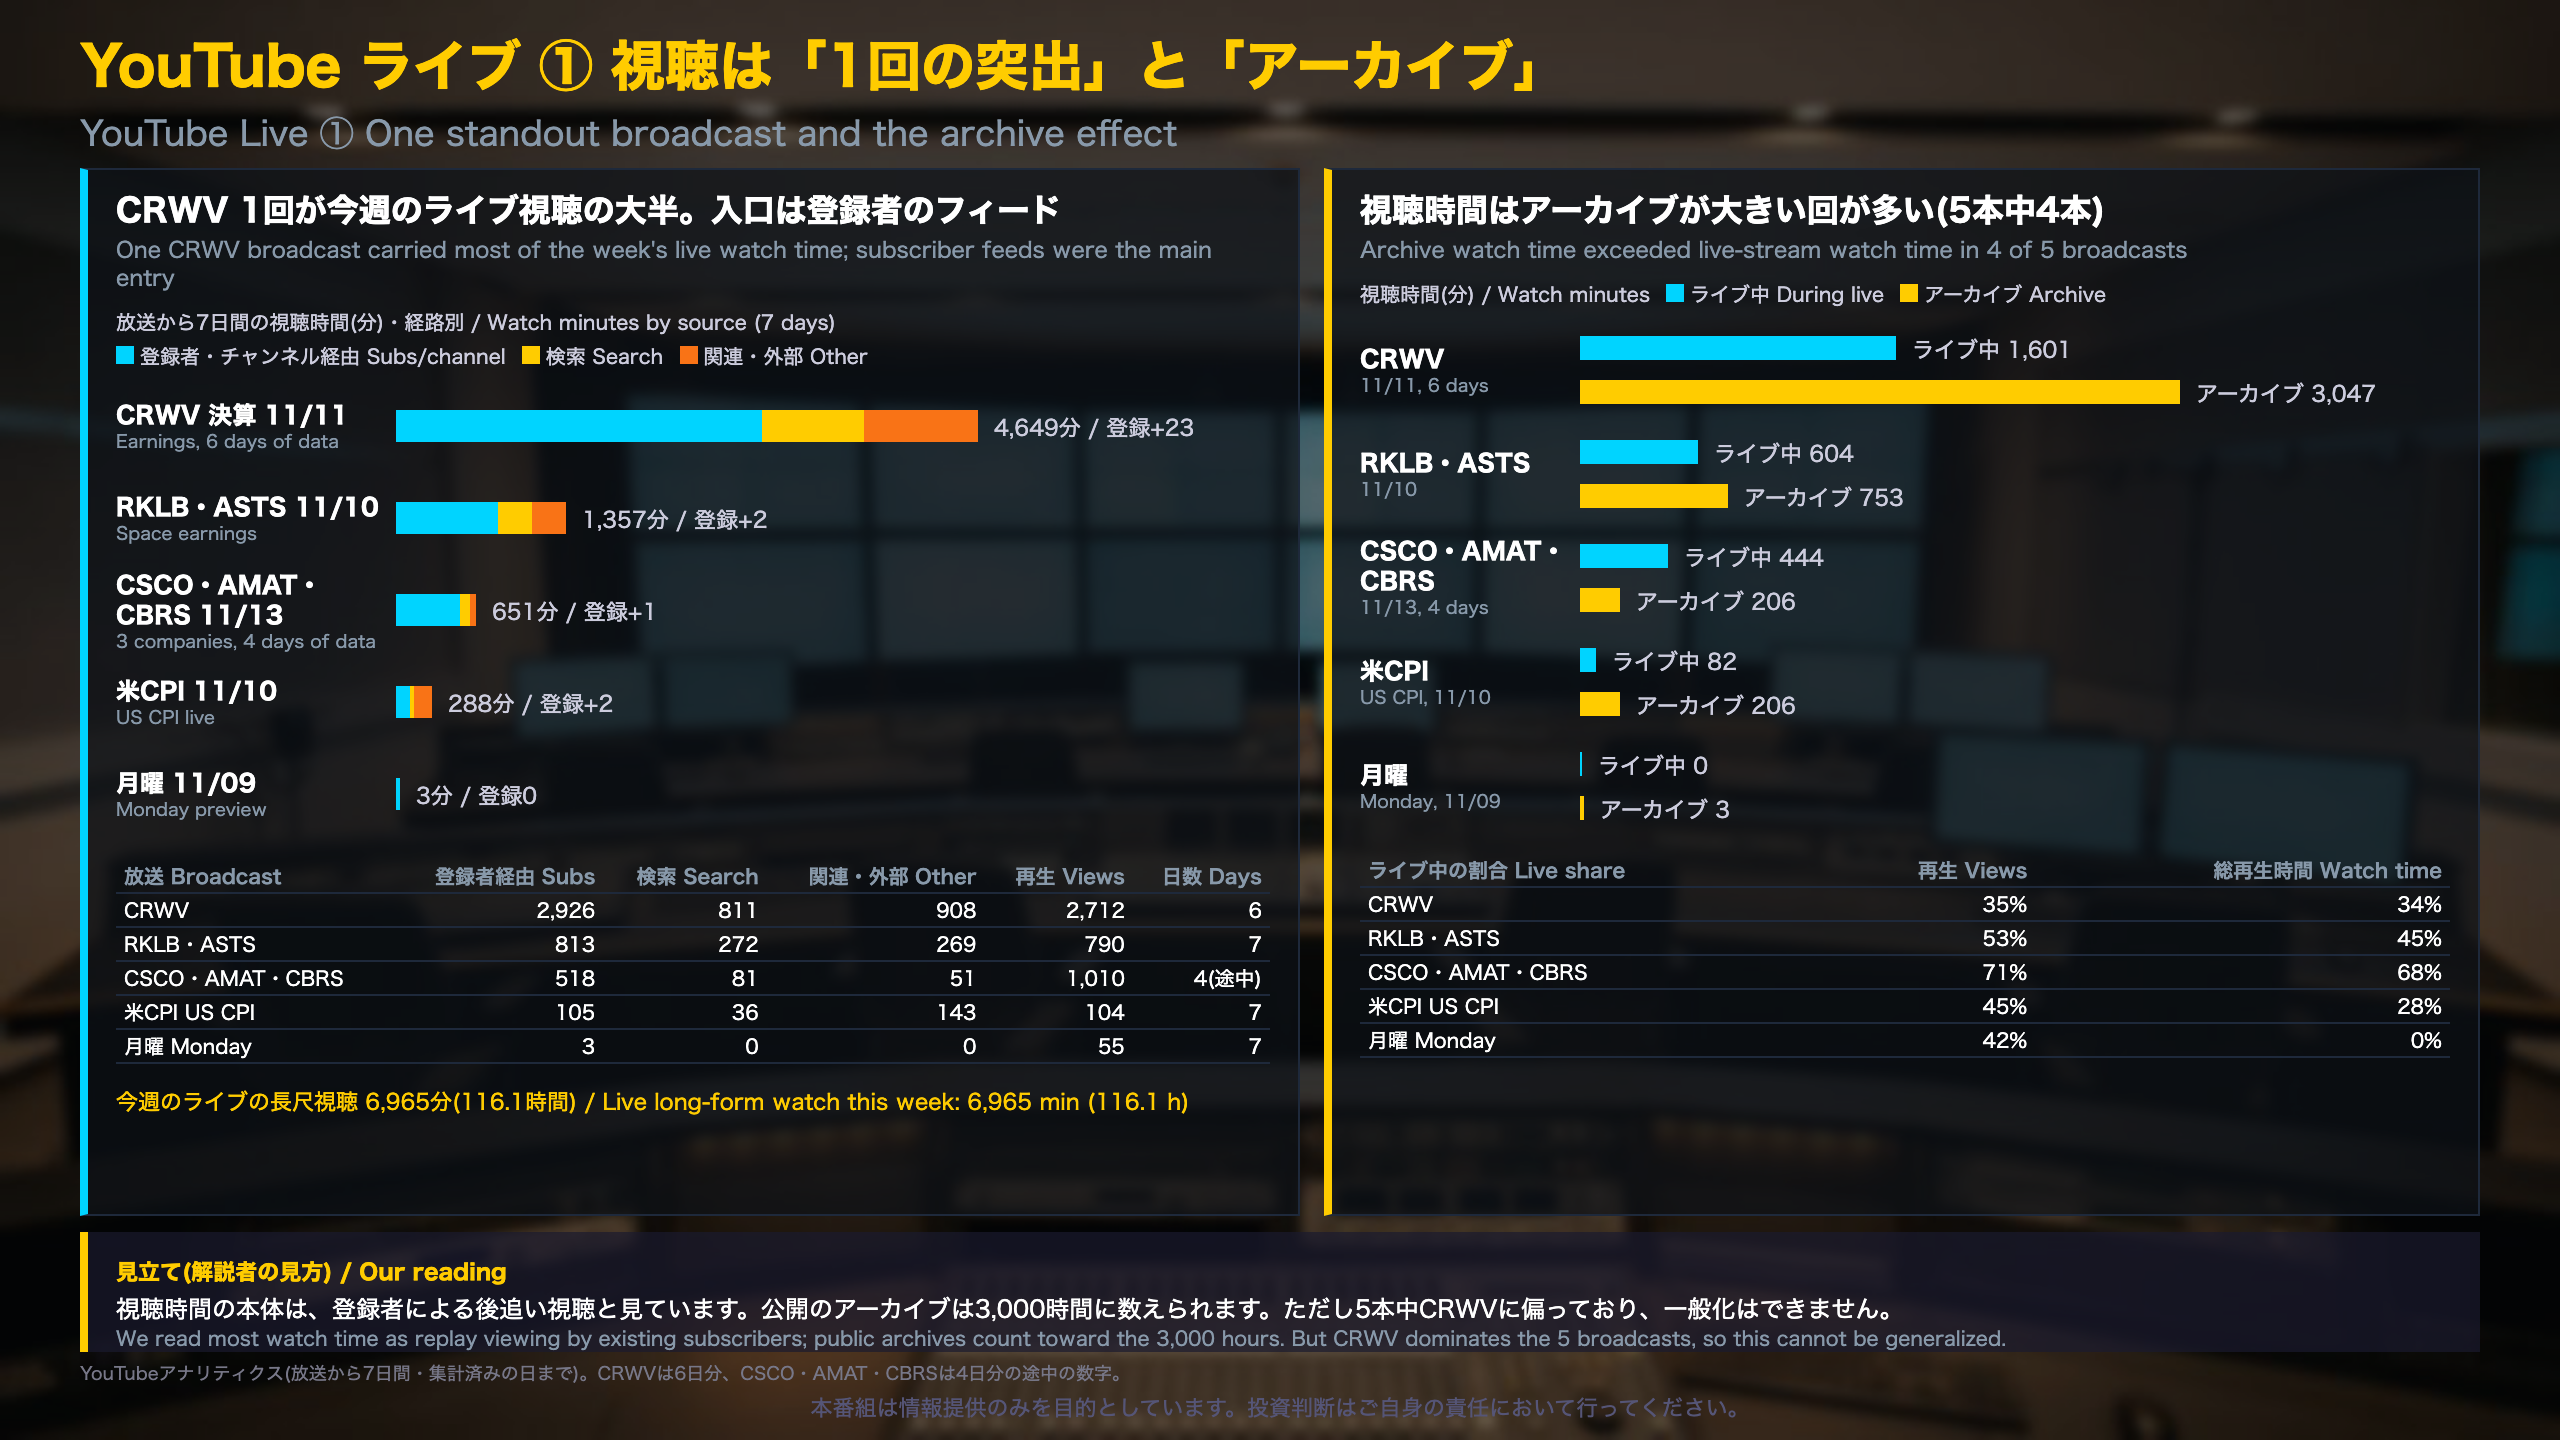
Only one of this week’s five YouTube live broadcasts moved the needle: the CoreWeave (CRWV) earnings live. In its first six days it logged 4,649 minutes of long-form watch time and +23 subscribers, against 6,965 minutes (116.1 hours) for all of the week’s live streams combined.
Context for non-Japanese readers
NFC Market Live is a small Japanese-language channel with 231 subscribers. YouTube Partner Program Tier 1 requires 500 subscribers and 3,000 public long-form hours over 12 months. Archives of live streams kept public count toward those hours; Shorts do not. That is why archive behavior matters.
Key observations
- Entry point: Of CRWV’s 4,649 minutes, 2,926 came via subscribers’ feeds and channel pages, 811 via search and 908 via related or external sources.
- Live vs. archive: In 4 of 5 broadcasts, archive watch time exceeded live-stream watch time (CRWV: 3,047 vs 1,601 minutes). The exception, Cisco/Applied Materials/Cerebras, has only four days of data.
- Caveat: One broadcast dominates and n=5.
Why it matters
This looks like an event-driven audience: viewers arrive for a hot AI name, then watch the replay. Whether it repeats for NVIDIA’s earnings on Nov 18 is the next test. For comparison, a US channel of this size would normally rely on search; here subscribers’ feeds dominate.
YouTube ライブ ② 放送が進むほど人が増え、品質課題は特定の回に集中
Concurrent viewers by segment
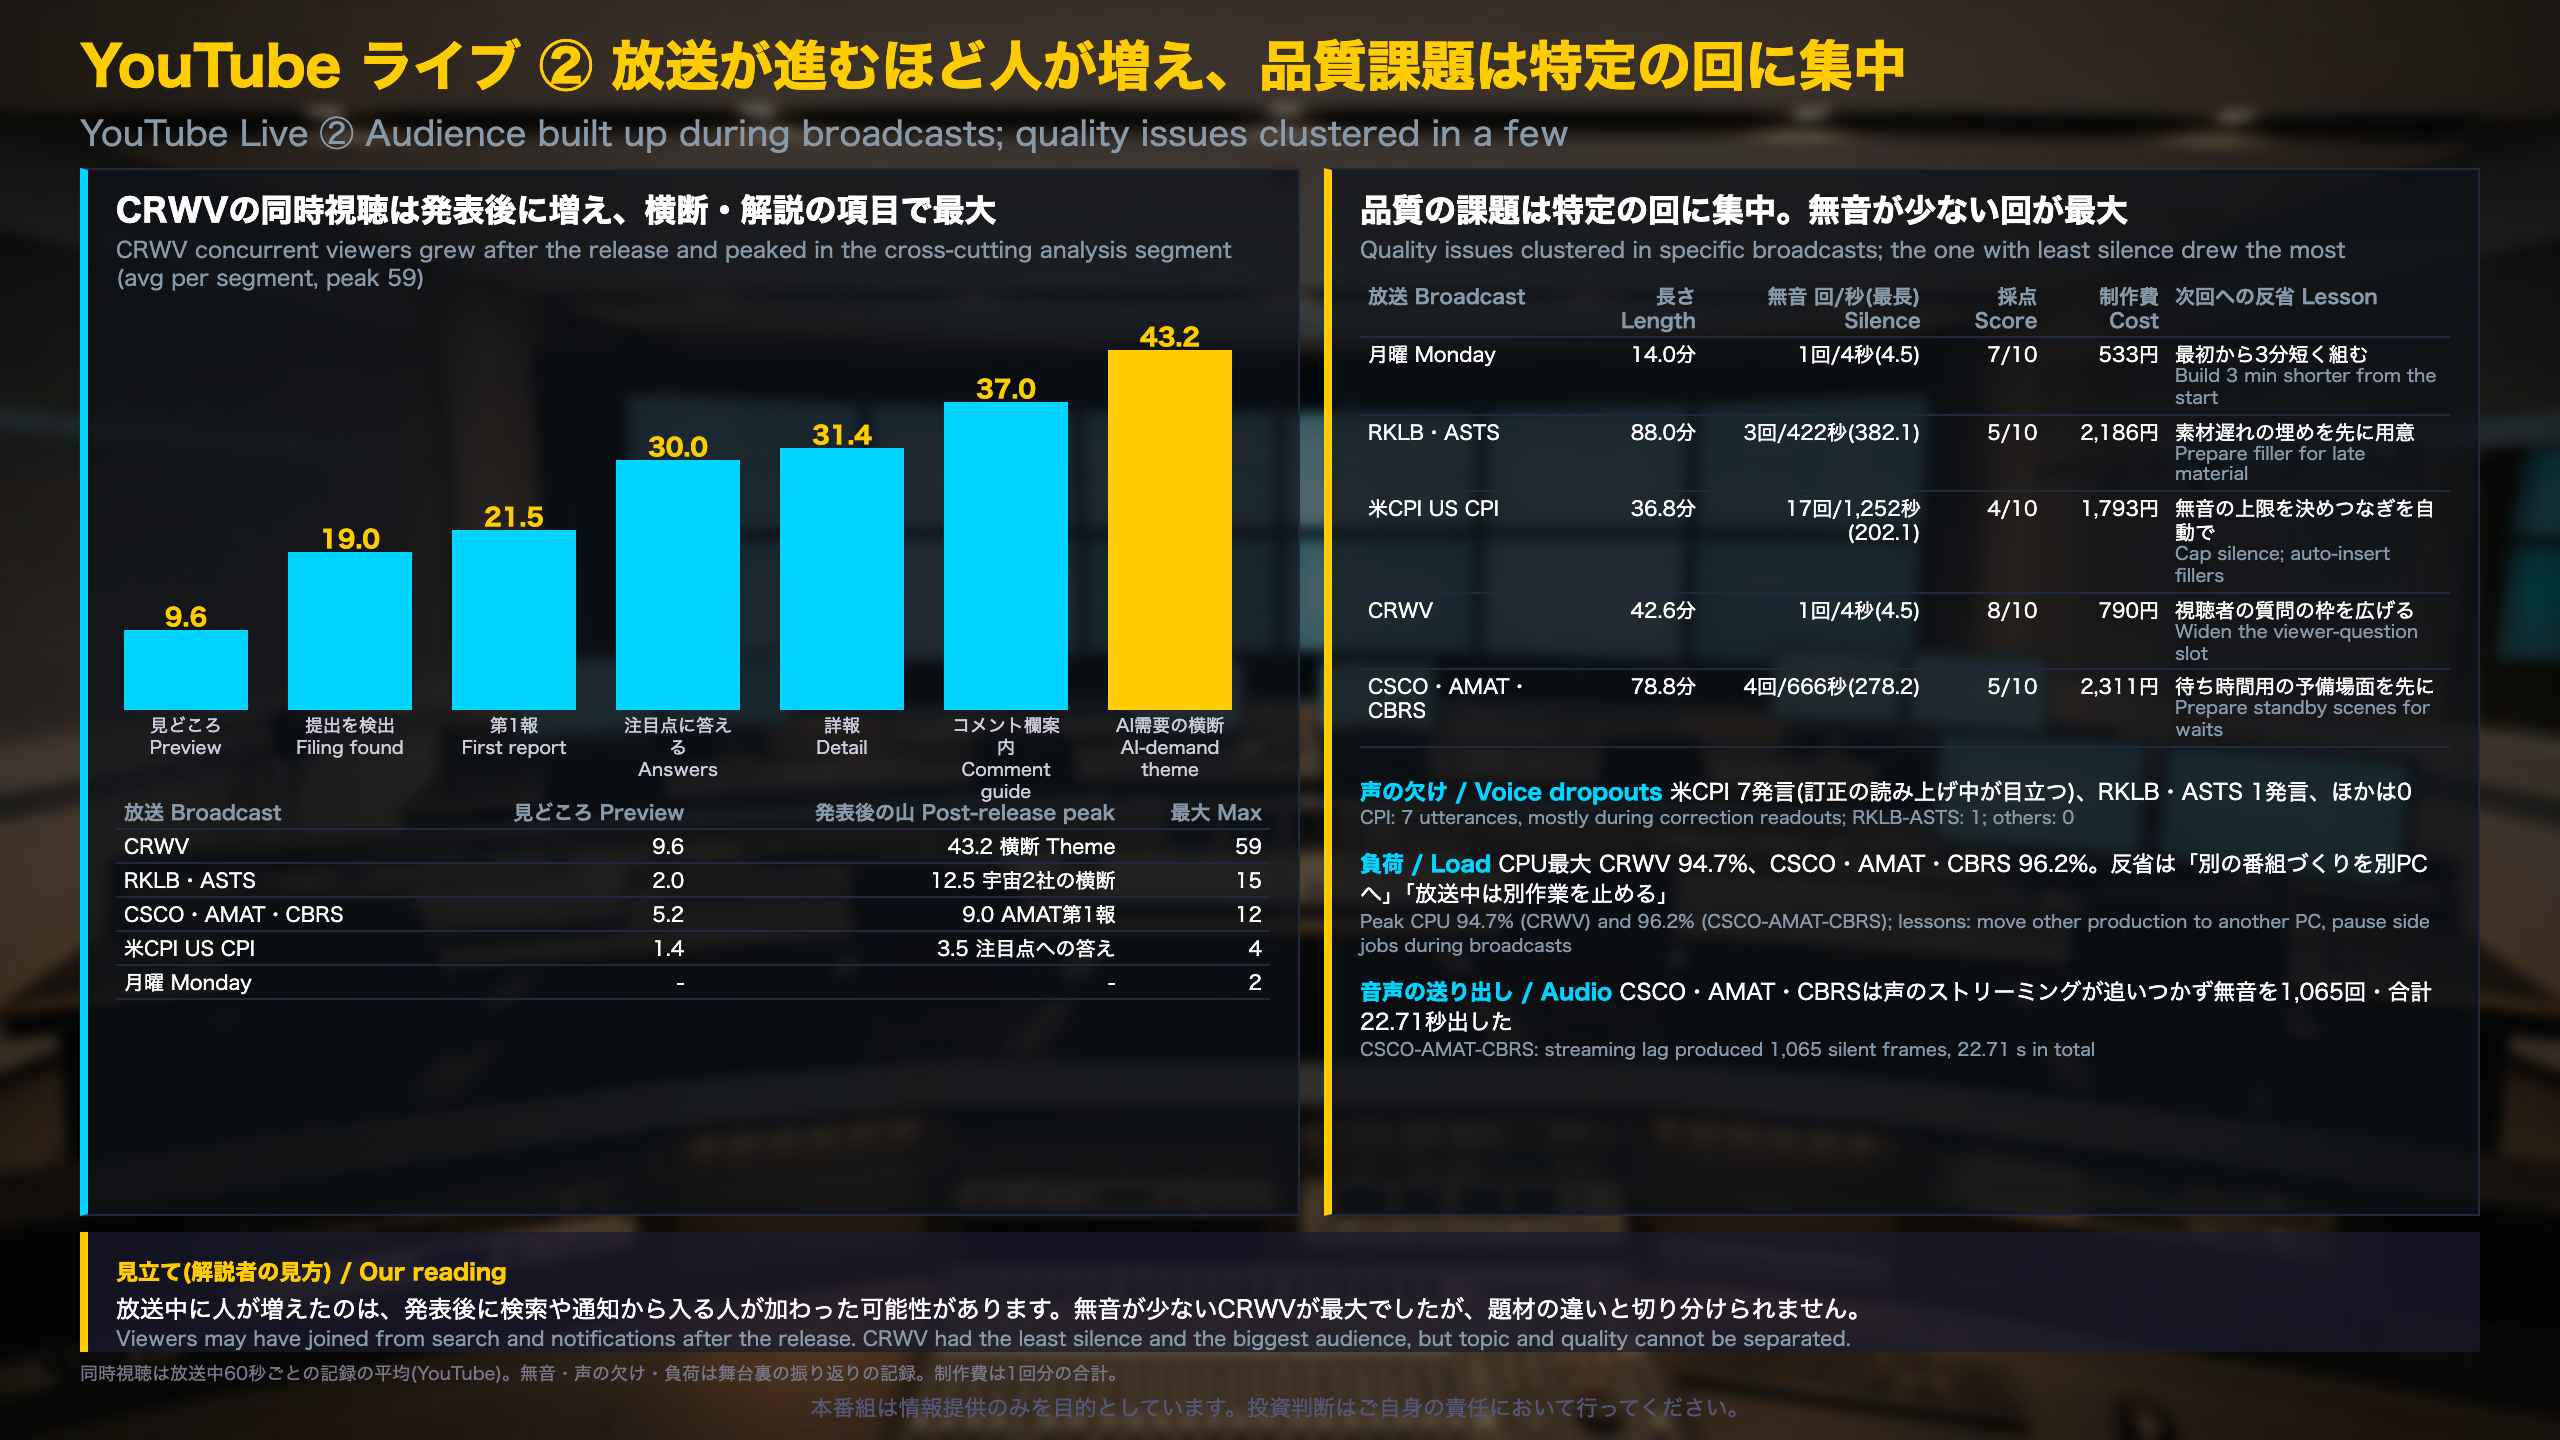
Concurrent viewers are sampled every 60 seconds. For the CoreWeave (CRWV) earnings live, the average was 9.6 in the pre-release preview, 19.0 when the filing was detected, 30.0 during the answers to key questions and 43.2 in the cross-cutting AI-demand segment, with a peak of 59. The space pair (Rocket Lab and AST SpaceMobile) rose from 2.0 to 12.5 (peak 15). Cisco/Applied Materials/Cerebras went from 5.2 to 9.0 (peak 12). The US CPI live stayed small (peak 4).
Behind-the-scenes quality review
- Silence: The CPI live had 17 silent gaps totaling 1,252 seconds (longest 202 seconds); corrections of mispronounced numbers took another 251 seconds of airtime.
- Voice dropouts: 7 utterances in the CPI live, mostly during correction readouts.
- Load: CPU peaked at 94.7% (CRWV) and 96.2% (Cisco/AMAT/Cerebras).
International comparison
Unlike a typical US earnings stream that goes quiet after the first headline, this channel adds an AI-generated deep-dive after the release, and that is where viewership rose. The operational lessons, such as separating production workloads onto another PC, are about reliability rather than content.
Reading the evidence
Retention fell to 0.03-0.06 at the 50% mark, so growth in concurrent viewers is partly late joiners, not only holding viewers. Topic and quality cannot be separated with five broadcasts. NVIDIA’s Nov 18 live is the next like-for-like comparison.
X ① 入口になったのは、発表前のリンク付き投稿
What the numbers say
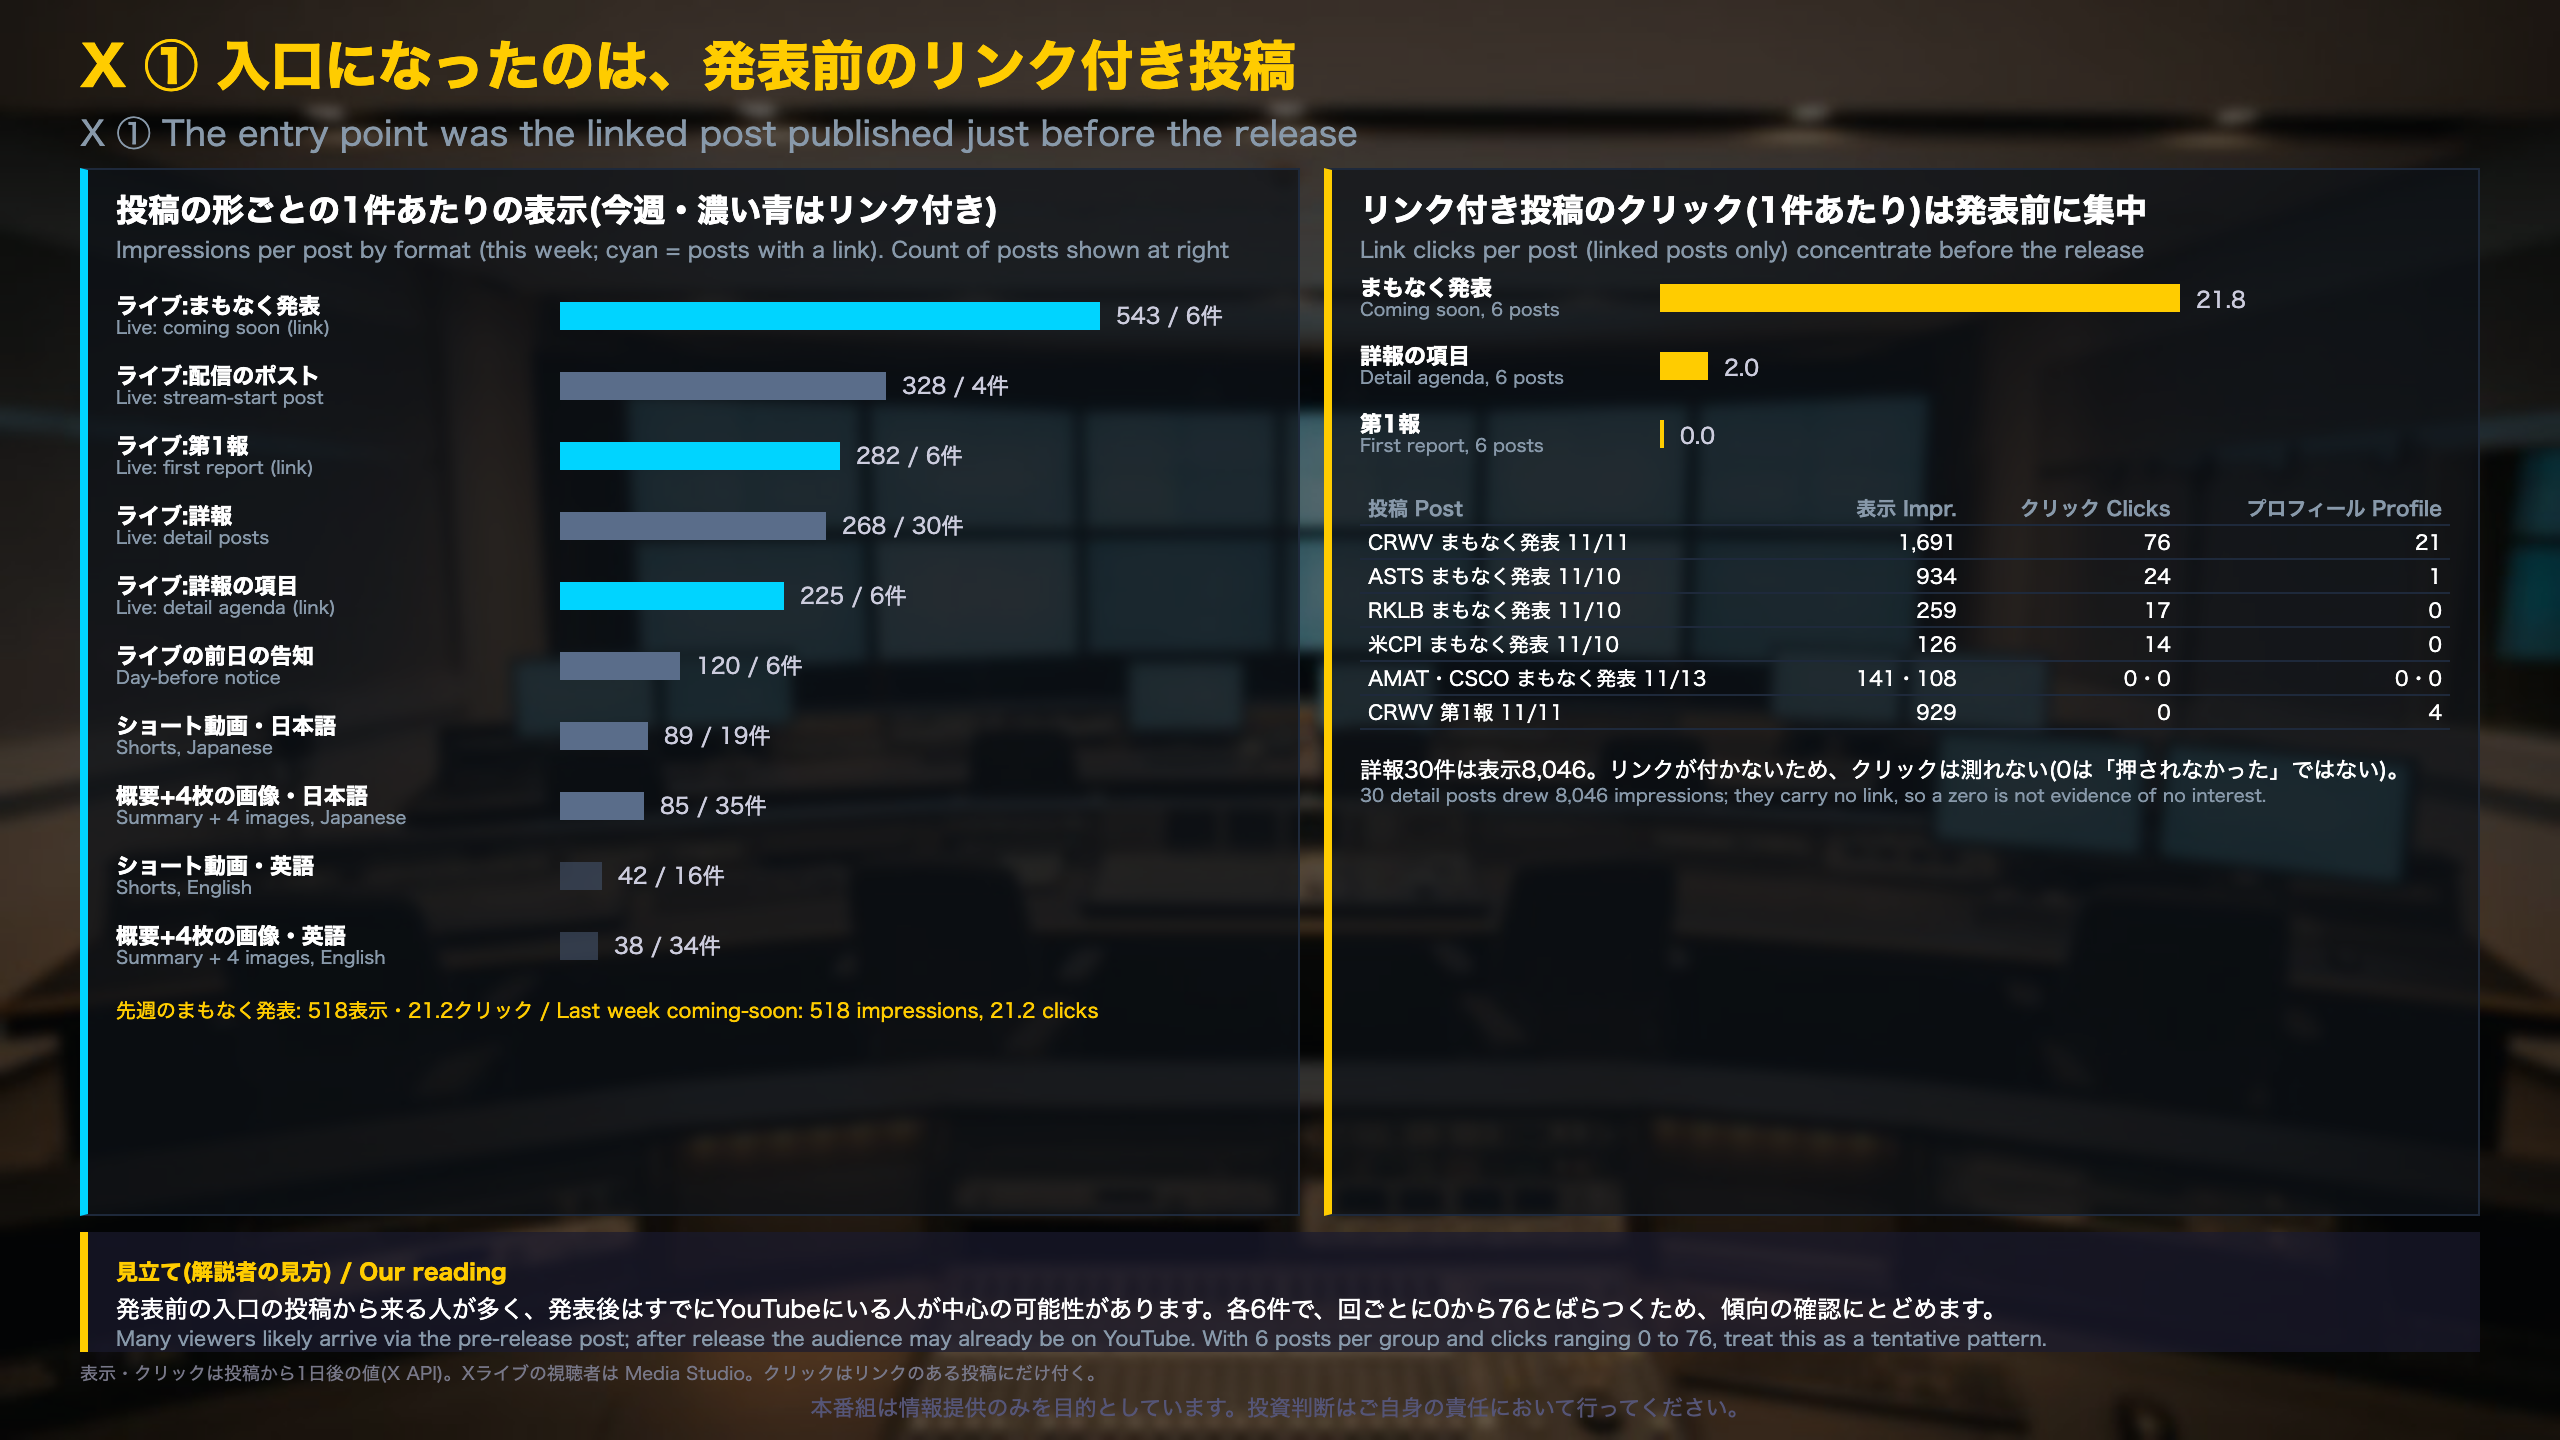
All figures are measured one day after posting (X API). The live-stream ‘coming soon’ posts, which carry a link to the YouTube live, averaged 543 impressions and 21.8 link clicks per post. First-report posts, which also carry links, averaged 282 impressions and 0.0 clicks. Detail posts (30 of them) averaged 268 impressions but have no link, so clicks are not measurable for them.
Context for non-Japanese readers
NFC Market Live runs an automated X workflow around each live broadcast: a ‘coming soon’ post before the filing, a first-report image, then a series of detail posts. A link click is only possible on posts that include a link, so a click count of zero on a post without a link does not mean nobody was interested.
Variation by broadcast
CoreWeave’s coming-soon post drew 76 clicks and 21 profile visits; AST SpaceMobile 24, Rocket Lab 17, US CPI 14, while Applied Materials and Cisco drew 0 clicks despite being published on time. The average is therefore driven by two or three posts.
Comparison and implications
Last week the same format averaged 518 impressions and 21.2 clicks, so the pattern is stable. Posts in the 6 am (JST) window averaged 210 impressions versus 53 in the 9 am window, tracking the earnings-live schedule. English posts reach about half the impressions of Japanese ones (Shorts 42 vs 89). With six posts per group, treat this as a hypothesis: the pre-release teaser may be the main funnel to the live.
X ② ライブへ呼べたか、フォローにつながったか
X live-stream audience
X does not expose live viewer counts through its API, so these numbers are transcribed from X Media Studio. CoreWeave’s earnings live on Nov 11 reached 619 unique viewers and 807 minutes of watch time, the highest of any X live so far (the previous best was AMD/SMCI on Nov 4 with 517). Rocket Lab/AST SpaceMobile reached 476. The US CPI live reached only 29 viewers, but those viewers stayed 3.7 minutes on average, far longer than the 0.7 to 1.6 minutes seen in earnings lives.
Why CPI looks weak
The X API credit ran out, so every live post after the first one was not published, meaning no ‘coming soon’ or first-report entry posts. The Cisco/Applied Materials/Cerebras live had its entry posts but lost 11 detail posts from 06:28 for the same reason. Comparisons across these lives are therefore not like-for-like.
Followers and the rewards program
Followers rose from 281 (Nov 9) to 292 (Nov 15); verified followers rose from 17 to 19. X’s Original Content Rewards program requires Premium, 500 verified followers and 500,000 verified-user home impressions over 90 days. At the current 6.5% verified share, roughly 7,684 total followers would be needed. The channel treats this as a distance to track, not a target to optimize.
Implications
For a small account, earnings lives on hot AI names are the main source of follower gains, which mirrors the YouTube pattern. Restoring the API credit before NVIDIA’s Nov 18 live is an operational prerequisite.
投資対効果と整理の候補 費用は決算ライブに集まり、効きも決算ライブ
Where the money went
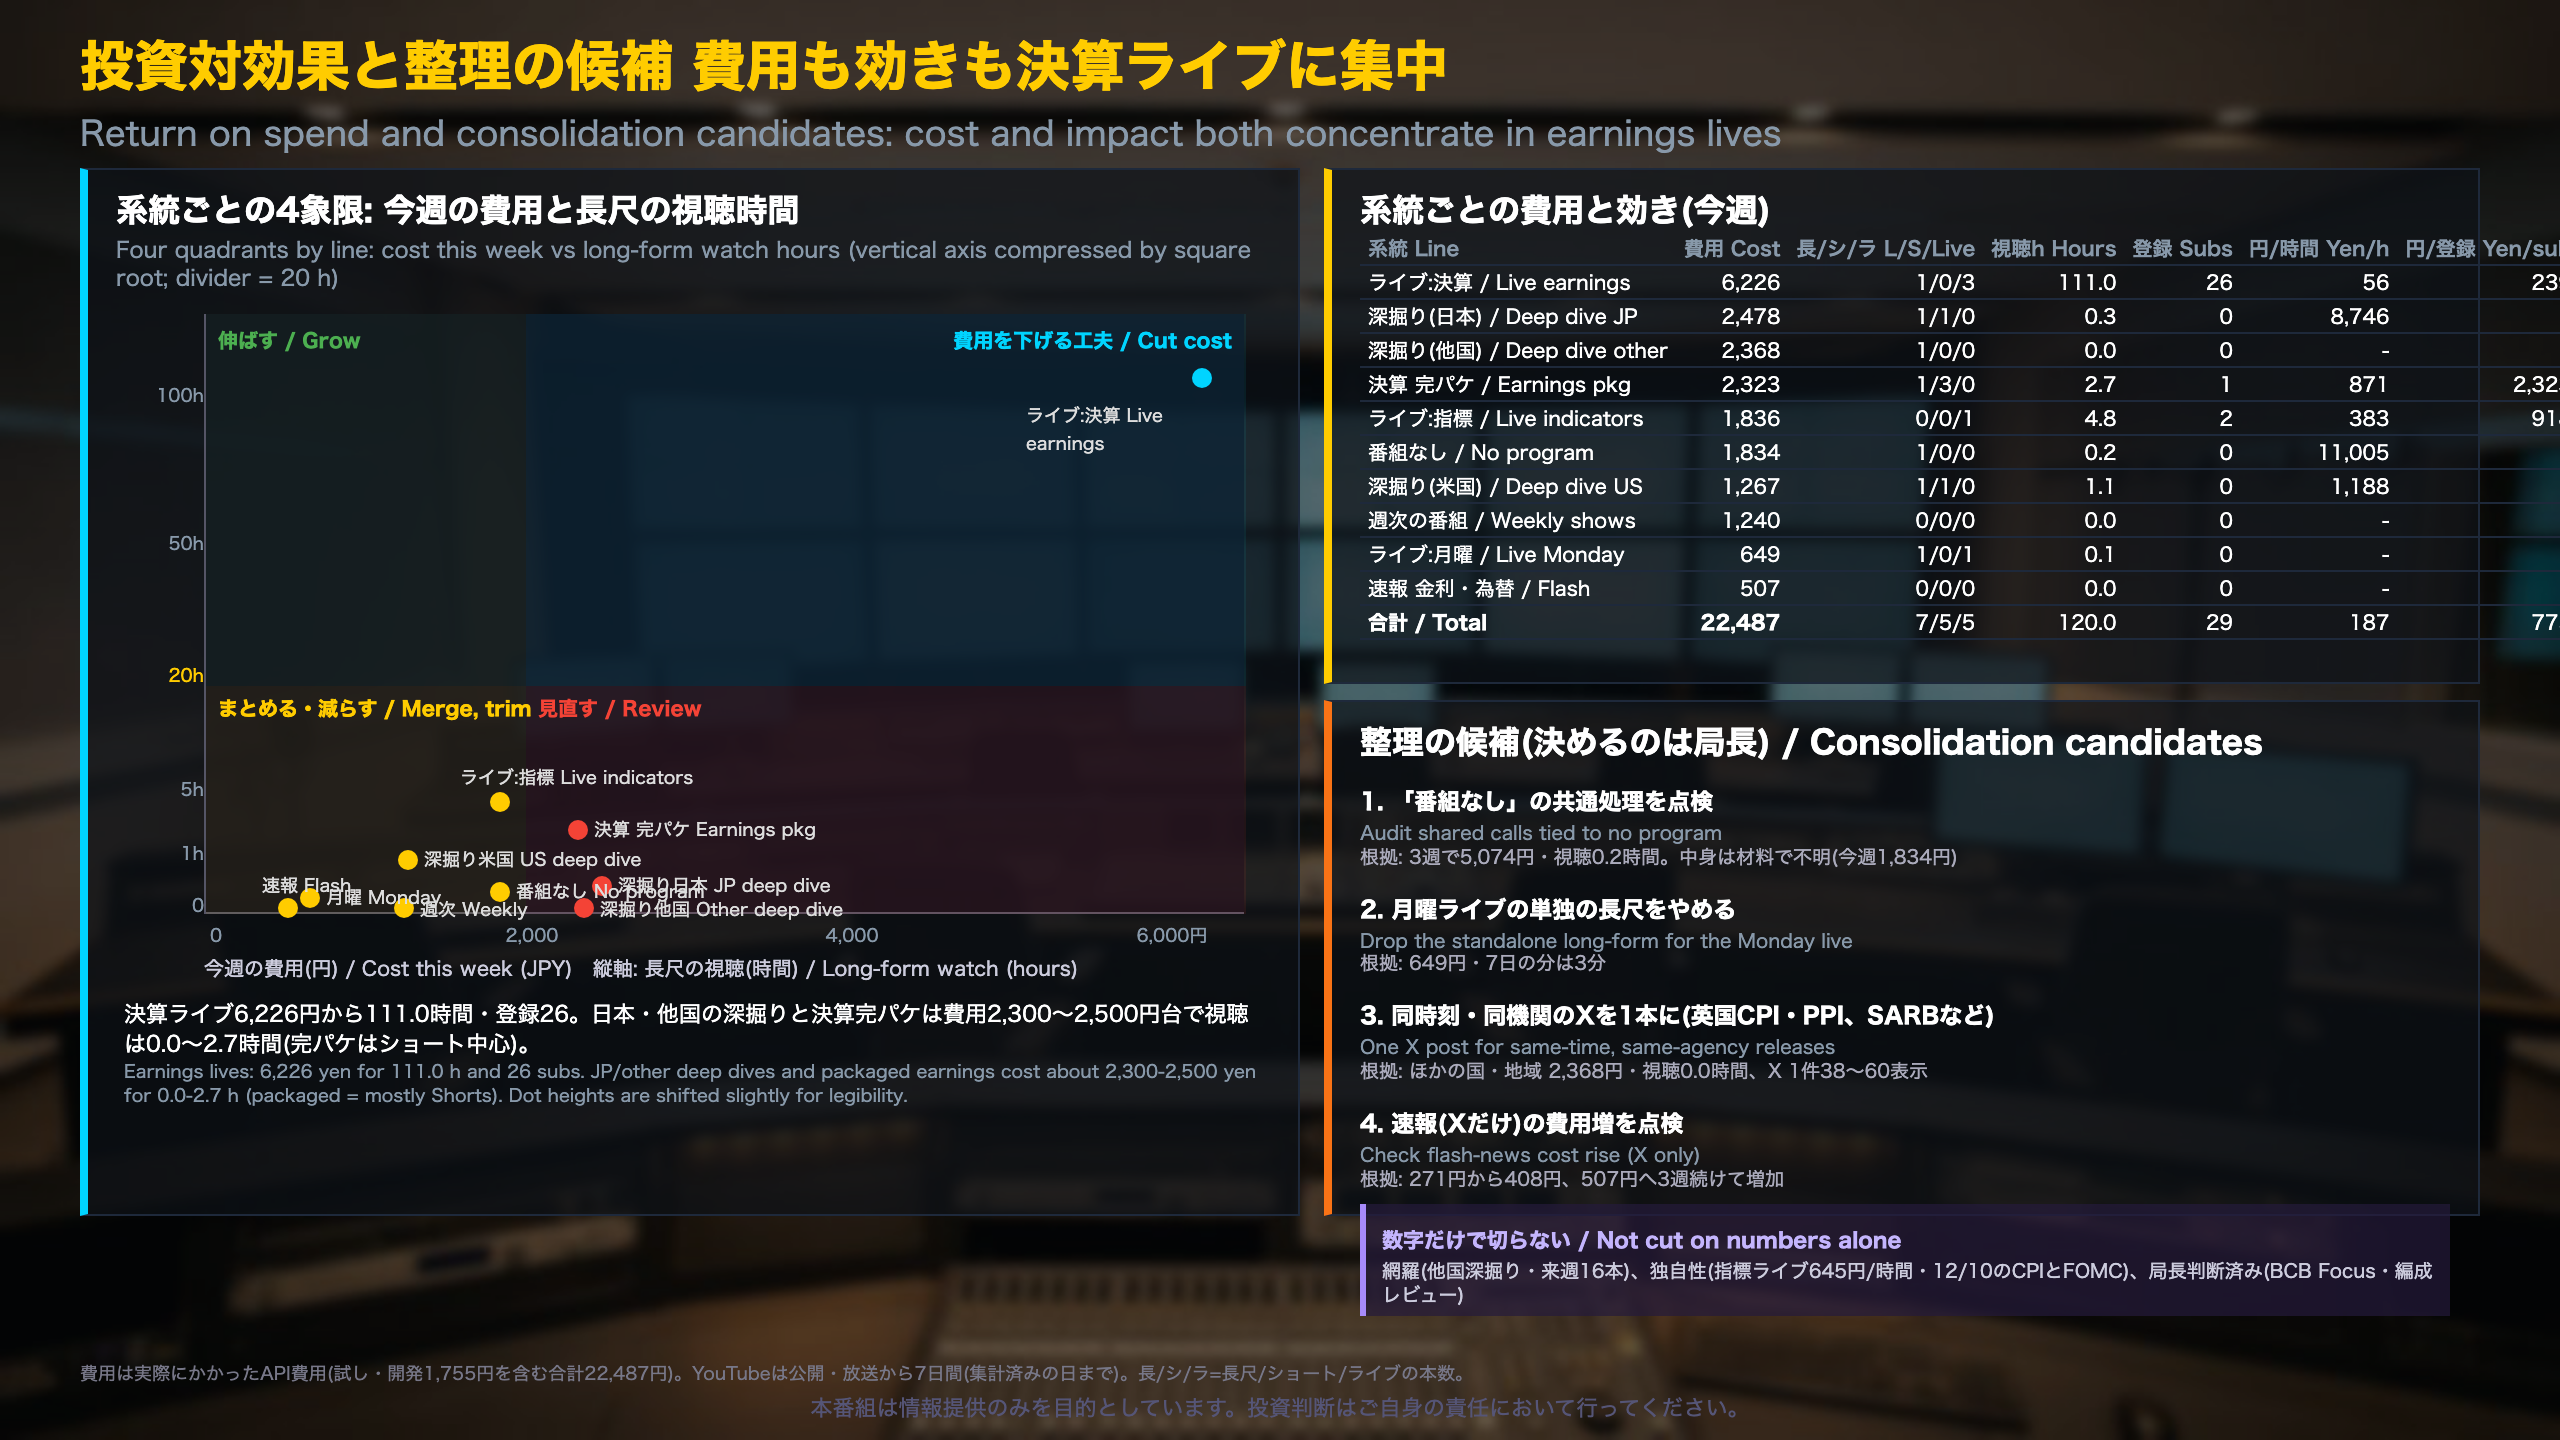
Actual API cost this week was 22,487 yen (1 USD = 159.6 yen): 10,186 yen for programs (indicators, earnings, weekly shows, including re-runs), 8,711 yen for live broadcasts (production, preparation, promotion, X commentary), 1,834 yen for calls not tied to any program, and 1,755 yen for experiments. Experiments are excluded from cost-per-viewing-hour comparisons.
Return by line (three-week view)
- Live earnings: 15,868 yen, 195.0 viewing hours, 39 subscribers, 81 yen per hour; only 21.5% of three-week spend yet most of the viewing.
- Packaged earnings: 7,936 yen, 39.0 hours, 20 subscribers; mostly Shorts, which do not count toward the 3,000-hour requirement.
- Deep dives (three lines): 19,326 yen for 5.7 hours and 4 subscribers.
- Weekly shows: 3,819 yen, 0.0 hours.
Context for non-Japanese readers
The channel’s monetization goal is YouTube’s long-form viewing requirement (3,000 hours for Tier 1; 8,000 hours from Feb 2027 for Tier 2). Shorts, unlisted videos and ads do not count. So cost efficiency is judged on long-form hours, not total views.
Consolidation candidates (the director decides)
- Audit shared ‘no program’ processes (5,074 yen over three weeks, 0.2 hours).
- Drop the standalone long-form for the Monday live (649 yen; 3 minutes in 7 days).
- Merge X posts released at the same time from the same agency, such as UK CPI/PPI.
- Check why flash-news cost, X only, rose from 271 to 408 to 507 yen.
Not cut on numbers alone
Coverage (16 other-country deep dives next week), originality (the indicator live that pairs US CPI and FOMC on Dec 10) and director-approved shows such as BCB Focus. YouTube can also demonetize mass-produced content, so consolidation has a risk-control logic beyond cost.
来週の資本配分 増やす・減らす・確かめる
Next week’s calendar
The center of gravity is NVIDIA’s earnings on Nov 18 (live from 05:45 JST), followed by Palo Alto Networks on Nov 19, the FOMC minutes (Nov 19, 04:00 JST) and Japan’s nationwide CPI (Nov 20). Saturday and Sunday carry roundup long-form videos for US, Japan and world indicators and for US earnings. The Monday live (Nov 23) is the only live of that week, which makes it the channel’s first quiet week since lives began in mid-October.
Why these allocation choices
- Increase: earnings lives cost 6,226 yen this week for 111.0 viewing hours and 26 subscribers. Early-morning (JST) earnings coincide with US after-close filings, so each live doubles as the archive that counts toward monetization.
- Reduce or merge: low-engagement foreign indicators (UK CPI/PPI, South Africa’s central bank) cost 2,368 yen and produced 0.0 hours across the other-country line. Merging same-time X posts keeps coverage but lowers spend.
- Test: the quiet week will show the baseline without events: the model predicts 2 to 4 hours of long-form viewing.
Outlook (from the programming analysis)
The 3,000-hour Tier 1 threshold is reached between late August 2027 and after November 2027, because this autumn’s hours roll out of the 12-month window. The 8,000-hour Tier 2 requirement (new channels from Feb 2027) would need about 154 hours per week and is unlikely in 2027 at the current format. Subscribers: 500 between late January and April 2027.
Weekly checks
The coefficient for big names (4.0 to 4.2), the archive tail (17 minutes) and the quiet-week level (known Dec 1). Last week’s forecast of 8 to 18 hours missed badly against the actual 117.4 hours, so the ranges stay wide.
Disclaimer: This article is for informational purposes only. All investment decisions are made solely at your own risk.