This article was automatically generated by the NFC Market Live AI analysis system. (Updated: 2026-11-14 09:13 JST)
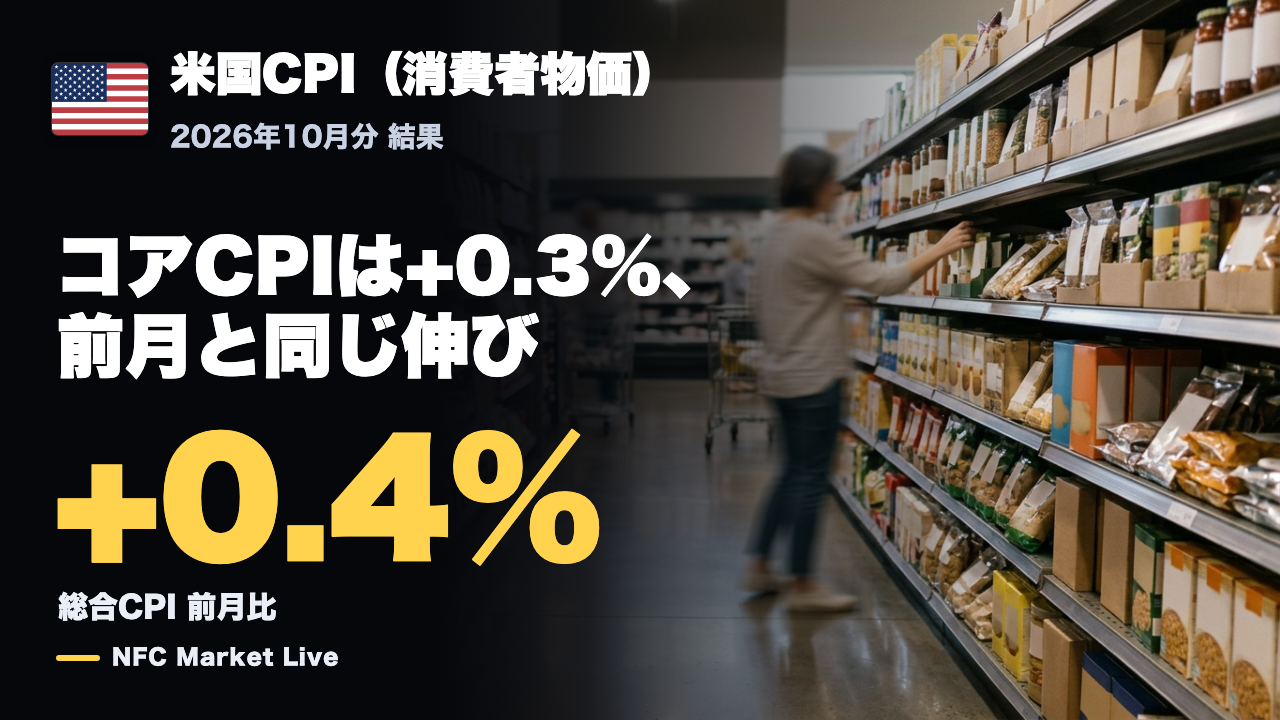
📊 US October CPI: headline +0.4% m/m (September +0.6%), core +0.3% for the third month in a row.
A one-video recap of this week’s US economic indicators.
This week’s items:
📈 US CPI, October (BLS, Nov 10): the energy surge eased while core held at +0.3%.
💼 Weekly Macro Pulse (initial jobless claims, crude oil stocks, Fed reserve balances): claims 200,000, crude down from the prior week, reserve balances above a year earlier, retail gasoline still higher than a year ago.
💡 A data-based look at easing and stickiness in prices, and calm in jobs and liquidity.
今週の米国経済指標まとめ:オープニング
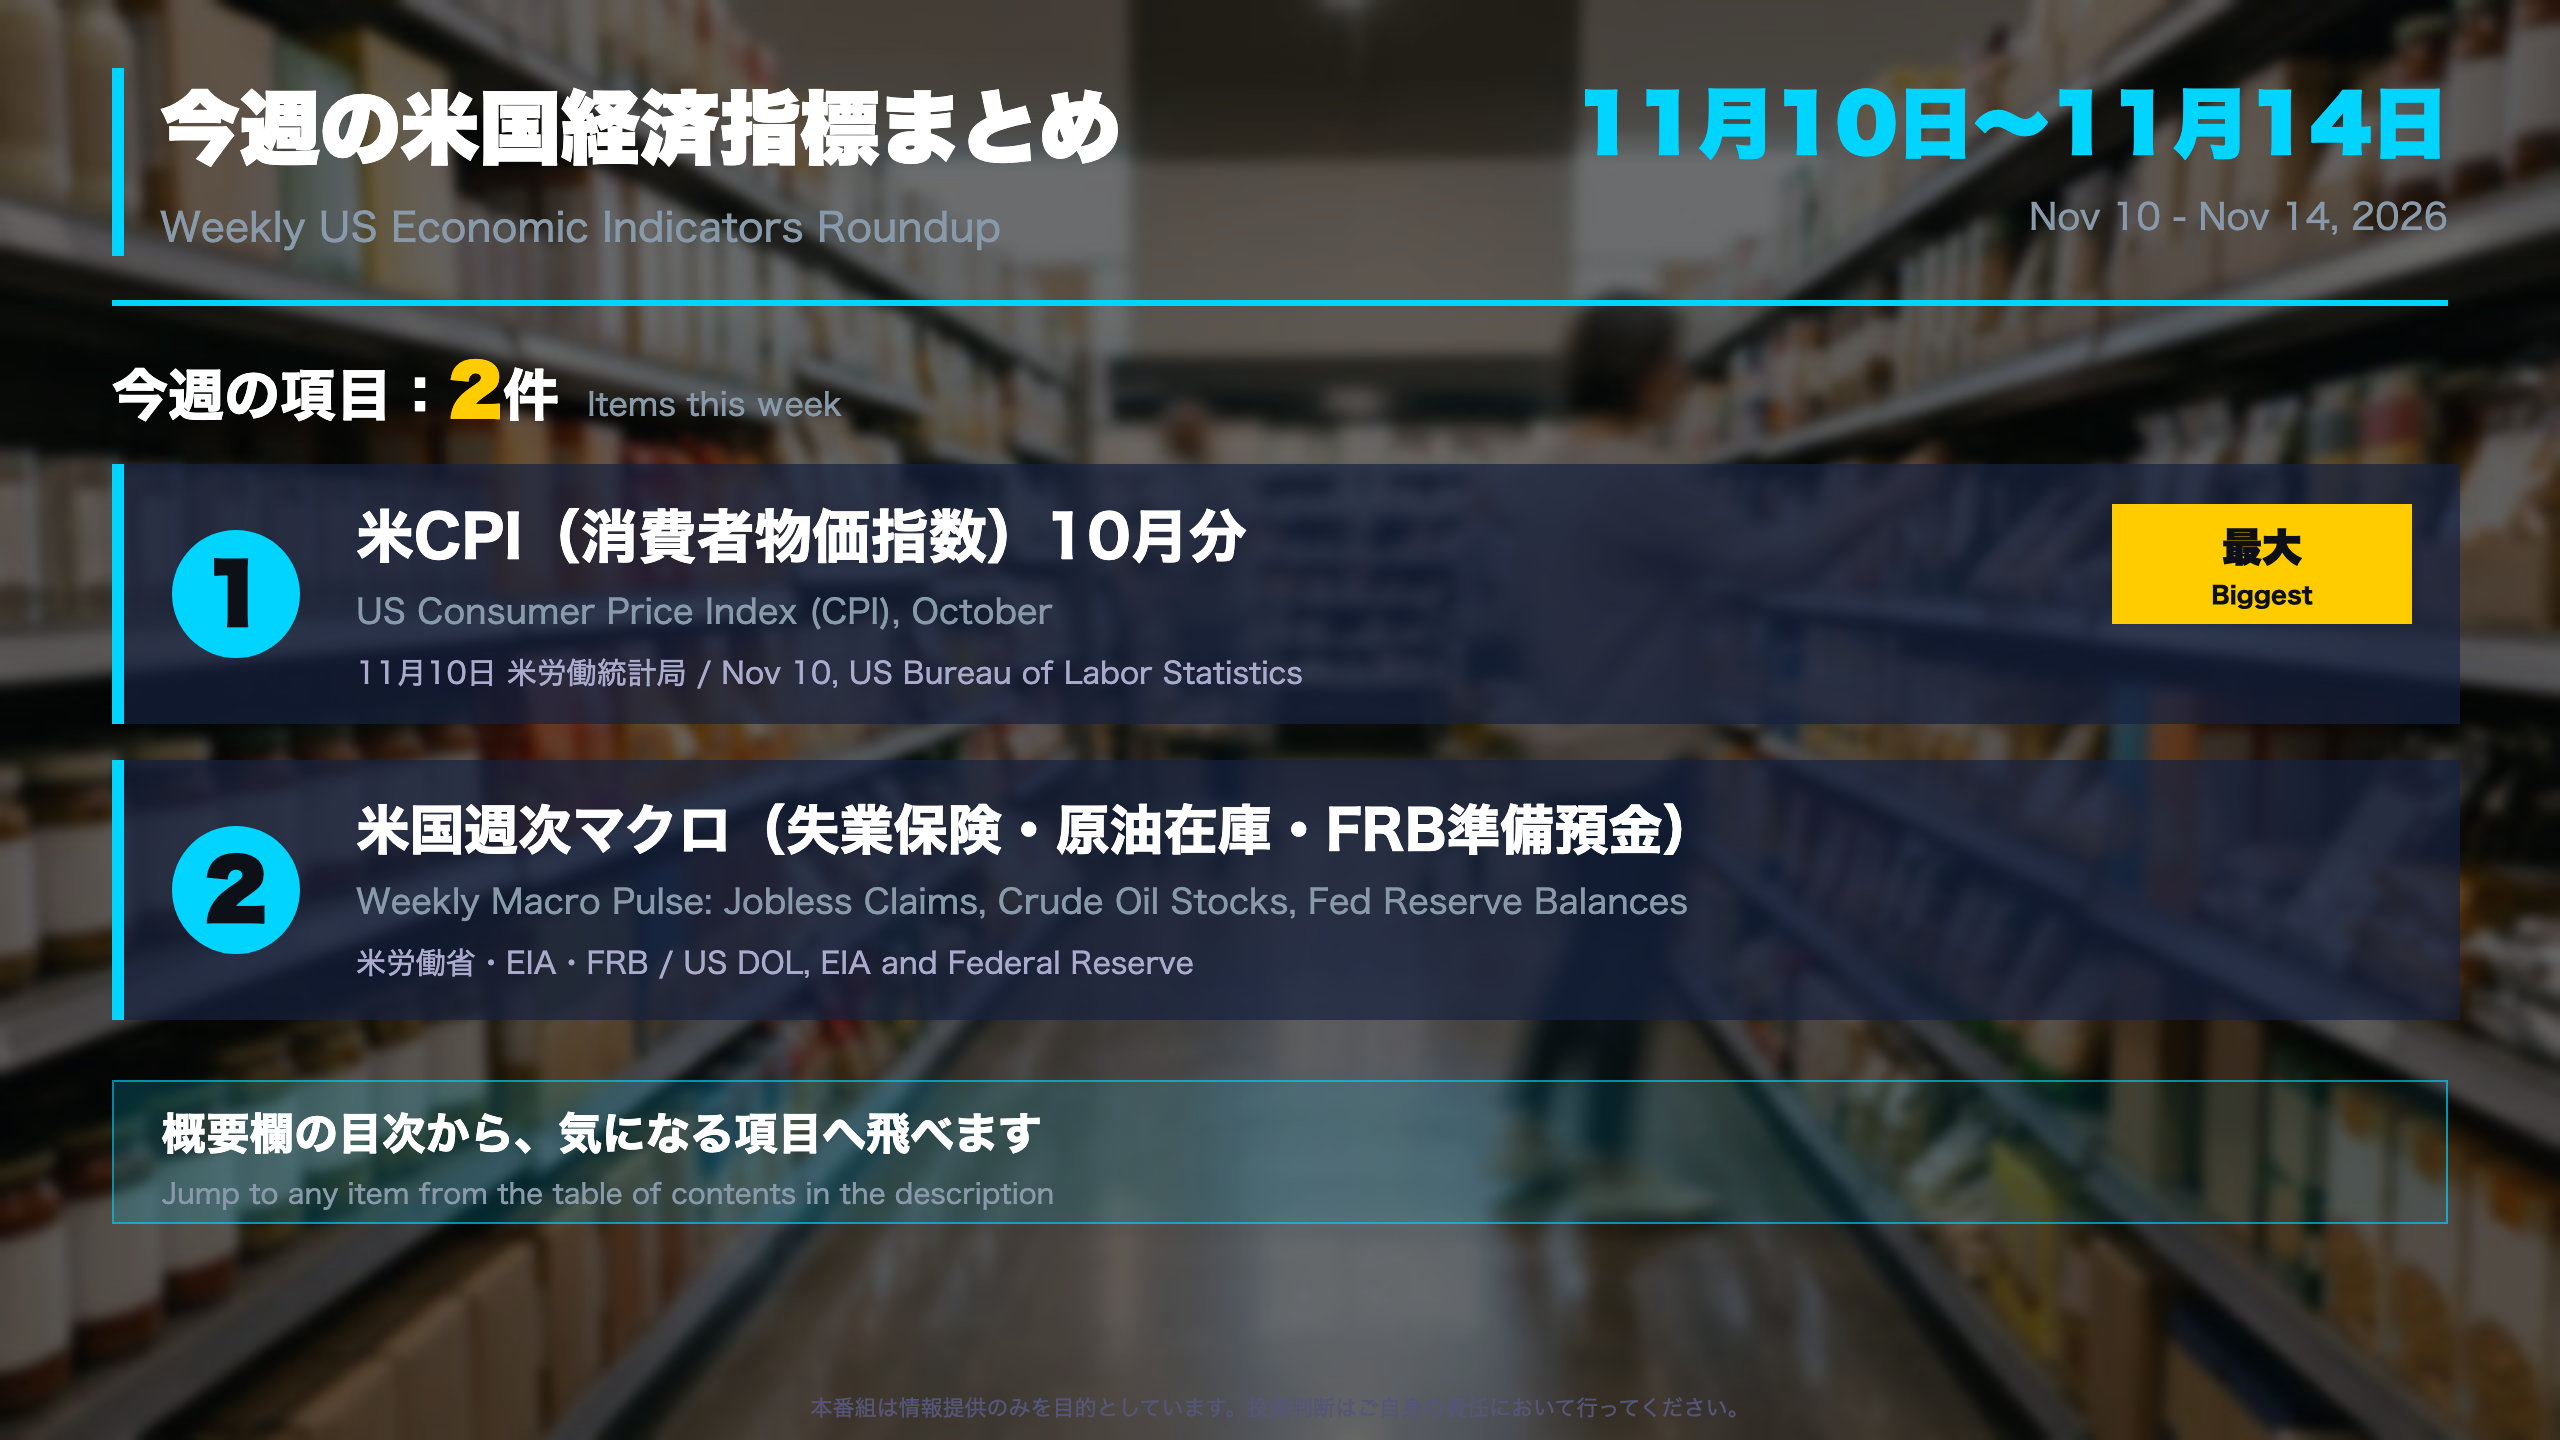
This Week in US Data: Two Releases at a Glance
The roundup covers November 10-14, 2026. Two items were reported: the monthly Consumer Price Index (CPI) for October and a Weekly Macro Pulse that bundles three weekly releases.
Who publishes what
- Bureau of Labor Statistics (BLS): CPI, the main US consumer price gauge. The Fed’s 2% inflation goal is defined on PCE prices, not CPI, so CPI is a related but different measure.
- Department of Labor (DOL): weekly initial and continuing jobless claims.
- Energy Information Administration (EIA): the weekly petroleum status report (crude, gasoline and distillate stocks, plus prices).
- Federal Reserve: the H.4.1 balance sheet release, which includes reserve balances.
Key figures
| Item | Headline figures |
|---|---|
| October CPI | Headline +0.4% m/m (September +0.6%); core +0.3% |
| Weekly pulse | Initial claims 200,000; reserve balances about $2.96 trillion |
Why definitions matter
- US core CPI excludes food and energy. Japan’s headline core excludes only fresh food, so the two cannot be compared directly.
- Year-over-year readings are mostly unavailable for October because the October 2025 survey was not conducted during the budget lapse. Month-over-month trends are the cleaner guide.
- The weekly data refer to different weeks (DOL: week of Nov 7; EIA: week ended Nov 6; Fed: week ended Nov 11), so they should not be treated as one snapshot.
What to watch for
The CPI shows both a cooling in energy and persistent core readings. The weekly data show lower claims than a year ago, but retail gasoline remains above last year. This summary explains published data; it contains no forecast.
10月CPIの全体像:鈍化とコアの粘り
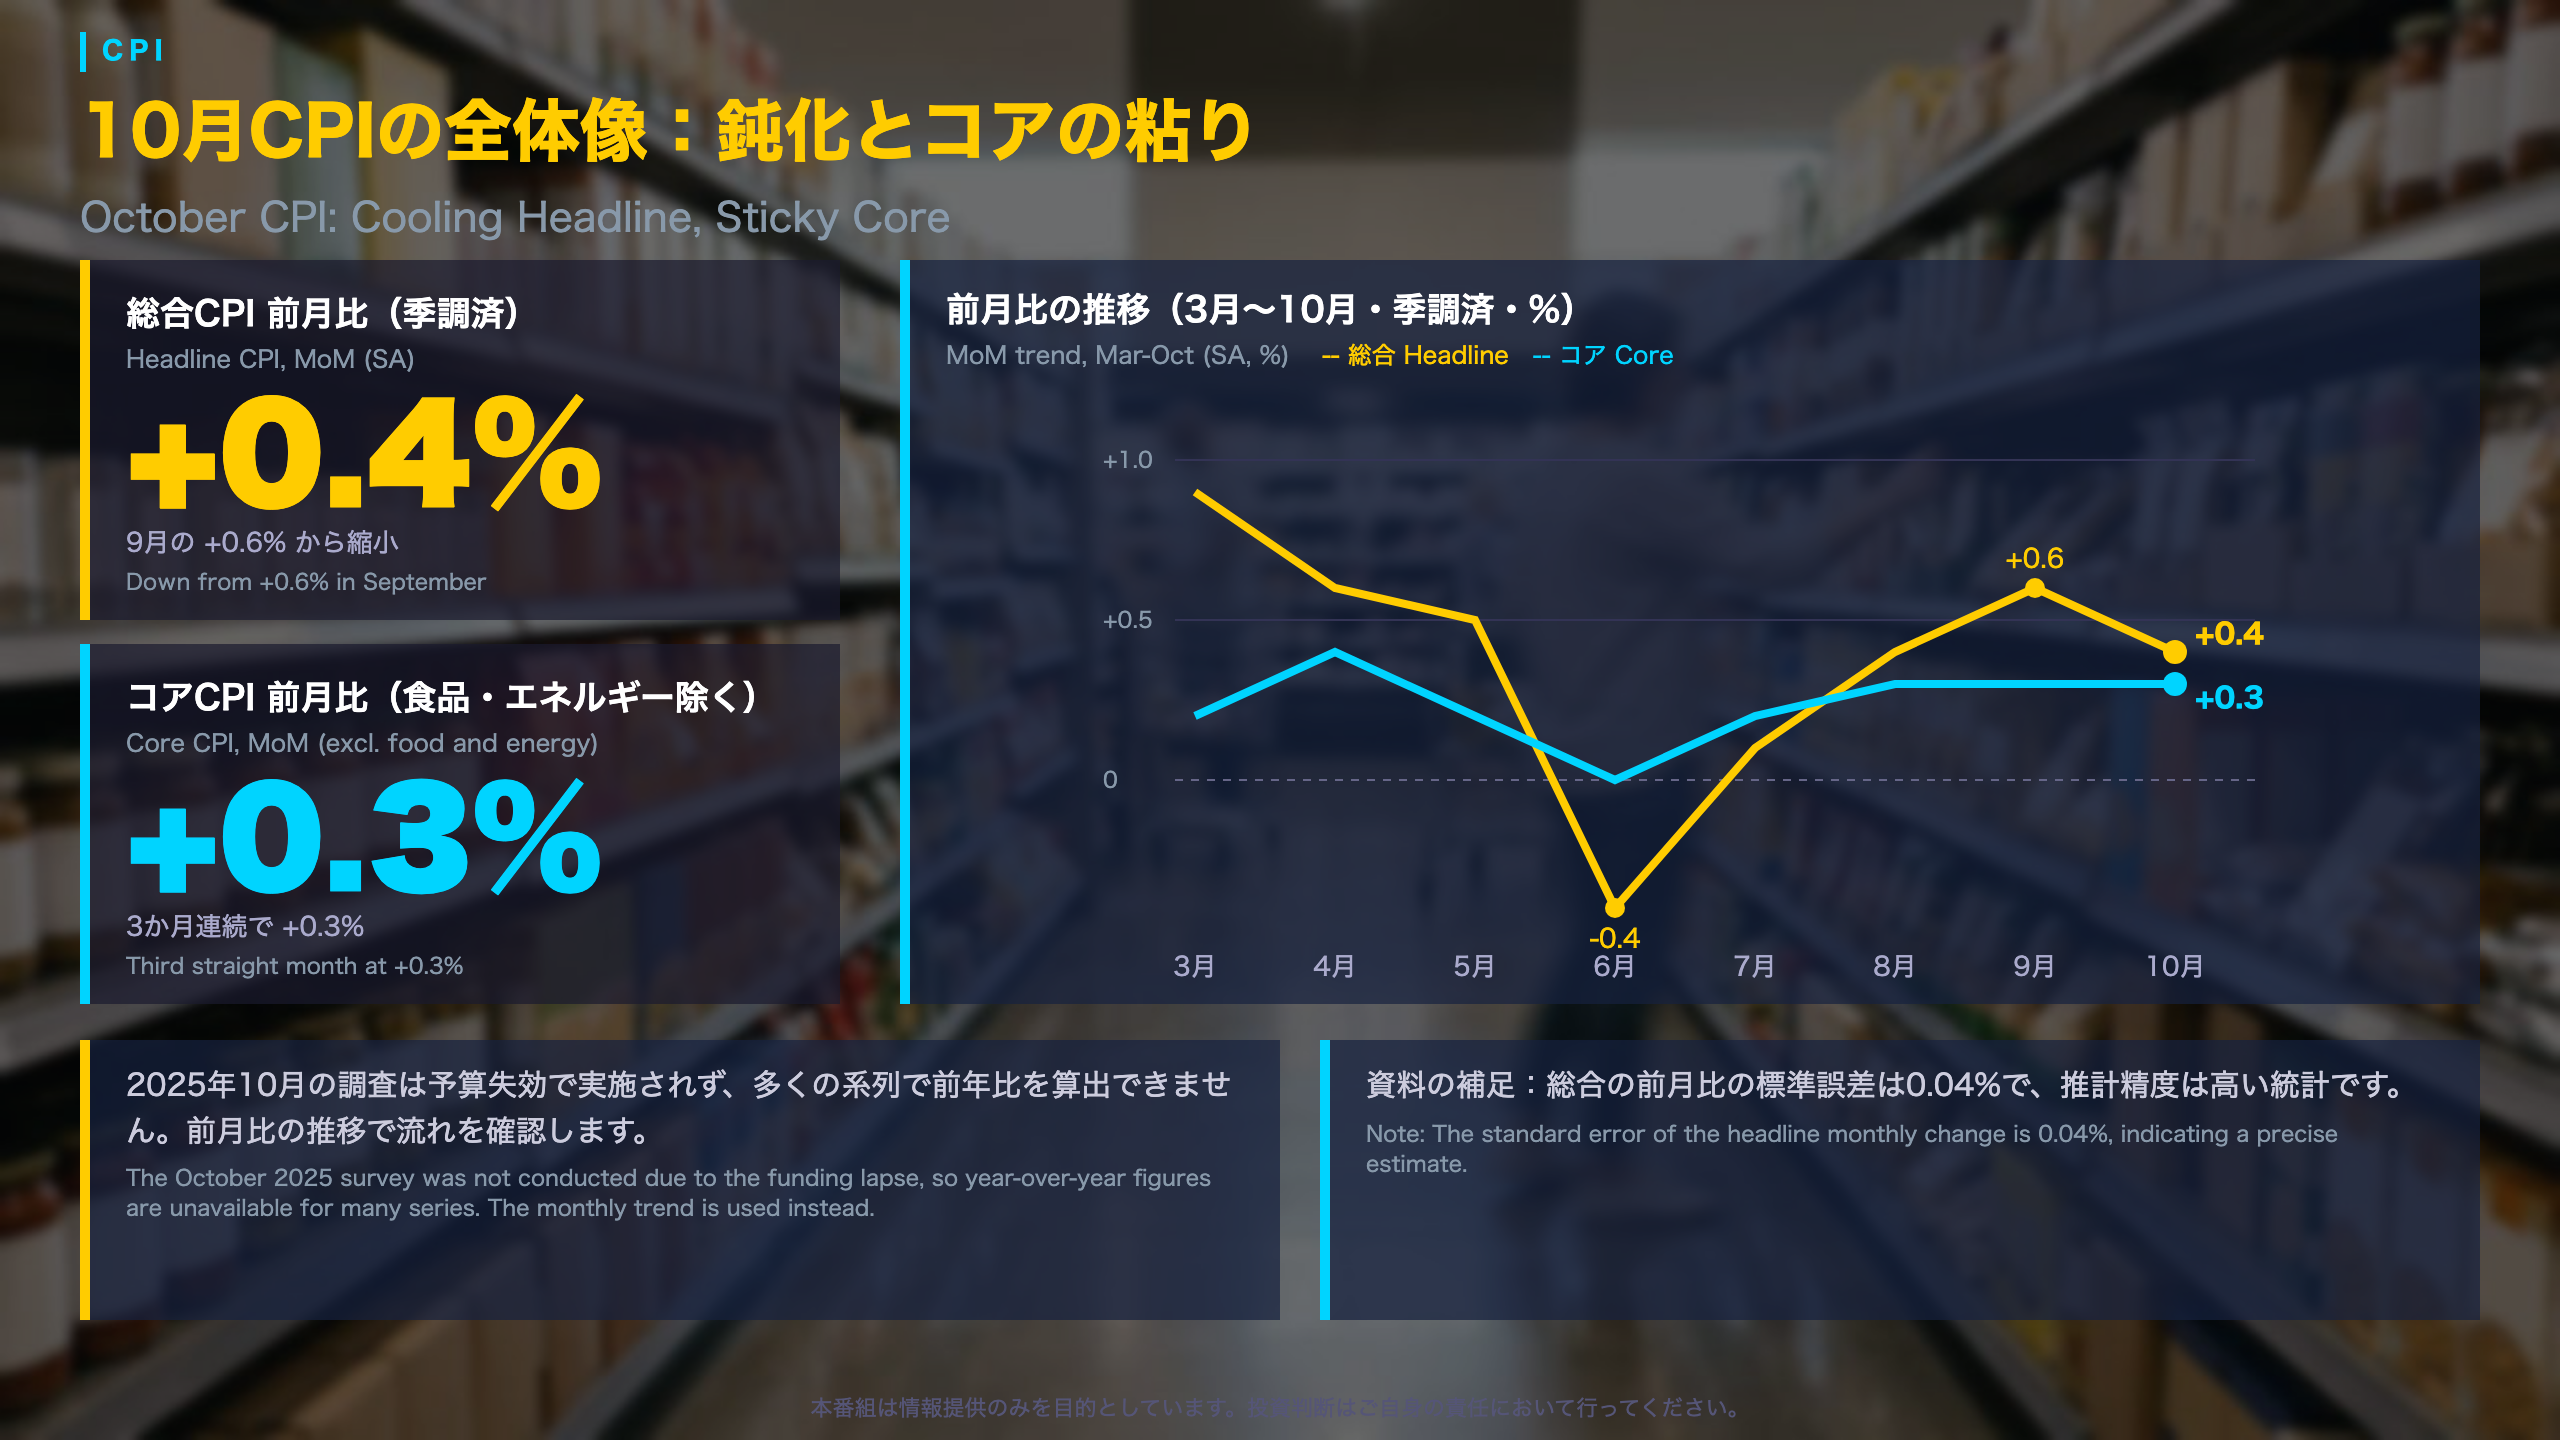
October US CPI: A Cooler Headline, a Steady Core
The Consumer Price Index is published by the Bureau of Labor Statistics (BLS), part of the US Department of Labor. Unlike Japan’s CPI, where the main core measure excludes only fresh food, the US core excludes all food and energy. The US headline figure is also the seasonally adjusted month-over-month change, whereas Japan and the euro area usually lead with year-over-year.
The eight-month path (MoM, SA, %)
- Headline: 0.9, 0.6, 0.5, -0.4, 0.1, 0.4, 0.6, 0.4 (March to October)
- Core: 0.2, 0.4, 0.2, 0.0, 0.2, 0.3, 0.3, 0.3
Headline CPI eased to 0.4% from 0.6% in September. Core held at 0.3% for a third straight month. The BLS wrote that core rose 0.3 percent in October, as it did in September and August.
Data quality notes
- The standard error of the headline monthly change is 0.04%, so the monthly estimate is considered precise.
- The October 2025 survey was not conducted because of the funding lapse, so year-over-year rates cannot be calculated for many series. For reference, September’s year-over-year readings were 3.7% (headline), 2.6% (core) and 20.4% (energy).
- Non-seasonally adjusted index: 337.511 (+0.2% MoM). CPI-W rose 0.1% and the chained C-CPI-U rose 0.2%.
Two readings
- Cooling: the energy surge has stopped, and the headline slowed from September.
- Persistence: core services and food continue to provide support.
This release does not contain the Federal Reserve’s views. The next CPI release, for November, is scheduled for Thursday, December 10 at 8:30 a.m. Eastern Time.
エネルギー:ガソリンの急騰は一服
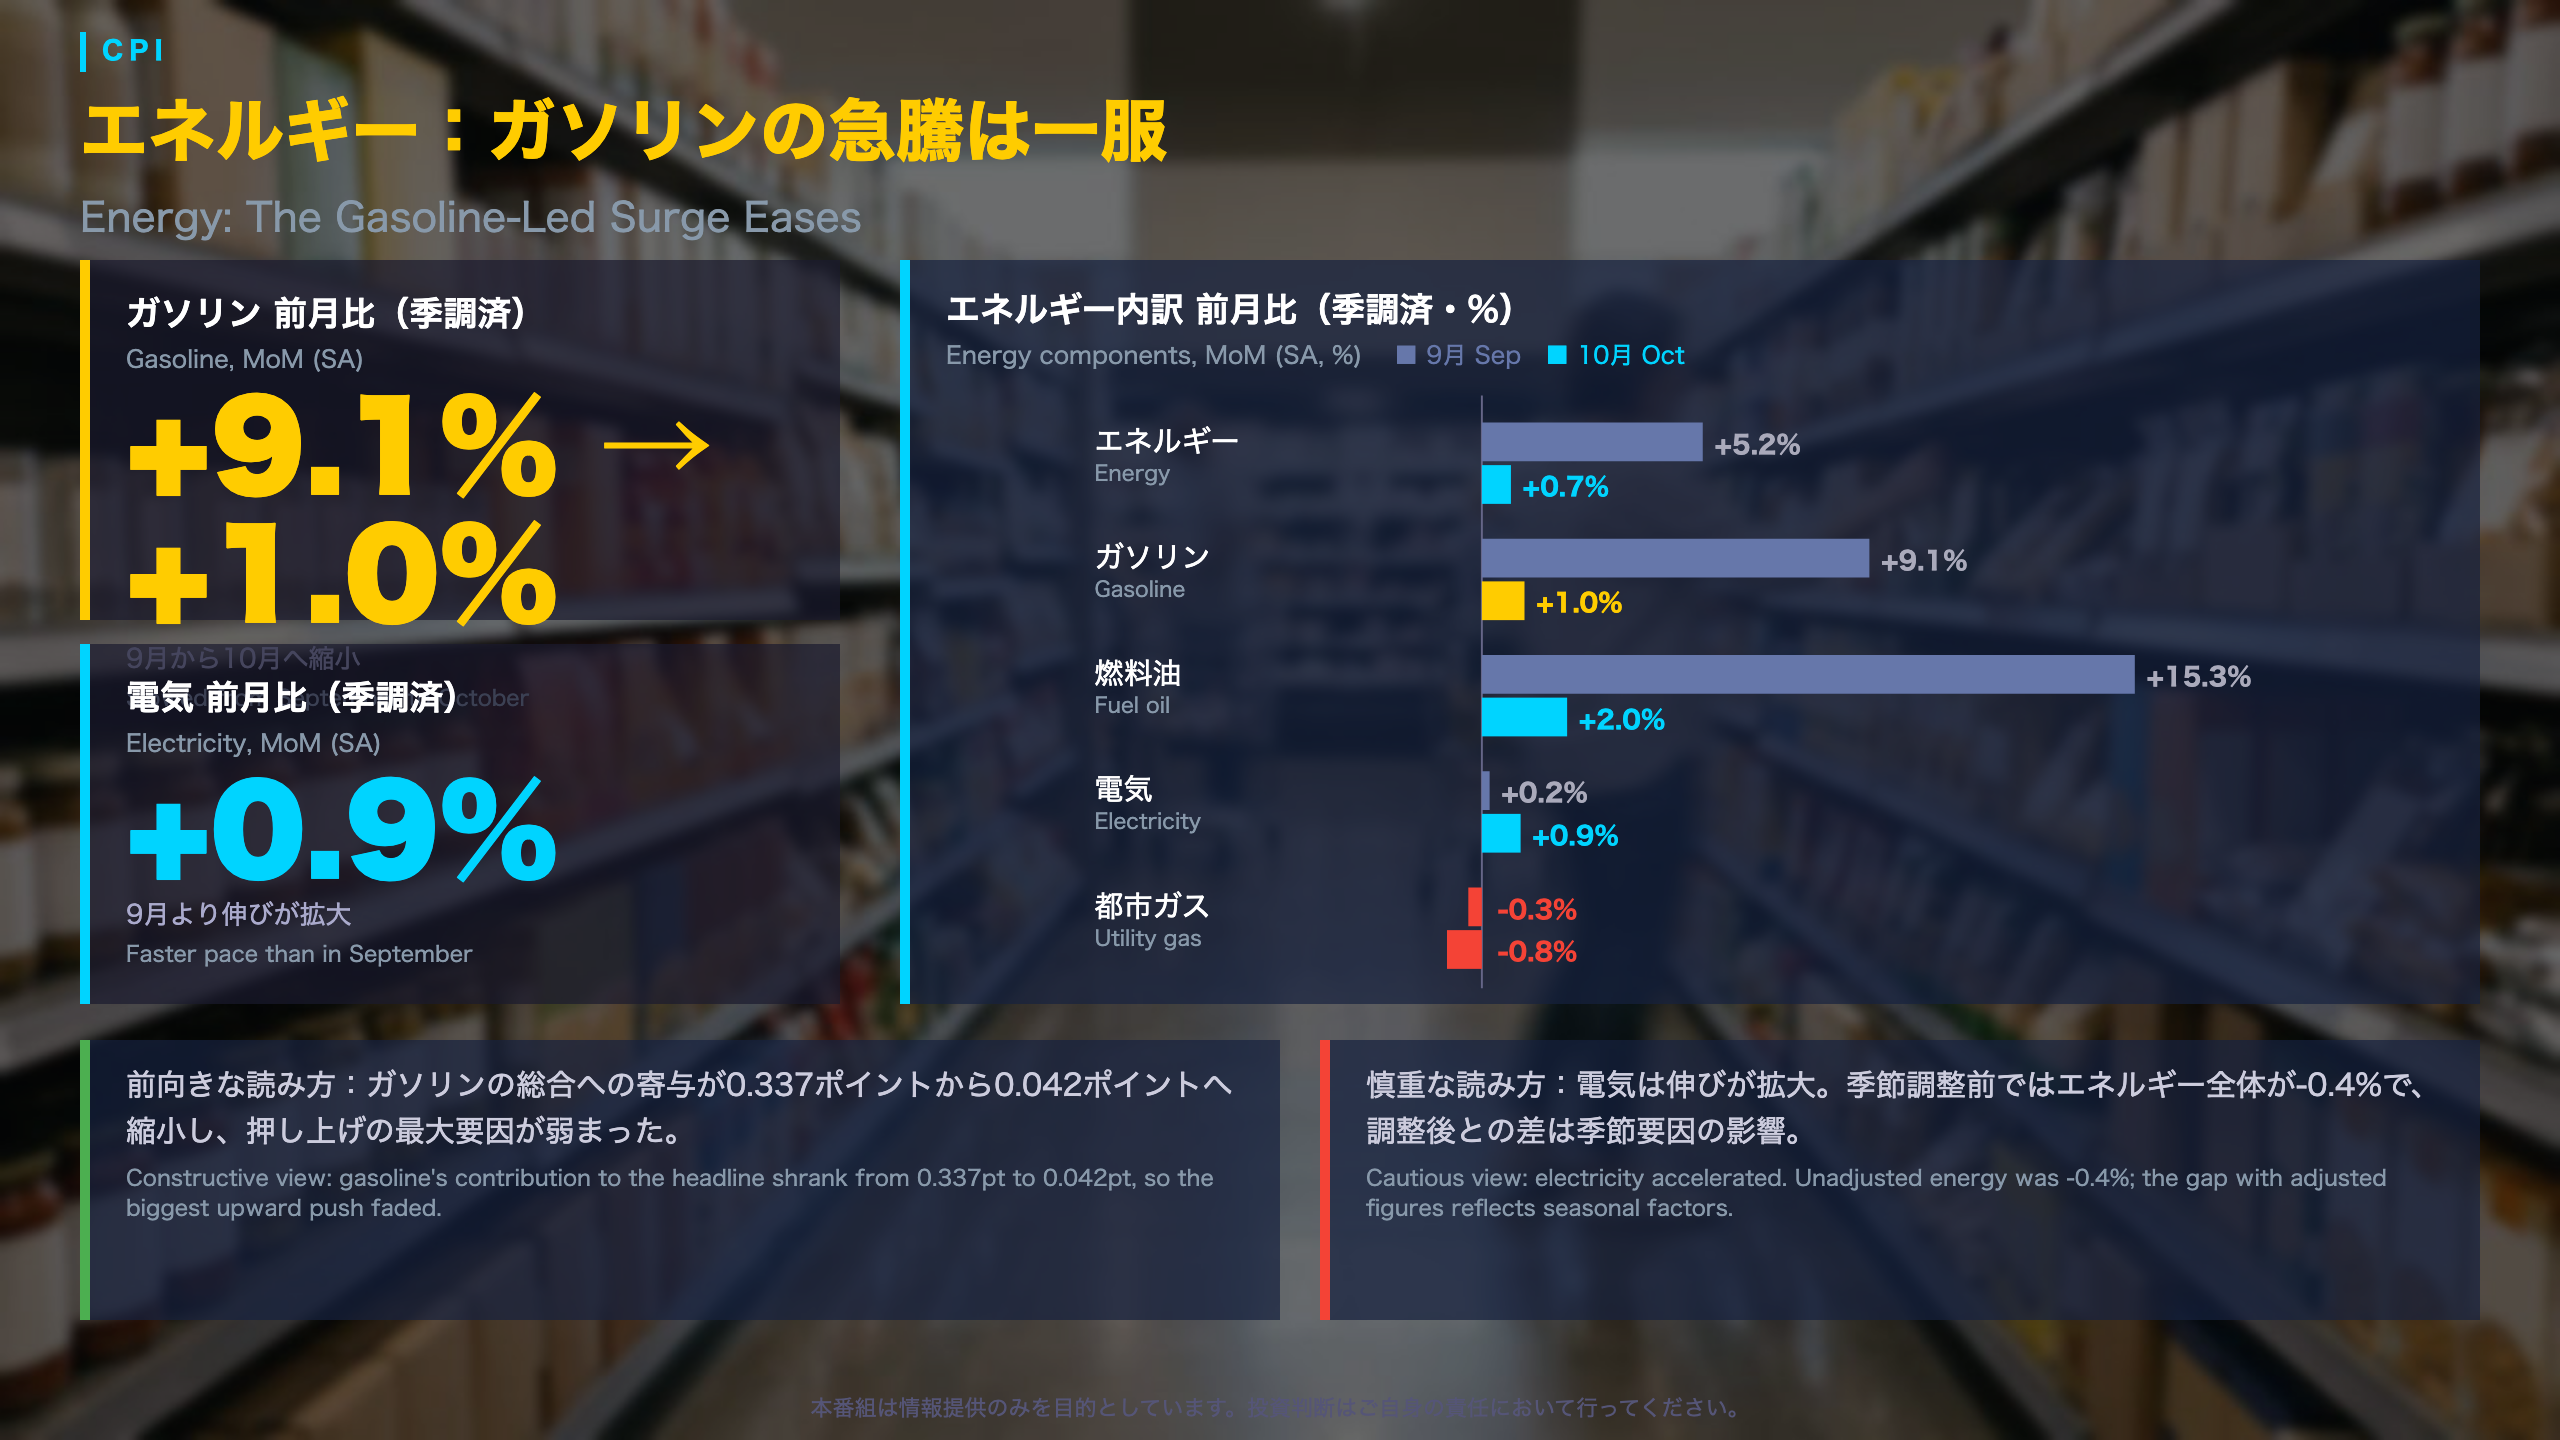
Energy: Look Beyond Gasoline
Energy was the main driver of the September acceleration in headline CPI, so the BLS energy breakdown is the first place to check what changed in October. The BLS reports both seasonally adjusted and unadjusted series, and the two can differ noticeably for energy.
Seasonally adjusted, MoM
- Energy: +5.2% in September, +0.7% in October
- Gasoline: +9.1% to +1.0%
- Fuel oil: +15.3% to +2.0%
- Electricity: +0.2% to +0.9%
- Utility (piped) gas: -0.3% to -0.8%
Contribution to the headline
Gasoline’s contribution to the all-items index fell from 0.337 percentage points in September to 0.042 in October. In other words, the single largest upward push on headline CPI faded.
Adjusted vs. unadjusted
Before seasonal adjustment, energy fell 0.4%, gasoline 0.7% and electricity 0.7%. The difference from the adjusted figures reflects seasonal factors.
Year-over-year context
Gasoline is one of the few series with a year-over-year reading this month: +37.4% (regular +38.6%, premium +31.4%). The last larger reading was +40.5% in May.
Two readings
- Easing: the gasoline contribution shrank sharply.
- Not uniformly lower: electricity accelerated to +0.9% and fuel oil rose 2.0%, so energy did not turn negative on an adjusted basis.
For November, the focus is gasoline on both adjusted and unadjusted bases, and whether electricity keeps rising.
コアの中身:サービスの広がりと中古車
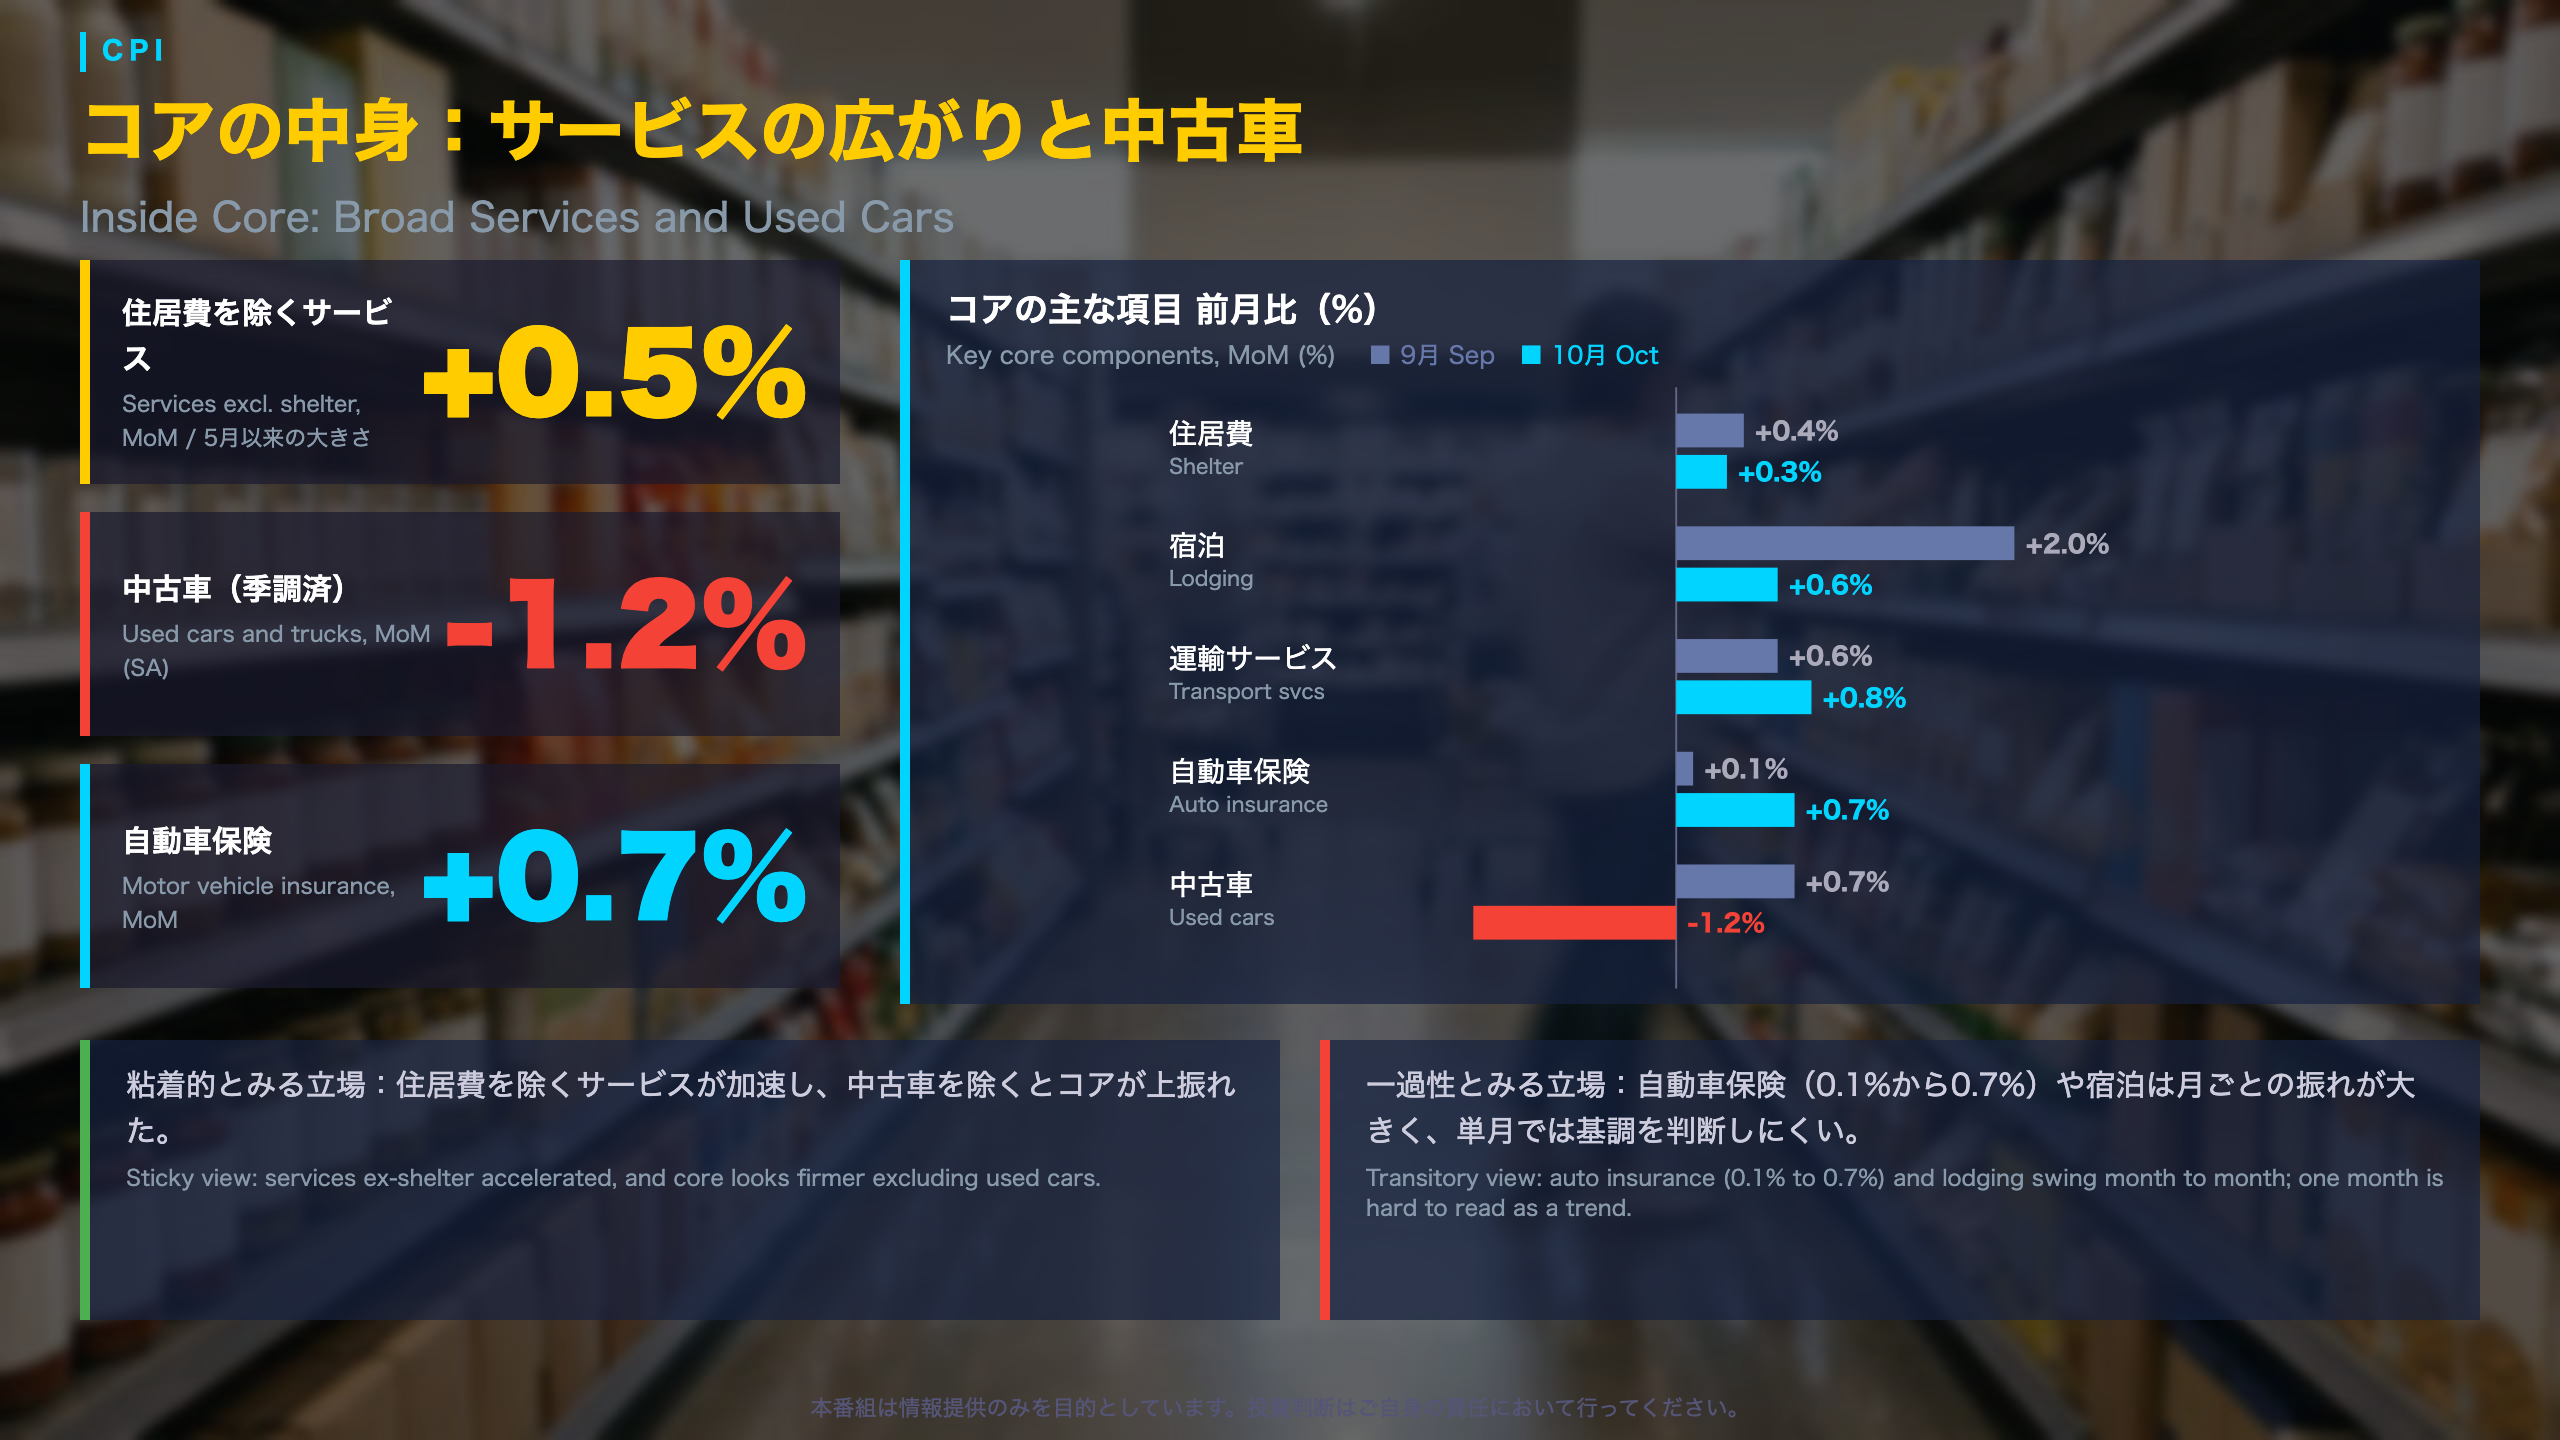
Core CPI Anatomy: Broad Services Strength, Softer Used Cars
US core CPI strips out food and energy, which makes it a steadier gauge than the headline. Because shelter is the largest weight, analysts usually look at shelter and at services excluding shelter separately. The BLS tables give a clear split for October.
Sub-indexes (MoM, %)
| Item | Sep | Oct |
|---|---|---|
| Core | 0.3 | 0.3 |
| Shelter | 0.4 | 0.3 |
| Rent | 0.2 | 0.2 |
| Owners’ equivalent rent | 0.3 | 0.3 |
| Lodging away from home | 2.0 | 0.6 |
| Transportation services | 0.6 | 0.8 |
| Motor vehicle insurance | 0.1 | 0.7 |
| Used cars and trucks | 0.7 | -1.2 |
What stands out
- Shelter components were stable (rent 0.2%, owners’ equivalent rent 0.3%). September’s higher shelter figure owed much to lodging, which swung from 2.0% to 0.6%.
- Services excluding shelter rose 0.5%, the largest since May. Medical services rose 0.3% (hospital services 0.8%) and recreation services 0.9%.
- Used cars fell 2.0% unadjusted and 1.2% adjusted; core goods rose 0.2%.
Two readings
- Sticky: services excluding shelter accelerated, and excluding used cars the index looks firmer.
- Transitory: motor vehicle insurance (0.1% to 0.7%) and lodging are volatile month to month, so one month is a weak basis for a trend call.
November’s release will show whether services ex-shelter stay near 0.5% and whether used-car declines continue.
食品:品目ごとの温度差と次回
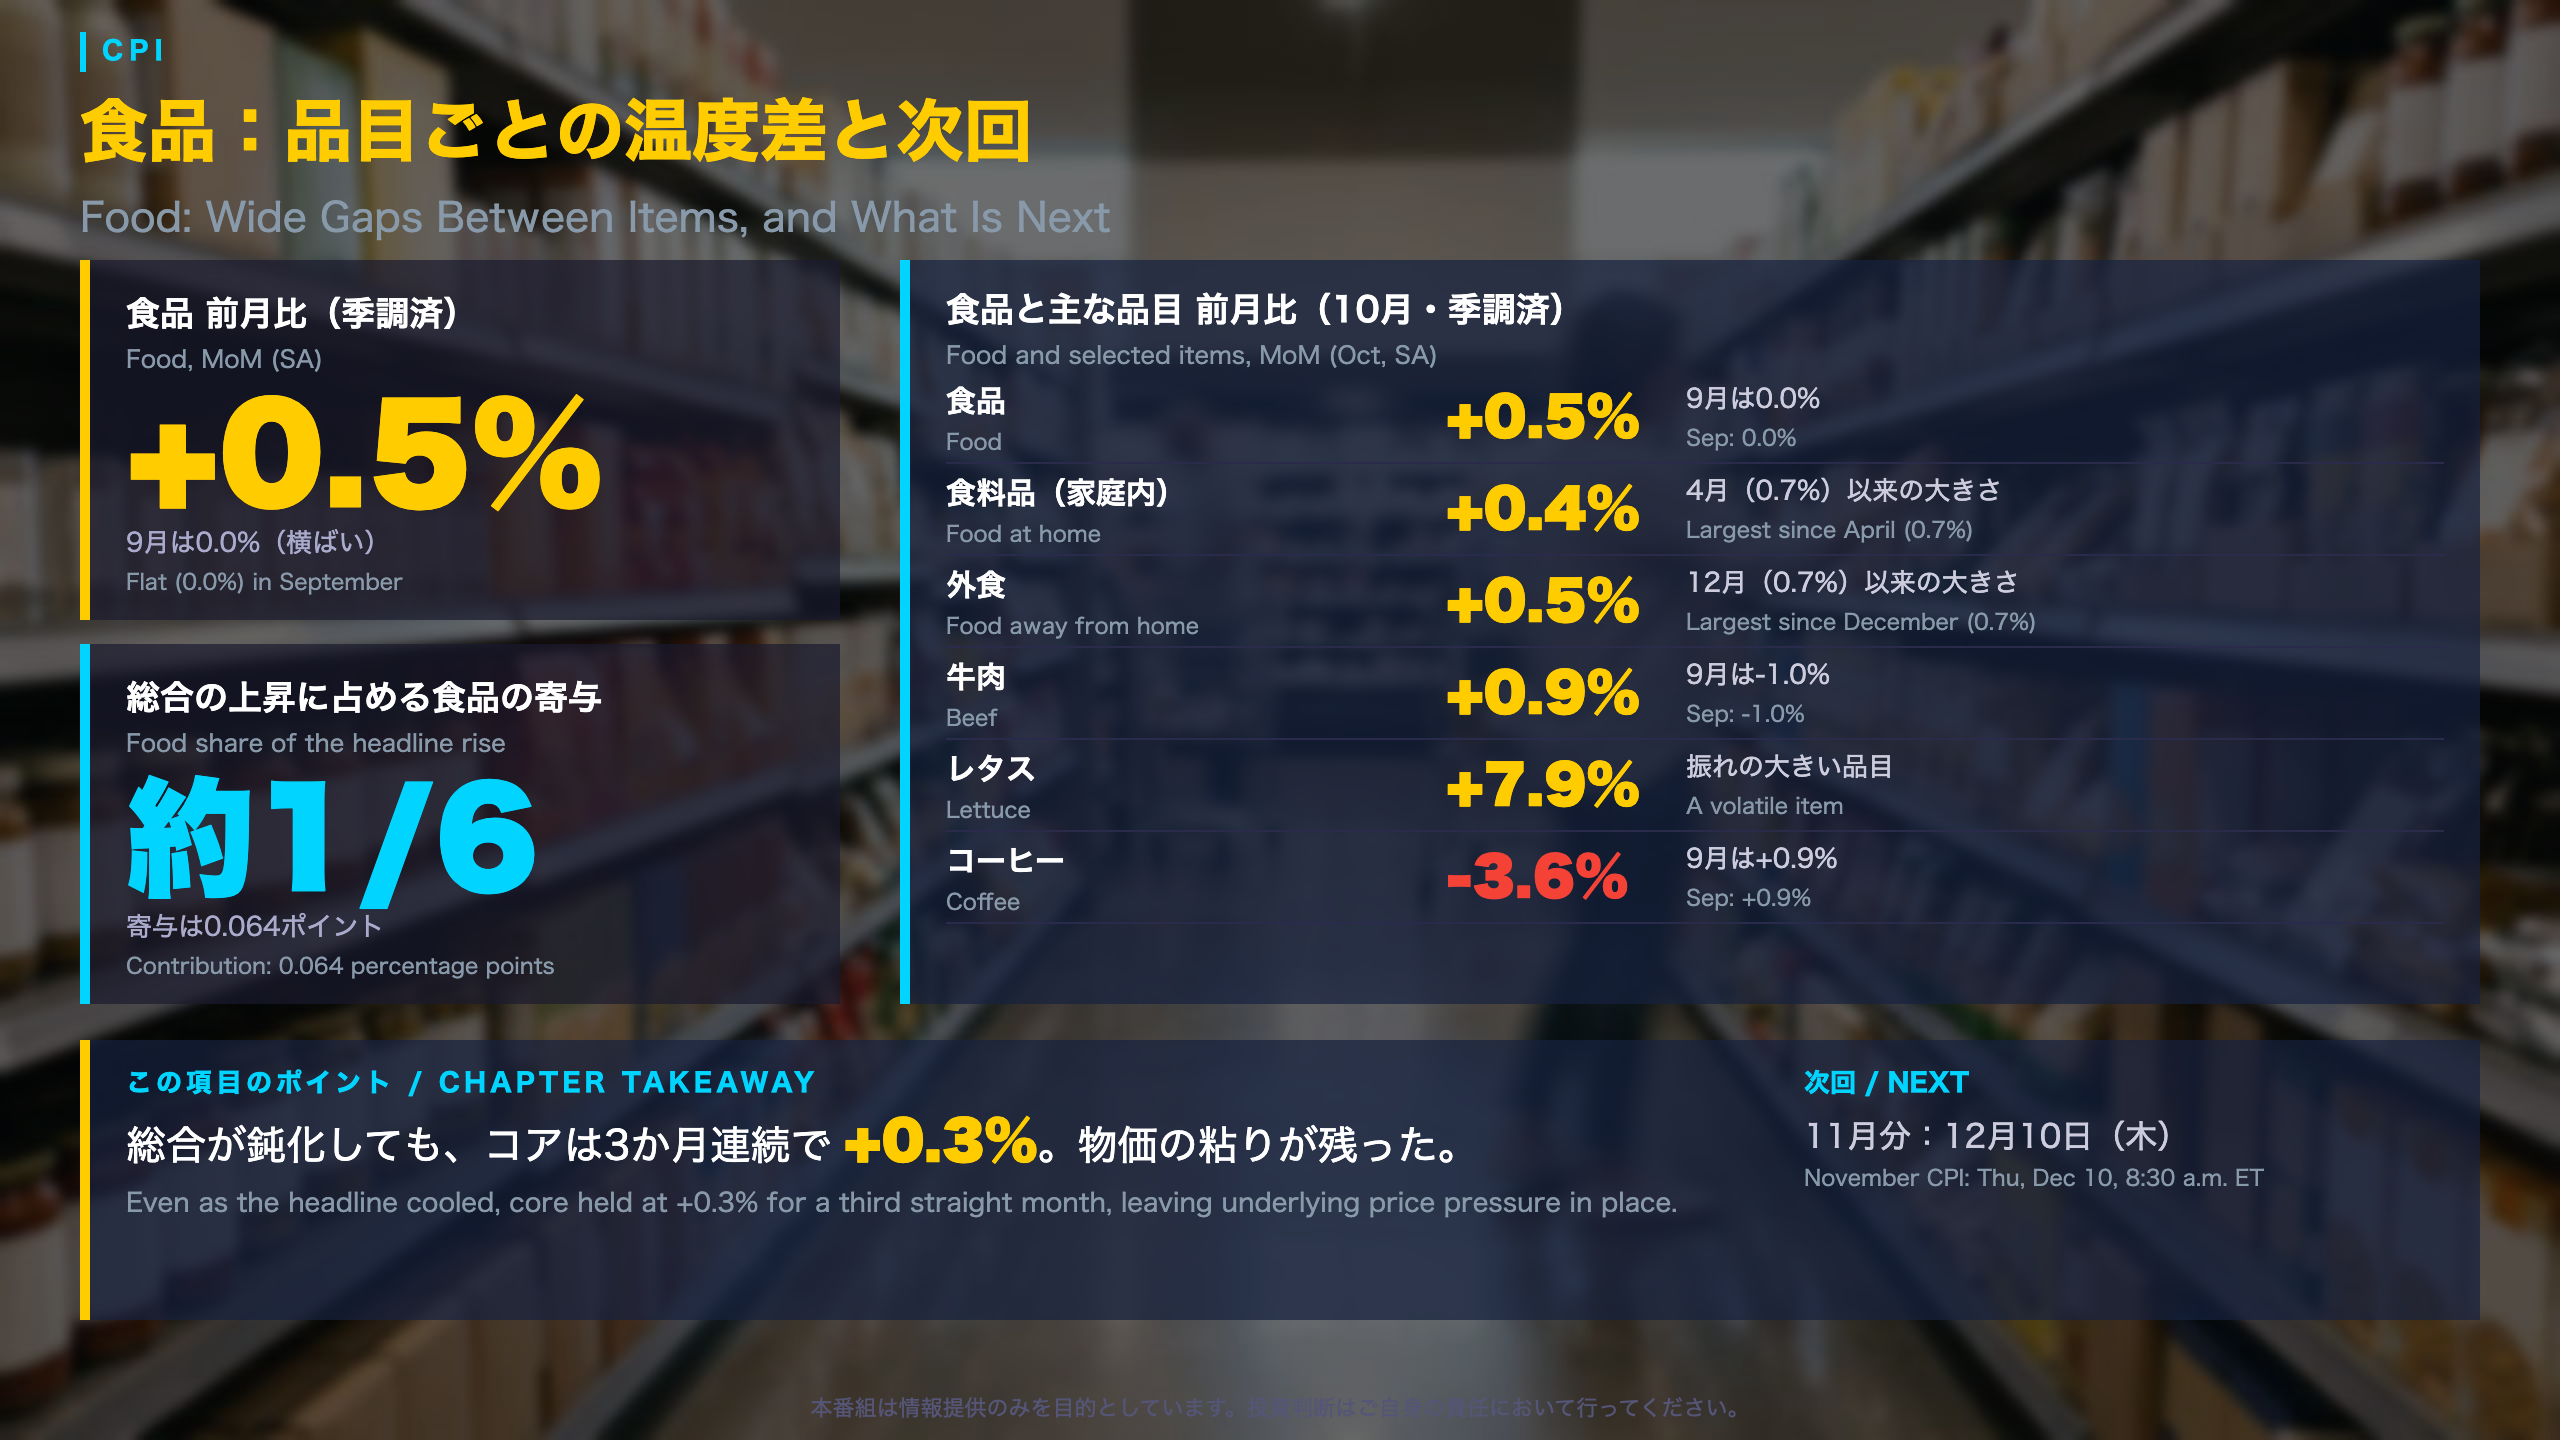
Food Prices: Wide Gaps Between Items
The BLS treats food separately from core CPI, so it can lift the headline even when core is steady. In October, the food index rose 0.5% after a flat reading (0.0%) in September.
Selected items (SA, MoM)
| Item | October | Note |
|---|---|---|
| Food | +0.5% | Sep: 0.0% |
| Food at home | +0.4% | Largest since April (0.7%) |
| Food away from home | +0.5% | Largest since December (0.7%) |
| Beef | +0.9% | Sep: -1.0% |
| Lettuce | +7.9% | Volatile item |
| Coffee | -3.6% | Sep: +0.9% |
Reading the details
- Food contributed 0.064 percentage points, roughly one-sixth of the headline increase.
- Of six grocery categories, four rose, one fell (nonalcoholic beverages, -0.3%) and cereals and bakery products were flat.
Two readings
- Burden persists: both grocery and restaurant prices rose.
- Wide dispersion: coffee and milk (-0.3%) declined, and lettuce is a volatile series.
What comes next
This release contains no Federal Reserve commentary. Core momentum, services excluding shelter and the energy contribution can all be checked in the November CPI, due Thursday, December 10 at 8:30 a.m. Eastern Time.
労働市場:新規失業保険申請は20万件
What this report is
The U.S. Department of Labor (DOL) publishes initial unemployment insurance claims every week. Because it is a high-frequency administrative count rather than a survey, it is often used to track the labor market between the monthly employment reports.
Key numbers
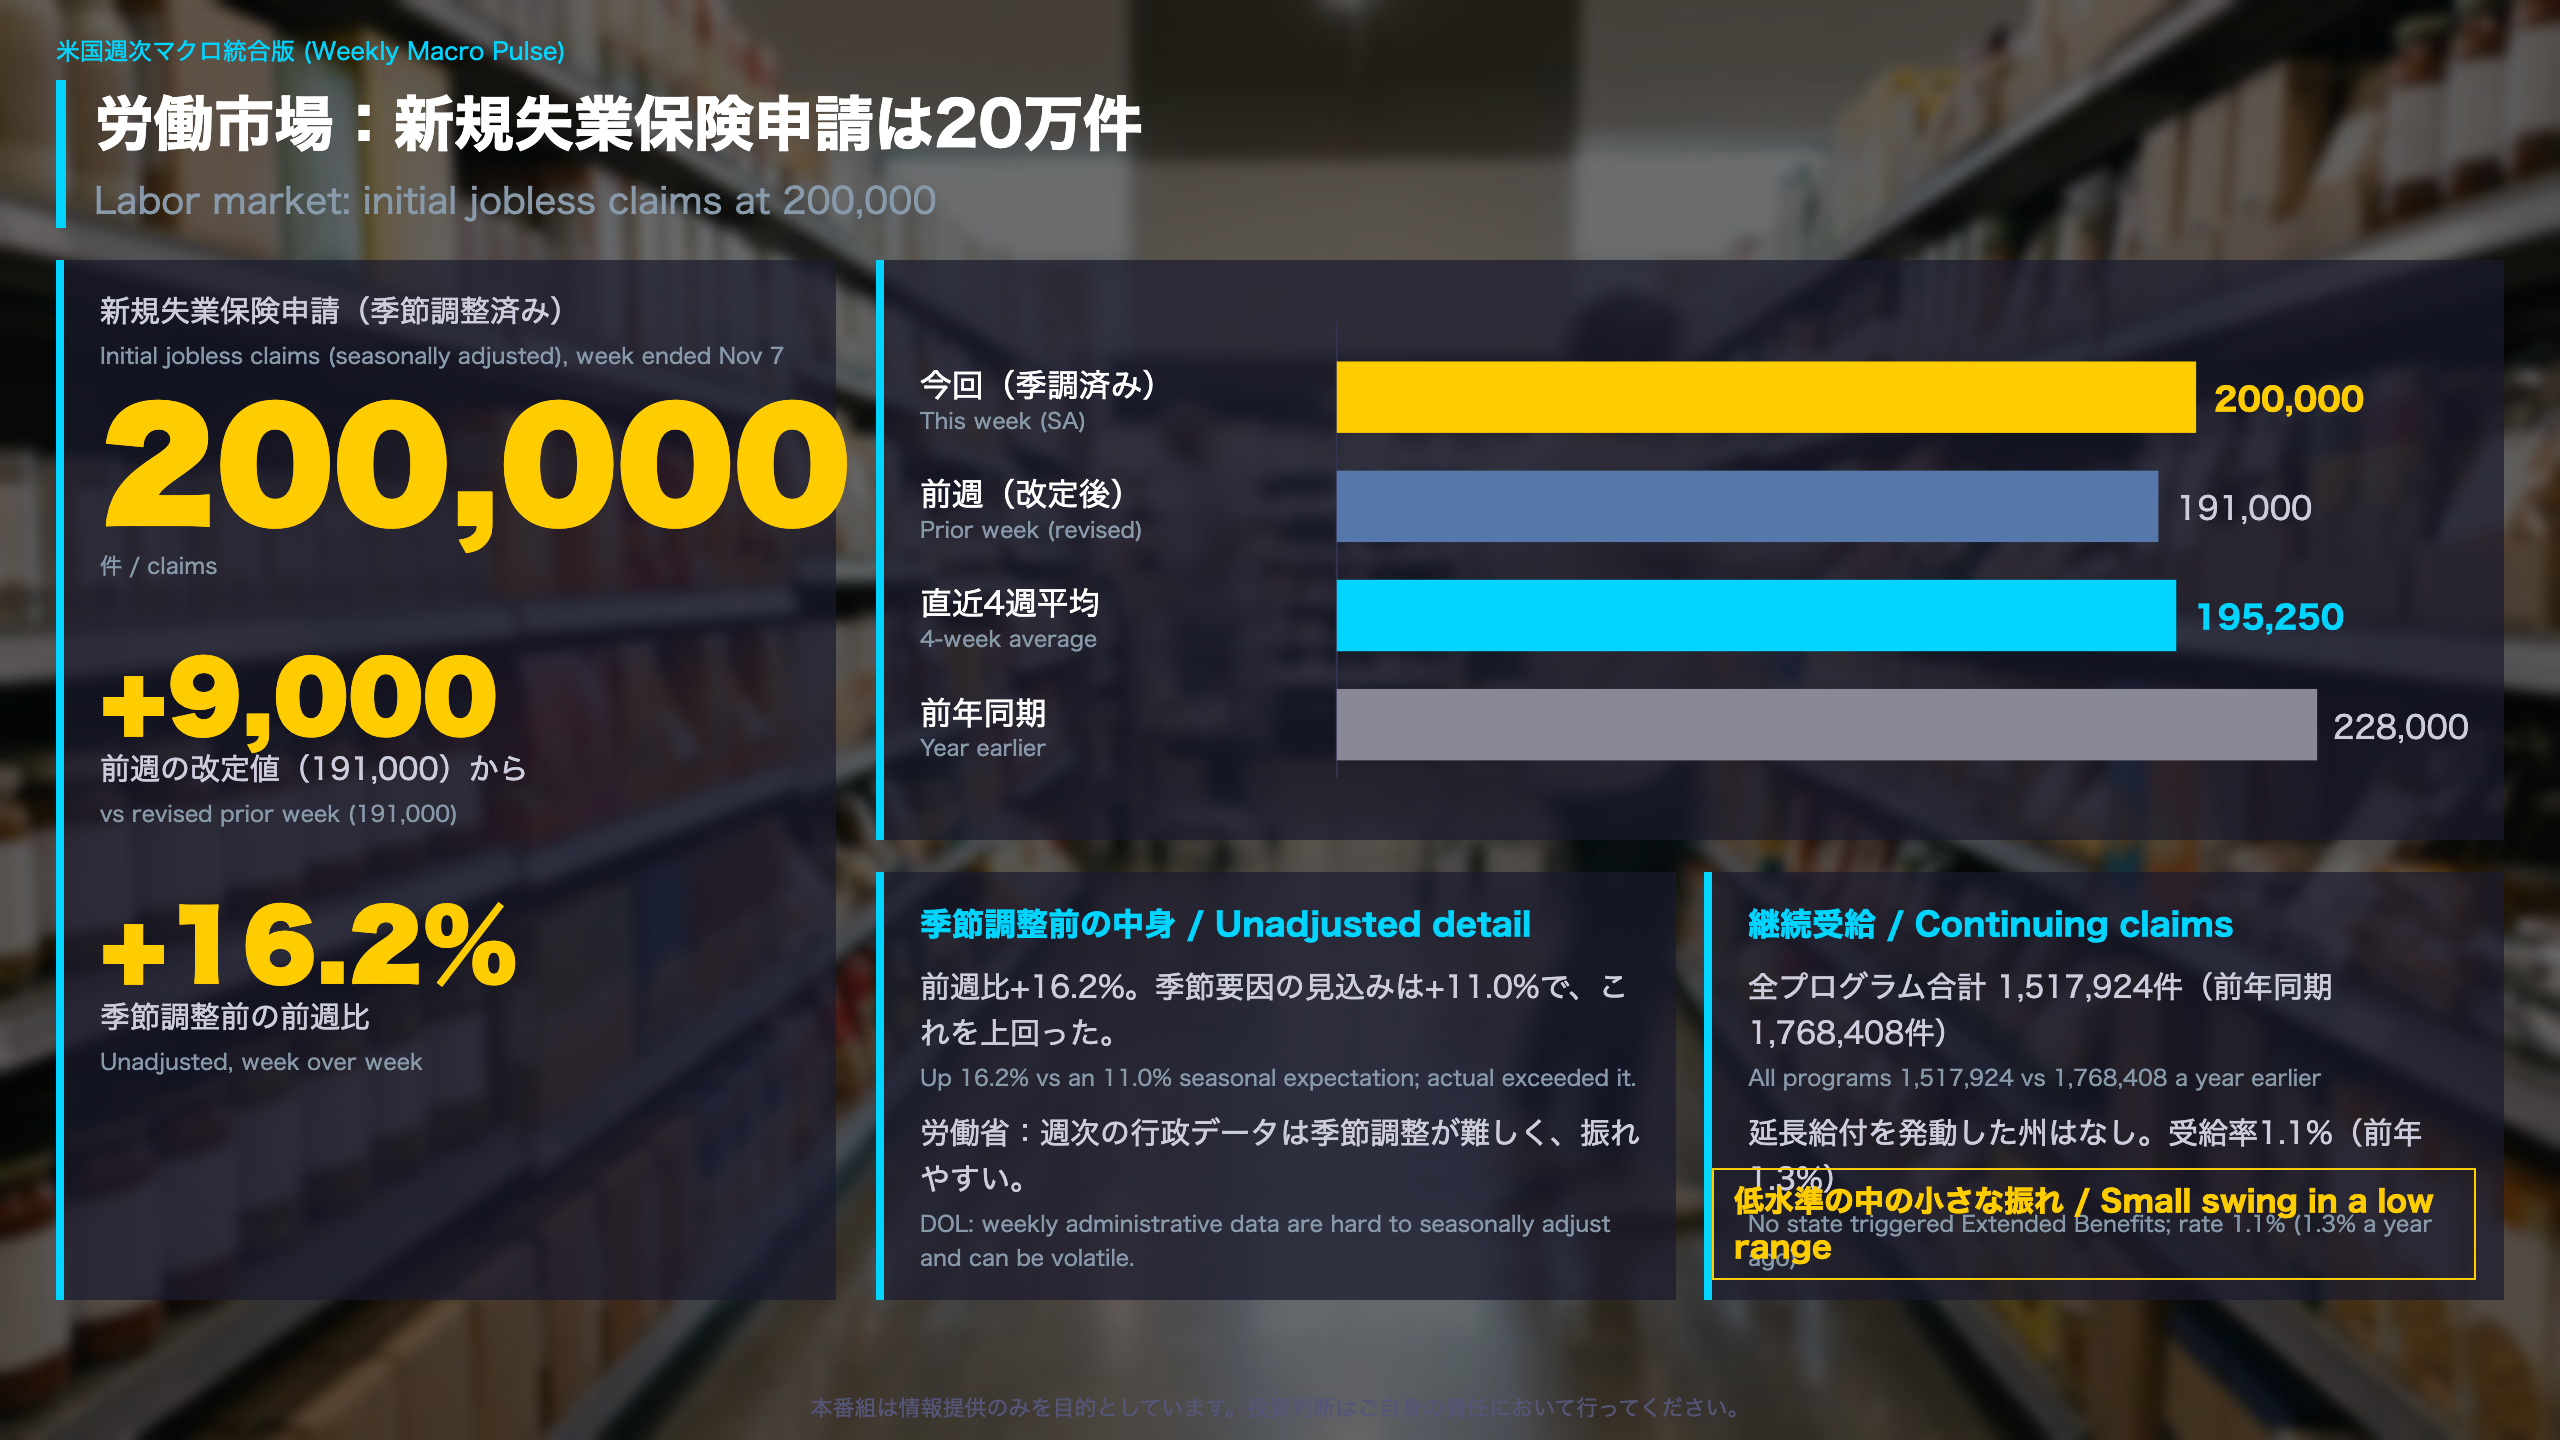
- Seasonally adjusted initial claims: 200,000, up 9,000 from a revised 191,000 the week before
- Four-week moving average: 195,250, unchanged from the prior week’s revised average and below the 227,000 of a year earlier
- Unadjusted claims: 206,982, up 28,870 (16.2%) on the week, versus a seasonal-factor expectation of a 19,663 (11.0%) rise
Why the adjusted and unadjusted views differ
The actual unadjusted increase exceeded what seasonal factors anticipated, which is what lifts the adjusted figure. The DOL cautions that these are “weekly administrative data which are difficult to seasonally adjust,” so single-week moves can mislead.
Continuing claims
All-program continuing claims were 1,517,924 for the week ended Oct 24, below 1,768,408 a year earlier. No state has triggered Extended Benefits, and the insured unemployment rate stayed at 1.1% (1.3% a year ago).
Two readings
- Constructive: claims and continuing claims are both below year-ago levels.
- Cautious: the unadjusted rise beat seasonal expectations, and some states posted large advance increases.
Context for non-U.S. readers
Unlike Japan’s monthly labor force survey, U.S. weekly claims count people filing for benefits, so they respond quickly but are noisy. What to watch next is whether claims stay near 200,000 or drift away from the 195,250 average. This is not a forecast, only the marker the data themselves offer.
エネルギー:原油は前週比で下落、水準は前年より高い
What this report is
The U.S. Energy Information Administration (EIA) publishes its Weekly Petroleum Status Report with inventories, refinery and import data, and prices. It is a standard high-frequency gauge of U.S. energy supply and demand. This summary uses the table figures for the week ended Nov 6.
Prices
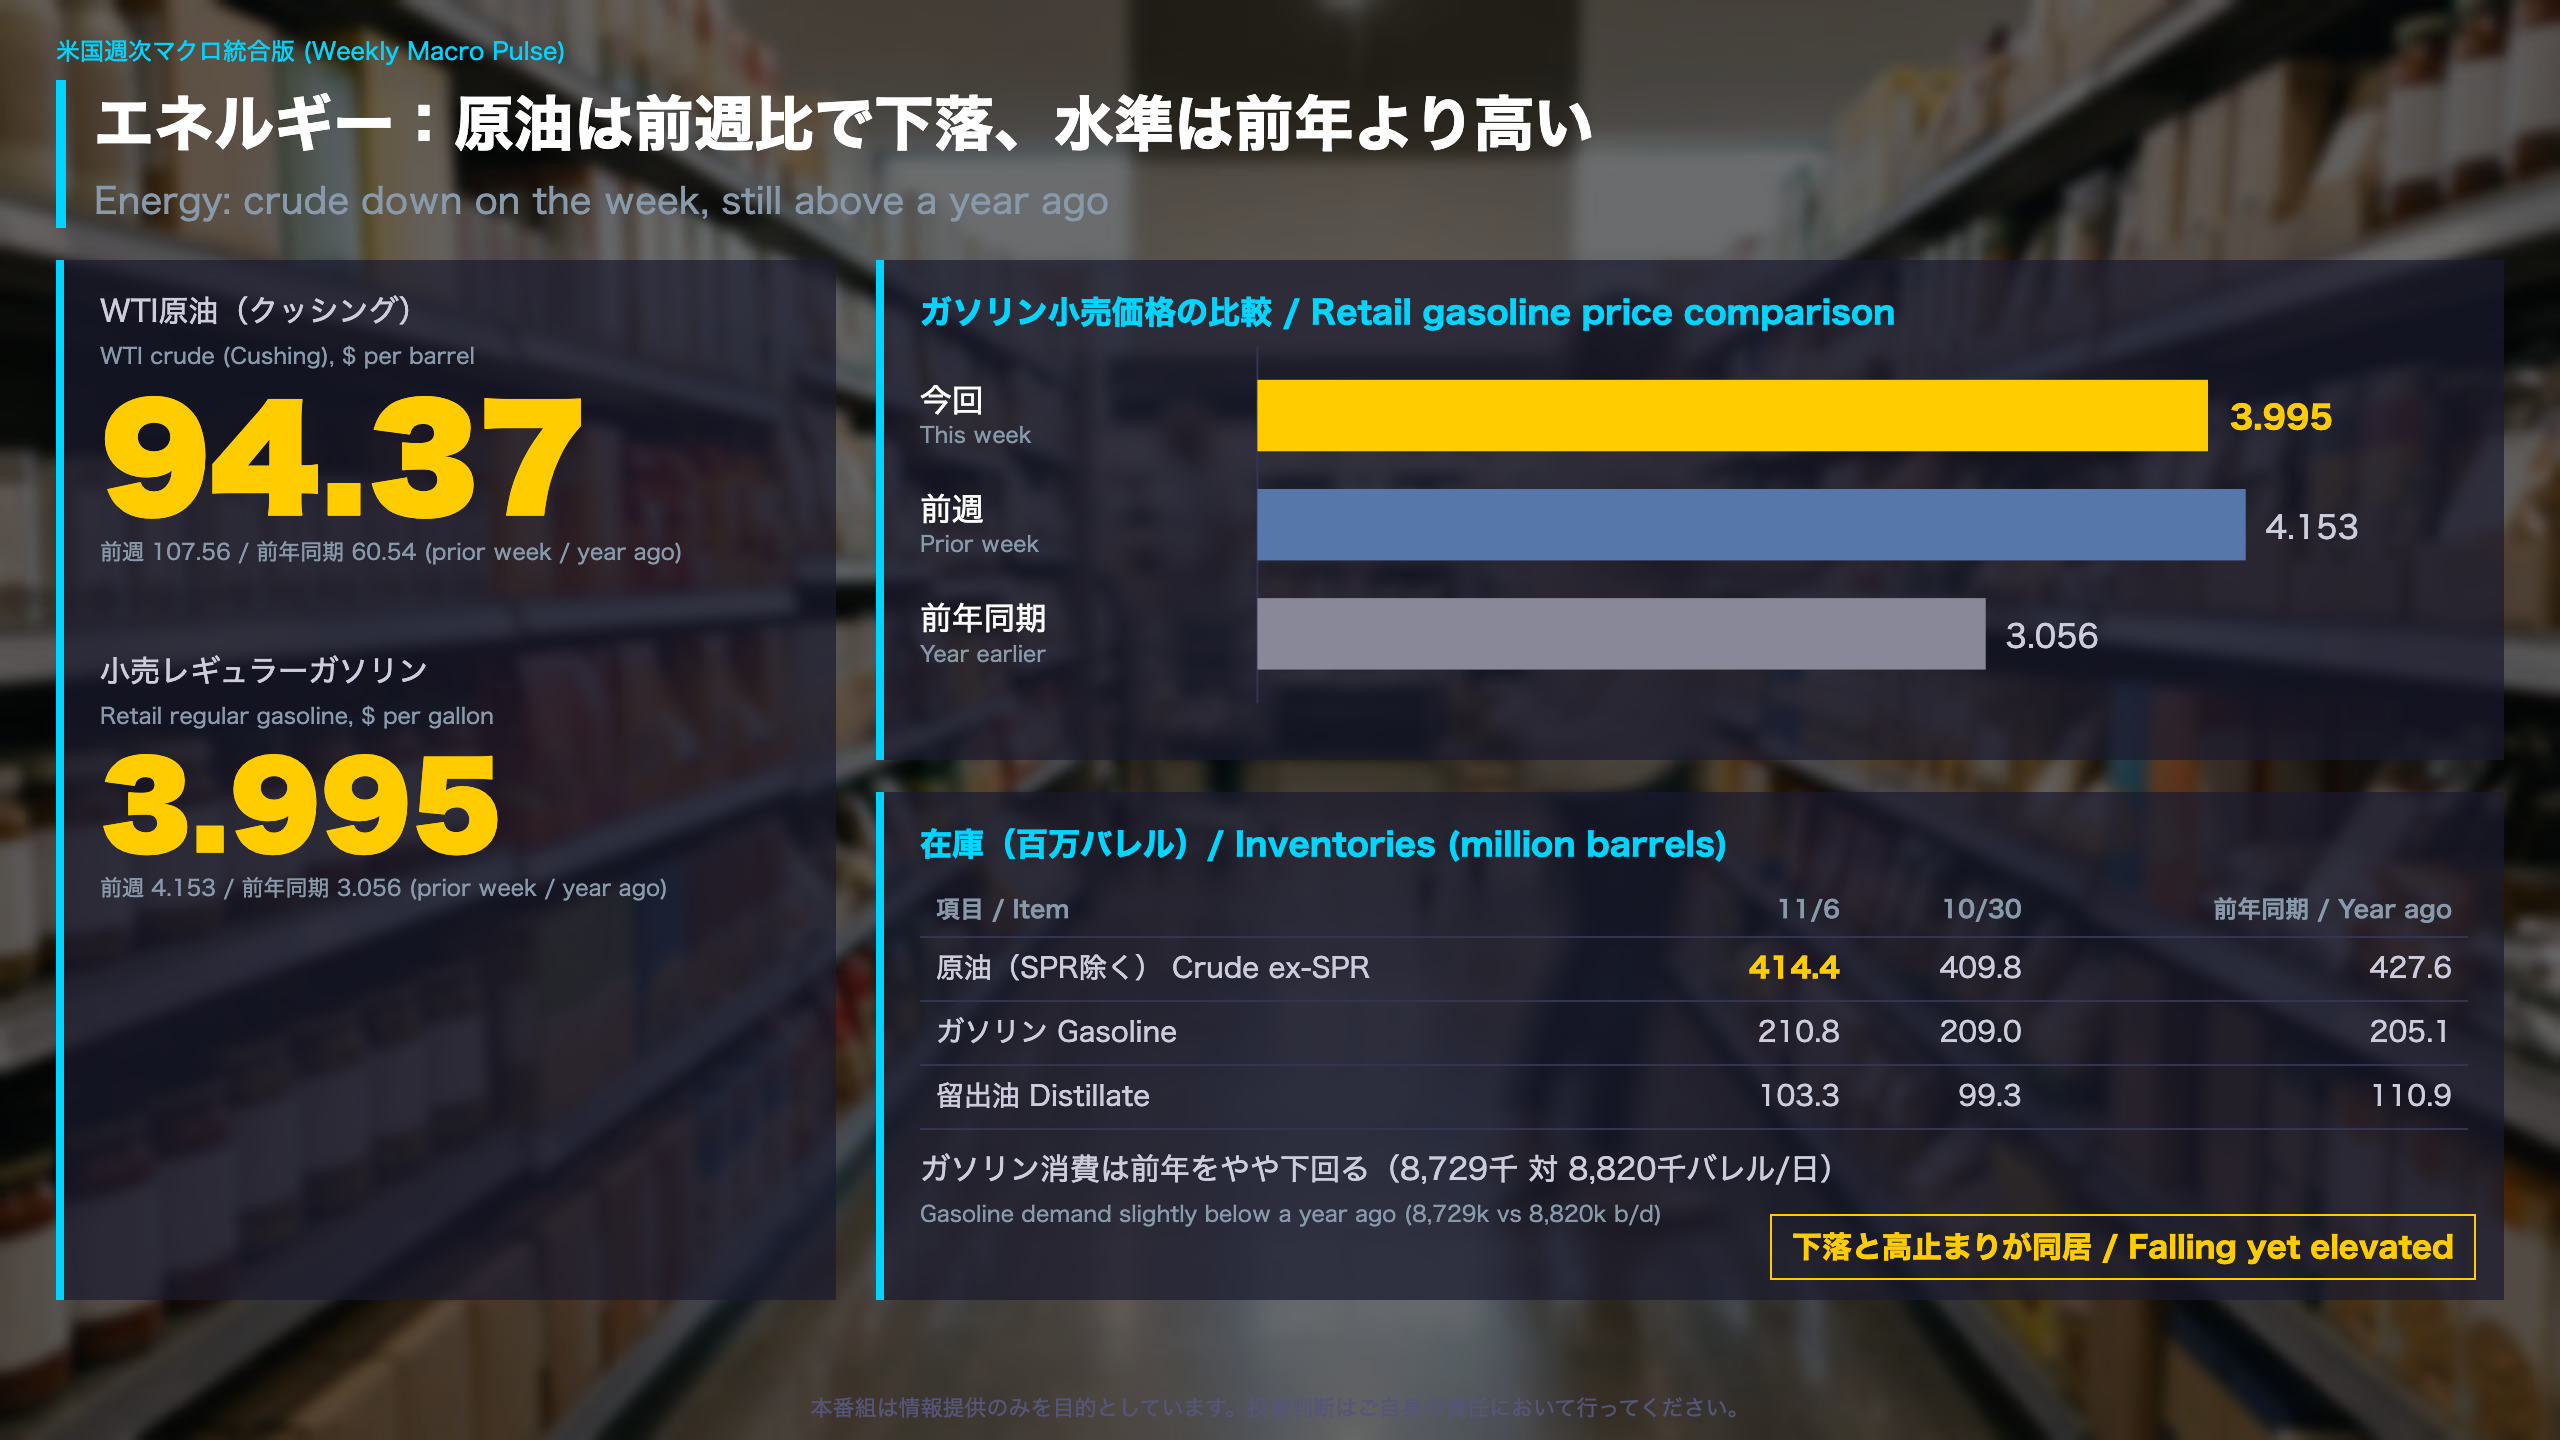
- WTI (Cushing): $94.37, versus $107.56 a week earlier and $60.54 a year ago
- Retail regular gasoline: $3.995 (prior week $4.153, year ago $3.056)
- Diesel: $6.127 (year ago $3.837)
So prices eased on the week but remain well above last year.
Inventories (million barrels)
- Commercial crude excluding the Strategic Petroleum Reserve: 414.4, up from 409.8 but below 427.6 a year ago
- Gasoline: 210.8 (year ago 205.1)
- Distillate: 103.3 (year ago 110.9)
- SPR: 279.5, versus 410.4 a year ago
Sub-indicators
Four-week average net crude imports were 2,445 thousand barrels a day, above both the prior four weeks (2,003) and a year earlier (1,592), which may be one contributor to the stock build. Total products supplied averaged 20,790 thousand barrels a day, down from 21,191 but above the 20,606 of a year ago. Distillate demand is above last year, gasoline slightly below.
Two readings
A crude build can hint at softer demand, yet high refinery runs and higher imports point to supply-side drivers. A single week cannot settle the question.
Why it matters
For investors who follow U.S. equities, energy prices feed into inflation readings such as CPI. The report itself makes no such link, and nothing here is a forecast. The next marker is whether gasoline stays above last year’s level and whether the crude build continues.
FRB流動性:準備預金は前年より多い
What this report is
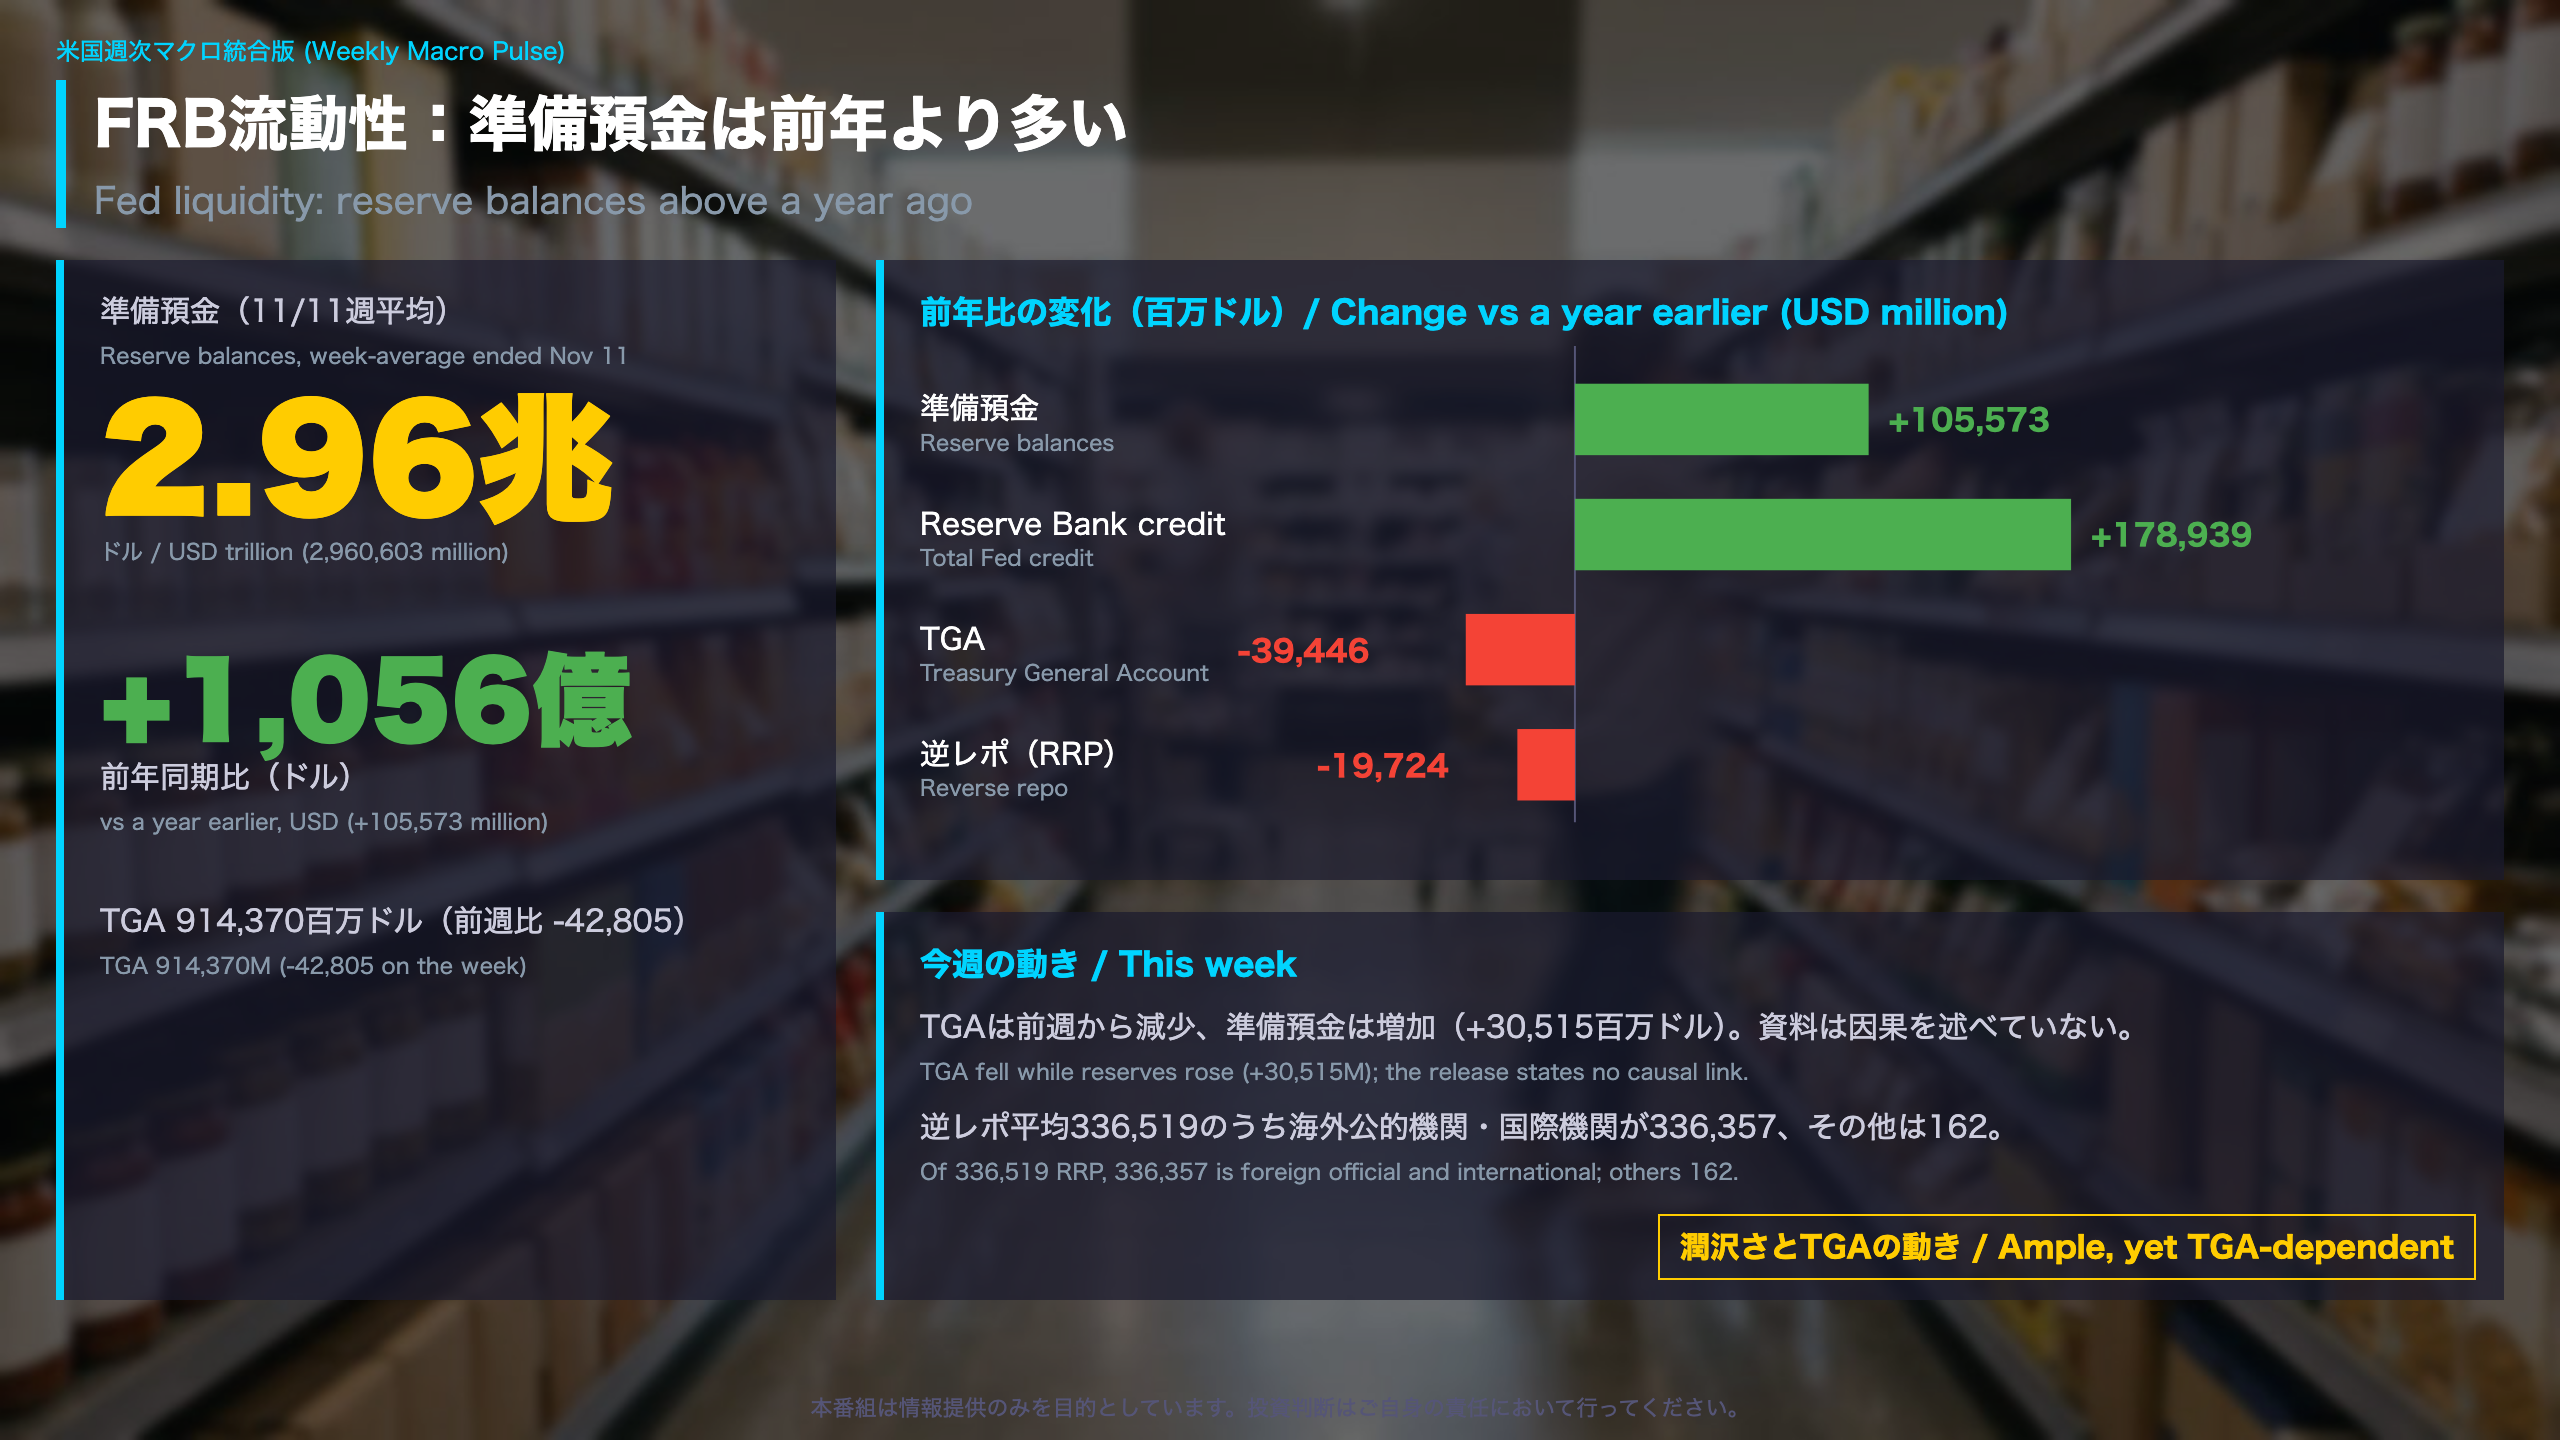
The Federal Reserve’s H.4.1 statistical release shows the Fed’s balance sheet each week. Reserve balances are the deposits commercial banks hold at the Fed, and the Treasury General Account (TGA) is the U.S. Treasury’s operating account there, so movements in one can coincide with movements in the other. Figures below are weekly averages for the week ended Nov 11, in millions of dollars.
Key changes
| Item | Level | Week | Year |
|---|---|---|---|
| Reserve Bank credit | 6,707,462 | +5,947 | +178,939 |
| Reserve balances | 2,960,603 | +30,515 | +105,573 |
| Reverse repo (RRP) | 336,519 | -4,432 | -19,724 |
| TGA | 914,370 | -42,805 | -39,446 |
Securities holdings (year over year)
Bills rose 382,036 and nominal Treasury coupons 45,709, while inflation-protected securities fell 32,060 and mortgage-backed securities fell 186,441. Total securities held are up 203,947. The release says nothing about balance sheet runoff policy, so none is inferred here.
Who uses the reverse repo
Of the 336,519 average, 336,357 comes from foreign official and international accounts and only 162 from other counterparties, which include domestic financial firms. Domestic parking of surplus cash at the facility is therefore minimal.
Two readings
- Constructive: reserves are above last year, so liquidity looks ample.
- Cautious: the TGA is still high, close to its year-ago level, and its path can move reserves.
Context for non-U.S. readers
This is the U.S. counterpart of the Bank of Japan’s current account balances, but the Fed publishes it weekly. The release does not draw conclusions for markets, and neither do we. The next marker is how the TGA and reserve balances move together in following weeks.
3指標を並べて見る:強弱が混じった落ち着き
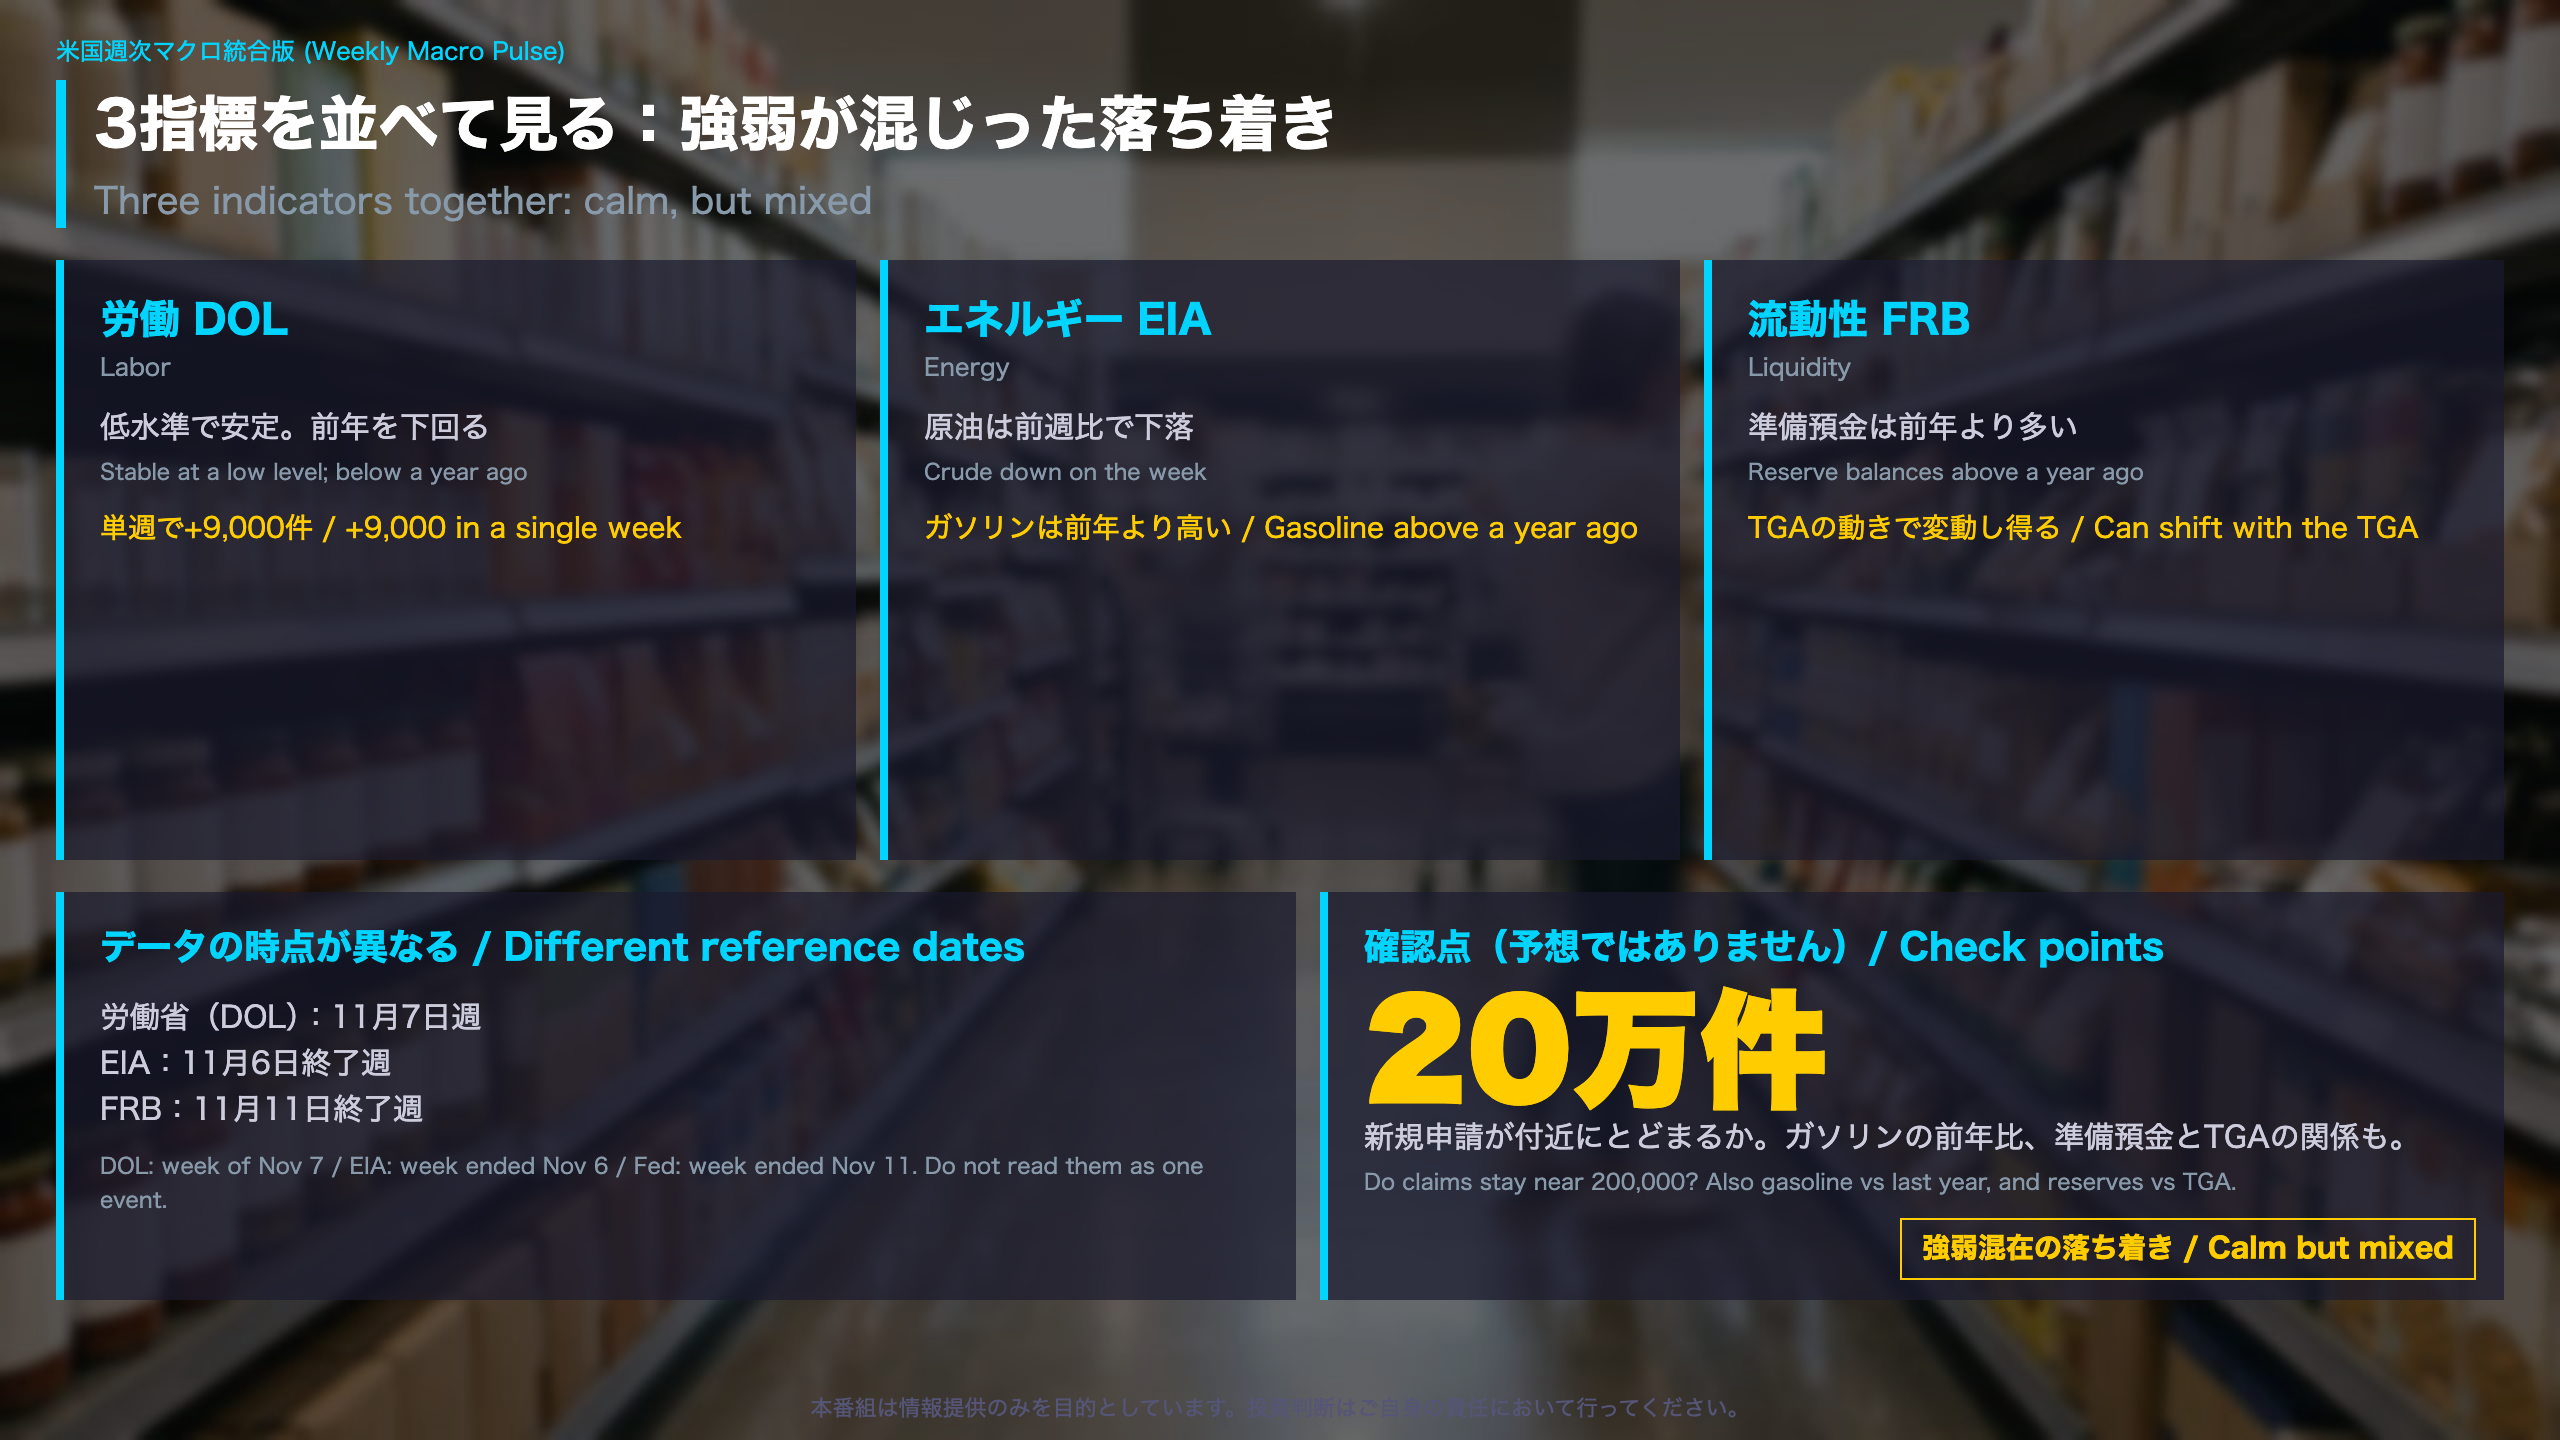
Putting three weekly series together
The Labor Department’s jobless claims, the Energy Information Administration’s petroleum report and the Federal Reserve’s H.4.1 release are all updated weekly. Each covers a different slice of the economy, which makes them useful for tracking change between the monthly releases, but also means they should not be forced into one story.
Signal matrix
| Area | This week | Strength / weakness |
|---|---|---|
| Labor | Stable at a low level | Below a year ago, though claims rose 9,000 on the week |
| Energy | Prices down on the week | Level still above a year ago |
| Liquidity | Reserves above a year ago | Can shift with the TGA |
The broad direction is calm, but gasoline at $3.995 versus $3.056 a year earlier is a counterweight.
Mind the timing
Jobless claims cover the week of Nov 7, the EIA the week ended Nov 6, and the Fed the week ended Nov 11. Continuing claims lag by an additional week or more. Reading them as a single week’s event risks mistaken causality.
Two readings
- Constructive: claims and continuing claims are below year-ago levels, and reserves exceed last year’s.
- Cautious: gasoline remains above last year, and the crude stock build is a single-week observation.
What to check next (not a forecast)
- Do initial claims stay near 200,000, or move away from the 195,250 four-week average together with continuing claims?
- Does crude keep easing, and does retail gasoline stay above its year-ago level?
- Does the relationship between the TGA and reserve balances persist?
Note on scheduling
This release set contains no dates for the FOMC, the employment report or CPI. Readers should consult each agency’s published calendar. This piece is an explanation of official data, not a recommendation to buy or sell anything.
今週のまとめ:物価の鈍化と粘着、落ち着いた雇用と流動性
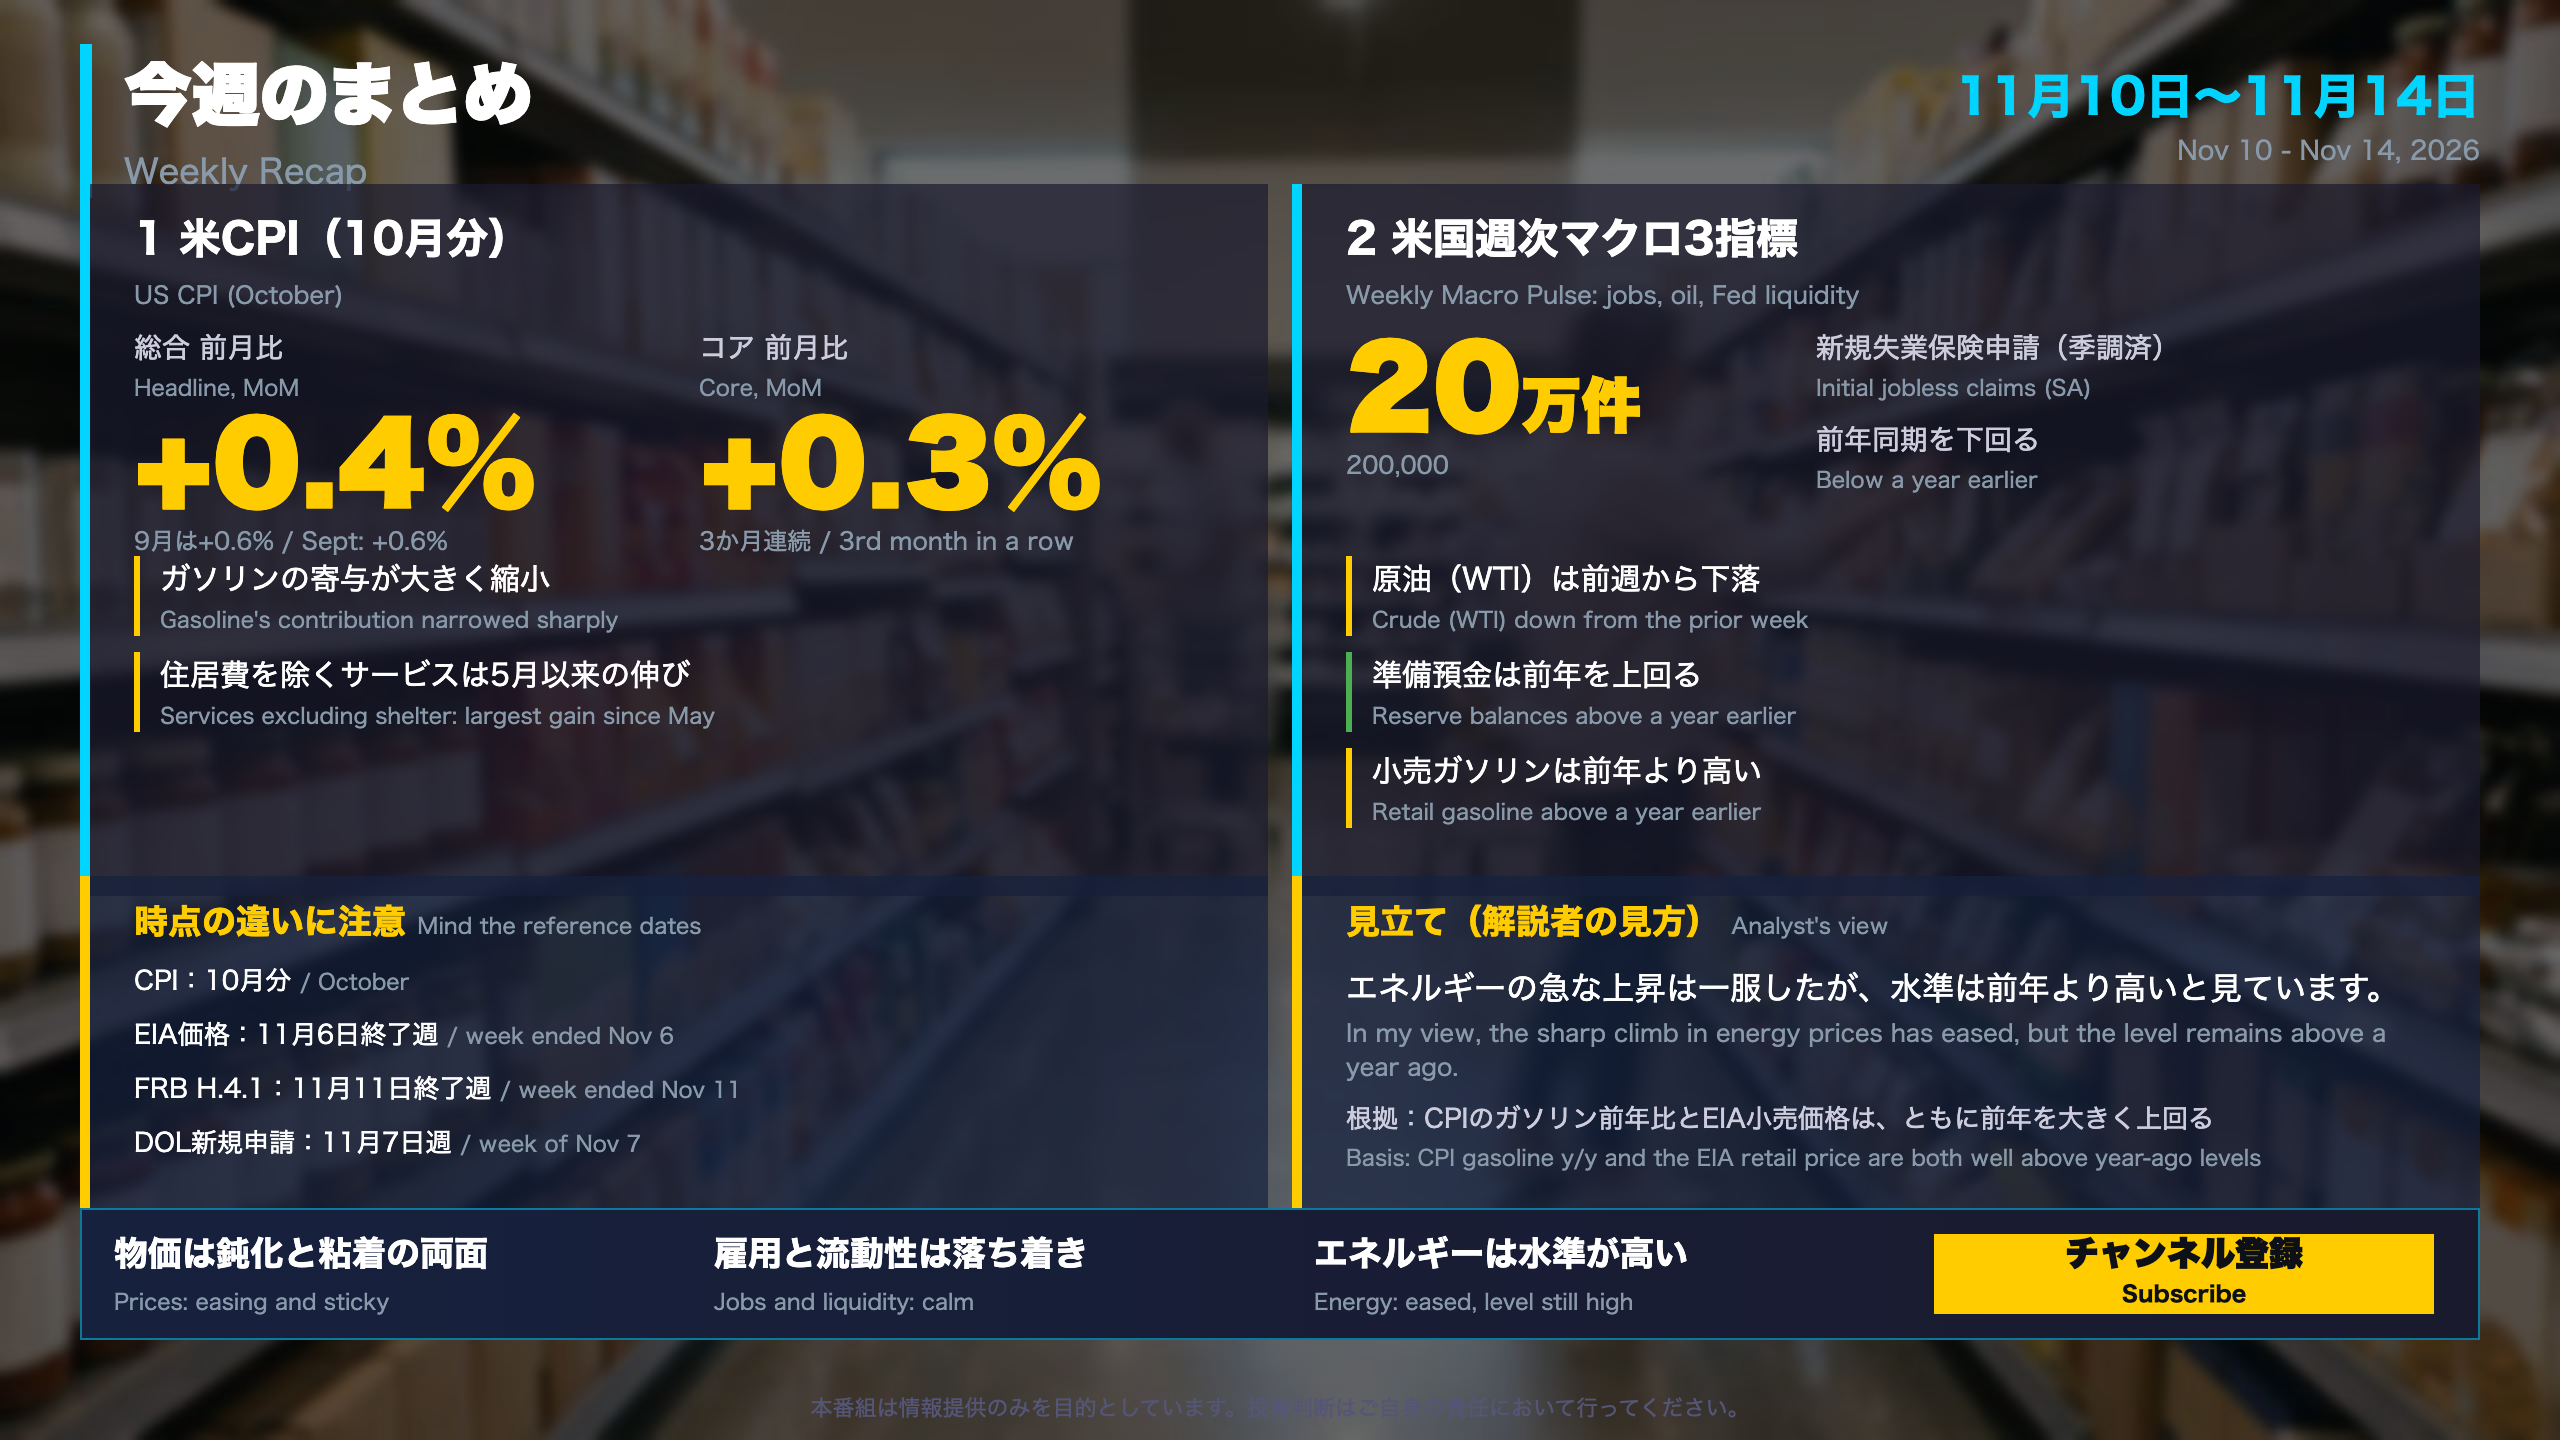
Weekly Recap: Two Releases, One Mixed Picture
Who publishes what. The Bureau of Labor Statistics (BLS) produces the CPI, the Department of Labor (DOL) the weekly jobless claims, the Energy Information Administration (EIA) the weekly petroleum status report, and the Federal Reserve the H.4.1 balance sheet release.
Prices: October CPI
- Headline CPI rose 0.4% month over month, down from 0.6% in September. Gasoline rose 1.0% after 9.1%, and the energy index rose 0.7% after 5.2%.
- Core CPI (excluding food and energy in the US definition; Japan’s core excludes only fresh food) rose 0.3% for the third month in a row. Services excluding shelter rose 0.5%, the largest since May, while used cars fell 1.2%.
- Year-over-year comparisons are mostly unavailable because the October 2025 survey was not conducted during the budget lapse.
Weekly data
- Initial jobless claims were 200,000, versus 228,000 a year earlier. Continuing claims across all programs (week of October 24) were 1,517,924, versus 1,768,408 a year earlier.
- Commercial crude stocks rose to 414.4 million barrels from 409.8 million. WTI fell to $94.37 from $107.56 the prior week, but retail gasoline at $3.995 is above last year’s $3.056.
- Reserve balances averaged about $2.96 trillion, up $30.5 billion on the week and $105.6 billion on the year.
How to read it together
The releases cover different dates: CPI is October, EIA is the week ended November 6, the Fed is the week ended November 11 and the DOL is the week of November 7. They should not be read as one snapshot. The program’s view is that the sharp climb in energy prices has eased while its level remains above a year ago, based on CPI gasoline’s large year-over-year gain and the higher retail price.
Context
The Fed’s 2% inflation goal is defined on PCE prices rather than CPI, and none of these releases contains a Fed policy statement. This recap explains published data and offers no forecast.
Disclaimer: This article is for informational purposes only. All investment decisions are made solely at your own risk.