This article was automatically generated by the NFC Market Live AI analysis system. (Updated: 2026-11-14 07:14 JST)
📄 Primary Source
米国労働省(DOL)— 新規失業保険申請件数
https://www.dol.gov/newsroom/releases/eta/eta20261112
米国エネルギー情報局(EIA)— 週間石油状況レポート
https://www.eia.gov/petroleum/supply/weekly/pdf/highlights.pdf
連邦準備制度理事会(FRB)— H.4.1 バランスシート
https://www.federalreserve.gov/releases/h41/current/h41.htm
📊 A one-stop review of this week’s three US macro indicators: labor, energy and Fed liquidity.
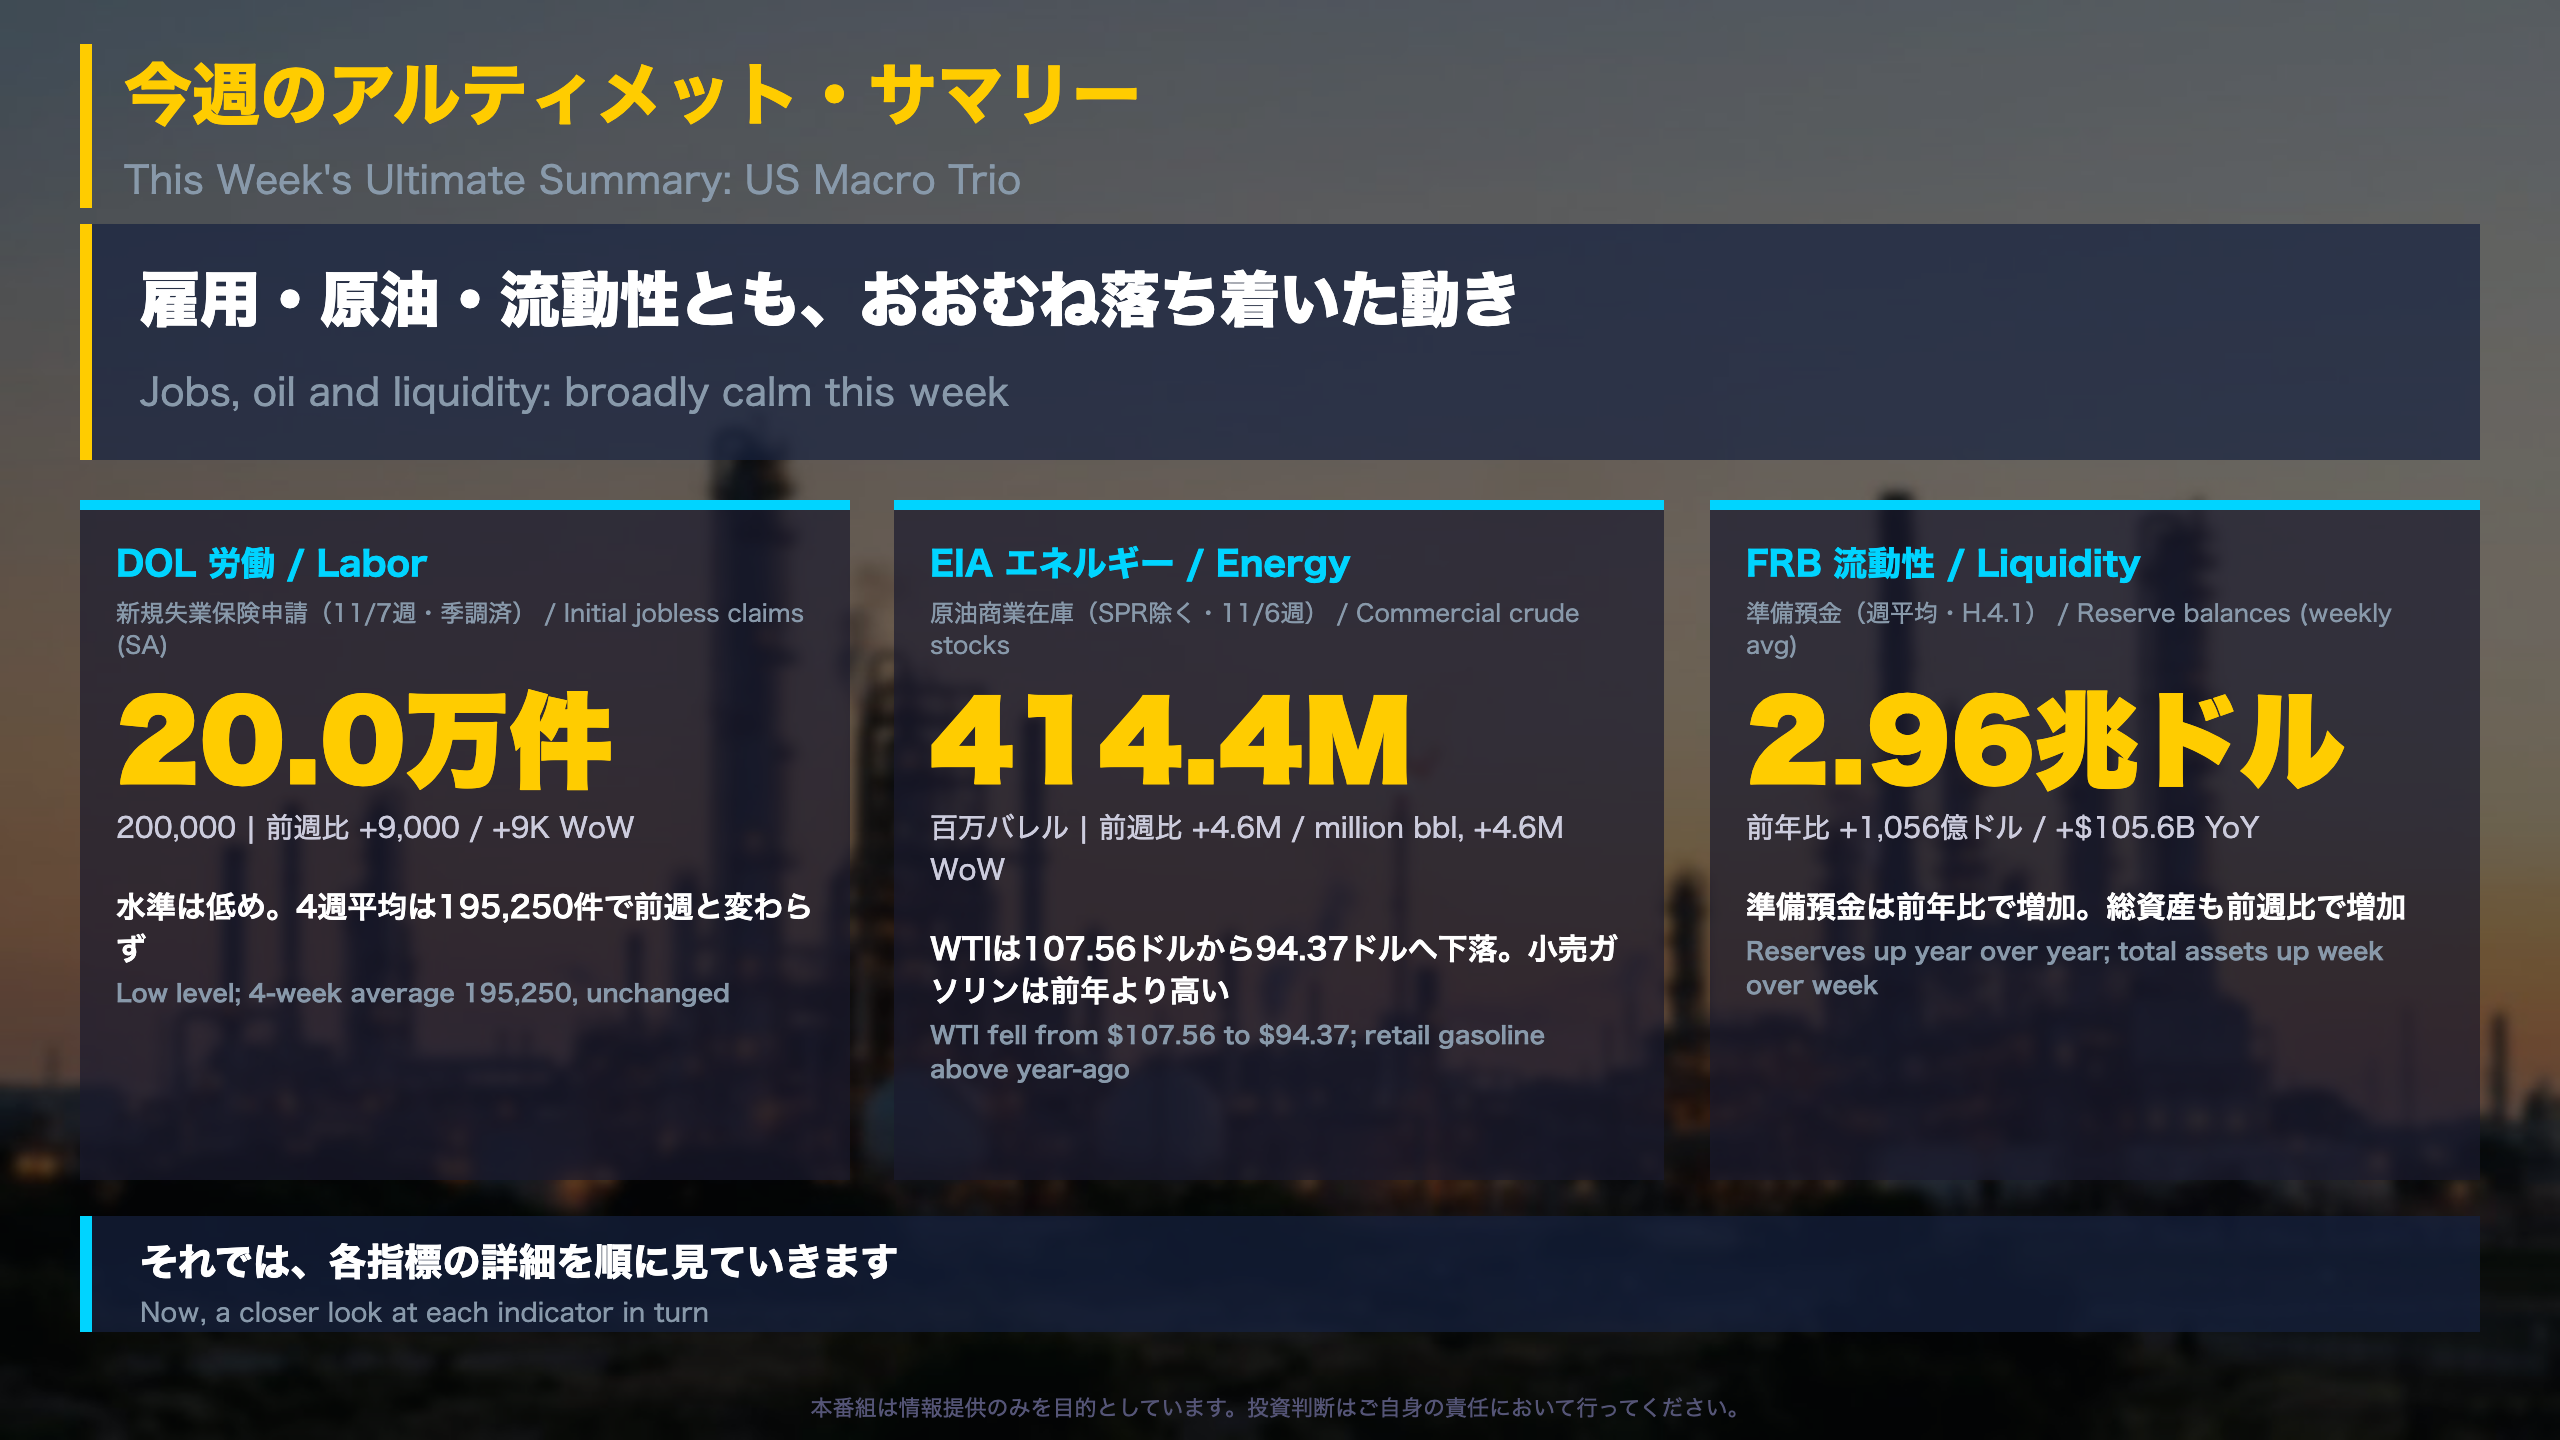
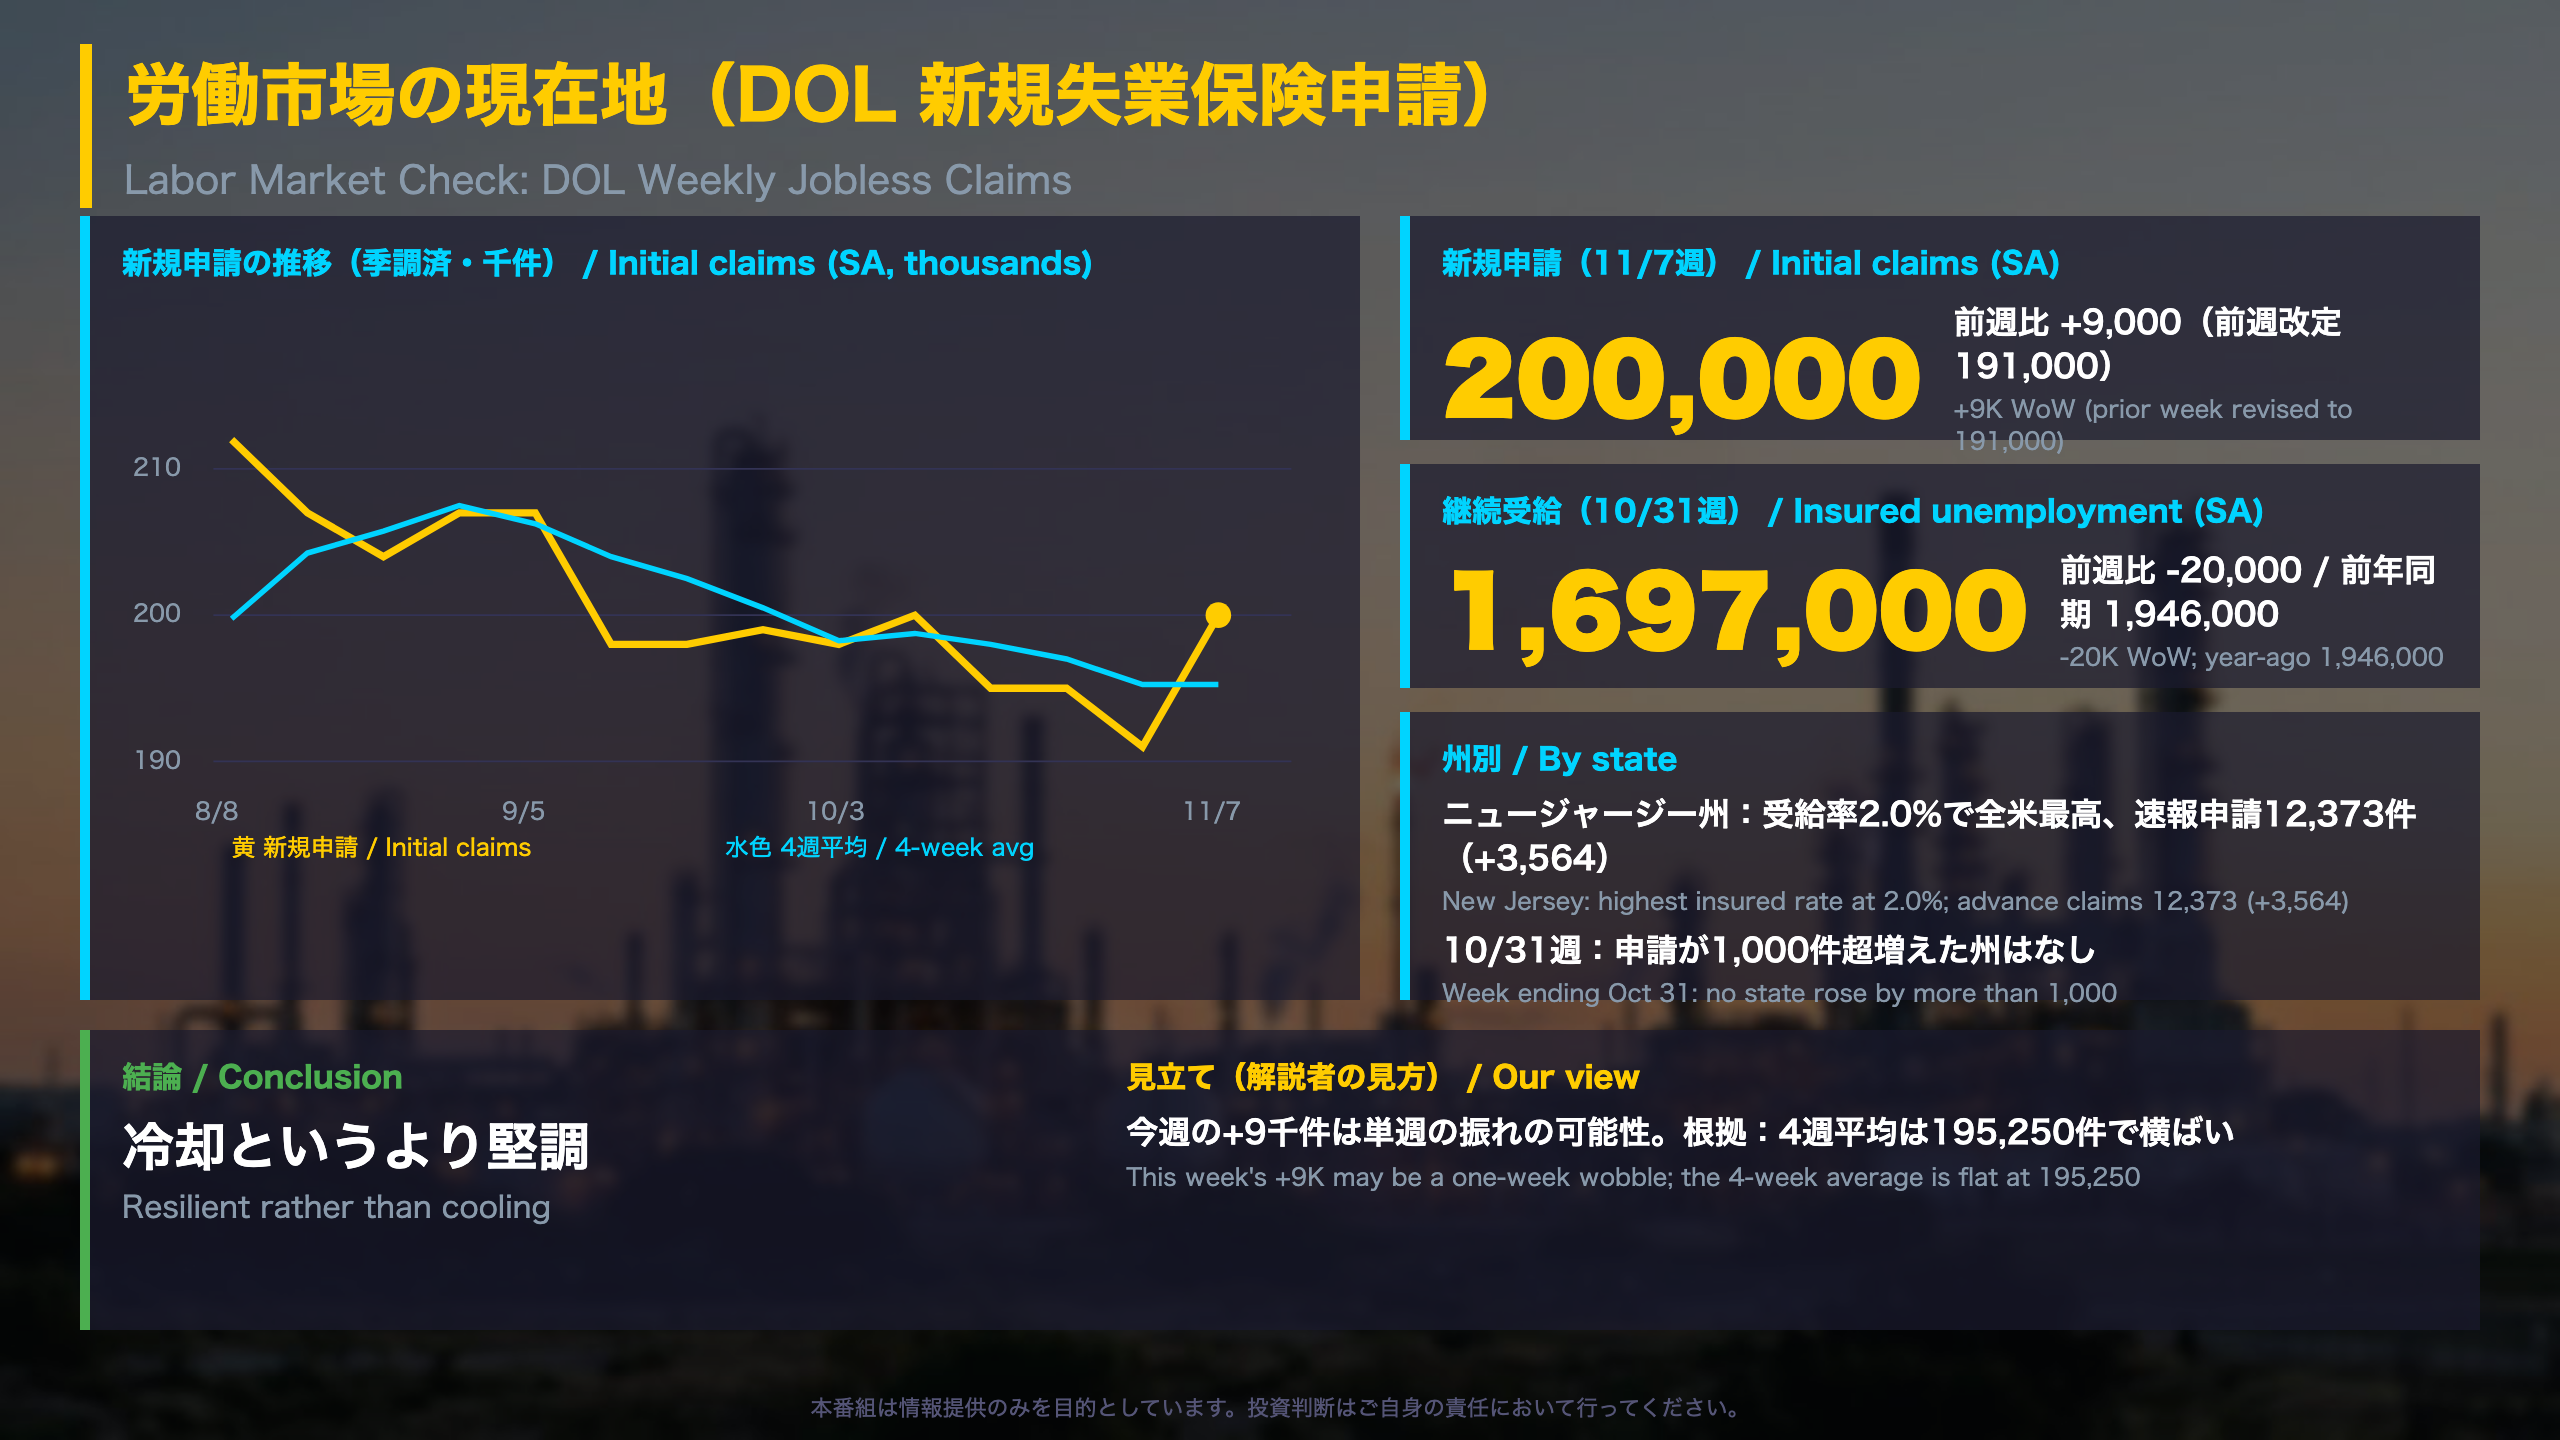
📈 Initial jobless claims were 200,000, up 9,000 on the week; the 4-week average of 195,250 was unchanged.
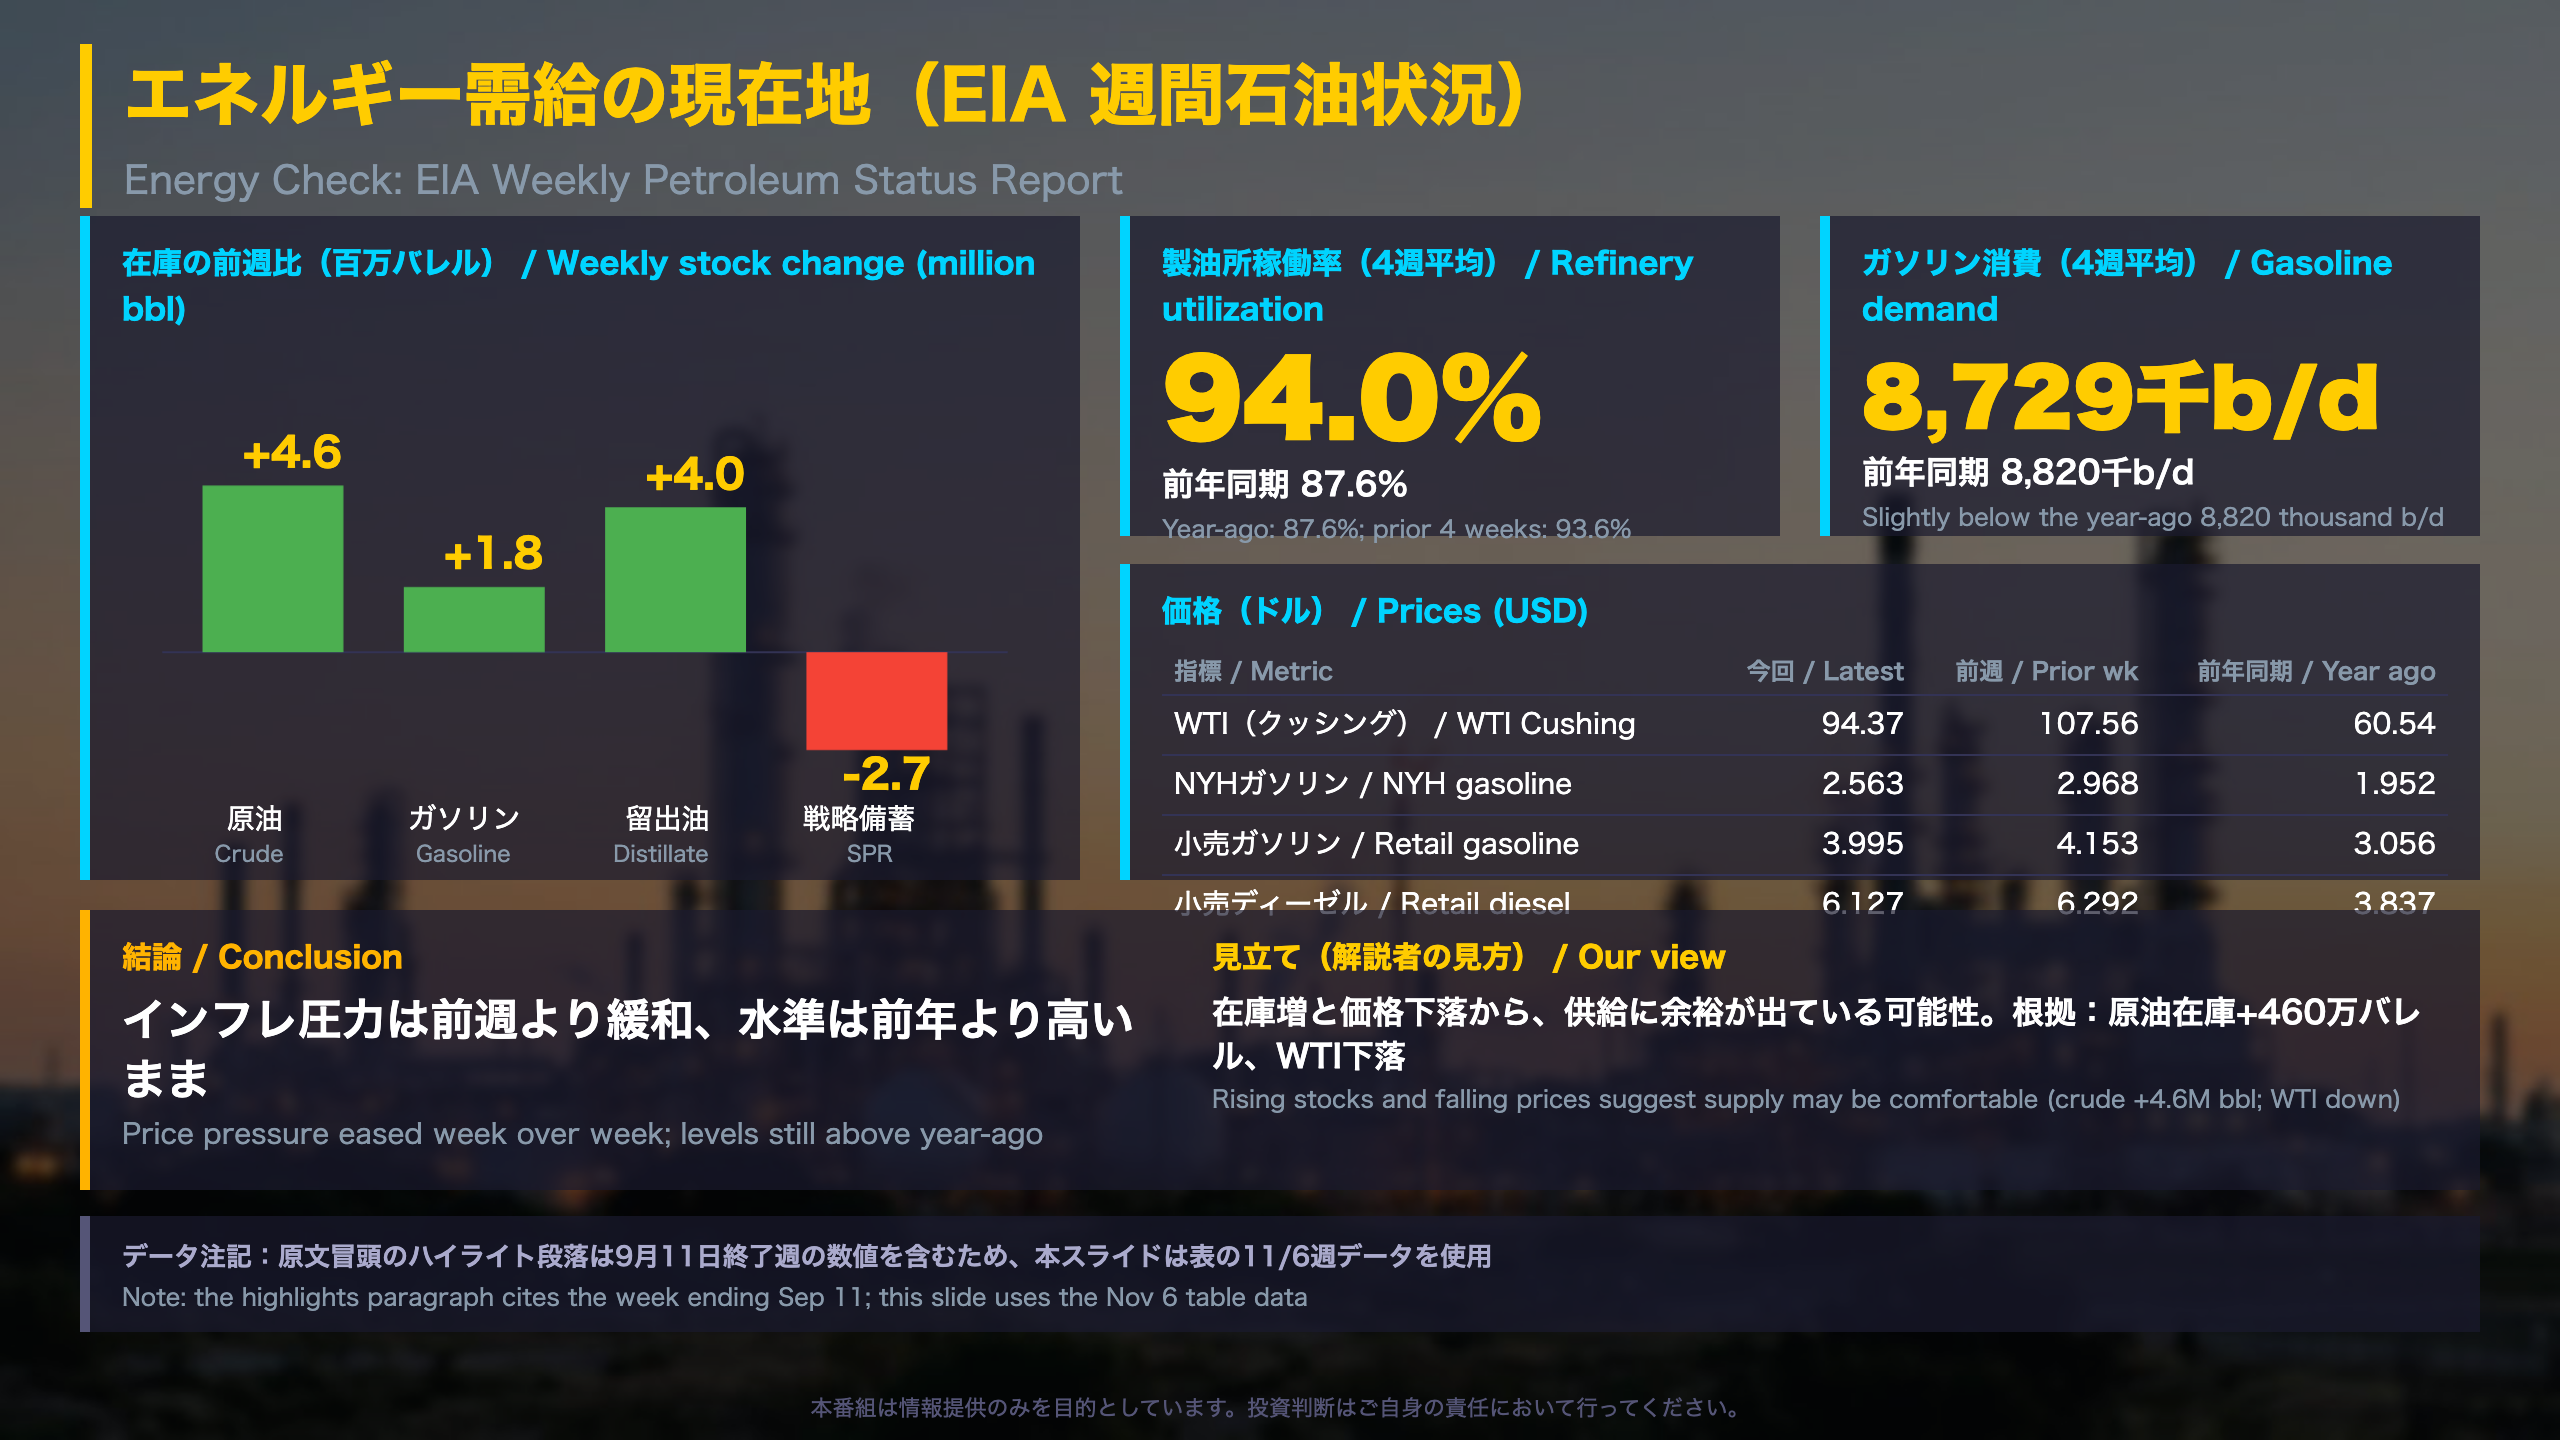
📉 EIA data show commercial crude stocks up 4.6 million barrels, while WTI fell from $107.56 to $94.37. Retail gasoline is still above its year-ago level.
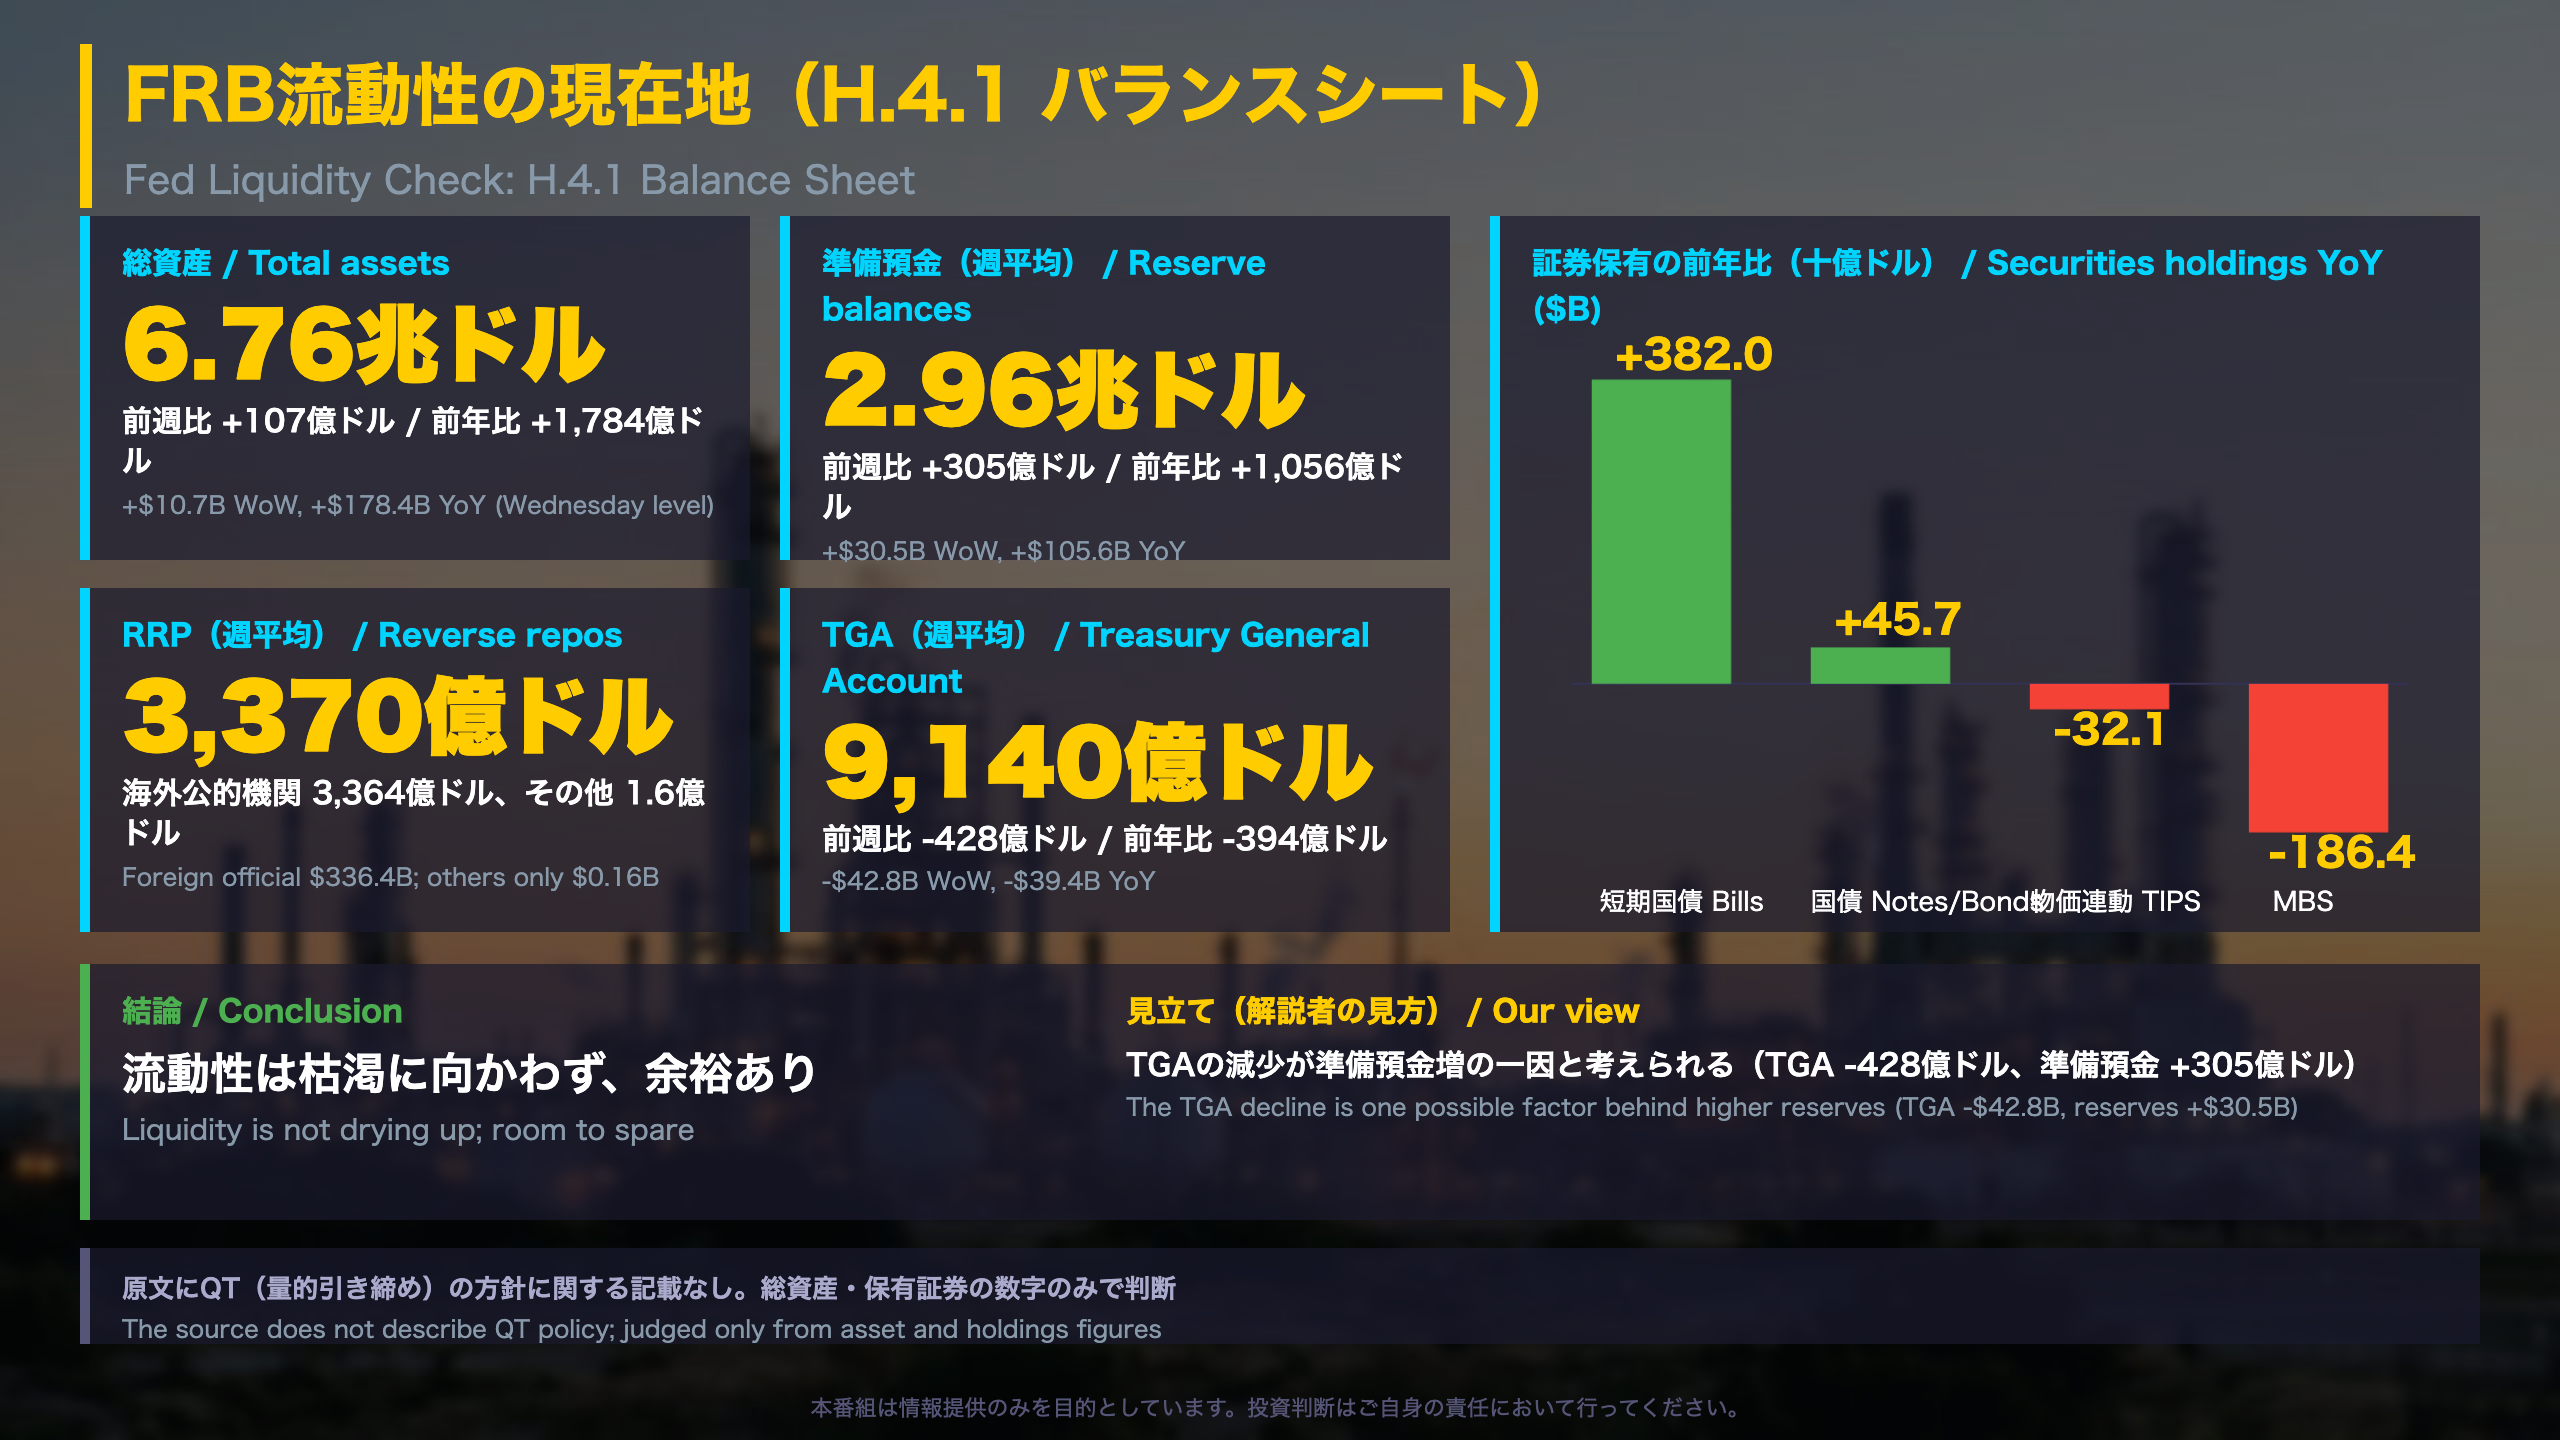
💡 Fed reserve balances averaged about $2.96 trillion, above a year earlier, so liquidity is not drying up.
⚠️ One week’s rise in claims may be noise and needs confirming. This is an explainer based on official releases, not investment advice.
今週のアルティメット・サマリー
Three weekly gauges, one picture
This review combines three weekly US releases: the Department of Labor’s unemployment insurance claims report, the Energy Information Administration’s Weekly Petroleum Status Report, and the Federal Reserve’s H.4.1 statement of its balance sheet. Unlike monthly data, they update every week, which is why analysts use them to track turning points between larger reports such as nonfarm payrolls or CPI.
Key readings
- Jobless claims: 200,000 (seasonally adjusted), up 9,000 from a revised 191,000; the 4-week average of 195,250 was unchanged and below the 227,000 of a year ago.
- Crude inventories: 414.4 million barrels excluding the Strategic Petroleum Reserve, up 4.6 million from the prior week and below the year-ago 427.6 million.
- Reserve balances: about $2.96 trillion on a weekly-average basis, $105.6 billion above a year earlier.
Why it matters internationally
US claims are often compared with Japan’s job-to-applicant ratio as a high-frequency read on labor tightness, although the two measure different things: claims count layoffs, while Japan’s ratio compares vacancies with job seekers. The H.4.1 is the US counterpart of the Bank of Japan’s balance sheet and shows how much cash sits in the banking system.
Balanced reading
The constructive view is that claims and continuing claims sit below year-ago levels while reserves are ample. The cautious view is that retail gasoline of $3.995 is still well above $3.056 a year ago and that one week of data can mislead. The releases also cover slightly different weeks, so cross-indicator conclusions should be drawn carefully.
労働市場の現在地(DOL 新規失業保険申請)
What the Labor Department measures
Initial claims count new filings for state unemployment insurance and are treated as a leading indicator of layoffs. Continued claims, or insured unemployment, count people still receiving benefits and tend to move with the cycle rather than ahead of it. The Department of Labor itself cautions that the weekly series is ‘difficult to seasonally adjust’ and ‘subject to some volatility’.
This week’s numbers
- Initial claims (SA): 200,000, up 9,000 from a revised 191,000; the 4-week average of 195,250 is unchanged.
- Unadjusted claims: 206,982, up 16.2% on the week versus the 11.0% rise that seasonal factors expected, but below the 238,729 of a year ago.
- Insured unemployment (SA): 1,697,000, down 20,000; the insured unemployment rate is 1.1%, versus 1.3% a year ago.
- Extended Benefits: no state triggered ‘on’.
State detail
In the week ending October 31, claims rose most in Illinois (+728), Indiana (+655) and Washington (+647) and fell most in New York (-1,524) and Texas (-1,481). Advance figures for November 7 show New Jersey at 12,373 (+3,564) and Missouri up 3,029, but advance state data are not directly comparable with earlier weeks. Federal employee claims were 585 versus 7,483 a year earlier.
Two readings
The constructive reading is that both claims and continuing claims are below year-ago levels. The cautious reading is that the unadjusted rise beat the seasonal expectation and a few states posted large advance increases. Because this is a single week, we treat the move as possible noise rather than a trend change.
Comparison
The US series is a high-frequency complement to the monthly payrolls report; Japan has no direct weekly equivalent.
エネルギー需給の現在地(EIA 週間石油状況)
About the EIA report
The Energy Information Administration, part of the US Department of Energy, publishes the Weekly Petroleum Status Report on crude and product inventories, refinery activity and demand. Refinery utilization and ‘product supplied’ (a proxy for consumption) are the two lines investors most often use to judge how much price pressure is demand-led versus supply-led.
A note on the source
The highlights paragraph in the document refers to the week ending September 11 (WTI at $101.27), whereas the tables cover the week ending November 6. This summary uses the November tables only.
Key figures
- Crude stocks (ex-SPR): 414.4 million barrels, up from 409.8 million and below 427.6 million a year ago.
- Gasoline / distillate stocks: 210.8 / 103.3 million barrels, both up on the week.
- Strategic Petroleum Reserve: 279.5 million barrels, down from 282.2 million and far below 410.4 million a year earlier.
- Refinery utilization (4-week): 94.0% versus 87.6% a year ago.
- Prices: WTI $94.37 (prior week $107.56, year-ago $60.54); retail regular gasoline $3.995 (year-ago $3.056).
Demand and trade
Four-week gasoline product supplied was 8,729 thousand b/d, slightly below the 8,820 of a year earlier, while distillate demand of 3,947 was above 3,789. Net crude imports rose to 2,445 thousand b/d from 2,003, which may help explain the inventory build.
Balanced reading
Falling crude prices and slightly softer gasoline demand point to easing price pressure week over week. But retail prices remain well above a year ago, so the level of energy costs is still a consideration for headline inflation. As the US CPI energy component is built from retail prices, the retail gasoline trend is the number to watch.
FRB流動性の現在地(H.4.1 バランスシート)
What the H.4.1 shows
The Federal Reserve’s H.4.1 release, ‘Factors Affecting Reserve Balances’, is the weekly statement of the Fed’s balance sheet. It lists what supplies reserve funds (securities, loans) and what absorbs them (currency, reverse repos, the Treasury General Account, or TGA). It is the US counterpart of the Bank of Japan’s balance sheet, and analysts use it to gauge how much cash is in the banking system.
Key figures (weekly averages, $ millions)
- Reserve balances: 2,960,603, up 30,515 on the week and 105,573 on the year.
- Reverse repos: 336,519, nearly flat; foreign official and international accounts hold 336,357, while ‘others’ hold just 162.
- TGA: 914,370, down 42,805 on the week and 39,446 on the year.
- Securities held outright: up 203,947 year over year; Treasury bills +382,036, nominal notes and bonds +45,709, TIPS -32,060, MBS -186,441.
Is quantitative tightening visible?
Not in the totals: total assets of $6.76 trillion were up $10.7 billion on the week and $178.4 billion on the year. The mix is shifting from MBS toward bills, but the document does not describe the policy rationale, so we avoid labeling it.
Balanced reading
The constructive reading is that reserves are above a year ago and domestic reverse-repo use is negligible, which suggests no acute shortage of cash. The cautious reading is that reserves move with the TGA, so a rebuild in the Treasury’s account would drain reserves. In Japan, similar tracking applies to the BOJ current account balances.
Housekeeping
The page notes that the ‘Build Your Package’ feature of the Data Download Program was being removed in the week of November 9, with data available via FRED.
ストラテジスト総括:3指標の連関と来週の注目点
How the three indicators fit together
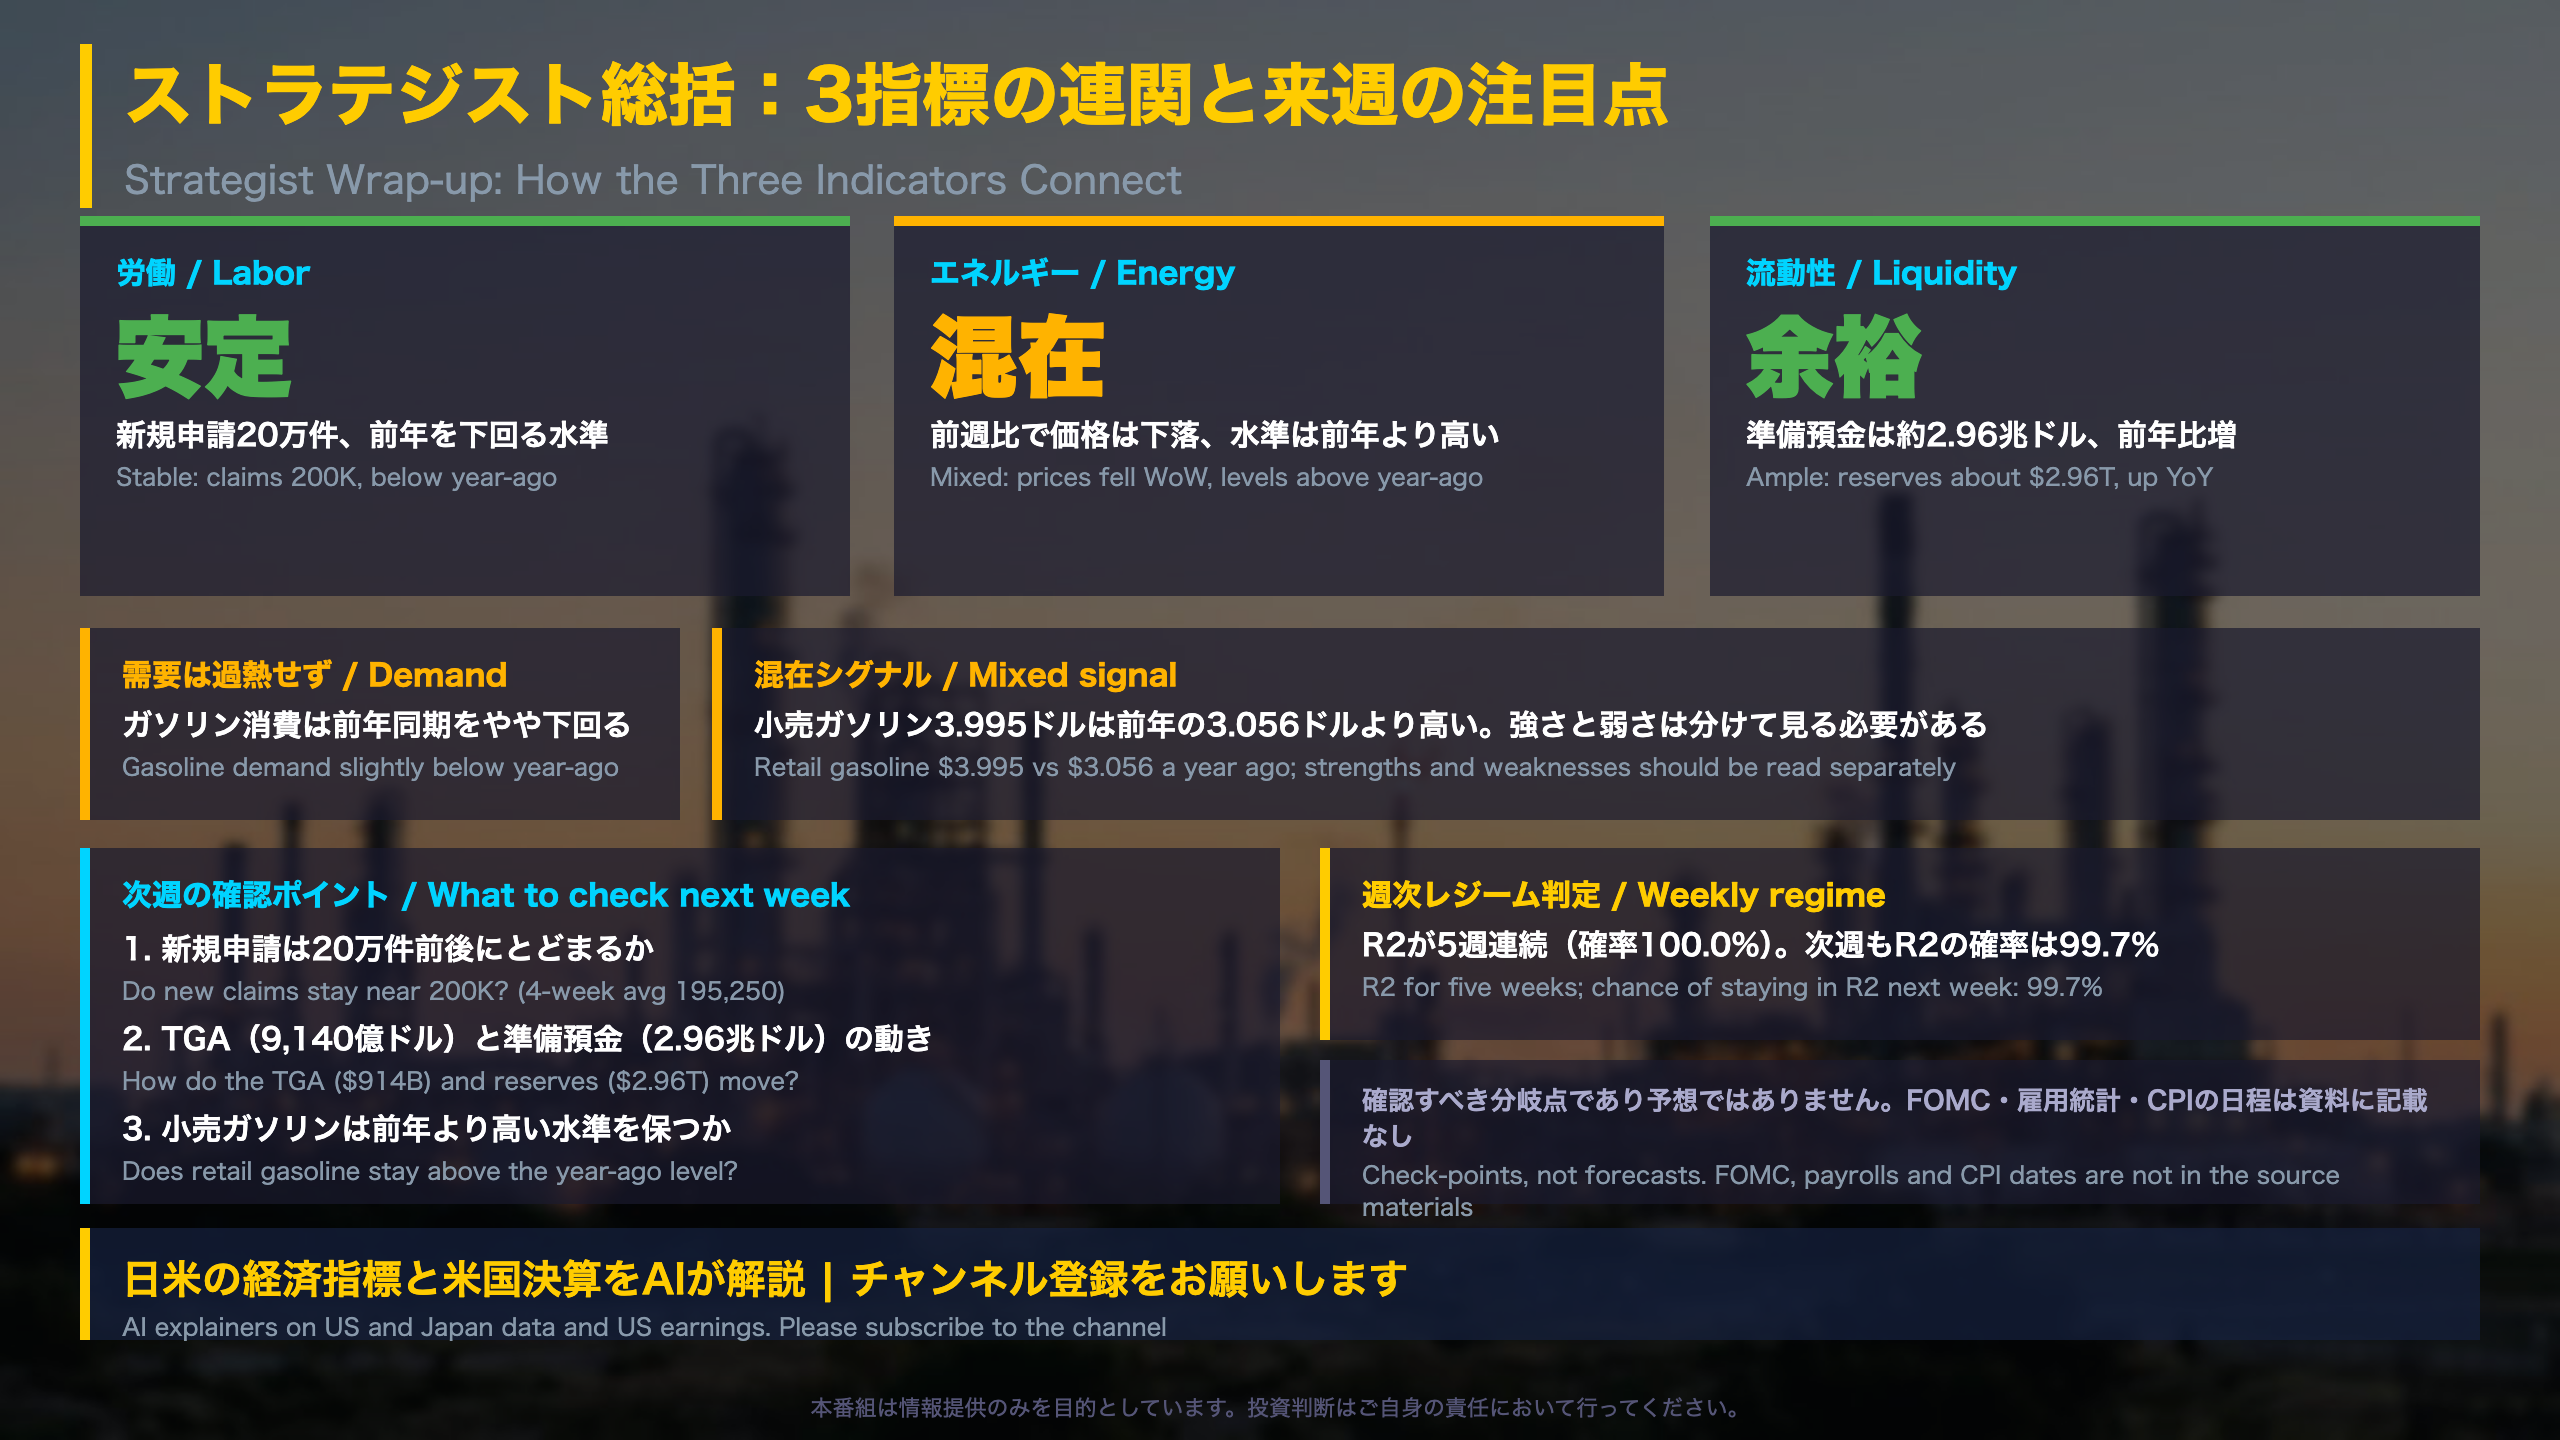
Labor, energy and liquidity point in broadly the same calm direction this week, with one mixed signal: retail gasoline remains above its year-ago level.
| Area | Signal | Strength / caveat |
|---|---|---|
| Labor | Stable at a low level | Below year-ago, but +9K in a single week |
| Energy | Prices fell week over week | Levels above year-ago |
| Liquidity | Reserves above year-ago | Sensitive to TGA moves |
Our model’s regime read
The channel’s weekly hidden Markov model classifies the latest observation (November 27) as regime R2 with 100.0% probability. It has been R2 for five consecutive weeks, the distance to the regime centroid is 1.7986 (unchanged), and the model puts the chance of staying in R2 next week at 99.7%. A smaller centroid distance means conditions are closer to the regime’s typical state. Four extended indicators show z-scores above 2.0, including the Treasury General Account (957,175 vs a regime centroid of 374,329; z=2.21) and the JOLTS quits rate (2.1; z=2.02). The average hourly earnings series is excluded because a unit mismatch is suspected.
Balanced reading
The constructive view is that claims, continuing claims and reserves are all favorable against year-ago comparisons. The cautious view is that energy price levels remain elevated and every figure here is a single weekly reading. Neither view is a forecast.
What to check next
- Whether claims stay near 200,000 and the 4-week average near 195,250.
- Whether retail gasoline stays above the year-ago $3.056 level.
- How the TGA and reserve balances move together.
The source materials do not list dates for the FOMC, payrolls or CPI; check each agency’s release calendar. For readers following Japan, the same weekly framework can be paired with the BOJ’s data on current account balances.
Disclaimer: This article is for informational purposes only. All investment decisions are made solely at your own risk.